Fact Sheet United States Geological Survey An Overview of the Stream-Gaging Program The USGS provides maps, reports, and information to help others meet their needs to manage, develop, and protect America's water, energy, mineral, and land resources. We help find natural resources needed to build tomorrow, and supply scientific understanding needed to help minimize or mitigate the effects of natural hazards and environmental damage caused by human activities. The results of our efforts touch the daily lives of almost every American. Introduction The growth and development of the United States has been dependent on the availability of water resources. As the population grew during the late 1800's, people moved west into more arid regions of the country where the flow of rivers and streams was much less dependable than in the humid East. The necessity of reliable water supplies led to the need for streamflow data with which to design storage and distribution facilities. In 1889, the first stream-gaging station oper- ated in the United States by the U.S. Geo- logical Survey (USGS) was established on the Rio Grande near Embudo, New Mexico. The establishment of this early station was an outgrowth of efforts to train individuals to measure the flow of rivers and streams and to define standard stream-gaging procedures. As the need for streamflow data increased, the stream- gaging program operated by the USGS has grown to include, in 1994, 7,292 con- tinuous-record stream-gaging stations (herein referred to as "stations") in the United States, Puerto Rico, and the Trust Territory of the Pacific Islands (fig. 1). More than 90 percent of these stations are operated with at least partial support from other Federal, State, and local agencies. The stream-gaging program of the USGS does not represent a single "network" of stations, but is an aggregation of net- works and individual streamflow stations that had been established for various pur- poses. Data from the 7,292 active stations, as well as from discontinued stations, are available through the USGS's National Water Data Storage and Retrieval System (WATSTORE) that holds mean daily-dis- charge data for about 18,500 locations and more than 400,000 station-years of record, or more than 146 million individual mean daily-discharge values. Additional data are added to the data base each year. The stream-discharge data base is an ever-grow- ing resource for water-resources planning and design, hydrologic research, and opera- tion of water-resources projects. Funding the Program Just as the network of stations repre- sents an aggregation, so does the program funding. Operating funds for individual stations in the program may come from a blend of Federal funds appropriated to the USGS, funds from State and local agen- cies, and funds appropriated to other Fed- eral agencies. More than 50 percent of the 7,292 stations operated in 1994 by the USGS are funded through the USGS Fed- 600 400 III Inllll.llllllllli. .Hi ll 5 *" ' i > 2^ D.U.OW 5 STATE OR OTHER POSSESSION Figure 1 . Number of stations operated by the U.S. Geological Survey in 1994, by State or possession. eral-State Cooperative Program (fig. 2). Under that program, the USGS provides up to 50 percent of the funds, and the State or local agency provides the remainder. Presently, more than 600 State and local agencies provide funds for the stream-gag- ing program. Other stations in the program are operated by the USGS and funded by other Federal agencies, such as the U.S. Army Corps of Engineers (COE) and the Bureau of Reclamation (BOR), to provide those agencies with the hydrologic data needed for planning and operating water- resources projects. Additionally, some of the stations are funded by the USGS to support national programs of water- resources investigations; to collect data required by court decree, treaty, or com- pact; and to conduct hydrologic research. The USGS provides full support for fewer than 10 percent of the stations that it oper- ates. Many of the stations supported prima- rily by State, local, or other Federal agency funds are critically important to USGS- funded programs such as the National Water Quality Assessment Program. Uses of Streamflow Data The USGS stream-gaging program pro- vides hydrologic information needed to help define, use, and manage the Nation's water SOURCES OF FUNDS COOP Combination of USGS and non-Federal agency OFA Other Federal agencies USGS USGS appropriations COMBINED A combination of any two or more from OFA, USGS, and COOP Total stations in 1994 is 7,292 Figure 2. Number of stations and sources of funds, 1994 fiscal year.
Transcript
Fact Sheet
United States Geological SurveyAn Overview of the Stream-Gaging Program
The USGS provides maps, reports, and information to help others meet their needs to manage, develop, and protect America's water, energy, mineral, and land resources. We help find natural resources needed to build tomorrow, and supply scientific understanding needed to help minimize or mitigate the effects of natural hazards and environmental damage caused by human activities. The results of our efforts touch the daily lives of almost every American.
Introduction
The growth and development of the United States has been dependent on the availability of water resources. As the population grew during the late 1800's, people moved west into more arid regions of the country where the flow of rivers and streams was much less dependable than in the humid East. The necessity of reliable water supplies led to the need for streamflow data with which to design storage and distribution facilities. In 1889, the first stream-gaging station oper ated in the United States by the U.S. Geo logical Survey (USGS) was established on the Rio Grande near Embudo, New Mexico. The establishment of this early station was an outgrowth of efforts to train individuals to measure the flow of rivers and streams and to define standard stream-gaging procedures. As the need for streamflow data increased, the stream- gaging program operated by the USGS has grown to include, in 1994, 7,292 con tinuous-record stream-gaging stations (herein referred to as "stations") in the United States, Puerto Rico, and the Trust Territory of the Pacific Islands (fig. 1). More than 90 percent of these stations are operated with at least partial support from other Federal, State, and local agencies.
The stream-gaging program of the USGS does not represent a single "network" of stations, but is an aggregation of net works and individual streamflow stations that had been established for various pur poses. Data from the 7,292 active stations, as well as from discontinued stations, are available through the USGS's National Water Data Storage and Retrieval System (WATSTORE) that holds mean daily-dis charge data for about 18,500 locations and more than 400,000 station-years of record, or more than 146 million individual mean daily-discharge values. Additional data are added to the data base each year. The stream-discharge data base is an ever-grow ing resource for water-resources planning and design, hydrologic research, and opera tion of water-resources projects.
Funding the Program
Just as the network of stations repre sents an aggregation, so does the program funding. Operating funds for individual stations in the program may come from a blend of Federal funds appropriated to the USGS, funds from State and local agen cies, and funds appropriated to other Fed eral agencies. More than 50 percent of the 7,292 stations operated in 1994 by the USGS are funded through the USGS Fed-
600
400
III Inllll.llllllllli. .Hi ll5 *" '
i > 2^ D.U.OW 5
STATE OR OTHER POSSESSION
Figure 1 . Number of stations operated by the U.S. Geological Survey in 1994, by State or possession.
eral-State Cooperative Program (fig. 2). Under that program, the USGS provides up to 50 percent of the funds, and the State or local agency provides the remainder. Presently, more than 600 State and local agencies provide funds for the stream-gag ing program. Other stations in the program are operated by the USGS and funded by other Federal agencies, such as the U.S. Army Corps of Engineers (COE) and the Bureau of Reclamation (BOR), to provide those agencies with the hydrologic data needed for planning and operating water- resources projects. Additionally, some of the stations are funded by the USGS to support national programs of water- resources investigations; to collect data required by court decree, treaty, or com pact; and to conduct hydrologic research. The USGS provides full support for fewer than 10 percent of the stations that it oper ates. Many of the stations supported prima rily by State, local, or other Federal agency funds are critically important to USGS- funded programs such as the National Water Quality Assessment Program.
Uses of Streamflow Data
The USGS stream-gaging program pro vides hydrologic information needed to help define, use, and manage the Nation's water
SOURCES OF FUNDSCOOP Combination of USGS and non-Federal agencyOFA Other Federal agenciesUSGS USGS appropriationsCOMBINED A combination of any two or more from
OFA, USGS, and COOP
Total stations in 1994 is 7,292
Figure 2. Number of stations and sources of funds, 1994 fiscal year.
resources. The program provides a continu ous, well-documented, well-archived, unbi ased, and broad-based source of reliable and consistent water data. Because of the nationally consistent, prescribed standards by which the data are collected and proc essed, the data from individual stations are commonly used for purposes beyond the original purpose for an individual station. Those possible uses include, but are not limited to, the following:
Providing data for forecasting and managing floods
Characterizing current water-quality conditions
Delineating and managing flood plains Operating and designing multipurpose
reservoirs Setting permit requirements for dis
charge of treated wastewater Designing highway bridges and
culverts Monitoring compliance with minimum
flow requirements Scheduling power production Designing, operating, and maintaining
navigation and recreational facilities Allocating water for municipal, indus
trial, and irrigation uses Administering compacts or resolving
conflicts on interstate rivers Defining and apportioning the water
resources at our international borders Undertaking scientific studies of long-
term changes in the hydrologic cycle
Data for one or more of these purposes are needed at some point in time on virtu ally every stream in the country, and a data-collection system must be in place to provide the required information. The general objective of the stream-gaging program is to provide information on streamflow characteristics at any point on any stream. Streamflow data are needed for immediate decisionmaking and future planning and project design. Data, such as that needed to issue and update flood fore casts, are referred to as "data for current needs." Other data, such as that needed for the design of a future bridge or reser voir, are referred to as "data for future or long-term needs." Some data, of course, fit into both classifications; a station that supplies data for flood forecasting and also provides data to define long-term trends clearly fits both classifications.
Data for Current Needs
Streamflow data are needed at many sites on a daily basis for forecasting flow
extremes, water-management decisions, assessing current water availability, man aging water quality, and meeting legal requirements. These activities require streamflow information at a given loca tion for a specified time or period. These needs generally are best satisfied by oper ating a station to produce a continuous (or daily) record of flow.
Data from about 4,200 of the 7,292 stations are telemetered by an earth-satel lite-based communications system that enables the data to be available in real- time for the operation of water-resources projects by many agencies and for flood forecasting by the National Weather Ser vice (NWS). The NWS uses data from USGS stations in concert with its own precipitation data to forecast river stages and flow conditions on large rivers and their associated tributaries.
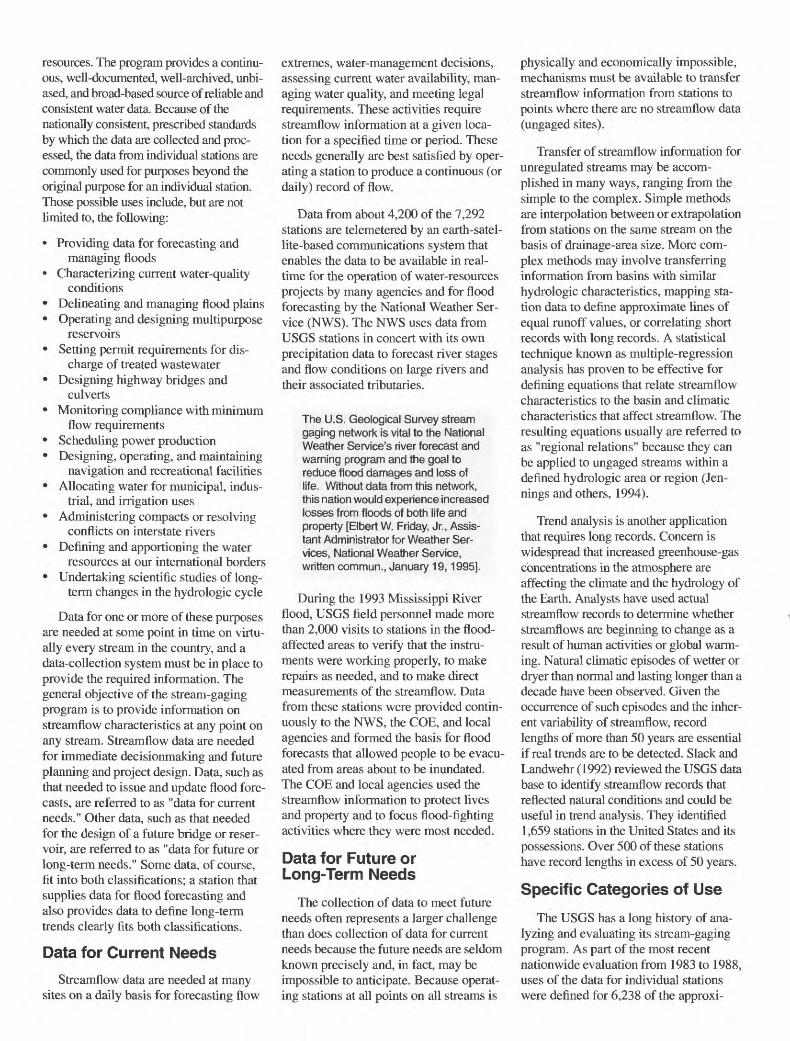
The U.S. Geological Survey stream gaging network is vital to the National Weather Service's river forecast and warning program and the goal to reduce flood damages and loss of life. Without data from this network, this nation would experience increased losses from floods of both life and property [Elbert W. Friday, Jr., Assis tant Administrator for Weather Ser vices, National Weather Service, written commun., January 19,1995].
During the 1993 Mississippi River flood, USGS field personnel made more than 2,000 visits to stations in the flood- affected areas to verify that the instru ments were working properly, to make repairs as needed, and to make direct measurements of the streamflow. Data from these stations were provided contin uously to the NWS, the COE, and local agencies and formed the basis for flood forecasts that allowed people to be evacu ated from areas about to be inundated. The COE and local agencies used the streamflow information to protect lives and property and to focus flood-fighting activities where they were most needed.
Data for Future or Long-Term Needs
The collection of data to meet future needs often represents a larger challenge than does collection of data for current needs because the future needs are seldom known precisely and, in fact, may be impossible to anticipate. Because operat ing stations at all points on all streams is
physically and economically impossible, mechanisms must be available to transfer streamflow information from stations to points where there are no streamflow data (ungaged sites).
Transfer of streamflow information for unregulated streams may be accom plished in many ways, ranging from the simple to the complex. Simple methods are interpolation between or extrapolation from stations on the same stream on the basis of drainage-area size. More com plex methods may involve transferring information from basins with similar hydrologic characteristics, mapping sta tion data to define approximate lines of equal runoff values, or correlating short records with long records. A statistical technique known as multiple-regression analysis has proven to be effective for defining equations that relate streamflow characteristics to the basin and climatic characteristics that affect streamflow. The resulting equations usually are referred to as "regional relations" because they can be applied to ungaged streams within a defined hydrologic area or region (Jen- nings and others, 1994).
Trend analysis is another application that requires long records. Concern is widespread that increased greenhouse-gas concentrations in the atmosphere are affecting the climate and the hydrology of the Earth. Analysts have used actual streamflow records to determine whether streamflows are beginning to change as a result of human activities or global warm ing. Natural climatic episodes of wetter or dryer than normal and lasting longer than a decade have been observed. Given the occurrence of such episodes and the inher ent variability of streamflow, record lengths of more than 50 years are essential if real trends are to be detected. Slack and Landwehr (1992) reviewed the USGS data base to identify streamflow records that reflected natural conditions and could be useful in trend analysis. They identified 1,659 stations in the United States and its possessions. Over 500 of these stations have record lengths in excess of 50 years.
Specific Categories of Use
The USGS has a long history of ana lyzing and evaluating its stream-gaging program. As part of the most recent nationwide evaluation from 1983 to 1988, uses of the data for individual stations were defined for 6,238 of the approxi-
mately 7,000 stations then operated by USGS (Thomas and Wahl, 1993). Indi vidual stations were identified as belong ing to one or more of nine categories, which are based on the principal uses made of the data.
Hydrologic systems. One of the more common uses of streamflow data is to account for and monitor the flow through a river basin or to define the gen eral hydrologic conditions in the basin. Data from about 4,200 active stations are used to understand and evaluate the inter actions of ground- and surface-water resources and to monitor diversions and return flows. At the State and interstate level, many of the stations serve a key role in the process of allocating and regu lating water rights.
I am writing you on behalf of the Mis souri River Basin Association, a coali tion of eight states and twenty-eight Indian Tribes in the Missouri basin. For years, we have been working closely with the federal agencies that have jurisdiction in the basin to improve management of the basin's water resources. As you know from your years with the USGS, good water man agement depends upon good data. An important source of good data has been USGS's Coop Program [Excerpt of letter from J. Edward Brown, Presi dent, Missouri River Basin Association to Gordon P. Eaton, Director, U.S. Geo logical Survey, February 14,1994].
Regional hydrology. Stations supplying data that are largely unaffected by manmade storage or diversion furnish much of the data needed for future or long-term needs. Data from about 3,800 active stations can be used to develop regional relations for esti mating streamflow characteristics at ungaged sites or sites where only small amounts of streamflow data are available.
Project operation. Data from stations in this classification are used by water managers in maki rig daily operational decisions. For example, data from about 2,900 active stations are used by the COE, the BOR, and others to operate more than 2,000 flood control, navigation, and water- supply reservoirs.
Hydrologic forecasting. Data from sta tions so classified provide information for flood and water-supply forecasting. These stations play a key role in efforts by Federal, State, and local agencies to protect the lives and welfare of the public. More than 3,000
of the stations operated by the USGS are used in the NWS's flood-forecasting system.
Water-quality monitoring. The evalua tion of water quality in rivers, lakes, reser-
and estuaries depends on having data; chemistry of the water and the
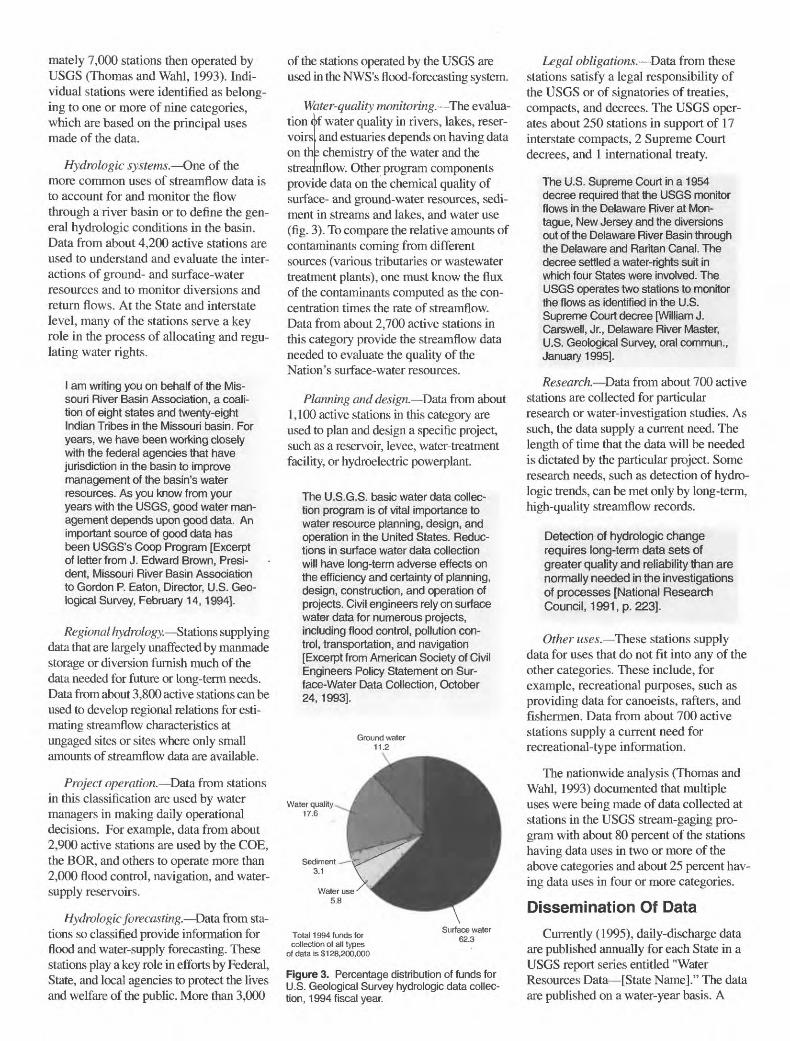
voirs onthstreamflow. Other program components provide data on the chemical quality of surface- and ground-water resources, sedi ment in streams and lakes, and water use (fig. 3). To compare the relative amounts of contaminants coming from different sources (various tributaries or wastewater treatment plants), one must know the flux of the contaminants computed as the con centration times the rate of streamflow. Data from about 2,700 active stations in this category provide the streamflow data needed to evaluate the quality of the Nation's surface-water resources.
Planning and design. Data from about 1,100 active stations in this category are used to plan and design a specific project, such as a reservoir, levee, water-treatment facility, or hydroelectric powerplant.
The U.S.G.S. basic water data collec tion program is of vital importance to water resource planning, design, and operation in the United States. Reduc tions in surface water data collection will have long-term adverse effects on the efficiency and certainty of planning, design, construction, and operation of projects. Civil engineers rely on surface water data for numerous projects, including flood control, pollution con trol, transportation, and navigation [Excerpt from American Society of Civil Engineers Policy Statement on Sur face-Water Data Collection, October 24,1993].
Water quality.__ 17.6
Total 1994 funds forcollection of all types
of data is $128,200,000
Figure 3. Percentage distribution of funds for U.S. Geological Survey hydrologic data collec tion, 1994 fiscal year.
Legal obligations. Data from these stations satisfy a legal responsibility of the USGS or of signatories of treaties, compacts, and decrees. The USGS oper ates about 250 stations in support of 17 interstate compacts, 2 Supreme Court decrees, and 1 international treaty.
The U.S. Supreme Court in a 1954 decree required that the USGS monitor flows in the Delaware River at Mon tague, New Jersey and the diversions out of the Delaware River Basin through the Delaware and Raritan Canal. The decree settled a water-rights suit in which four States were involved. The USGS operates two stations to monitor the flows as identified in the U.S. Supreme Court decree [William J. Carswell, Jr., Delaware River Master, U.S. Geological Survey, oral commun., January 1995].
Research. Data from about 700 active stations are collected for particular research or water-investigation studies. As such, the data supply a current need. The length of time that the data will be needed is dictated by the particular project. Some research needs, such as detection of hydro- logic trends, can be met only by long-term, high-quality streamflow records.
Detection of hydrologic change requires long-term data sets of greater quality and reliability than are normally needed in the investigations of processes [National Research Council, 1991, p. 223].
Other uses. These stations supply data for uses that do not fit into any of the other categories. These include, for example, recreational purposes, such as providing data for canoeists, rafters, and fishermen. Data from about 700 active stations supply a current need for recreational-type information.
The nationwide analysis (Thomas and Wahl, 1993) documented that multiple uses were being made of data collected at stations in the USGS stream-gaging pro gram with about 80 percent of the stations having data uses in two or more of the above categories and about 25 percent hav ing data uses in four or more categories.
Dissemination Of Data
Currently (1995), daily-discharge data are published annually for each State in a USGS report series entitled "Water Resources Data [State Name]." The data are published on a water-year basis. A
water year is the 12-month period of Octo ber 1 through September 30 and is desig nated by the calendar year in which it ends. Thus, the 1994 water year ends September 30, 1994. Because of the need for review of the completed computations, these reports generally are published from 6 months to 1 year after the end of the water year. Many streamflow data users must make operational decisions daily. For these users, streamflow records are computed and made available on a provisional basis.
Automated telemetry provides the data users with provisional stage and discharge data in a timeframe that meets water-man agement needs. This technology also per mits the USGS field offices to continuously monitor the operation of the hydrologic stations, time visits to stations to coincide with times of maximum need for data (such as during floods) and to service equipment at the stations. Currently, more than half of the 7,292 USGS stations are equipped with automated telemetry.
In addition to the published record, the data collected by the USGS are archived in the nationwide WATSTORE data base. The number of active stations in the WATSTORE data base with associated record lengths is given in figure 4 for each decade from 1900 to 1990. The data in figure 4 also include stations operated by other agencies (primarily State agencies) for which the data are reviewed, archived, and published by USGS. In 1990, data from about 400 stations were provided to the USGS by other agencies.
Beginning with the 1990 water year, Water Data Reports are also available on Compact Disk-Read Only Memory (CD-ROM). The Water Data Reports and the CD-ROM's are distributed to partici pating agencies and libraries; they also are available for sale by the USGS Earth Science Information Center, Denver, Col orado. Currently (1995), the USGS is
10,000
5,000
||1900 10 20 30 40 50 60 70 801990
YEAR
EXPLANATION
LENGTH OF RECORD
I Greater than or equal to 50 years
g Greater than 20 and less than 50 years
0 Less than or equal to 20 years
Figure 4. Number of stations in the U.S. Geo logical Survey data base, 1900-90.
developing procedures to allow access to streamflow data by means of Internet. Historical mean daily-discharge data for about 18,500 stations will soon be avail able through this source.
Final Comments
The USGS stream-gaging program provides data to many agencies and orga nizations involved in water-resources projects. USGS goals and objectives for ensuring the continued relevance of this vital program include the following:
Maintain a long-term and consistent nationwide data base
Maintain state-of-the-art recorders, sensors, and equipment for data col lection
Provide easy access to archived and realtime data
Maintain a skilled staff of hydrologists and hydrologic technicians for col lecting and computing the stream- flow records
The USGS continues to be committed to the collection and dissemination of high-quality streamflow data as a critical part of its overall mission of providing earth science information for the wise
management of the Nation's natural resources. The maintenance of a viable stream-gaging program is an integral part of managing these natural resources.
We believe that the U.S.G.S. basic water quantity data collection activities are: 1) essential, because the value of hydrologic data increases with both the length and continuity of the record; 2) the logical responsibility of the Fed eral Government because the States cannot possibly assume the support and leadership role of U.S.G.S. for interstate water systems; 3) cost-effec tive, because coordinated water data collection eliminates overlapping and duplicative efforts [Statements of Will iam J. Carroll, President-elect, Ameri can Society of Civil Engineers, before the Subcommittee on Interior and Related Agencies, Committee on Appropriations, U.S. House of Repre sentatives, March 10,1988].
References
Jennings, M.E., Thomas, W.O., Jr., and Riggs, H.C., 1994, Nationwide summary of U.S. Geological Survey regional regression equa tions for estimating magnitude and frequency of floods for ungaged sites, 1993: U.S. Geo logical Survey Water-Resources Investiga tions Report 94-4002,196 p.
National Research Council, 1991. Opportuni ties in the hydrologic sciences: Washing ton, D.C., National Academy Press, 348 p.
Slack, J.R., and Landwehr, J. M., 1992, Hydro- Climatic Data Network (HCDN) A U.S. Geological Survey streamflow data set for the United States for the study of climate fluctuations, 1874-1988: U.S. Geological Survey Open-File Report 92-129,193 p.
Thomas, W.O., Jr., and Wahl, K.L, 1993, Sum mary of the nationwide analysis of the cost effectiveness of the U.S. Geological Sur vey stream-gaging program (1983-88): U.S. Geological Survey Water Resources Investigations Report 93^168, 27 p.
Kenneth L. Wahl, Wilbert O. Thomas, Jr., and Robert M. Hirsch
For more information contact any of the following:
Chief Hydrologist 409 National Center Reston, Virginia 22092 (703) 648-5215
Office of Surface Water 415 National Center Reston, Virginia 22092 (703) 648-5301
Additional earth science information can be found by accessing the USGS "Home Page" on the World Wide Web at "http://www.usgs.gov", or by calling 1-800- H20-9000 (1-800-426-9000).
For more information on all USGS reports and products (including maps, images, and computerized data), call 1-800-USA-MAPS.
U.S. Department of the InteriorU.S. Geological SurveyFact Sheet FS-066-95