22
An Update on Gender Equity at the Medical University of South Carolina Ray Greenberg February 1, 2007
| Date post: | 29-Dec-2015 |
| Category: |
Documents |
| Upload: | alexia-sutton |
| View: | 215 times |
| Download: | 1 times |
An Update on Gender Equityat the
Medical University of South Carolina
Ray Greenberg
February 1, 2007

Gender Equity for Students
1
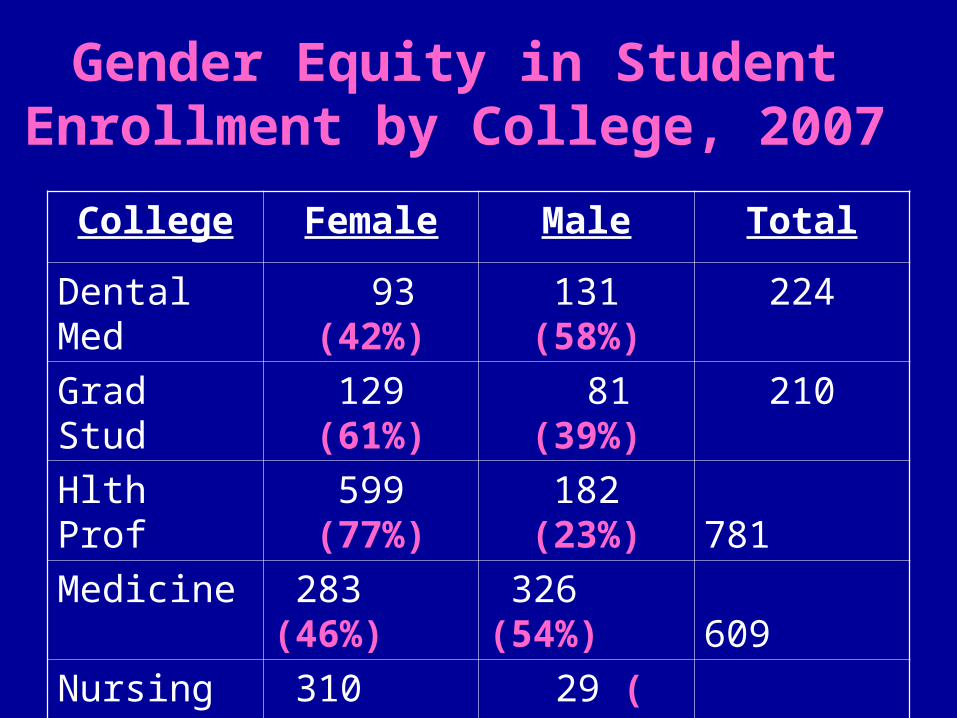
College Female Male Total
Dental Med 93 (42%) 131 (58%) 224
Grad Stud 129 (61%) 81 (39%) 210
Hlth Prof 599 (77%) 182 (23%) 781
Medicine 283 (46%) 326 (54%) 609
Nursing 310 (91%) 29 ( 9%) 339
Pharmacy 226 (71%) 93 (29%) 319
Gender Equity in Student Enrollment by College, 2007

Gender Equity in Application Process, Medicine and Dental Medicine, 2007
Female Male
Medicine
Applicants 790 (47%) 898 (53%)
Accepted 79 (45%) 98 (55%)
Enrolled 68 (47%) 78 (53%)
Dental Medicine
Applicants 298 (41%) 430 (59%)
Accepted 23 (41%) 33 (59%)
Enrolled 23 (41%) 33 (59%)3
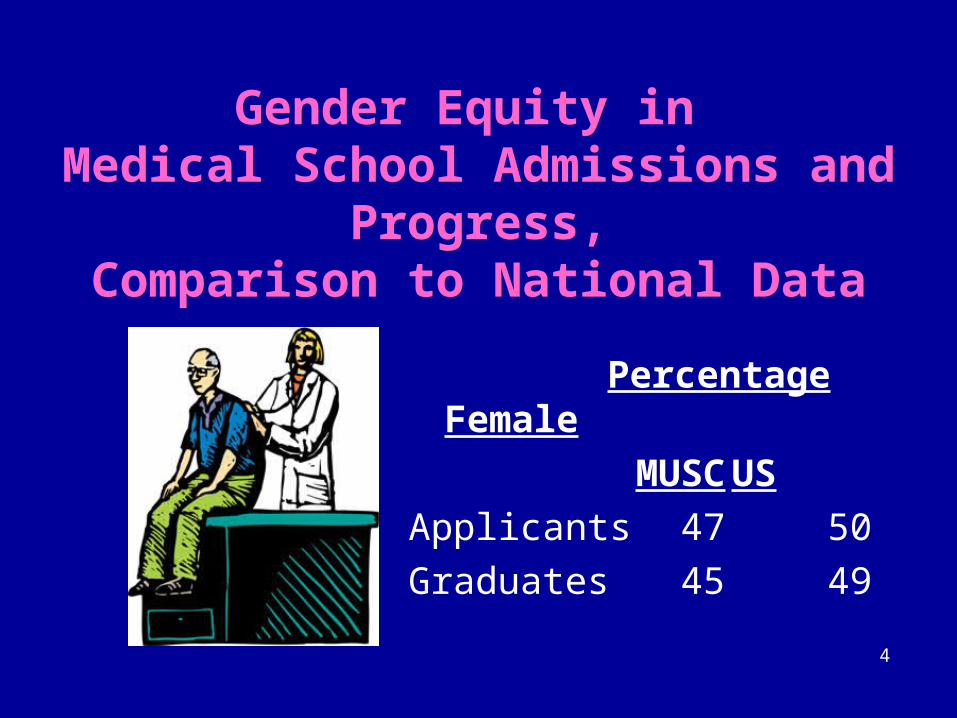
Gender Equity in Medical School Admissions and
Progress,Comparison to National Data
Percentage Female
MUSC US
Applicants 47 50
Graduates 45 49
4

Gender Equity in Student Enrollment
• For the Colleges of Medicine and Dental
Medicine, the percentagesof female students closely mirror the respective
applicant pools• For the College of Medicine, the female percentages of applicants and graduates slightly trailthe corresponding national percentages• Four of six colleges have
larger percentages offemale than male students
5

Gender Equity for Faculty
6

Gender Equity in Faculty Rank, 2006
Rank Female Male Professor 55 (18%) 254 (82%)
Assoc. Prof. 95 (37%) 167 (63%)
Asst. Prof 211 (45%) 253 (55%)
Instructor 92 (63%) 54 (37%)
7
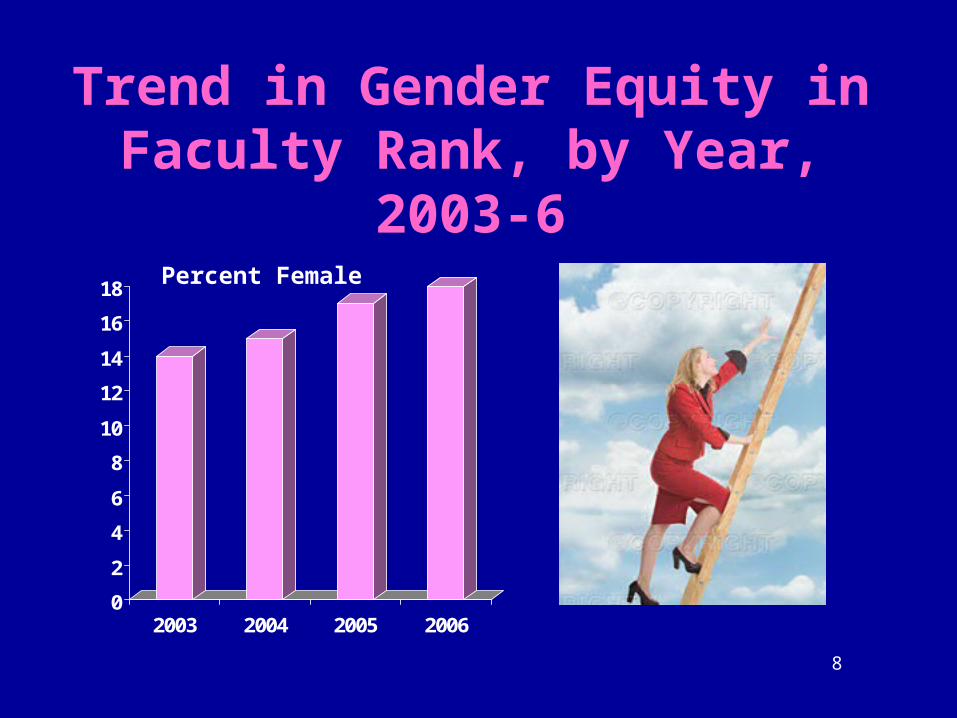
Trend in Gender Equity in Faculty Rank, by Year, 2003-6
Percent Female
0
2
4
6
8
10
12
14
16
18
2003 2004 2005 2006
8

Gender Equity in Medical School Faculty Status,
Comparison to National Data
Percentage Female
Rank MUSC US
Professor 15 16
Assoc. Prof. 30 28
All ranks 35 32
9

Gender Equity in Faculty Rank • Females tend to have
lower academic rank than their male counterparts• The percentage of professors who are female is slowly increasing over time• Comparison of COM
data to national data suggests that MUSC is at or slightly ahead of thepeer level of gender equity
10
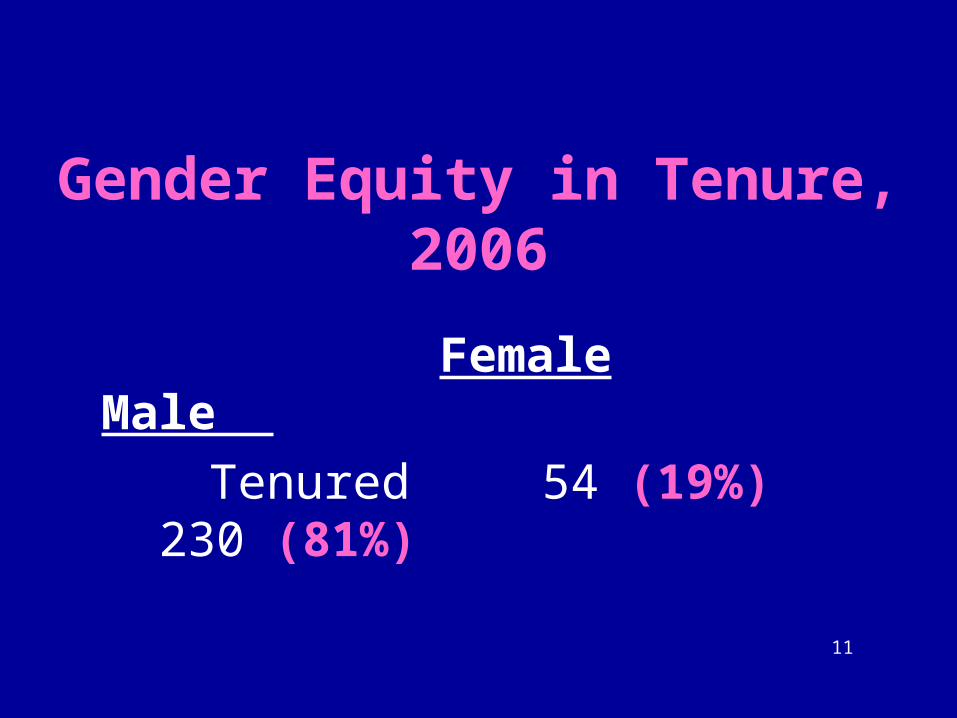
Gender Equity in Tenure, 2006
Female Male
Tenured 54 (19%) 230 (81%)
11

Trend in Gender Equity,Tenured Faculty by Year, 2003-6
0
50
100
150
200
250
300
2003 2004 2005 2006
Female
Male
12

Gender Equity in Tenure
• Not surprisingly, given the gender gap in
academic rank, females are less likely than their male counterparts to betenured
• The percentage of female tenured faculty is
increasing over time, largely because of a
decline in male tenuredfaculty
13

Faculty Equity in Compensation,Average Annual Salary by Rank, 2006
Female/ Female Male Male
Professor 124,069 127,916 0.97
Assoc. Prof. 88,115 92,287 0.95
Asst. Prof. 71,113 72,063 0.99
Instructor 71,958 79,910 0.90 *
* For College of Medicine, ratio is 1.29 14
Office of Gender Equity
15

Gender Equity
Complaints1996-2006
115 Consultations
68 Investigations 7 Not eligible40: Other action
3 Hearings
16

Gender Equity Formal Investigations
• 61 (90%) involved an accusation of sexual harassment• 7 (10%) involved an accusation of gender inequity• 65 (96%) of investigations resolved by mutually agreed settlement
• 3 (4%) of investigations could not be settled and led to a formal hearing
17

Types of Sexual Harassment Investigated
• Unwanted and persistent sexual advances• Inappropriate comments or
physical contact• Dual relationships with a supervisor• Downloading child pornography• Stalking
18
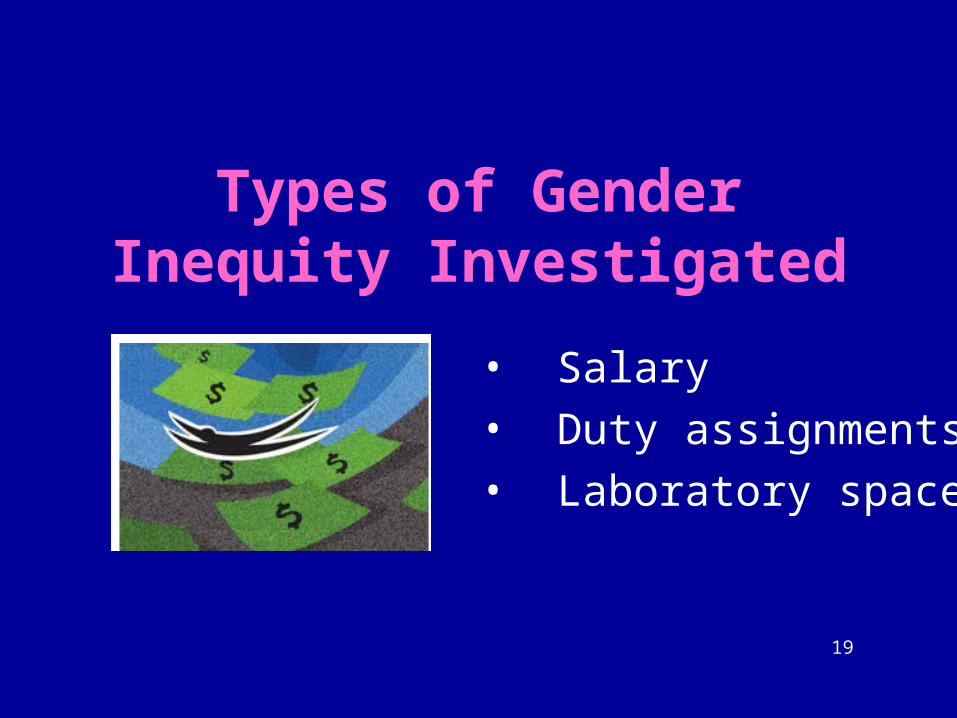
Types of Gender Inequity Investigated
• Salary
• Duty assignments
• Laboratory space
19
Gender Equity Office
• Office is active and well utilized• Office is able to help resolve almost
four out of ten complaints without a formal investigation
• About 7 formal investigations have been conducted each year
• Almost all formal investigations have led to a negotiated resolution
20

Acknowledgments
21
• Clip art downloaded from www.FotoSearch.com
• Presentation designed by Ms. Judy Holz


