25
Ana Belén Ibarz Pavón Peter Medawar Building for Pathogen Research University of Oxford United Kingdom Epidemiological and Population Structure Studies in Neisseria meningitidis
| Date post: | 30-Dec-2015 |
| Category: |
Documents |
| Upload: | clifton-brendan-newton |
| View: | 215 times |
| Download: | 1 times |

Ana Belén Ibarz PavónPeter Medawar Building for Pathogen Research
University of OxfordUnited Kingdom
Epidemiological and Population Structure Studies in Neisseria
meningitidis

•Life cicle of N. meningitidis, typing scheme and disease-associated genotypes.
•Meningococcal disease in the UK and the investigation into meningococcal carriage after the introduction of the serogroup C conjugate vaccine (MCC).
•Geographical, temporal and vaccine-induced population structure.
Summary

Life cycle of N.meningitidis
Invasion
Colonisation'Recovery'
Acquisition
Transmission
Release Disease

Multilocus Sequence Typing (MLST)
Sample isolation and DNA extraction.
7 numbers from 7 loci form an allelic profile or sequence type (ST)
2 3 4 3 8 4 6 ST-11 2 3 19 3 8 4 6 ST-50 7 3 4 3 8 4 6 ST-52 2 3 4 24 8 4 6 ST-67 2 3 4 150 8 4 40 ST-1270
abcZ adk aroE fumC gdh pdhC pgm
STs used to analyse population structure and assign isolates to clonal complexes.
ST-11
ST-50
ST-1270
ST-52
Each sequence is assigned an arbitrary allele number
PCR / sequencing of 7 loci (housekeeping genes).
AbcZ pgmpdhCgdhfumCaroEadk

Invasive potential and phenotypesEngland and Wales, 1999: 1664 disease, 2045 carriage isolates
Clonal complex Disease association OR B C W-135 Y
ST-8 14.7 [6.8 - 31.9] 11 69 0 0
ST-11 28.7 [20.1 - 41.1] 7 525 1 0
ST-22 0.23 [0.17 - 0.32] 5 0 42 1
ST-23 0.14 [0.07 - 0.28] 0 1 0 9
ST-32 2.1 [1.5 - 3.0] 80 1 0 0
ST-35 0.29 [0.16 - 0.53] 13 0 0 0
ST-41/44 1.8 [1.5 - 2.1] 390 7 0 0
ST-213 0.4 [0.28 - 0.57] 39 1 0 0
ST-269 4.4 [3.4 - 5.8] 214 7 0 0
Unassigned 0.28 [0.24 - 0.34] 140 32 2 9

1-Meningococcal disease in the UK and the investigation into meningococcal carriage after the introduction of the serogroup C conjugate vaccine
(MCC)

Serogroups of Meningococcal Disease Isolates in England and Wales
Data: HPA Meningococcal Reference unit and Centre for Disease Surveillance and Control.http://www.hpa.org.co.uk/infections/topics_az/
meningo/data_meni_t3a.htm
1989/1
990
1990/1
991
1991/1
992
1992/1
993
1993/1
994
1994/1
995
1995/1
996*
1996/1
997
1997/1
998
1998/1
999
1999/2
000
2000/2
001
2001/2
002
2002/2
003
2003/2
004**
0
500
1000
1500
2000
2500
3000
UngroupedOther GroupsGroup CGroup B
*Culture +PCR confirmed reports**Provisional Data
MCC Introduction

Immunisation with MCC could reduce the carriage of serogroup C disease-associated strains.
1-Capsule replacement
Emergence of new hypervirulent strains with serogroups other than C
(i.e. B, Y, W-135)
2-Herd immunity
Indirect protection of the unvaccinated
individuals
Questions Behind the UK Menincococcal Carriage Study
Neisseria meningitidis populations are highly diverse and dynamicLow prevalence of disease-associated strains

Glasgow
Stockport
Nottingham
Oxford
London
Plymouth
16,700 2,500
Isolation
Gen
otyp
e
Cardiff
MRU/SMPRL Phenotype
Studydatabases
MLSTdbNet
ST, siaD
Questionnaire Risk factors for carriage
Bangor
The UK Meningococcal Carriage Study

Changes on the Distribution of Serogroup C Clonal Complexes Over Three Years
1999 2000 2001
Year
0
1
2
3
4
5
6
% o
f isola
tes
UnassignedST-8 complex/Cluster A4ST-53 complexST-461 complexST-41/44 complex/Lineage 3ST-364 complexST-35 complexST-334 complexST-32 complex/ET-5 complexST-269 complexST-254 complexST-213 complexST-1157 complexST-11 complex/ET-37 complexST-103 complex
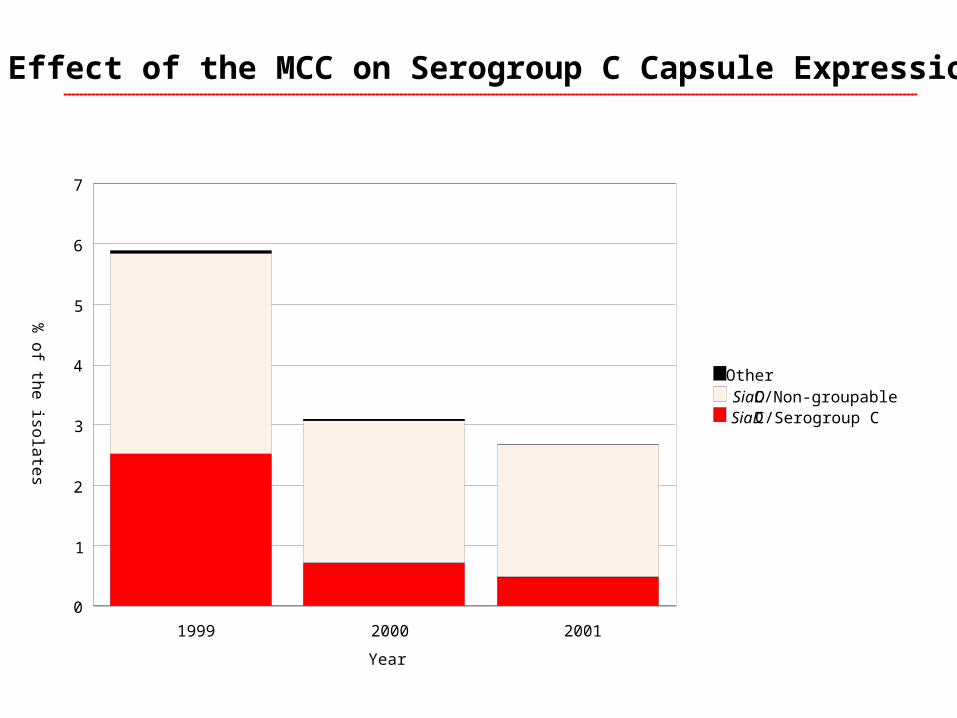
Effect of the MCC on Serogroup C Capsule Expression
1999 2000 2001
Year
0
1
2
3
4
5
6
7
% of the isolates
OtherSiaD C/Non-groupableSiaD C/Serogroup C

•The introduction of the MCC vaccine in the UK substantially reduced the prevalence of the disease-causing strains of ST-11 complex among the general population.
•The expression of the capsule among ST-11 complex strains has been significantlyreduced, more so than in any other serogroup C associated clonal complexes.
•No vaccine escape variants were detected in this study nor has been any indication oftheir emergence seven years after the vaccination campaign.
•The reduction on carriage of the ST-11 complex strains is consistent with the observation that herd immunity plays a key role in protecting unvaccinated people and young infants, among whom protection from the vaccine wanes rapidly.
Conclusions (I)
2-Geographical, temporal and vaccine-induced population structure

•To detect temporal stratification among meningococcal isolates obtained in three consecutive years following a mass-vaccination campaign with MCC.
•To investigate the geographic structure among bacterial population within a country.
•To investigate the population structure among carried Neisseria meningitidis in relation to the boundaries of human communities.
Aim of the Study

Analyses Implemented
F-Statistics or FST
•Measures the extent of the genetic differentiation among subpopulations.
•Ranges from 0 (no differentiation) to 1 (complete differentiation).
Analysis of Molecular Variation (AMOVA)
•ANOVA-like approach which partitions the molecular variance into within and among sub-populations components.
•Renders a p-value using a permutation test.
Definition of “genetic distance”
•ST identity: 1 if they are the same; 0 if they are different.

1999-2000
1999-2001
2000-2001
0
0.0002
0.0004
0.0006
0.0008
0.001
0.0012
0.0014
0.0016
0.00093
0.00146
0.00025
Postcode
Schools
0
0.002
0.004
0.006
0.008
0.01
0.012
UK locations0.00239
0.010730.00942
Temporal and Geographic Structuring Among carried Neisseria meningitidis in the United Kingdom
TemporalStructuring
Geographic Structuring

Conclusions (II)
•FST shows evidence of population structuring between pre and post-vaccine isolates.
•Higher levels of gene flow restriction observed among different schools and postal districts than among different cities around the UK.

Acknowledgements
Sample Collection:
Bangor: D Casey, KT Dunkin, C Roberts, AM Walker.
Cardiff: MR Evans, J Murray, A Paul.
Glasgow: JC Cameron, SC Clarke, S Ahmed.
London: JS Kroll, YK Lau, S Welch.
Nottingham: DAA Ala'aldeen, K Neal, P Marks, D Turner.
Oxford: D Crook, K Cann, D Griffiths, M Clacher, F Colles.
Plymouth: S Harrison, R Cunningham, G Lewendon, R Mathews.
Stockport: D Baxter, E B Kaczmarski, S Gray, AD Carr.
Study Design and Coordination:
MCJ Maiden, JM Stuart,JC Cameron,JM MacLennan.
Isolate Characterisation:
S Gray, SC Clarke, AD Carr, C Lewis.
AB Ibarz Pavón, R Urwin.
…And all the students who took part in the study
Noel McCarthy
Peter Medawar Building for Pathogen ResearchUniversity of Oxford
Daniel Wilson
Department of Mathematics and StatisticsLancaster University


Mantel Test
• Chi-square test that measures correlation (r) between two inter-related distance matrices of the same rank.
•The matrices used contain pairwise genetic and geographic distances.•r measures the correlation between genetic and geographic distances.
•Null hypothesis assumes no correlation between the matrices (r=0).
•High values of r indicate genetic differences between populations from different locations.
•Significance assessed as the proportion of the permutations that lead to an r>0

Mantel Test Shows No Correlation Between Genetic and Geographic Distance Either Before of After the Introduction of
the MCC
1999 2001
Correlation coefficient = -0.011003Correlation coefficient = -0.012009

Effects on Capsule Expression by Clonal Complex
ST
-11 complex/E
T-37
ST
-213 complex
ST
-269 complex
ST
-35 complex
ST
-41/44 complex/Lin
ST
-53 complex
ST
-8 complex/C
luster
Unassigned
0
0.5
1
1.5
2
SiaD-C/sg-Y
SiaDc-Non-groupable
SiaDc-Serogroup C
ST
-11 complex/E
T-37
ST
-213 complex
ST
-269 complex
ST
-334 complex
ST
-35 complex
ST
-364 complex
ST
-41/44 complex/Lin
ST
-461 complex
ST
-8 complex/C
luster
Unassigned
0
0.5
1
1.5
2
ST
-11 complex/E
TS
T-213 com
plexS
T-254 com
plex
ST
-269 complex
ST
-32 complex/E
TS
T-35 com
plex
ST
-41/44 complex/
ST
-53 complex
ST
-8 complex/C
lusU
nassigned
0
0.5
1
1.5
21999 20012000

Disease-associated meningococcigenotypes and serogroups
ST-23 complex
Serogroup Y
ST-11/W-135
ST-41/44/C
Serogroup A
ST-1 complex ST-4 complex ST-5 complex
ST-11 complex ST-8 complex
Serogroup C
ST-41/44 complex ST-32 complex
Serogroup B
ST-22 complex
Serogroup W-135

Evidence of Genetic Differentiation Between Pre and Post-Vaccine Populations of Neisseria meningitidis
ST Frequency
Nucleotide differences
Allelic mismatch
1999-2000
1999-2001
2000-2001
0
0.0002
0.0004
0.0006
0.0008
0.001
0.0012
0.0014
0.0016
0
0.0005
0.001
0.0015
0.002
0.0025
0.003
0.0035
0.004
Conca
tena
ted
abcZ
adk_
aroE
fum
Cgd
h_pd
hCpg
m_
0
0.0005
0.001
0.0015
0.002
0.0025
Conca
tena
ted
abcZ
adk_
aroE
fum
Cgd
h_pd
hCpg
m_
0.00093
0.00146
0.00025
1999-2000: 0.00141
1999-2001: 0.00220
2000-2001: 0.00014
1999-2000: 0.00133
1999-2001: 0.00179
2000-2001: 0.00026

Genetic Differentiation Among Neisseria meningitidis Collected from Locations, Postal Districts and Schools around the United Kingdom
ST Frequency
Nucleotide differences
Allelic mismatch
Postcode
Schools
0
0.002
0.004
0.006
0.008
0.01
0.012
0
0.002
0.004
0.006
0.008
0.01
0.012
0.014
0.016
0
0.002
0.004
0.006
0.008
0.01
0.012
0.014
UK locations
0.00239
0.00323
0.00322
0.010730.00942
0.01365
0.01116
0.010330.01262


