GOVERNMENT OF THE DISTRICT OF COLUMBIA WASHINGTON, DC Adrian M. Fenty Mayor Anacostia River Discharge Monitoring Report Municipal Separate Storm Sewer System NPDES Permit No. DC0000221 August 19, 2009 Prepared by: District Department of the Environment George S. Hawkins, Director Submitted on behalf of: District Department of the Environment 51 N Street, NE Washington, DC 20002 DC Department of Public Works 2000 14 th Street, NW Washington, DC 20009 District Department of Transportation 2000 14 th Street, NW Washington, DC 20009 DC Water and Sewer Authority 5000 Overlook Avenue, SE Washington, DC 20032 District Department of Real Estate Services 441 4 th St. NW, Suite 1100 South Washington, DC 20001
Transcript
GOVERNMENT OF THE DISTRICT OF COLUMBIA WASHINGTON, DC
Adrian M. Fenty Mayor
Anacostia River
Discharge Monitoring Report
Municipal Separate Storm Sewer System NPDES Permit No. DC0000221
August 19, 2009
Prepared by:
District Department of the Environment
George S. Hawkins, Director
Submitted on behalf of:
District Department of the Environment 51 N Street, NE
Washington, DC 20002
DC Department of Public Works 2000 14th Street, NW
Washington, DC 20009
District Department of Transportation 2000 14th Street, NW
Washington, DC 20009
DC Water and Sewer Authority 5000 Overlook Avenue, SE
Washington, DC 20032
District Department of Real Estate Services 441 4th St. NW, Suite 1100 South
Washington, DC 20001
Municipal Separate Storm Sewer System NPDES Permit No. DC0000221 2009 Anacostia River DMR ___________________________________________________________________________
i
TABLE OF CONTENTS Page LIST OF TABLES ………………………………………………………………….. ii LIST OF FIGURES ………………………………………………………………… ii LIST OF APPENDICES …………………………………………………………… iii I. INTRODUCTION ………………………………………………………….. 1 II. MONITORING SITES …………………………………………………….. 2 III. WEATHER INFORMATION …………………………………………….. 6 IV. SAMPLE COLLECTION …………………………………………………. 10 V. RECORD KEEPING ……………………………………………………… 11 VI. MONITORING RESULTS ………………………………………………... 13 VII. ESTIMATES OF CUMMULATIVE POLLUTANT LOADING ………. 19 VIII. WATER QULAITY TRENDS …………………………………………….. 23
Municipal Separate Storm Sewer System NPDES Permit No. DC0000221 2009 Anacostia River DMR ___________________________________________________________________________
ii
LIST OF TABLES
Number Title Page 1-1 DC MS4 Monitoring Schedule..…………………………………. 2 2-1 Anacostia River Monitoring Sites ………………………………. 3 2-2 Summary Events of Wet and Dry Weather Sampling at Nine
Anacostia River Sites ……………………………………………. 5 3-1 Precipitation Record for Washington, DC ………………………. 6 3-2 Storm Characteristics for Anacostia River Watershed
Wet and Dry Weather Sampling ………………………………… 10 6-1 Ambient Water Quality Data for Anacostia River Sites - Wet Weather Sampling Events ………………………………….. 13 6-2 Ambient Water Quality Data for Anacostia River Sites - Dry Weather Sampling Events ………………………………….. 14 6-3 Summary Data – Wet Weather Events ………………………….. 17 6-4 Summary Data – Dry Weather Events ………………………….. 18 7-1 2008-2009 Anacostia River Watershed Pollutant
Event Mean Concentration …………………………………….. 22 7-2 2008-2009 Anacostia River Watershed Annual Pollutant Loading 23 8-1 Mean Pollutant Concentrations for the Anacostia River Sites Over Three Sampling Rotations ………………………….. 25 8-2 Comparison of Mean Pollutant Concentrations
to 2005-2006 Rotation …………………………………………. 26
Municipal Separate Storm Sewer System NPDES Permit No. DC0000221 2009 Anacostia River DMR ___________________________________________________________________________
iii
LIST OF FIGURES
Number Title Page 2-1 Anacostia River Watershed – DC MS4 Monitoring Sites ……….. 4
LIST OF APPENDICES APPENDIX A Anacostia River Watershed Monitoring Sites APPENDIX B Anacostia River Watershed Discharge Monitoring Report APPENDIX C Anacostia River Watershed Sampling Analytical Data APPENDIX D Estimation of Runoff Coefficients
I. INTRODUCTION
The current District of Columbia Municipal Separate Storm Sewer System (DC MS4) Permit
No. DC0000221 (Permit) was issued by the U.S. Environmental Protection Agency (EPA) on
August 19, 2004. This report is prepared in partial fulfillment of the monitoring and reporting
requirements set forth in Part IV of the Permit.
The Permit requires that three wet weather and two dry weather sampling and analyses be
conducted as part of the characterization of the storm water discharges. The sampling
schedule followed a watershed based monitoring approach whereby the representative sites
within one of the three watersheds are to be sampled within a given calendar year. Table 1-1
below shows the schedule for the most recent cycle of monitoring and reporting for each of
the three DC MS4 watersheds.
The monitoring for all watersheds did not take place as scheduled. Several factors contributed
to limit the number of sampled events within the scheduled calendar year. Rainfall conditions
that produce qualifying storm events have been fewer than needed. In other instances the
nature of rainfall (intensity or duration) did not allow the collection of sample volume
required for the full suite of laboratory analysis. Also, irregularities in contractor’s sampling
protocols, discovered in the process, necessitated the re-sampling of a number of sites. A
Corrective Action Plan (CAP) was developed by the DDOE in July of 2008. The CAP was
approved by the EPA. The ongoing implementation of the CAP required that sampling be
carried out at all three watersheds concurrently under an accelerated schedule. All three wet
weather and two dry weather samples have been collected and analyzed at the nine sites in the
Anacostia River watershed.
This report constitutes the Anacostia River watershed discharge monitoring report scheduled
to be submitted to the EPA by August 19, 2009, as required by Part IV of the Permit. The
report contains a description of the monitoring sites, the sampled storm characteristics, the
sampling activities, the analytical results at the nine sites, and the estimated annual loads for
selected parameters. A comparison of the results with the prior monitoring rotation is also
presented.
Municipal Separate Storm Sewer System NPDES Permit No. DC0000221 2009 Anacostia River DMR ___________________________________________________________________________
2
Table 1-1 DC MS4 MONITORING SCHEDULE
Watershed Monitoring Year No. of Stations DMR Due Date
Rock Creek Calendar year 2006 10 (6 in MS4 permit, 4
not in permit)
August 19, 2007
Potomac River Calendar year 2007 7 August 19, 2008
Anacostia River Calendar year 2008 9 August 19, 2009
II. MONITORING STATIONS
Part IV.A.1 of the Permit lists the sampling locations for the Anacostia River watershed. The
nine representative monitoring sites and the associated drainage areas are provided in Table 2-
1. Figure 2-1 shows the locations of the monitoring sites.
The drainage areas and land use types for each representative monitoring site were revised
based on most recent available Geographic Information System (GIS) data. The monitoring
site point-layer and existing GIS dataset of the storm water sewer system supplied by the DC
Water and Sewer Authority (DCWASA) were used to digitize the drainage area.
The areas drained by all contributing secondary and higher order storm water drains upstream
from the monitoring manhole/outfall were delineated. In addition, the 2008 orthophoto and
the ground surface elevation GIS data was used to locate the storm water runoff divide to take
into account curbs and unsewered areas. The acreage within the perimeter was automatically
computed by the geodatabase file system.
The 2004 land use delineation prepared by the DC Office of Planning was used to represent
the land use type within each catchment area. The coverage by each land use type within
Municipal Separate Storm Sewer System NPDES Permit No. DC0000221 2009 Anacostia River DMR ___________________________________________________________________________
3
each drainage area was calculated by GIS analysis by intersecting the drainage area polygons
with the Existing Land use polygon layer and then field calculations were performed.
Detailed maps of each of the monitoring site, the associated drainage area and land use types
are included in Appendix A.
TABLE 2-1 ANACOSTIA RIVER MONITORING SITES
Site
Number Sampling Location
Drainage Area
(Acres)
1 Stickfoot Sewer- 2400 block of Martin Luther King, Jr. Ave., SE, near
Metro bus entrance
616.3
2 O St. Storm Water Pump Station- 125 O. St., 125 O SE – just outside
front gate at O St. Pump Station
25.4
3 Anacostia High School/Anacostia Recreation Center – corner of 17th St.
and Minnesota Ave., SE
251.8
4 Gallatin & 14th St., NE – across from the intersection of 14th St. and
Gallatin St. in a large outfall
662.4
5 Varnum & 19th Place, NE – 2100 Block of Varnum St. 517.4
6 Nash Run – intersection of Anacostia Dr. and Polk St., NE 13.4
7 East Capitol St. – 200 Block of Oklahoma Ave., NE 16.7
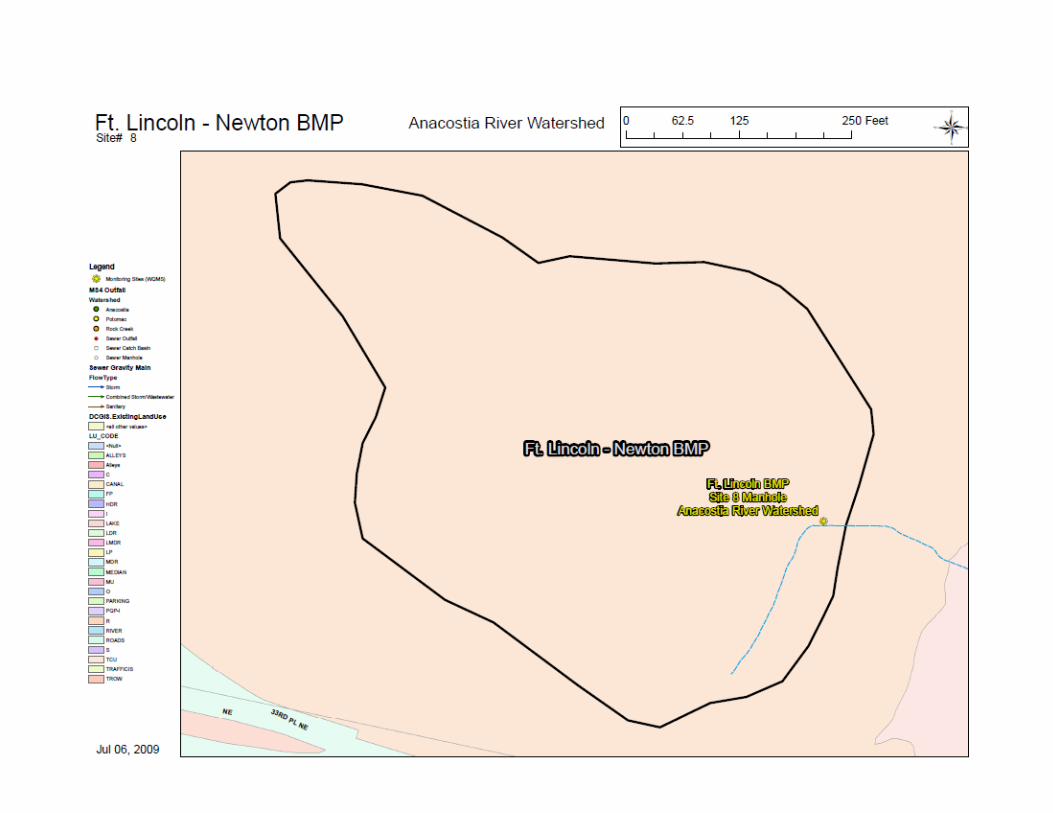
8 Ft. Lincoln – Newton BMP- in the brush along the side of New York Ave.
West after the bridge
5.7
9 Hickey Run -33rd and V Streets, NE, across road from post office access 8.5
Municipal Separate Storm Sewer System NPDES Permit No. DC0000221 2009 Anacostia River DMR ___________________________________________________________________________
4
Municipal Separate Storm Sewer System NPDES Permit No. DC0000221 2009 Anacostia River DMR ___________________________________________________________________________
5
Samples were collected and analyzed in accordance with the Permit and monitoring
requirements at 40 CFR 122.26(d)(2)(iii), by the Environmental Design and Construction, Inc,
contractors for the DDOE. At each of the nine Anacostia River sites, at least three wet
weather and two dry weather sampling were planned in this monitoring rotation. Table 2-2
below lists the sampling event dates for each site. Site 8, Ft. Lincoln- Newton BMP
monitoring site did not produce sufficient flow necessary for the full suite of laboratory
analysis during three qualifying storm events.
TABLE 2-2 SUMMARY EVENTS OF WET AND DRY WEATHER SAMPLING AT NINE ANACOSTIA RIVER SITES
Site
Number Sampling Location Wet Weather Dry Weather
1 Stickfoot Sewer 9/25/08 11/24/08 2/18/09
3/25/08 1/23/09
2 O St. Storm Water Pump Station
11/4/08 12/10/08 3/26/09
NDF 6/16/09
3 Anacostia High School 9/25/08 11/24/08 1/6/09
3/24/08 6/26/09
4 Gallatin & 14th St, NE 11/04/08 12/10/08 2/18/09
3/24/08 1/16/09
5 Varnum and 19th Pl, NE 11/13/08 2/18/09 4/11/09
NDF NDF
6 Nash Run 11/13/08 2/18/09 4/11/09
3/25/08 NDF
7 East Capitol St. 11/13/09 2/18/09 4/11/09
3/26/08 1/16/09
8 Ft. Lincoln – Newton BMP NSF NSF NSF
NDF NDF
9 Hickey Run 11/4/08 1/6/09 3/6/08
NDF NDF
NSF: No sufficient flow for analyses NDF: there are no dry flows at that monitoring site
Municipal Separate Storm Sewer System NPDES Permit No. DC0000221 2009 Anacostia River DMR ___________________________________________________________________________
6
III. WEATHER INFORMATION
During the monitoring period September 2008 to July 2009, the rainfall patterns have been
unpredictable, with accumulations well below or above the monthly averages on record.
Table 3-1 lists the actual and average precipitation at the Ronald Reagan National Airport.
A number of the rainfall events were in the form of short duration thunderstorms followed by
a lengthy dry period. The spatial distribution of the rainfall through the region and the city
also presented special challenges in the collection of samples for analysis.
TABLE 3-1 PRECIPITATION RECORD FOR WASHINGTON D.C.
Precipitation
Month Actual (in.)a Number of Days in
Month with
Storms >0.10 in.
Monthly Average
(in.)
2008
September 6.41 7 3.79
October 1.13 1 3.22
November 2.43 3 3.03
December 2.97 4 3.05
2009
January 2.68 4 3.21
February 0.35 1 2.63
March 1.97 1 3.60
April 4.22 7 2.77
May 8.05 12 3.82
June 5.86 8 3.13
July 0.94 3 3.66
a – gage at Ronald Reagan National Airport
Municipal Separate Storm Sewer System NPDES Permit No. DC0000221 2009 Anacostia River DMR ___________________________________________________________________________
7
A narrative description of the sampled rainfall events including the site sampled, the duration
of the rainfall, and the elapsed time between the sampled rainfall and the prior measurable
rainfall event is presented below. Table 3-2 lists a summary of the wet weather events.
September 25, 2008
Samples were collected at Site #1 (Stickfoot Sewer) and Site #3 (Anacostia High School).
The rainfall event lasted approximately 19 hours and produced 0.36 inches. The last
measurable rainfall occurred about 16 days prior to this event.
November 4, 2008
Samples were collected at Site #2 (O Street Storm Water Pump Station), site #4 (Gallatin
&14th St.), and site #9 (Hickey Run). Site #8 (Ft. Lincoln-Newton BMP) did not produce
sufficient flow for analysis. Rain begun to fall at approximately 2:00 O’clock in the afternoon
The rainfall event lasted for about 7.5 hours. A total of 0.12 inches of rain fell during the
sampling event. The last measurable rainfall occurred about 7 days prior to this event.
November 13, 2008
During this event, samples were collected at Site #5 (Varnum and 19th Pl.), Site #6 (Polk/Nash
Run), and Site #7 (East Capitol St.). Site #8 (Ft. Lincoln-Newton BMP) did not produce
sufficient flow for sampling. A total of 0.64 inches of rain fell over a duration of 5.5 hours.
The last measurable rainfall occurred about 8.5 days prior to this event.
November 24, 2008
The sites sampled during this rainfall event were Site #1 (Stickfoot Sewer) and Site #3
(Anacostia High School). A total of 0.08 inches of rainfall occurred over a total of 3 hours
duration. The last measurable rainfall occurred about 9 days prior to this event.
December 10, 2008
Samples were collected at Site #2 (O St. Storm Water Pump Station) and Site #4 (Gallatin &
14th St.).
Municipal Separate Storm Sewer System NPDES Permit No. DC0000221 2009 Anacostia River DMR ___________________________________________________________________________
8
The rainfall event lasted for about 9 hours. A total of .09 inches of rain fell during that
period. The last measurable rainfall occurred about 9 days prior to this event.
January 6, 2009
Site #3 (Anacostia High School), Site #6 (Nash Run), Site #7 (Oklahoma and D Streets NE),
and Site #9 (Hickey Run) were sampled during this storm event. Site #5 (Varnum and 19th Pl.)
did not produce enough flow for sampling. A total of 0.67 inches of rain fell over
approximately 31.5 hours. The last measurable rainfall occurred about 17days prior to this
event.
February 18, 2009
Samples were collected at Site #1 (Stickfoot Sewer), Site #4 (Gallatin & 14th Street NE) and
Site #5 (Varnum and 19th Pl.). 0.15 inches of rain fell over a 5 hours period. The last
measurable rainfall occurred about 20 days prior to this event.
March 26, 2009
The sites sampled during this storm event were Site #2 (O St. Storm Water Pump Station) and
Site #9 (Hickey Run). A total of 0.28 inches of rain fell over a period of approximately 13.0
hours. The last measurable rainfall occurred about 24 days prior to this event.
April 11, 2009
Site #5 (Varnum and 19th Pl.) and Site #6 (Nash Run) were sampled during this storm event.
The storm event produced a total of 0.31 inches of rain. The rainfall lasted for approximately
9.0 hours. The last measurable rainfall occurred about 5.5 days prior to this event.
April 20, 2009
Site #7 (East Capitol St.) was sampled during this event. A total of 0.72 inches of rain fell.
The storm event lasted for approximately 7.5 hours. The last measurable rainfall occurred
about 4.5 days.
Municipal Separate Storm Sewer System NPDES Permit No. DC0000221 2009 Anacostia River DMR ___________________________________________________________________________
9
TABLE 3-2. STORM CHARACTERISTICS FOR ANACOSTIA RIVER
WATERSHED WET WEATHER SAMPLING EVENTS
Date Precipitation
(in.)
Duration
(hours)
Time to Previous
Measurable
Rainfall (days)
Sites Sampled
9-25-08 0.36 19 16 1, 3
11-4-08 0.12 7.5 7 2, 4, 9
11-13-08 0.64 5.5 8.5 5, 6, 7
11-24-08 0.08 3 9 1, 3
12-10-08 0.09 9 9 2, 4
1-6-09 0.67 31.5 17 3, 6, 7, 9
2-18-09 0.15 5 20 1, 4, 5
3-26-09 0.28 13 24 2, 9
4-11-09 0.31 9 5.5 5, 6
4-20-09 0.72 7.5 4.5 7
Municipal Separate Storm Sewer System NPDES Permit No. DC0000221 2009 Anacostia River DMR ___________________________________________________________________________
10
IV. SAMPLE COLLECTION AND ANALYSIS
The storm water samples were collected based on the requirement to collect one subset of
samples by using grab samples collected during the first 2 hours of the storm event and a
separate subset to be collected using time-weighted-average composite technique.
The list of sampled parameters, the detection limits, and EPA-approved methods utilized for
monitoring activities are included in Table 4-1.
TABLE 4-1. SAMPLE ANALYSIS REQUIREMENTS FOR WET AND DRY WEATHER SAMPLING
Bottle Type Sample Type Parameter Method Units MDL 1-L Plastic Unpreserved
Composite Biochemical Oxygen Demand (5d) Total Dissolved Solids Total Suspended Solids
SM5210B SM2540C SM2540D
mg/L mg/L mg/L
<5.0 <1.0 <1.0
500 mL Plastic H2SO4
Composite Ammonia Nitrogen Phosphorus, Total Nitrite + Nitrate Chemical Oxygen Demand Total Kjeldahl Nitrogen
Composite Hardness, Total Antimony, Total Arsenic, Total Beryllium, Total Cadmium, Total Chromium, Total Copper, Total Lead, Total Mercury, Total (by cold vapor) Nickel, Total Selenium, Total Silver, Total Thallium, Total Zinc, Total
Municipal Separate Storm Sewer System NPDES Permit No. DC0000221 2009 Anacostia River DMR ___________________________________________________________________________
11
Bottle Type Sample Type Parameter Method Units MDL 250 mL Plastic, NaOH
Grab Cyanide, Total EPA 335.2 mg/L <0.01
(2) 1-L Glass Amber Unpreserved
Composite BNA Compounds EPA 625 μg/L Various
(2) 40 mL Glass Vials Teflon Lids
Grab Volatile Organic Compound EPA 624 μg/L 0.5
1-L Glass Amber H2SO4 Teflon Lids
Grab Phenols, Total EPA 420.2 mg/L 1.9
1-L Glass Amber H2SO4 Teflon Lids
Composite PCBs / Pesticides EPA 608 μg/L 0.01-1.7
1-L Glass Amber Teflon Lids
Composite PCBs EPA 8082 modified
ng/L 0.25-5.0
1-L Glass Amber 1:1 HCl
Grab Fats (oil and grease) EPA 1664 mg/L 1.6
100 mL Plastic
Composite Chlorophyll-a SM 10020H2 mg/m3 2
500 mL Plastic H2SO4
Composite Total Ammonia + Organic Nitrogen (TKN)
EPA 351.3 mg/L 0.2
Field Test Dissolved Oxygen EPA 360.1 mg/L N/A 500 mL Plastic H2SO4
Composite Organic Nitrogen TKN – NH3 mg/L N/A
500 mL Plastic H2SO4
Composite Total Nitrogen NO2 + NO3 + TKN
mg/L N/A
V. RECORD KEEPING
DDOE WQD maintains the records of monitoring information including:
• Description of Sampling
- Sampling protocols
- Location/Collection time
- Sample collection procedures
- Field notes
- Environmental Design & Construction, DC MS4 sampling personnel
Municipal Separate Storm Sewer System NPDES Permit No. DC0000221 2009 Anacostia River DMR ___________________________________________________________________________
12
• Storm Event Data
- Date and duration of storm events sampled
- Rainfall measurements
- Duration between storm event sampled and the end of the previous measurable
storm event
- Estimate of the total volume of the discharge sampled
• Storm Water Analysis Data
- Field test results
- Laboratory results
Municipal Separate Storm Sewer System NPDES Permit No. DC0000221 2009 Anacostia River DMR ___________________________________________________________________________
13
VI. MONITORING RESULTS
Monitoring results for the wet weather sampling events are reported on EPA Form 3320-1
Discharge Monitoring Report included in Appendix B. Table 6-1 and Table 6-2 show the
ambient water quality results for the wet weather and dry weather sampling, respectively.
Additional sampling and analysis results are contained in Appendix C.
Table 6-1 Ambient Water Quality Data for Anacostia River Stations During
9 Hickey Run 3/26/2009 11.9 6.6 10.2 <.03 220 * Field measurements were taken as % saturation.
Municipal Separate Storm Sewer System NPDES Permit No. DC0000221 2009 Anacostia River DMR ___________________________________________________________________________
14
Table 6-2 Ambient Water Quality Data for Anacostia River Stations During Dry Weather Sampling Event
O St. Storm Water Pump Station 6/16/09 23.3 7.61 5.2
3/24/2008 12 7.92 7.5 507 3
Anacostia High School 6/26/09 24.3 7.3 8.8 .03 502
3/24/2008 15.1 7.1 6.9 329 4
Gallatin & 14th St., NE 1/16/2009 6.4 6.44 12
NDF 5
Varnum and 19th Pl., NE NDF
6
Nash Run NDF
3/27/2008 18.9 6.37 5.5 783 7 East Capitol St. 1/16/2009 12.7 6.13 3.3
NDF 9.2 7.65 6.7 229
8
Ft. Lincoln-Newton BMP
NDF 9
Hickey Run NDF
* Field measurements were taken as % saturation.
Municipal Separate Storm Sewer System NPDES Permit No. DC0000221 2009 Anacostia River DMR ___________________________________________________________________________
15
For EMCs calculated in this report, the geometric mean of each parameter was calculated as
an estimate of the average EMC for each station. These data are presented in the following
paragraphs for Anacostia River.
Wet Weather Events
Anacostia River watershed sites 1through 9 were sampled during wet weather flows from
September 2008 to July 2009.The geometric mean of the analytical results for each sample
station is provided for twenty priority pollutants in Table 6-3. The highest mean
concentration of total suspended solids (TSS) was reported at Varnum and 19th Pl (66.9
mg/L), and the lowest was reported at Hickey Run (5.00 mg/L). All other stations had TSS
concentrations between 8.71 and 60.7 mg/L. Varnum and 19th Pl. had the highest biochemical
oxygen demand (BOD) concentrations (42.8 mg/L) among all stations, while all other stations
ranged from 5.65 (O St. Storm Water Pump Station) to 28.4 mg/L (Nash Run). Total nitrogen
(TN) concentrations from Anacostia River stations ranged from 3.25 (Anacostia High School)
to 5.66 mg/L (Varnum and 19th Pl.) and total phosphorus (TP) concentrations ranged from
0.02 (Hickey Run) to 0.57 mg/L (O St. Storm Water Pump Station). Most of the Anacostia
stations had high fecal coliform (FC) concentrations ranging from 9,790 (Varnum and 19th Pl.,
NE) to 184,103 MPN/100 mls (Stickfoot Sewer). Two Anacostia stations had relatively low
FC concentrations including O St. Storm Water Pump Station (2,759 MPN/100 mls) and Nash
Run (4,191 MPN/100 ml). Oil and grease (O&G) concentrations ranged from non-detect
(ND) to 3.76 mg/L (Varnum and 19th Pl). Relatively high concentrations of zinc (18.3 to122.3
μg/L) and copper (11.3 to 63.0 μg/L) were measured from all Anacostia stations. Lead
concentration were measured for Gallatin &14th St. (4.98 μg/L) and Varnum and 19th Pl. (4.52
μg/L) stations, while remaining six stations had non detectable concentrations of lead. None
of the stations had detectable concentrations for arsenic, PAHs, chlordane, heptachlor,
dieldrin, DDT, DDE, DDD, or PCBs. Complete analytical results are included in Appendix C.
Dry Weather Events
Six stations were sampled for dry weather flows from March 2008 to June 2009. Grab
samples were used to calculate the concentrations of 20 pollutants for these six stations and
the geometric mean of the dry weather sample analysis results for each station are presented
Municipal Separate Storm Sewer System NPDES Permit No. DC0000221 2009 Anacostia River DMR ___________________________________________________________________________
16
in Table 6-4. The relatively high mean concentrations of TSS and BOD were reported at
Nash Run (88.0 mg/L for TSS and 59.0 for BOD), while other stations had much lower, with
concentrations ranging from 6.0 to 23.9 mg/L and from 5.11 to 10.0 mg/L, respectively. The
highest mean concentration of TN was reported at O St. Storm Water Pump Station (13.0
mg/L), and the lowest was reported at Gallatin &14th St (1.70 mg/L). Nash Run had the
highest TP, and O&G concentrations (2.50 and 24.0 mg/L, respectively) compared to other
stations, which ranged from 0.09 to 0.38 mg/L and ND to 2.83 mg/L, respectively). Fecal
coliform bacteria concentrations were highest at Stickfoot Sewer and East Capitol St. (4,195
and 3,578 MPN/100 mls, respectively) and lowest at Anacostia High School (226 MPN/100
mls). Fecal coliform concentrations for all stations were noticeably lower during dry weather
event (226 to 4,195 MPN/100 mls) than wet weather event (2,759 to 184,103 MPN/100 mls).
The highest mean concentration of zinc was reported at O St. Storm Water Pump Station (250
μg/L), and the lowest was reported at Stickfoot Sewer (2.4 μg/L). All other stations had zinc
concentrations between 22.2 and 110 μg/L. Copper concentrations ranged from 5.1 (Stickfoot
Sewer) to 34.0 μg/L (Nash Run) during dry weather events. Two Anacostia stations had
relatively high lead concentrations including East Capitol St. (10.7 mg/L) and O St. Storm
Water Pump Station (12.0 mg/L), while all other stations had lead concentrations below 4.4
μg/L. Anacostia High School was the only station that had detectable concentrations (3.0
μg/L) of arsenic during the two sample collections.
During the dry weather events, Nash Run had highest concentrations for TSS, BOD, TP,
O&G, and copper, and O St. Storm Water Pump Station had highest concentrations for TN,
zinc, and lead.
None of the stations had detectable concentrations for PAHs, chlordane, heptachlor, dieldrin,
DDT, DDE, or DDD, and PCBs. Complete analytical results are included in Appendix C.
Municipal Separate Storm Sewer System NPDES Permit No. DC0000221 2009 Anacostia River DMR ___________________________________________________________________________
17
TABLE 6-3 SUMMARY DATA OF WET WEATHER EVENTS (2008-2009) FROM NINE ANACOSTIA MONITORING STATIONS. VALUES REPRESENT GEOMETRIC MEAN FOR EACH STATION.
TSS: total suspended solids; BOD: biological oxygen demand; TN: total nitrogen; TP: total phosphorus; FC: fecal coliform bacteria; O&G: oil and grease; PCB: total PCBs ND: none-detected aUnits are in MPN/100ml bTotal recoverable metals cUnits are in ug/L dUnits are in ng/L egeometric mean was calculated using half of detection limit or reporting limit if the analysis results show “none detected” or “below reporting limit” --- No data available due to non sufficient flow
Municipal Separate Storm Sewer System NPDES Permit No. DC0000221 2009 Anacostia River DMR ___________________________________________________________________________
18
TABLE 6-4 SUMMARY DATA OF DRY WEATHER EVENTS (2008-2009) FROM NINE ANACOSTIA MONITORING STATIONS. VALUES REPRESENT GEOMETRIC MEAN FOR EACH STATION.
TSS: total suspended solids; BOD: biological oxygen demand; TN: total nitrogen; TP: total phosphorus; FC: fecal coliform bacteria; O&G: oil and grease; PCB: total PCBs ND: none-detected n/a: not available aUnits are in MPN/100ml bTotal recoverable metals cUnits are in ug/L dUnits are in ng/L egeometric mean was calculated using half of detection limit or reporting limit if the analysis results show “none detected” or “below reporting limit” --- No data available due to no dry weather flow
Municipal Separate Storm Sewer System NPDES Permit No. DC0000221 2009 Anacostia River DMR ___________________________________________________________________________
19
VII. ESTIMATES OF CUMMULATIVE POLLUTANT LOADINGS
The annual pollutant loads for each sewershed sampled were calculated by the Simple Method
(EPA 1992) utilizing the wet weather event mean concentrations, the total drainage area, and
land use distribution within each sewershed. The Simple Method can estimate pollutant loads
without extensive rainfall-runoff volume data using the sample analysis results available.
Generally, the Simple Method is expected to overestimate pollutant loads as compared to
more dynamic models that incorporate pollutant concentration and runoff coefficients as
functions of initial conditions and rainfall intensity and duration in estimating total pollutant
loads.
The Simple Method is given by the following equation:
No. of landuse types
12.72
12 i i ii
PL CF Rv C A=
⎛ ⎞= × × × × ×⎜ ⎟⎝ ⎠
∑ (Equation 1)
where
L = pollutant loading (lb/year for chemical constituents, MPN/yr for bacteria)
P = average annual rainfall (inches)
CF = Correction factor (0.9) to adjust for storms where no runoff occurs (dimensionless)
(EPA 1992)
Rvi = runoff coefficient for the land use type (dimensionless)
Ci = average event mean concentration (mg/L for chemical constituents)
Ai = land use area (acres)
2.72 = unit conversion factor for chemical constituents in concentration units of mg/L;
12,334,885 for bacteria in units of MPN/100 mL.
Municipal Separate Storm Sewer System NPDES Permit No. DC0000221 2009 Anacostia River DMR ___________________________________________________________________________
20
The average event mean concentration (EMCs) for each monitoring station was calculated as
the geomean of the measured EMCs (Urban Stormwater BMP Performance Monitoring:
Guidance Manual, ASCE/EPA, 2002).
C =
1
j1
Geomean of EMCs EMCm m
j=
⎡ ⎤= ⎢ ⎥⎣ ⎦∏ (Equation 2)
Where:
jEMC = Event Mean Concentration of storm j
m = Number of storms at monitoring location
Annual precipitation within the District of Columbia for the September 2008 through August
2009 monitoring period was 40.44 inches as reported by the National Weather Service (NWS)
weather station at Washington National Airport (COOP ID: 448906). The sewershed area
was obtained from the sewershed coverage. A key parameter in Equation 1 is the runoff
coefficient (Rvi), which is directly related to imperviousness and land use. Land use
categories, impervious surfaces, and runoff coefficients were calculated for each sewershed
and presented in Appendix D. Table 7-1 presents the annual loads for pollutants specified in
40 CFR 122.21(g)(7). Also included are the annual loads for Fecal Coliform Bacteria and Oil
and Grease.
Based upon the pollutant loadings calculated for eight District of Columbia Anacostia River monitoring sites, a cumulative load for the entire District of Columbia portion of the Anacostia River watershed was estimated (Table 7-1). This cumulative load assumes that the eight sample stations are representative of the watershed. Given this assumption, a simple ratio may be used to discover a cumulative load for the Anacostia River watershed in its entirety:
( )ti
iA A
AL
L ⎟⎟⎠
⎞⎜⎜⎝
⎛=∑∑ (Equation 3)
LA = Anacostia watershed cumulative pollutant load (lb/year)
At = Anacostia watershed total area (acres)
Municipal Separate Storm Sewer System NPDES Permit No. DC0000221 2009 Anacostia River DMR ___________________________________________________________________________
21
Li = Pollutant loading for each monitoring site (lb/year)
Ai = Acreage for each monitoring site (acres) Table 7-2 indicates that cadmium and lead are entering the Anacostia River in relatively small amounts at 226 lbs/year and 285 lbs/year respectively. Total Dissolved Solids loads are significant at 49,886,798 lbs/year. Total Nitrogen and Total Phosphorous loads to the Anacostia River are estimated at 516,908 lbs/year and 36.037 lbs/year, respectively. Monitoring sites contributing the highest loads to the Anacostia River include Gallatin & 14th St., Varnum and 19th Pl., and Stickfoot Sewer. This is due in large part to the total catchment area of each of these monitoring sites with the catchment area for each site being greater than 500 acres. The next largest catchment area is represented by the Anacostia High School monitoring site at roughly 250 acres.
Municipal Separate Storm Sewer System NPDES Permit No. DC0000221 2009 Anacostia River DMR ___________________________________________________________________________
22
Table 7-1 2008-2009 Anacostia River Watershed Pollutant Event Mean Concentration
Event Mean Concentrations for Designated Parameters (mg/L unless otherwise noted)
Station BOD COD TDS TSS TN TKN TP DP FCb O&G Cda Cua Pba Zna
East Capitol St. 16.20 42.51 178.90 39.40 3.58 3.58 0.28 0.1999 12,927 2.92 0.0003 0.0135 ND 0.0888
Hickey Run 10.10 35.36 194.80 5.00 3.65 3.65 0.02 0.0537 15,326 ND 0.0002 0.0117 ND 0.1223 ªTotal Recoverable Metals bUnits are in MPN/100mls ND: none –detected
Municipal Separate Storm Sewer System NPDES Permit No. DC0000221 2009 Anacostia River DMR ___________________________________________________________________________
23
Table 7-2 2008-2009 Anacostia River Watershed Annual Pollutant Loading
Loadings for Designated Parameters (Lbs./year unless otherwise noted)
Municipal Separate Storm Sewer System NPDES Permit No. DC0000221 2009 Anacostia River DMR ___________________________________________________________________________
24
VIII. ANACOSTIA RIVER WATER QUALITY TREND ANALYSIS1
To date the Anacostia River monitoring stations have been sampled on three separate
rotations during the periods of 2001-2002, 2005-2006, and 2008-2009. Table 8-1 below
shows the mean concentrations from the sampling and analysis performed during the three
rotations. The data set for the 2001-2002 and 2005-2006 rotations in the table are those
reported in previous discharge monitoring reports.
Table 8-2 presents a direct comparison of the average pollutant concentrations between the
previous and current sampling rotations for the Anacostia River Watershed. The data shown
represents a broad overview of water quality trends in the Anacostia River watershed for
select parameters during wet weather events.
Average concentrations of Cadmium, Fecal Coliform bacteria, Total Nitrogen, and Total
Dissolved Solids have increased this monitoring cycle, the Anacostia River monitoring sites
have seen a decrease in the concentrations of all other specified pollutants. Furthermore,
Arsenic, Lead and PAH’s which have previously been detected in Anacostia monitoring site
samples, were not found in levels sufficient for detection during rotation 3.
Future rotations of wet weather sampling will produce a more precise evaluation of the
historic trends for the selected parameters, and indicate the effectiveness of pollution
reduction measures being undertaken within the Anacostia River watershed.
Municipal Separate Storm Sewer System NPDES Permit No. DC0000221 2009 Anacostia River DMR ___________________________________________________________________________
25
Table 8-1 Mean Pollutant Concentrations for the Anacostia River Sites Over Three Sampling Rotations
Phosphorus, total (mg/L) 0.353 0.673 0.291 Total Dissolved Solids (mg/L)
172 120 379
Total Suspended Solids (mg/L)
65.6 121 32.49
Zinc (µg/L) 142 169 66.5 ª Partial Dataset
Municipal Separate Storm Sewer System NPDES Permit No. DC0000221 2009 Anacostia River DMR ___________________________________________________________________________
26
Table 8-2 Comparison of Mean Pollutant Concentrations to 2005-2006 Rotation
Varnum and 19th Pl., NE Nash RunStickfoot Sewer O St. Storm Water Pump Station Anacostia High School Gallatin & 14th St., NE Ft. Lincoln- Newton BMP Hickey RunEast Capitol St.
ANACOSTIA SUBWATERSHEDDRY WEATHER SAMPLING(ROTATION 3- RAW DATA)
RL - reporting limitDL - detection limitBRL - below reporting limitn/a - not availableND - non detectNSF - non sufficient flowa Reporting limit for TSS subject to change due to dilutions
Ft. Lincoln- Newton BMP Hickey RunStickfoot Sewer O St. Storm Water Pump Station Anacostia High School Gallatin & 14th St., NE Varnum and 19th Pl., NE Nash Run East Capitol St.
APPENDIX D
Estimation of Runoff Coefficients
Estimation of Runoff Coefficients for Monitored Sewersheds
Runoff coefficients were estimated for each of the nine monitored sewersheds contributing flow to the Anacostia River monitoring sites. Land use and acreage calculations within each sewershed were completed using the ‘Land Use-Existing’ dataset provided by the District of Columbia Office of Planning. This layer is also available to the public at: http://dcatlas.dcgis.dc.gov/catalog/ Weighted average runoff coefficients were assigned to each sewershed using Equation 2 on page 5-16 of the US EPA “Guidance Manual for the Preparation of Part 2 of the NPDES Permit Applications for Discharges from Municipal Separate Storm Sewer Systems”, 1992. The equation is expressed:
Rvi = (∑ AiRv) / (∑ Ai) (Equation 2) Where: Rvi = Weighted Average Runoff Coefficient Rv = Assigned Runoff Coefficient for each land use type Ai = Catchment area (acres) for corresponding land use type Runoff coefficients (Rv) were estimated for each land use type in the District of Columbia by taking into consideration both the runoff coefficient ranges for various land use types presented in exhibit 3-12 on page 57 of the US EPA “NPDES Stormwater Sampling Guidance Document”, and runoff coefficient values used associated with District of Columbia zoning categories used in previous DMR’s. Where the US EPA suggested runoff coefficients from Exhibit 3-12 did not contain a corresponding runoff coefficient range for a District of Columbia land use category, the corresponding code from a previous DMR was used as a substitute. Final runoff coefficient values by land use type are given in Table 1. Weighted average runoff coefficients for each site were estimated using Table A1.
Table A1. Estimated Runoff Coefficients for District of Columbia
Existing Land Use Categories
Land Use Code Description Rv C, O Commercial (ac) 0.85 LDR Low Density Residential 0.5 LMDR Low Medium Density Residential 0.65 MDR Medium Density Residential 0.77 HDR High Density Residential 0.85 FP Federal Public Land 0.77 I Industrial 0.95 TCU Transport/Communications/Utilities 0.95 LP Local Public 0.77 MU Mixed Use 0.905 PQP-I Public-Quasi Public Institutional 0.8 R Parks and Open Space 0.35 S Institutional 0.8 TROW Transportation Right of Way 0.85 ALLEYS alleys 0.95 MEDIAN Median 0.3 PARKING Parking 0.95 ROADS Roads 0.95 TRAFFICS TRAFFIC 0.95