40
Investor Presentation
| Date post: | 02-Mar-2019 |
| Category: |
Documents |
| Upload: | vuongkhuong |
| View: | 214 times |
| Download: | 0 times |
InvestorPresentation
Forward - Looking Statements
2
This presentation may contain certain forward-looking statements concerning our future performance and should be considered as good
faith estimates made by the Company. These forward-looking statements reflect management expectations and are based upon currently available data. Actual results are subject to future events and uncertainties, which
could materially impact the Company’s actual performance.
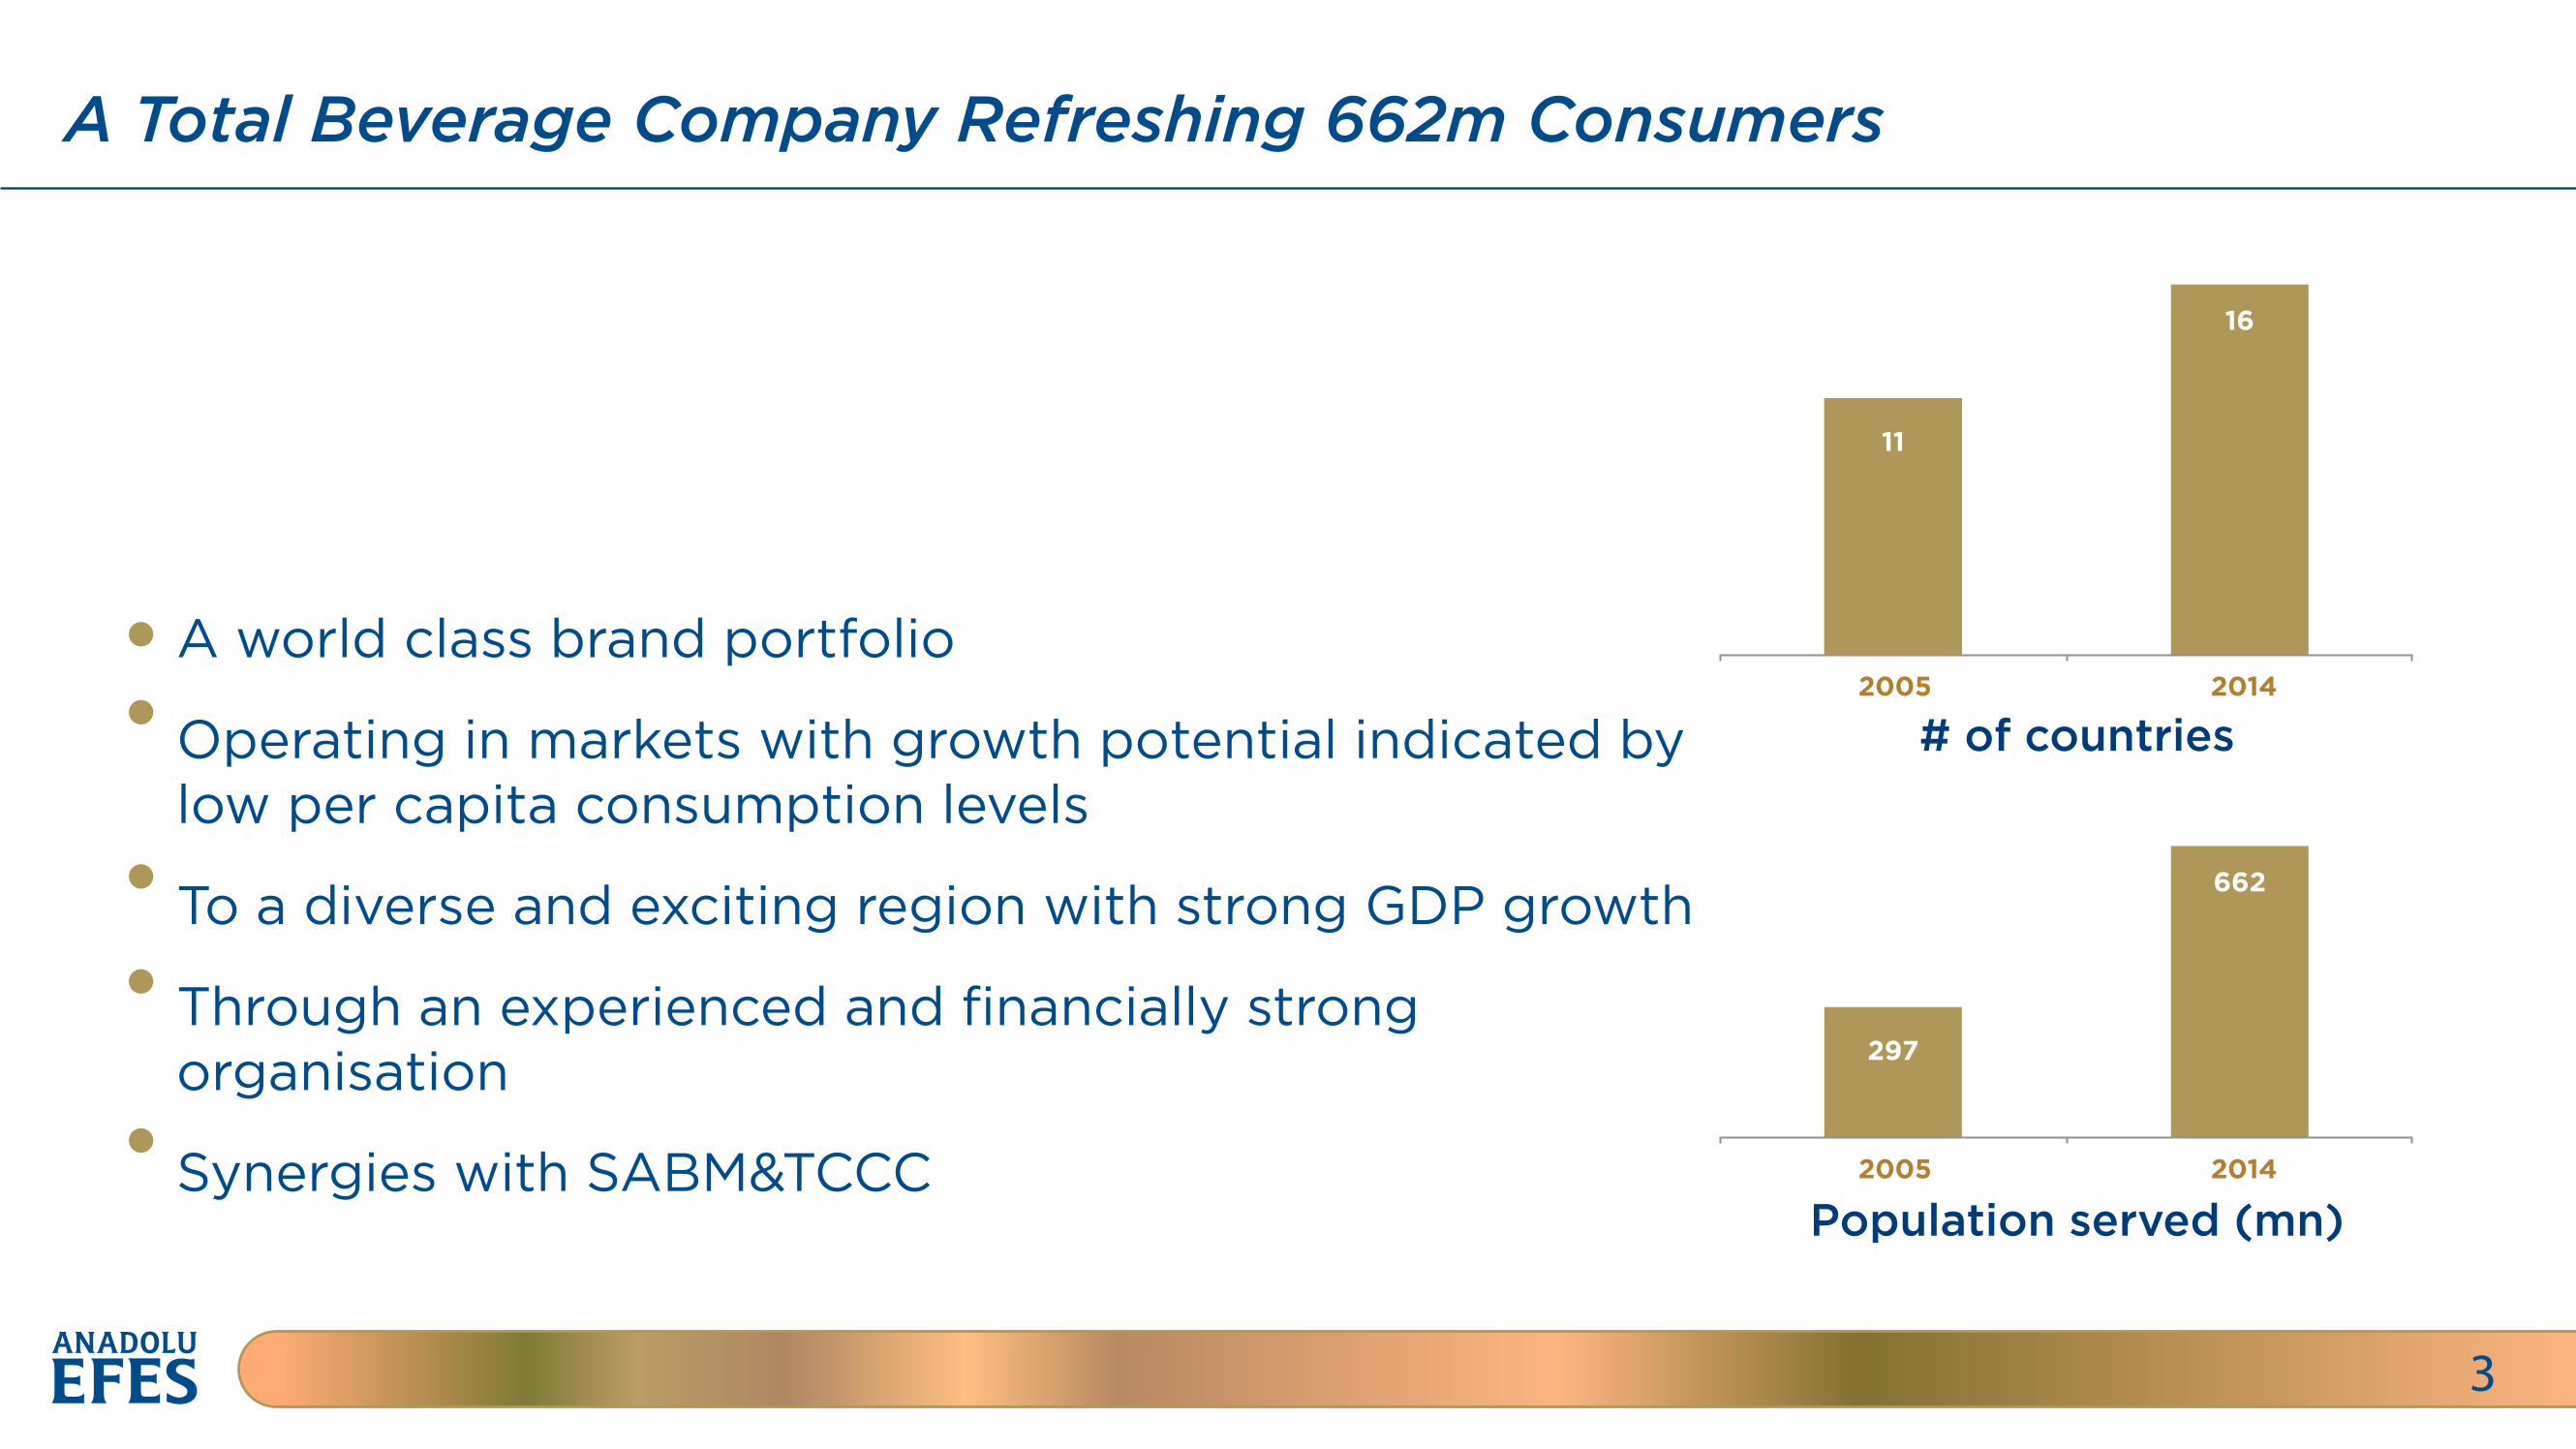
A Total Beverage Company Refreshing 662m Consumers
3
A world class brand portfolio
Operating in markets with growth potential indicated by low per capita consumption levels
To a diverse and exciting region with strong GDP growth
Through an experienced and financially strong organisation
Synergies with SABM&TCCC
2005 2014
16
# of countries
2005
297
2014
662
Population served (mn)
11
Public
25.9%
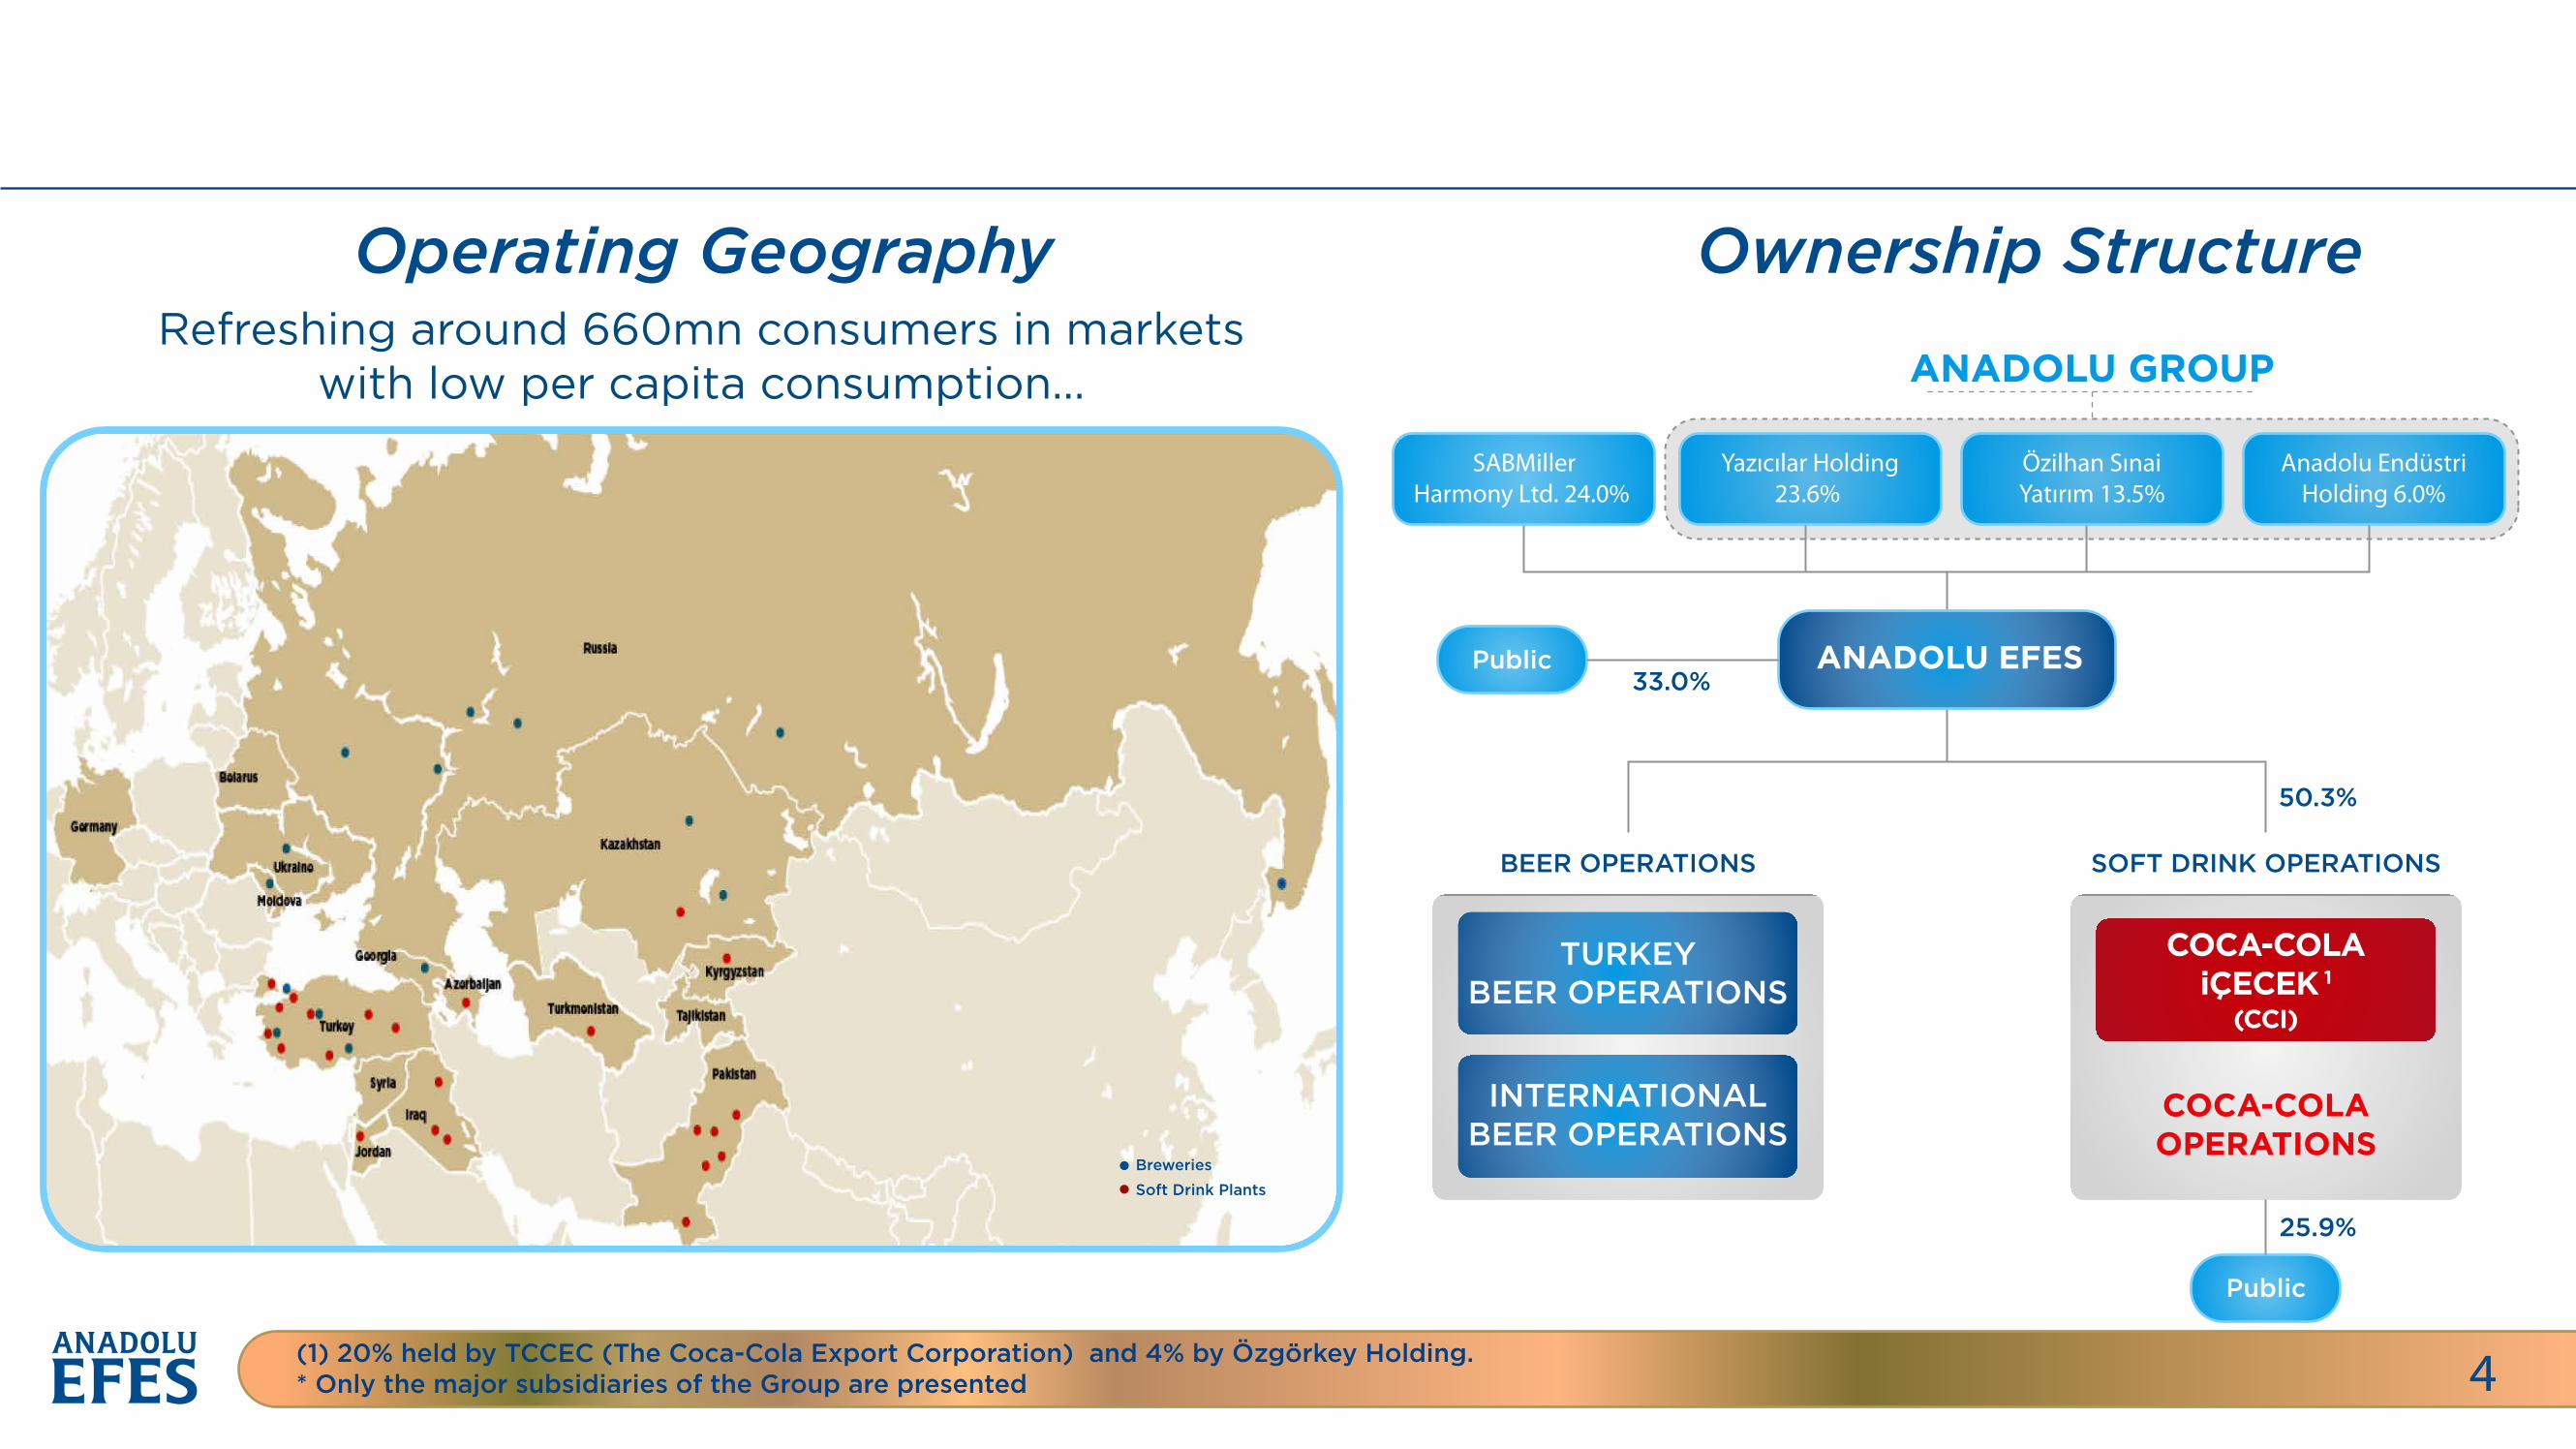
Operating Geography Ownership Structure
4
Refreshing around 660mn consumers in markets with low per capita consumption... ANADOLU GROUP
SABMillerHarmony Ltd. 24.0%
Yazıcılar Holding23.6%
Özilhan SınaiYatırım 13.5%
Anadolu EndüstriHolding 6.0%
ANADOLU EFES33.0%
50.3%
Public
BEER OPERATIONS SOFT DRINK OPERATIONS
(1) 20% held by TCCEC (The Coca-Cola Export Corporation) and 4% by Özgörkey Holding.* Only the major subsidiaries of the Group are presented
TURKEYBEER OPERATIONS
INTERNATIONALBEER OPERATIONS
COCA-COLAOPERATIONS
COCA-COLAiÇECEK 1
(CCI)
Breweries
Soft Drink Plants
Strong History Of Growth
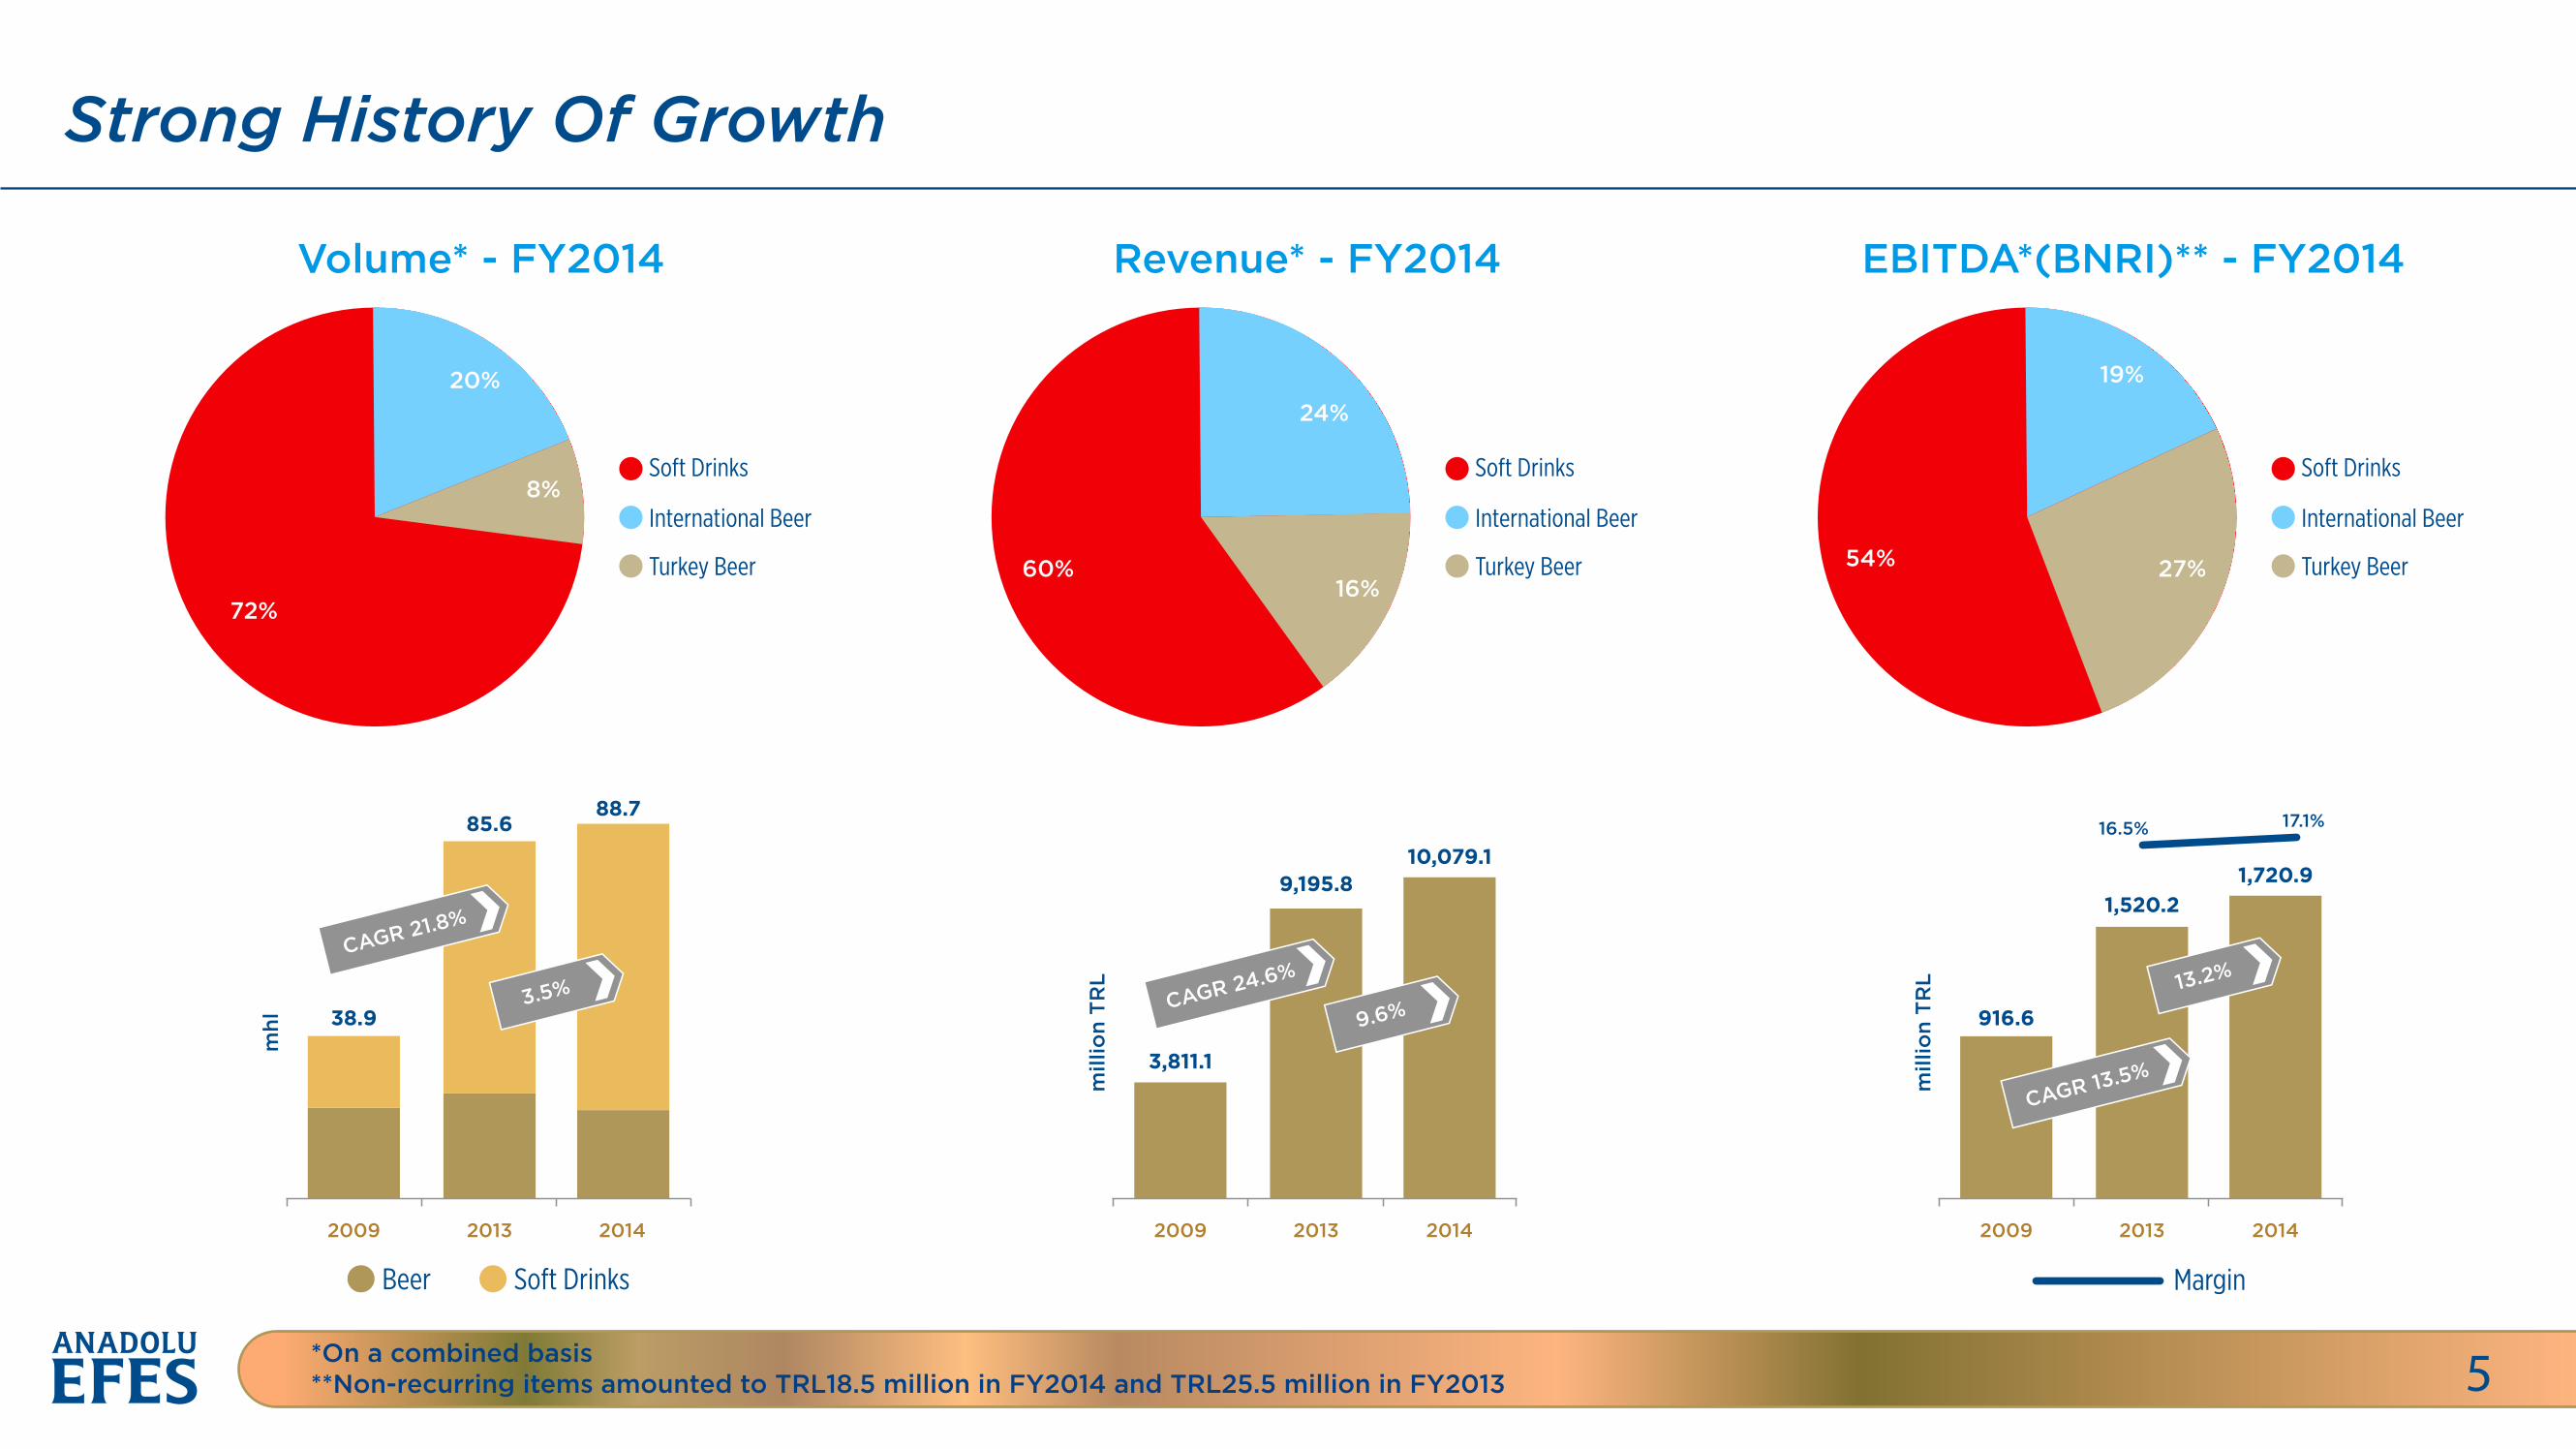
5*On a combined basis**Non-recurring items amounted to TRL18.5 million in FY2014 and TRL25.5 million in FY2013
Volume* - FY2014
20%
8%
72%
Soft Drinks
International Beer
Turkey Beer
Revenue* - FY2014
24%
16% 60%
Soft Drinks
International Beer
Turkey Beer
EBITDA*(BNRI)** - FY2014
19%
27% 54%
Soft Drinks
International Beer
Turkey Beer
Beer Soft Drinks
mhl
2009 2013 2014
38.9
85.688.7
CAGR 21.8%
3.5%
16.5% 17.1%
Margin
mill
ion
TR
L
2009 2013 2014
3,811.1
9,195.810,079.1
CAGR 24.6%
9.6%
mill
ion
TR
L
2009 2013 2014
916.6
1,520.21,720.9
CAGR 13.5%
13.2%
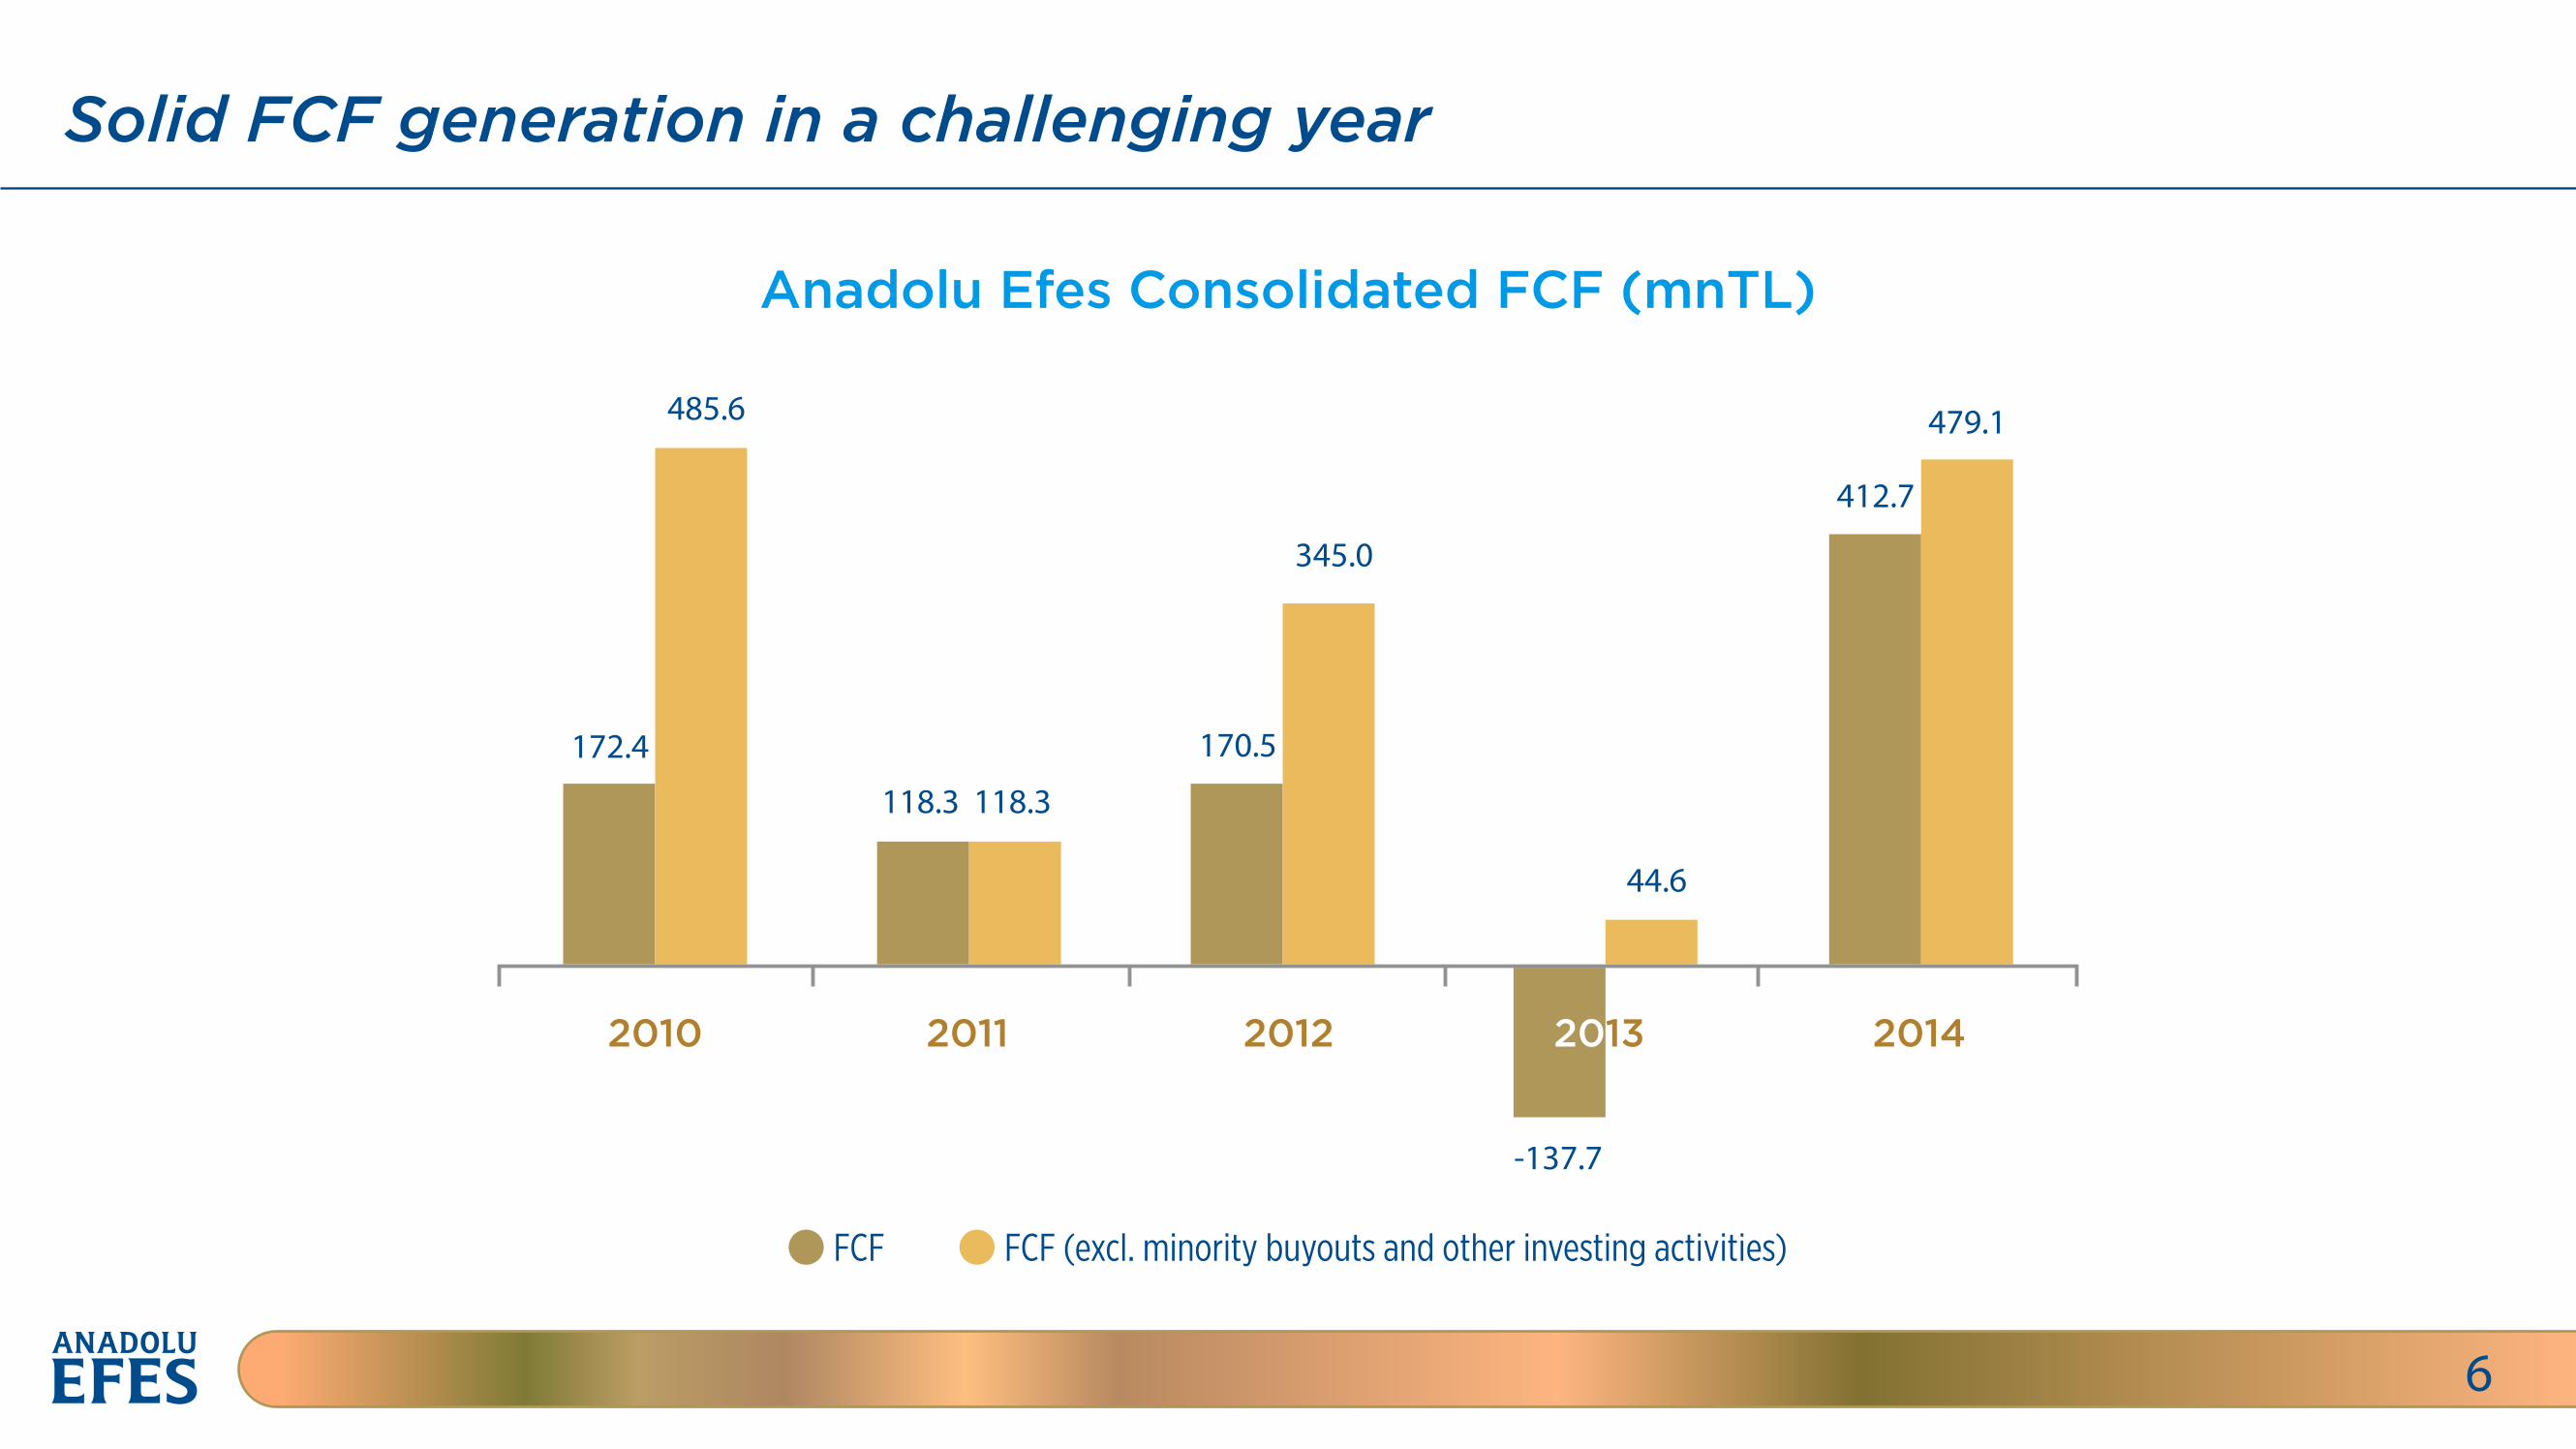
FCF FCF (excl. minority buyouts and other investing activities)
Solid FCF generation in a challenging year
6
2010 2011 2012 2013 2014
172.4
485.6
118.3 118.3
170.5
-137.7
44.6
412.7
479.1
345.0
Anadolu Efes Consolidated FCF (mnTL)
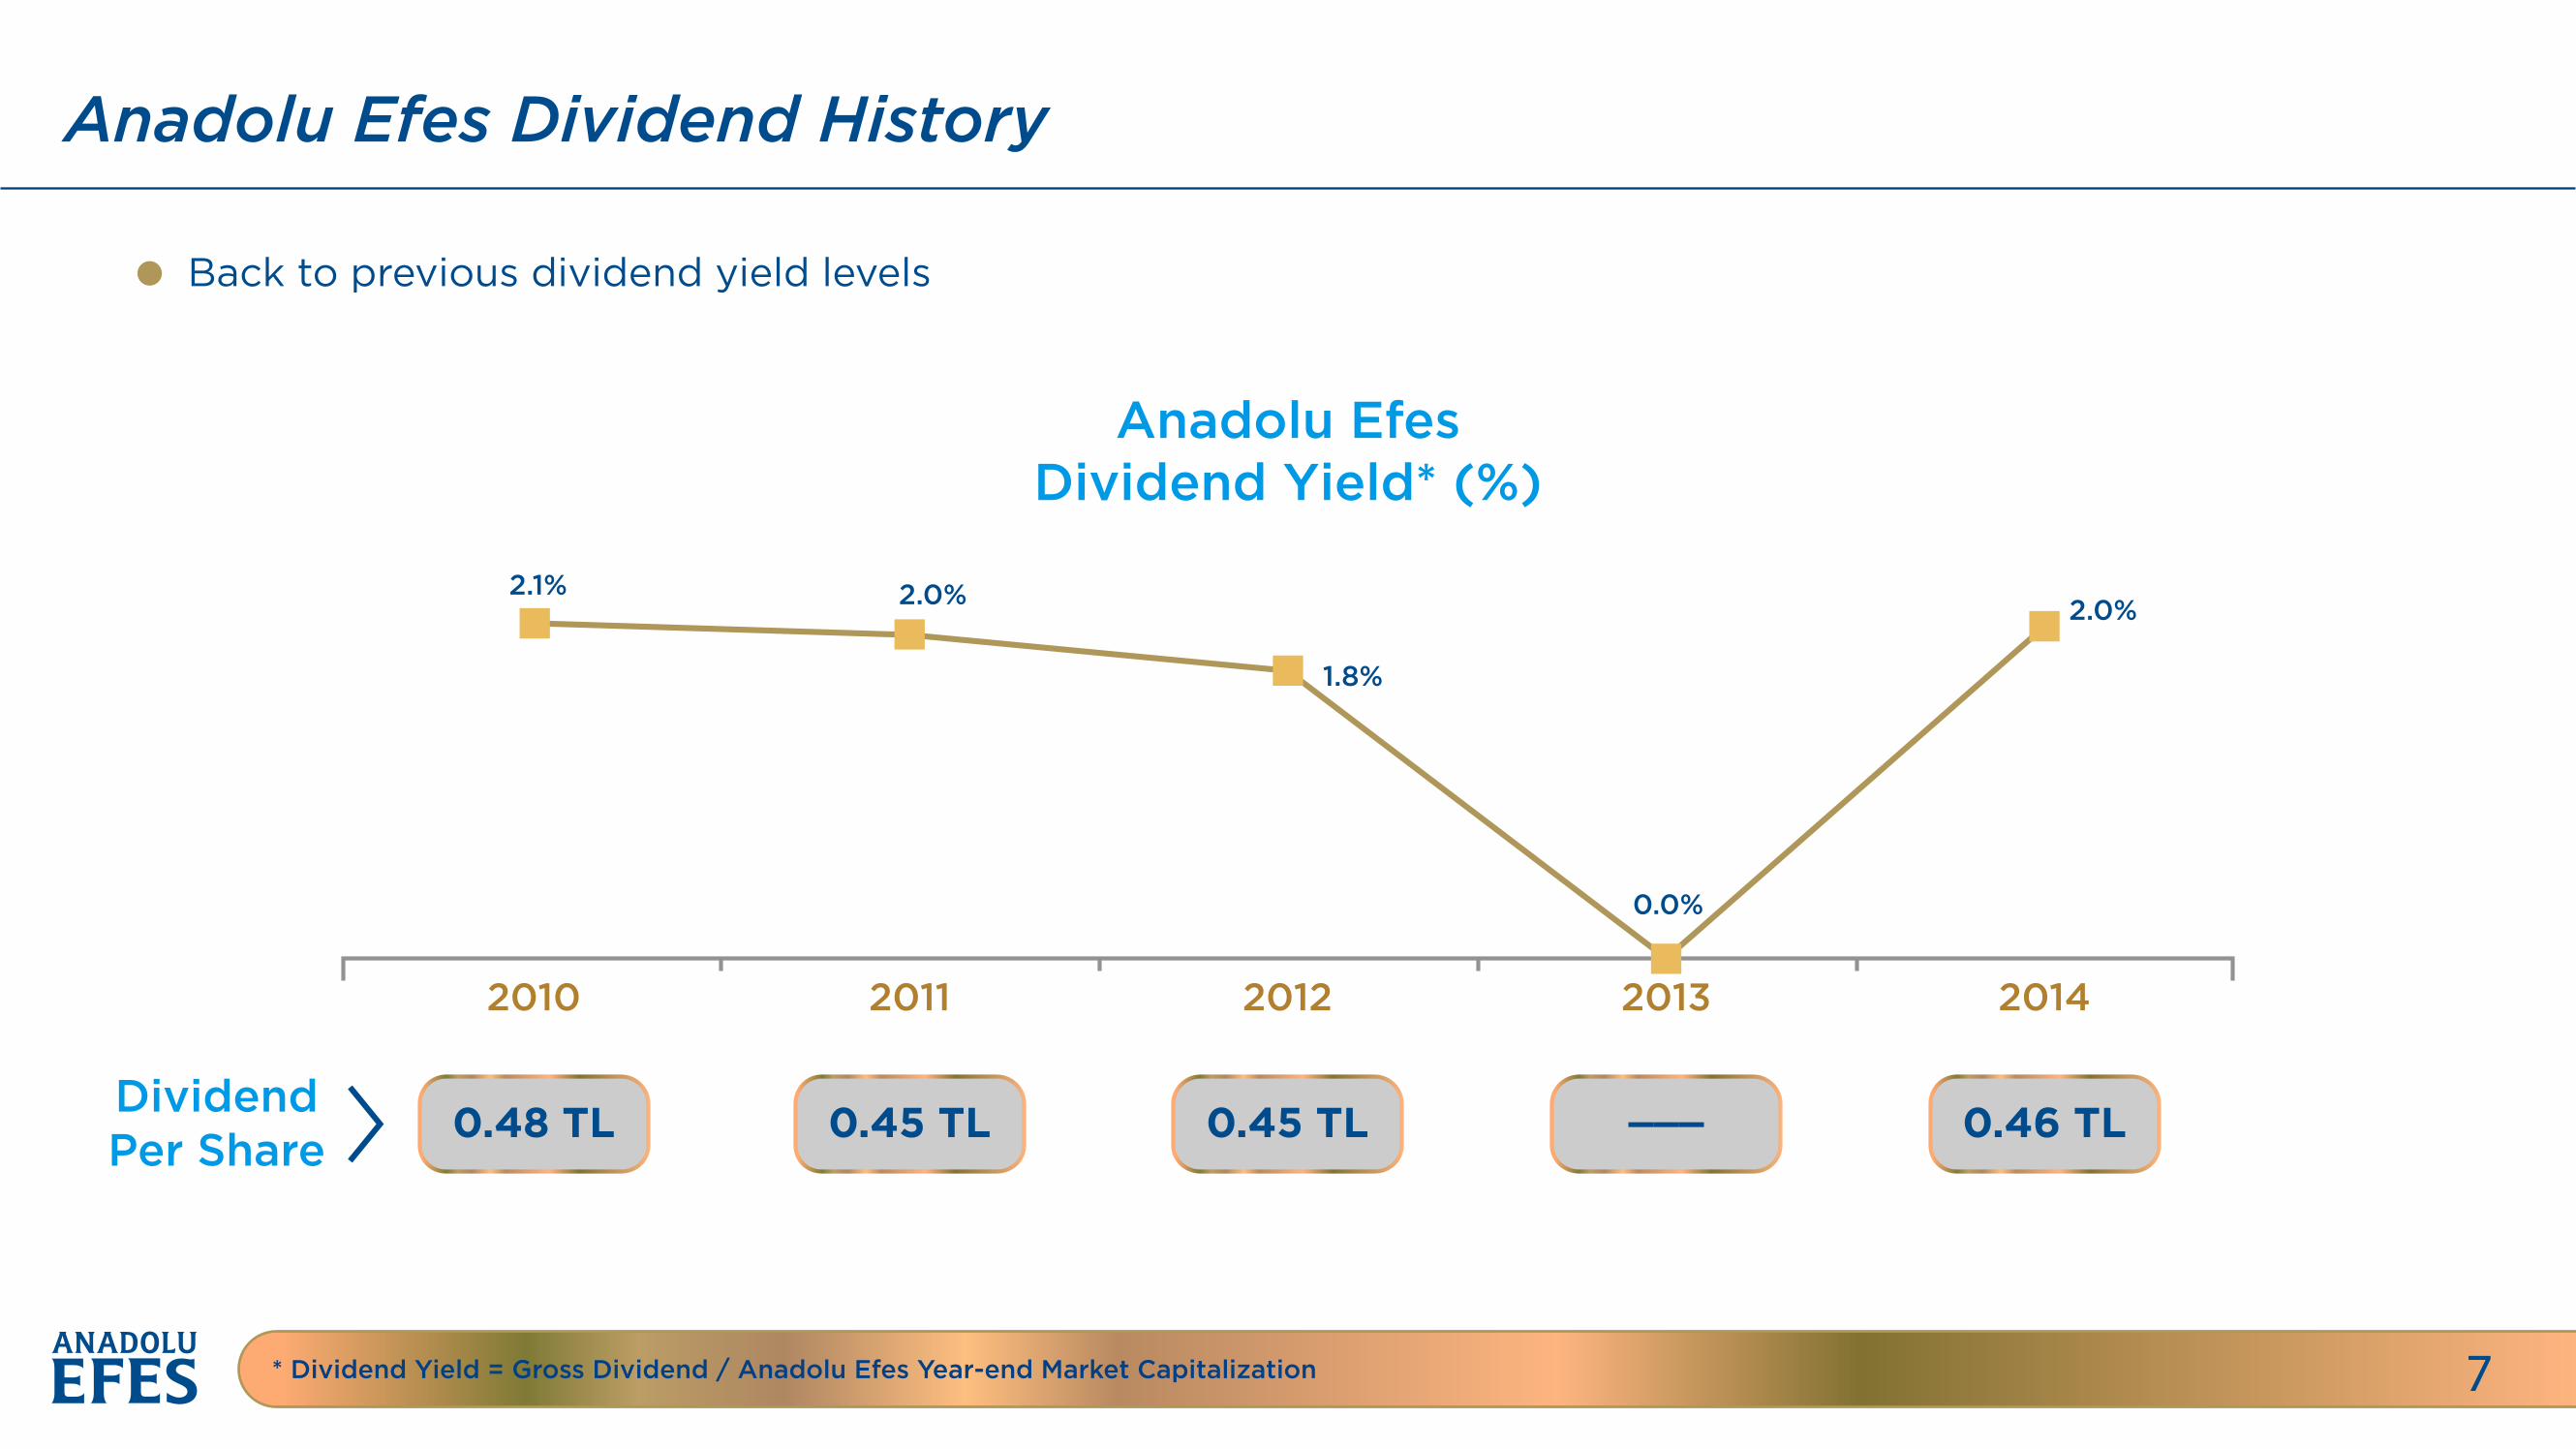
Anadolu Efes Dividend History
7
Back to previous dividend yield levels
DividendPer Share
* Dividend Yield = Gross Dividend / Anadolu Efes Year-end Market Capitalization
Anadolu EfesDividend Yield* (%)
0.48 TL 0.45 TL 0.45 TL 0.46 TL___
2.1% 2.0%
1.8%
0.0%
2.0%
2010 2011 2012 2013 2014
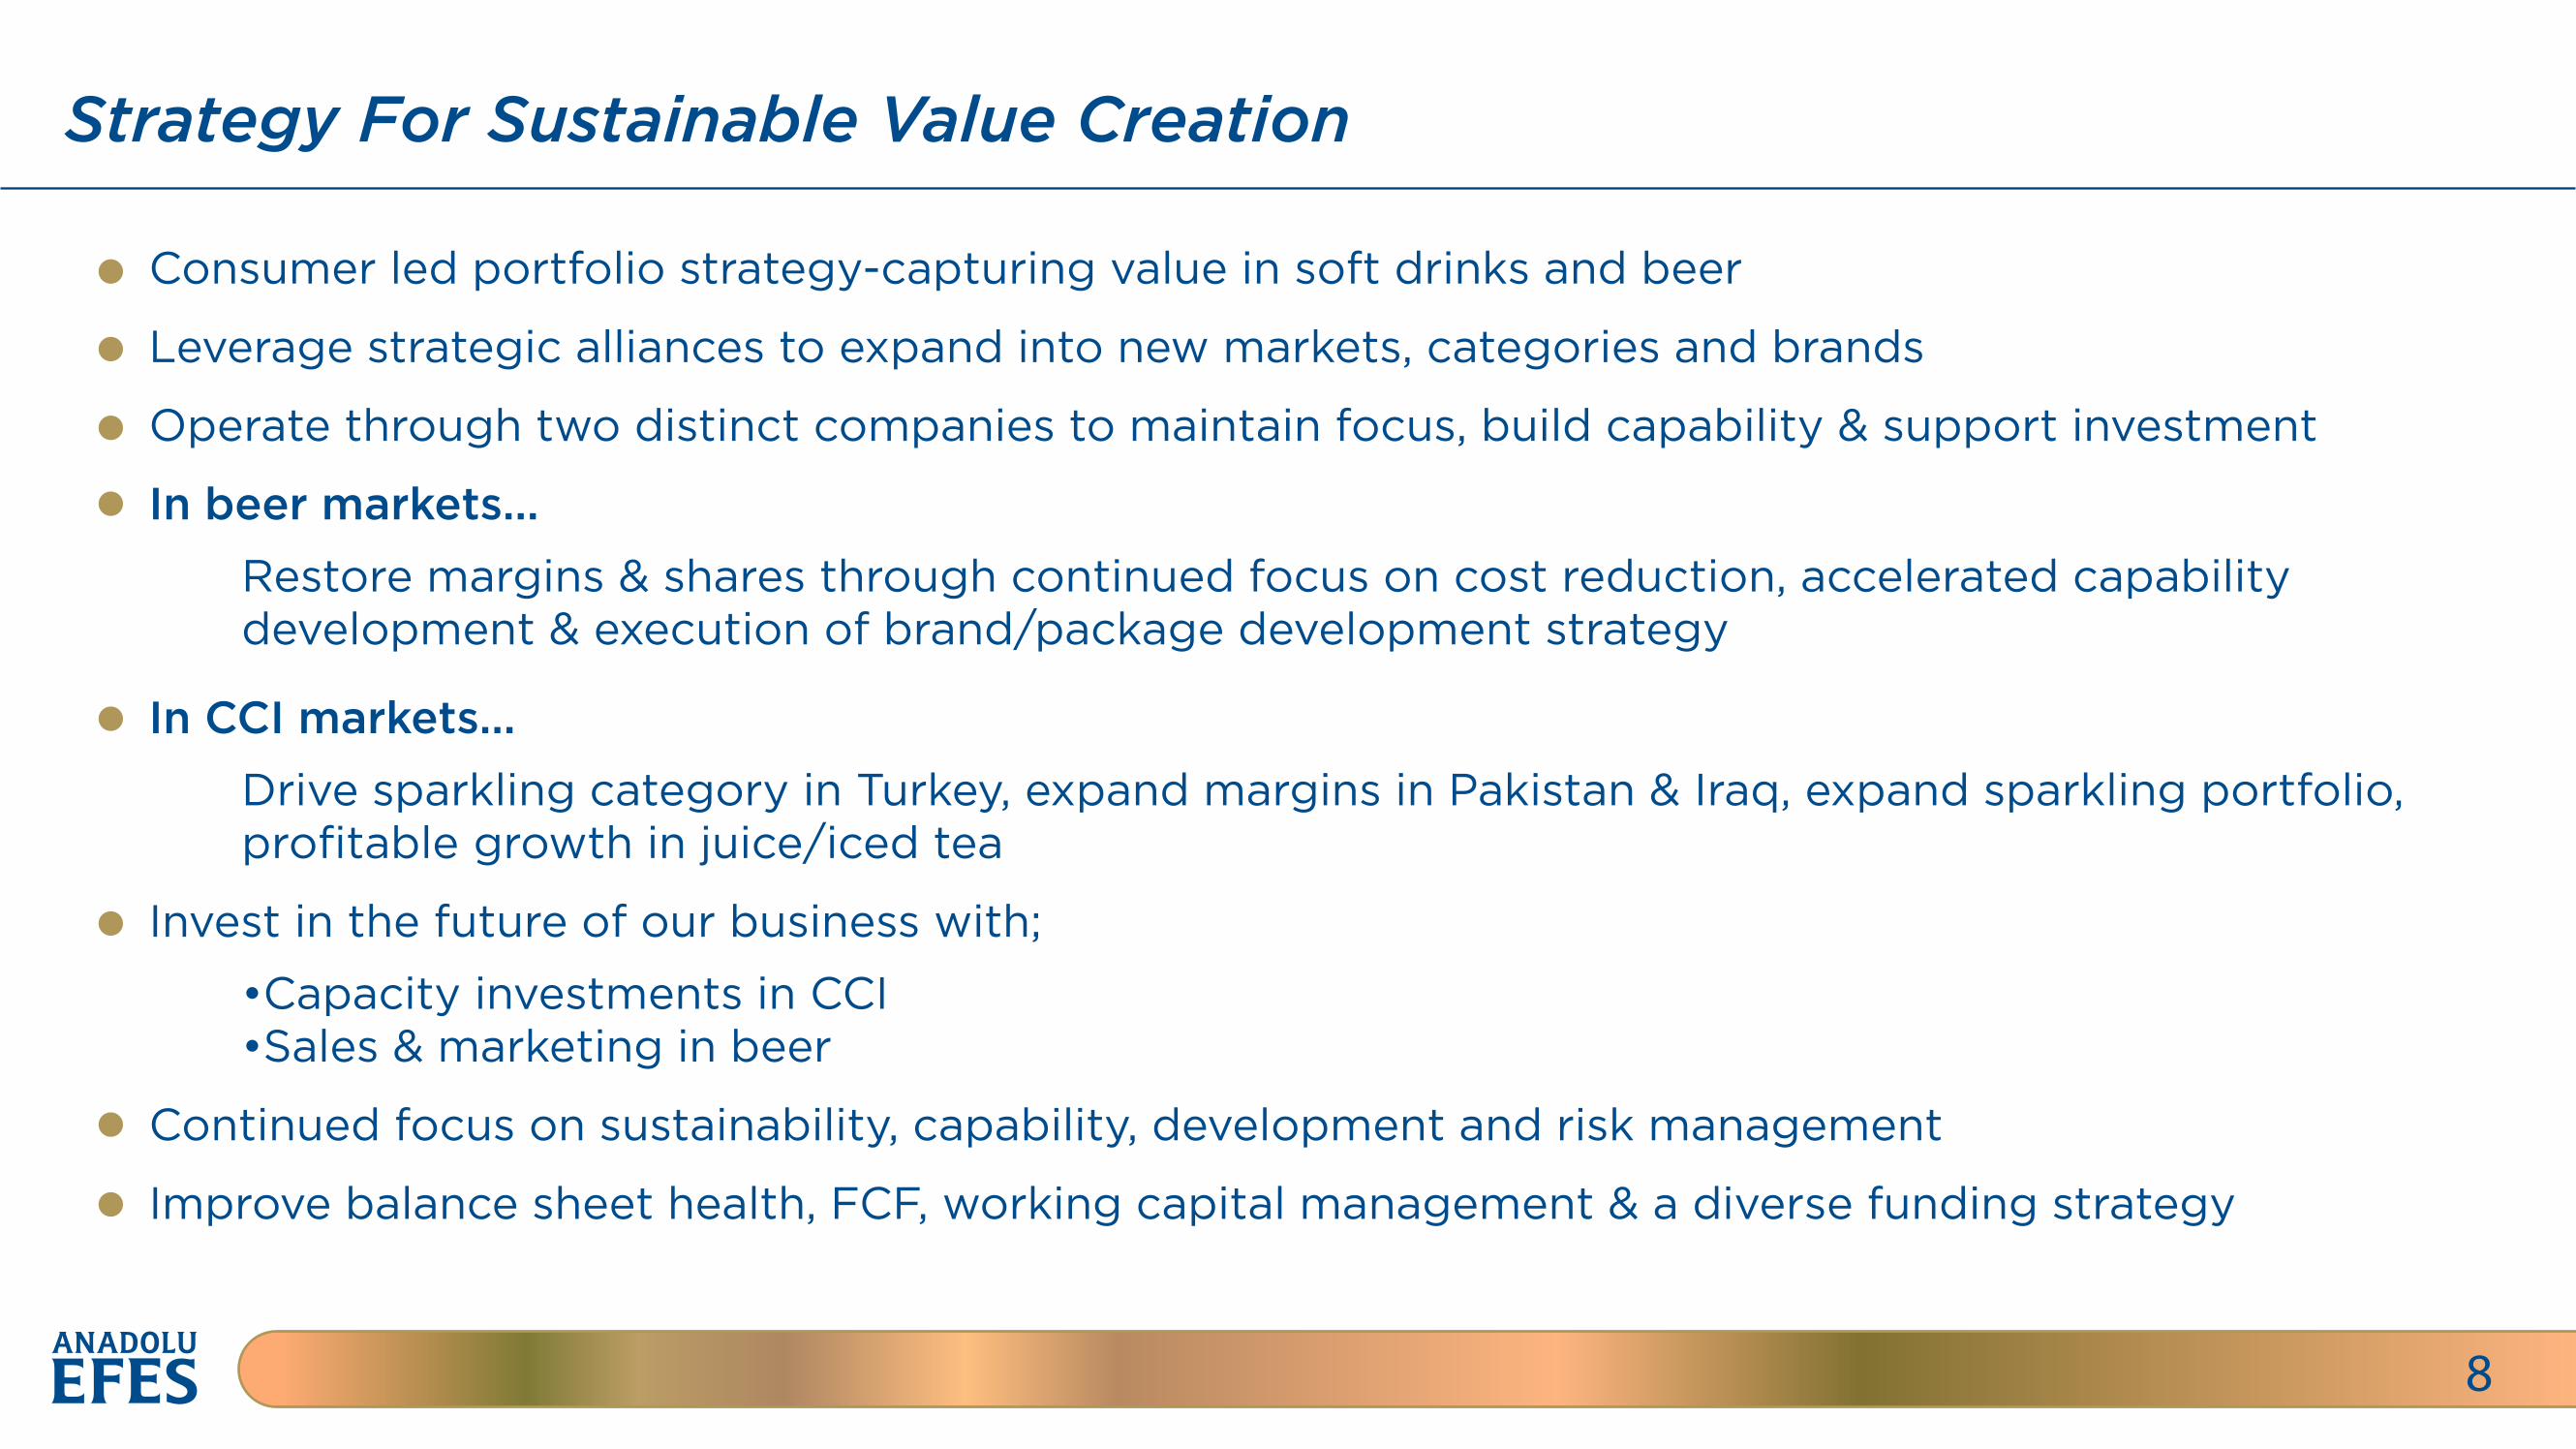
Strategy For Sustainable Value Creation
8
Consumer led portfolio strategy-capturing value in soft drinks and beer
Leverage strategic alliances to expand into new markets, categories and brands
Operate through two distinct companies to maintain focus, build capability & support investment
In beer markets... Restore margins & shares through continued focus on cost reduction, accelerated capability development & execution of brand/package development strategy
In CCI markets... Drive sparkling category in Turkey, expand margins in Pakistan & Iraq, expand sparkling portfolio, profitable growth in juice/iced tea
Invest in the future of our business with;
•Capacity investments in CCI •Sales & marketing in beer
Continued focus on sustainability, capability, development and risk management
Improve balance sheet health, FCF, working capital management & a diverse funding strategy
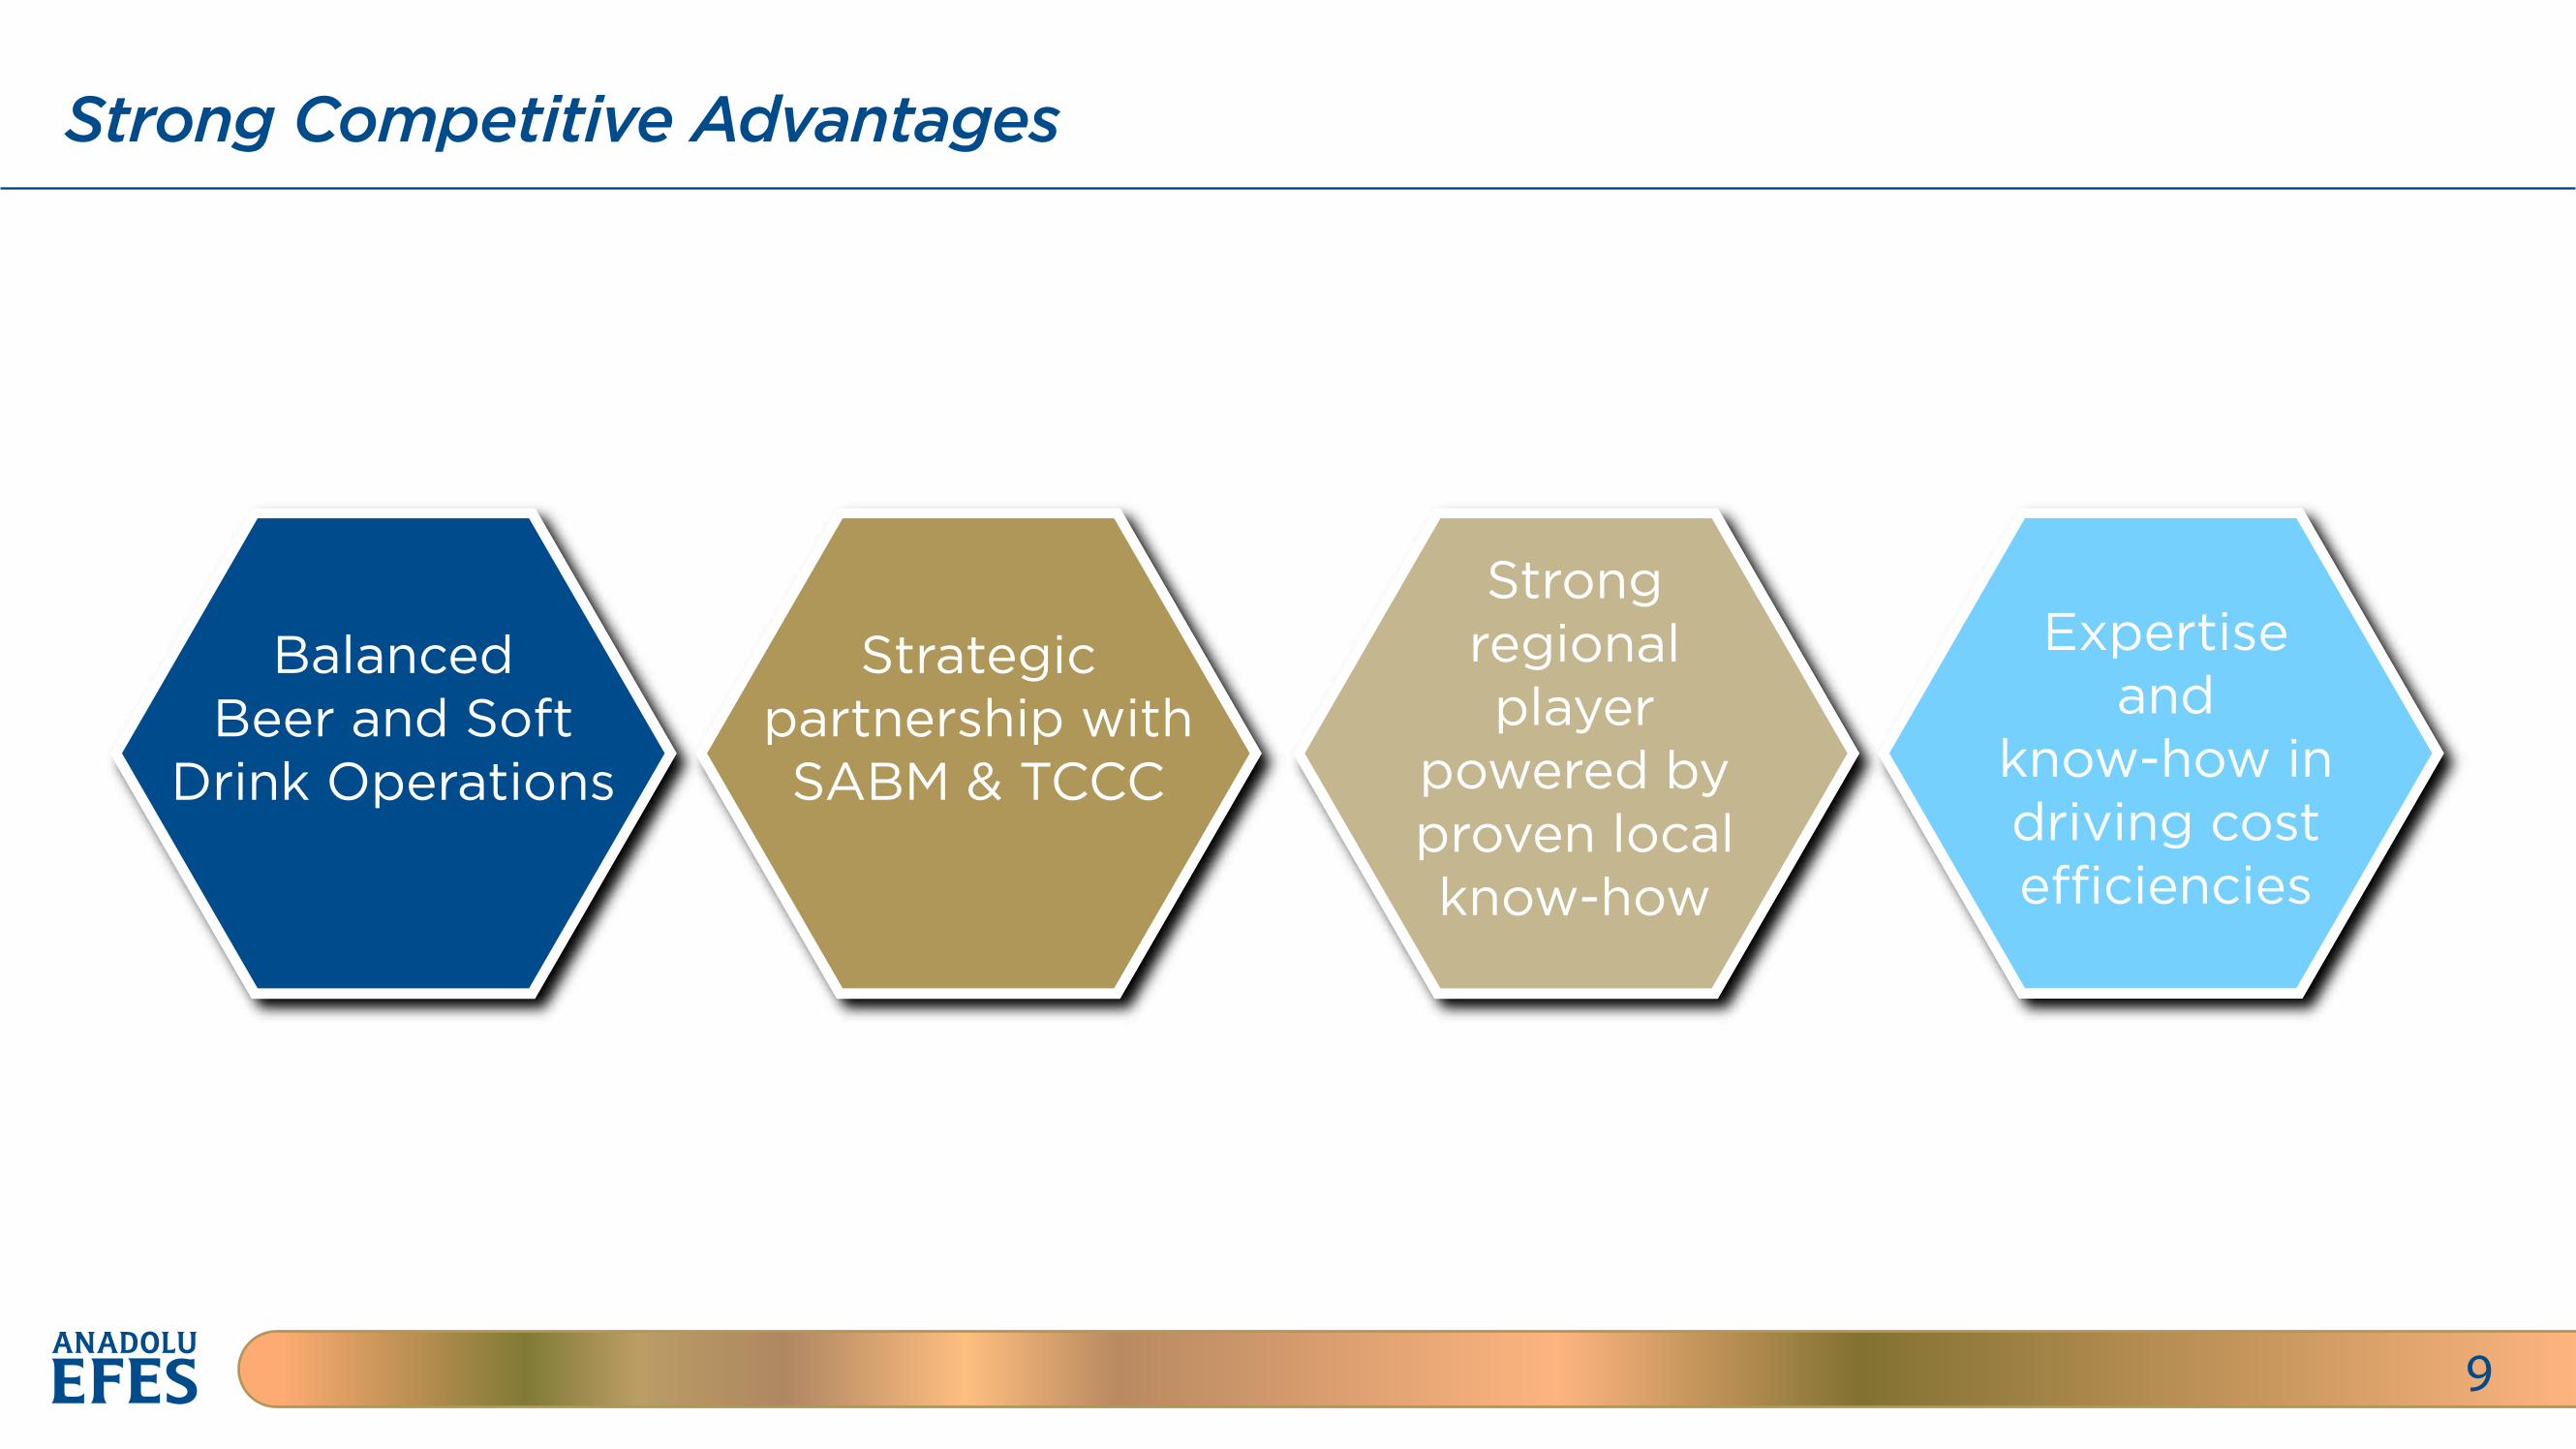
Strong Competitive Advantages
9
Balanced Beer and Soft
Drink Operations
Strong regional player
powered by proven local know-how
Expertise and
know-how in driving cost e�ciencies
Strategic partnership with SABM & TCCC
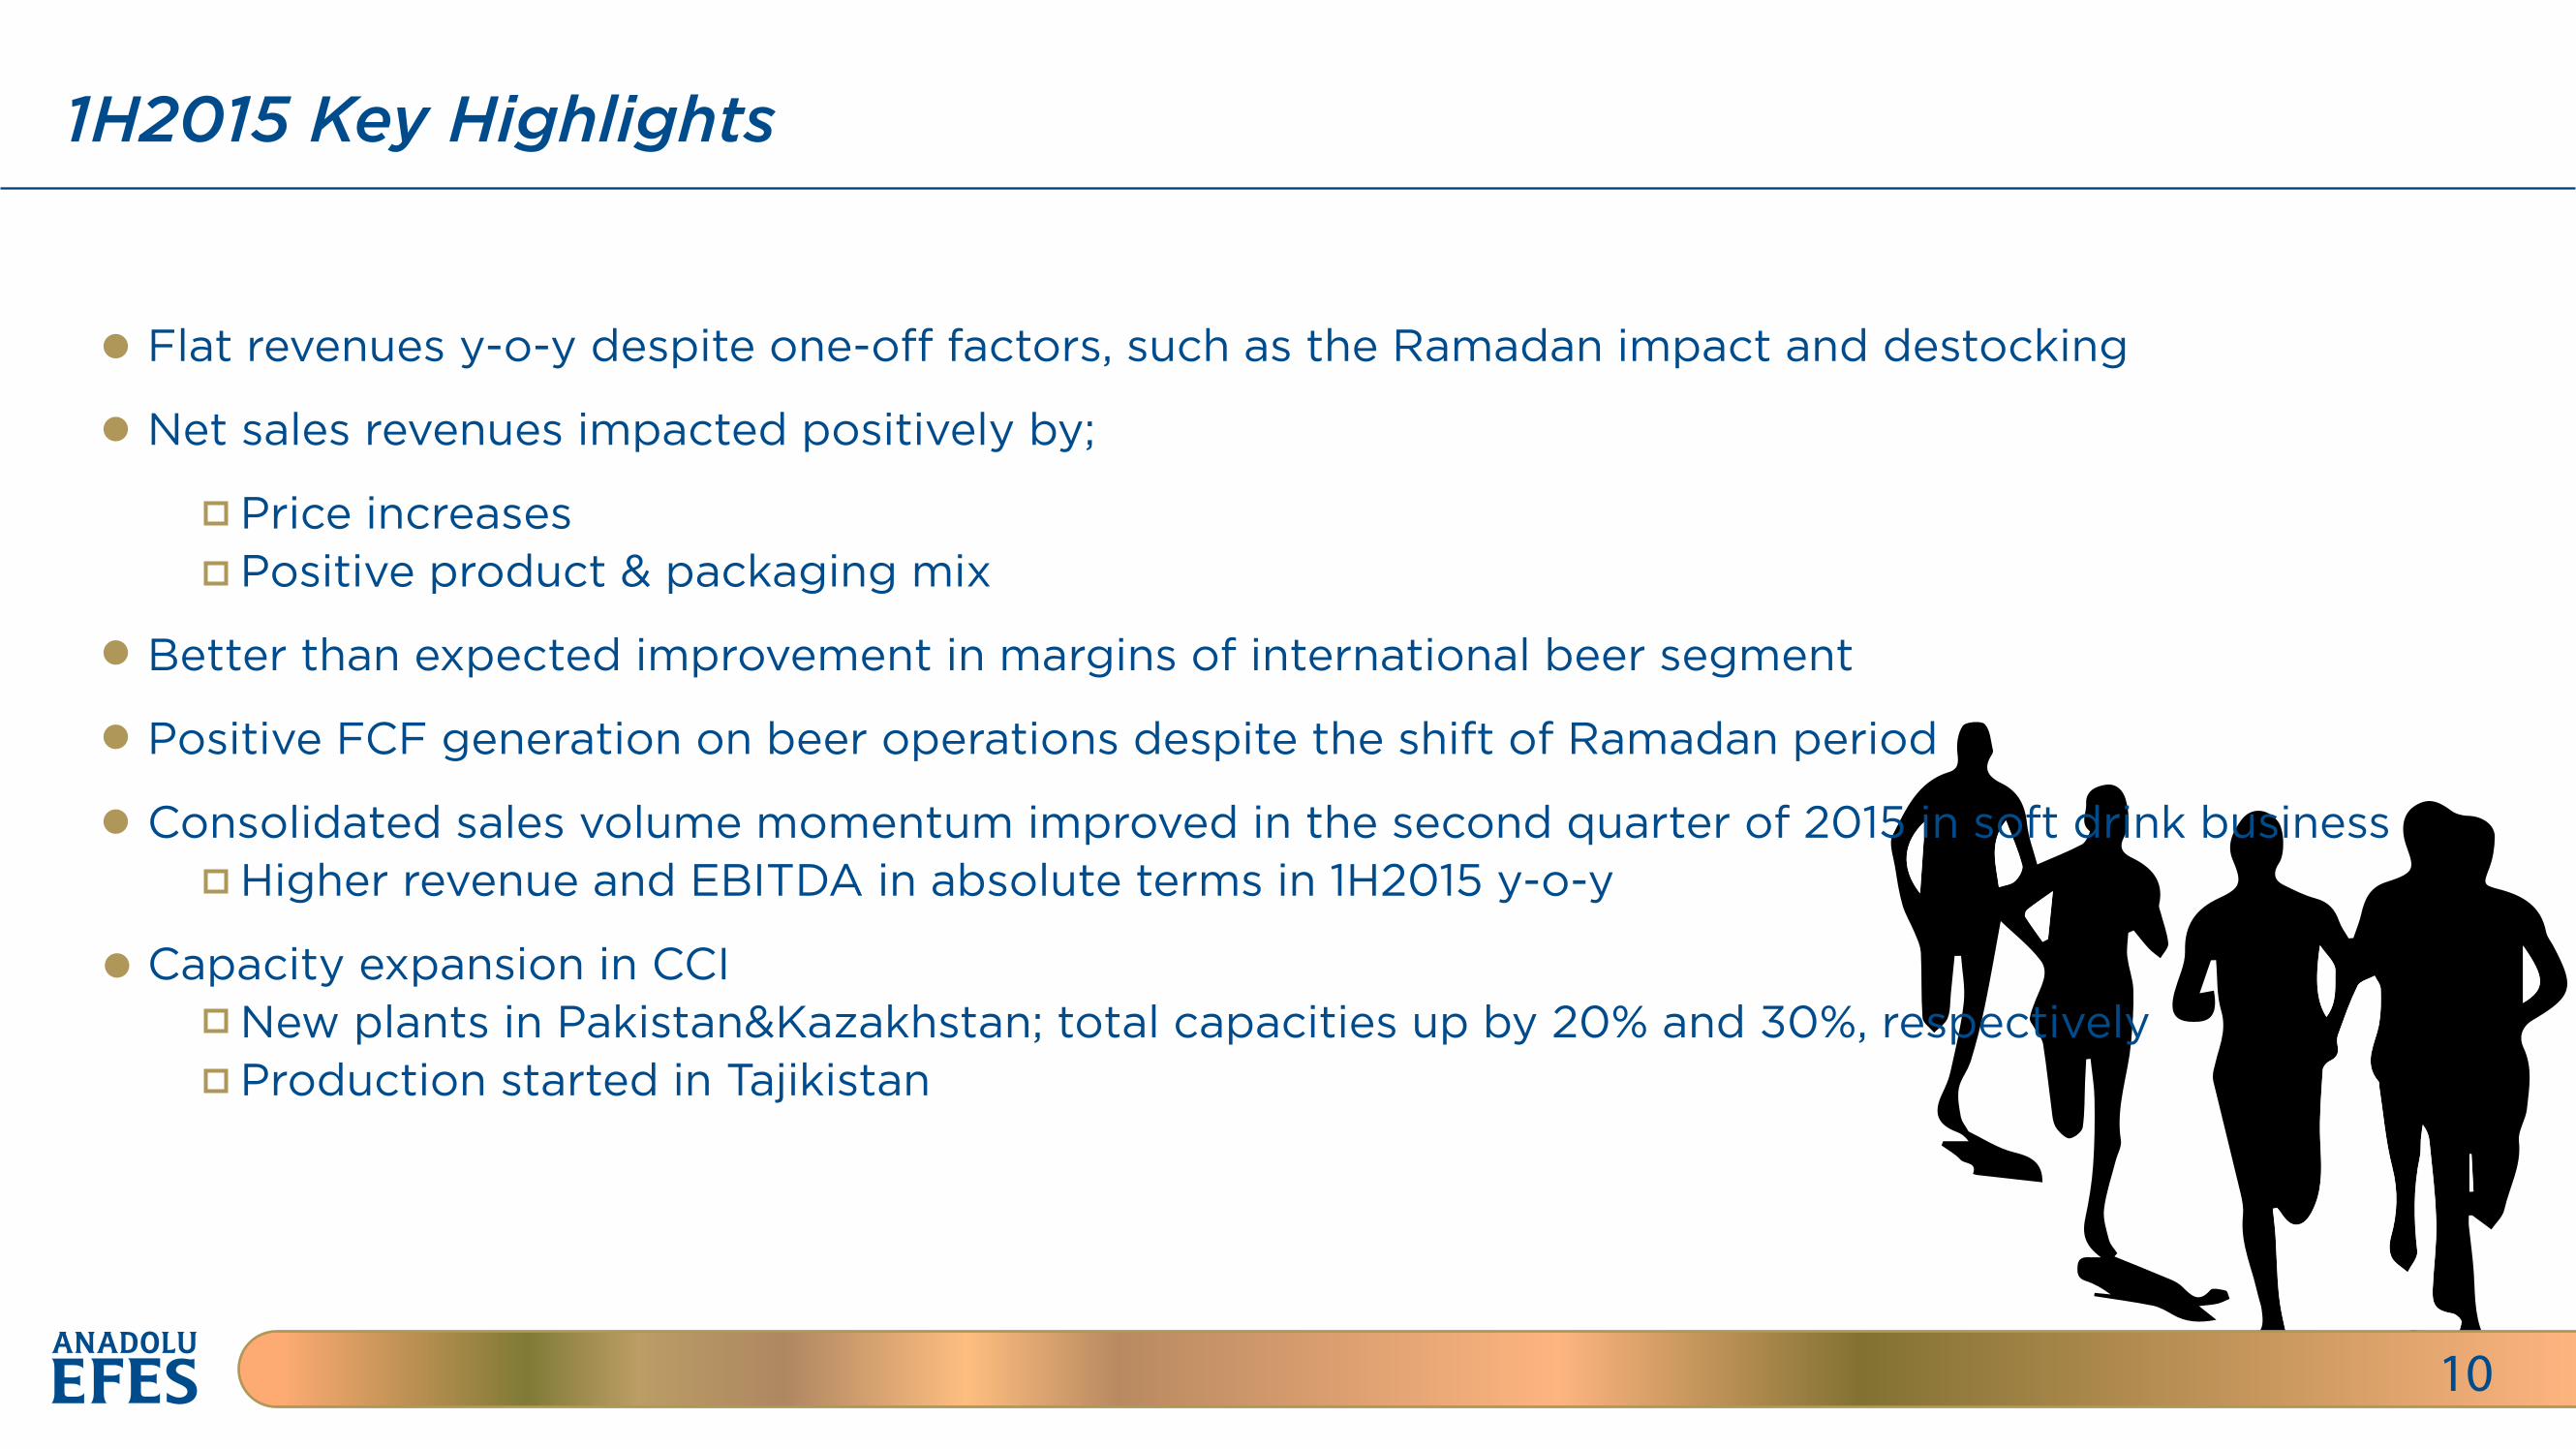
1H2015 Key Highlights
10
Flat revenues y-o-y despite one-o� factors, such as the Ramadan impact and destocking
Net sales revenues impacted positively by;
Price increases Positive product & packaging mix
Better than expected improvement in margins of international beer segment
Positive FCF generation on beer operations despite the shift of Ramadan period
Consolidated sales volume momentum improved in the second quarter of 2015 in soft drink business Higher revenue and EBITDA in absolute terms in 1H2015 y-o-y
Capacity expansion in CCI New plants in Pakistan&Kazakhstan; total capacities up by 20% and 30%, respectively Production started in Tajikistan
11
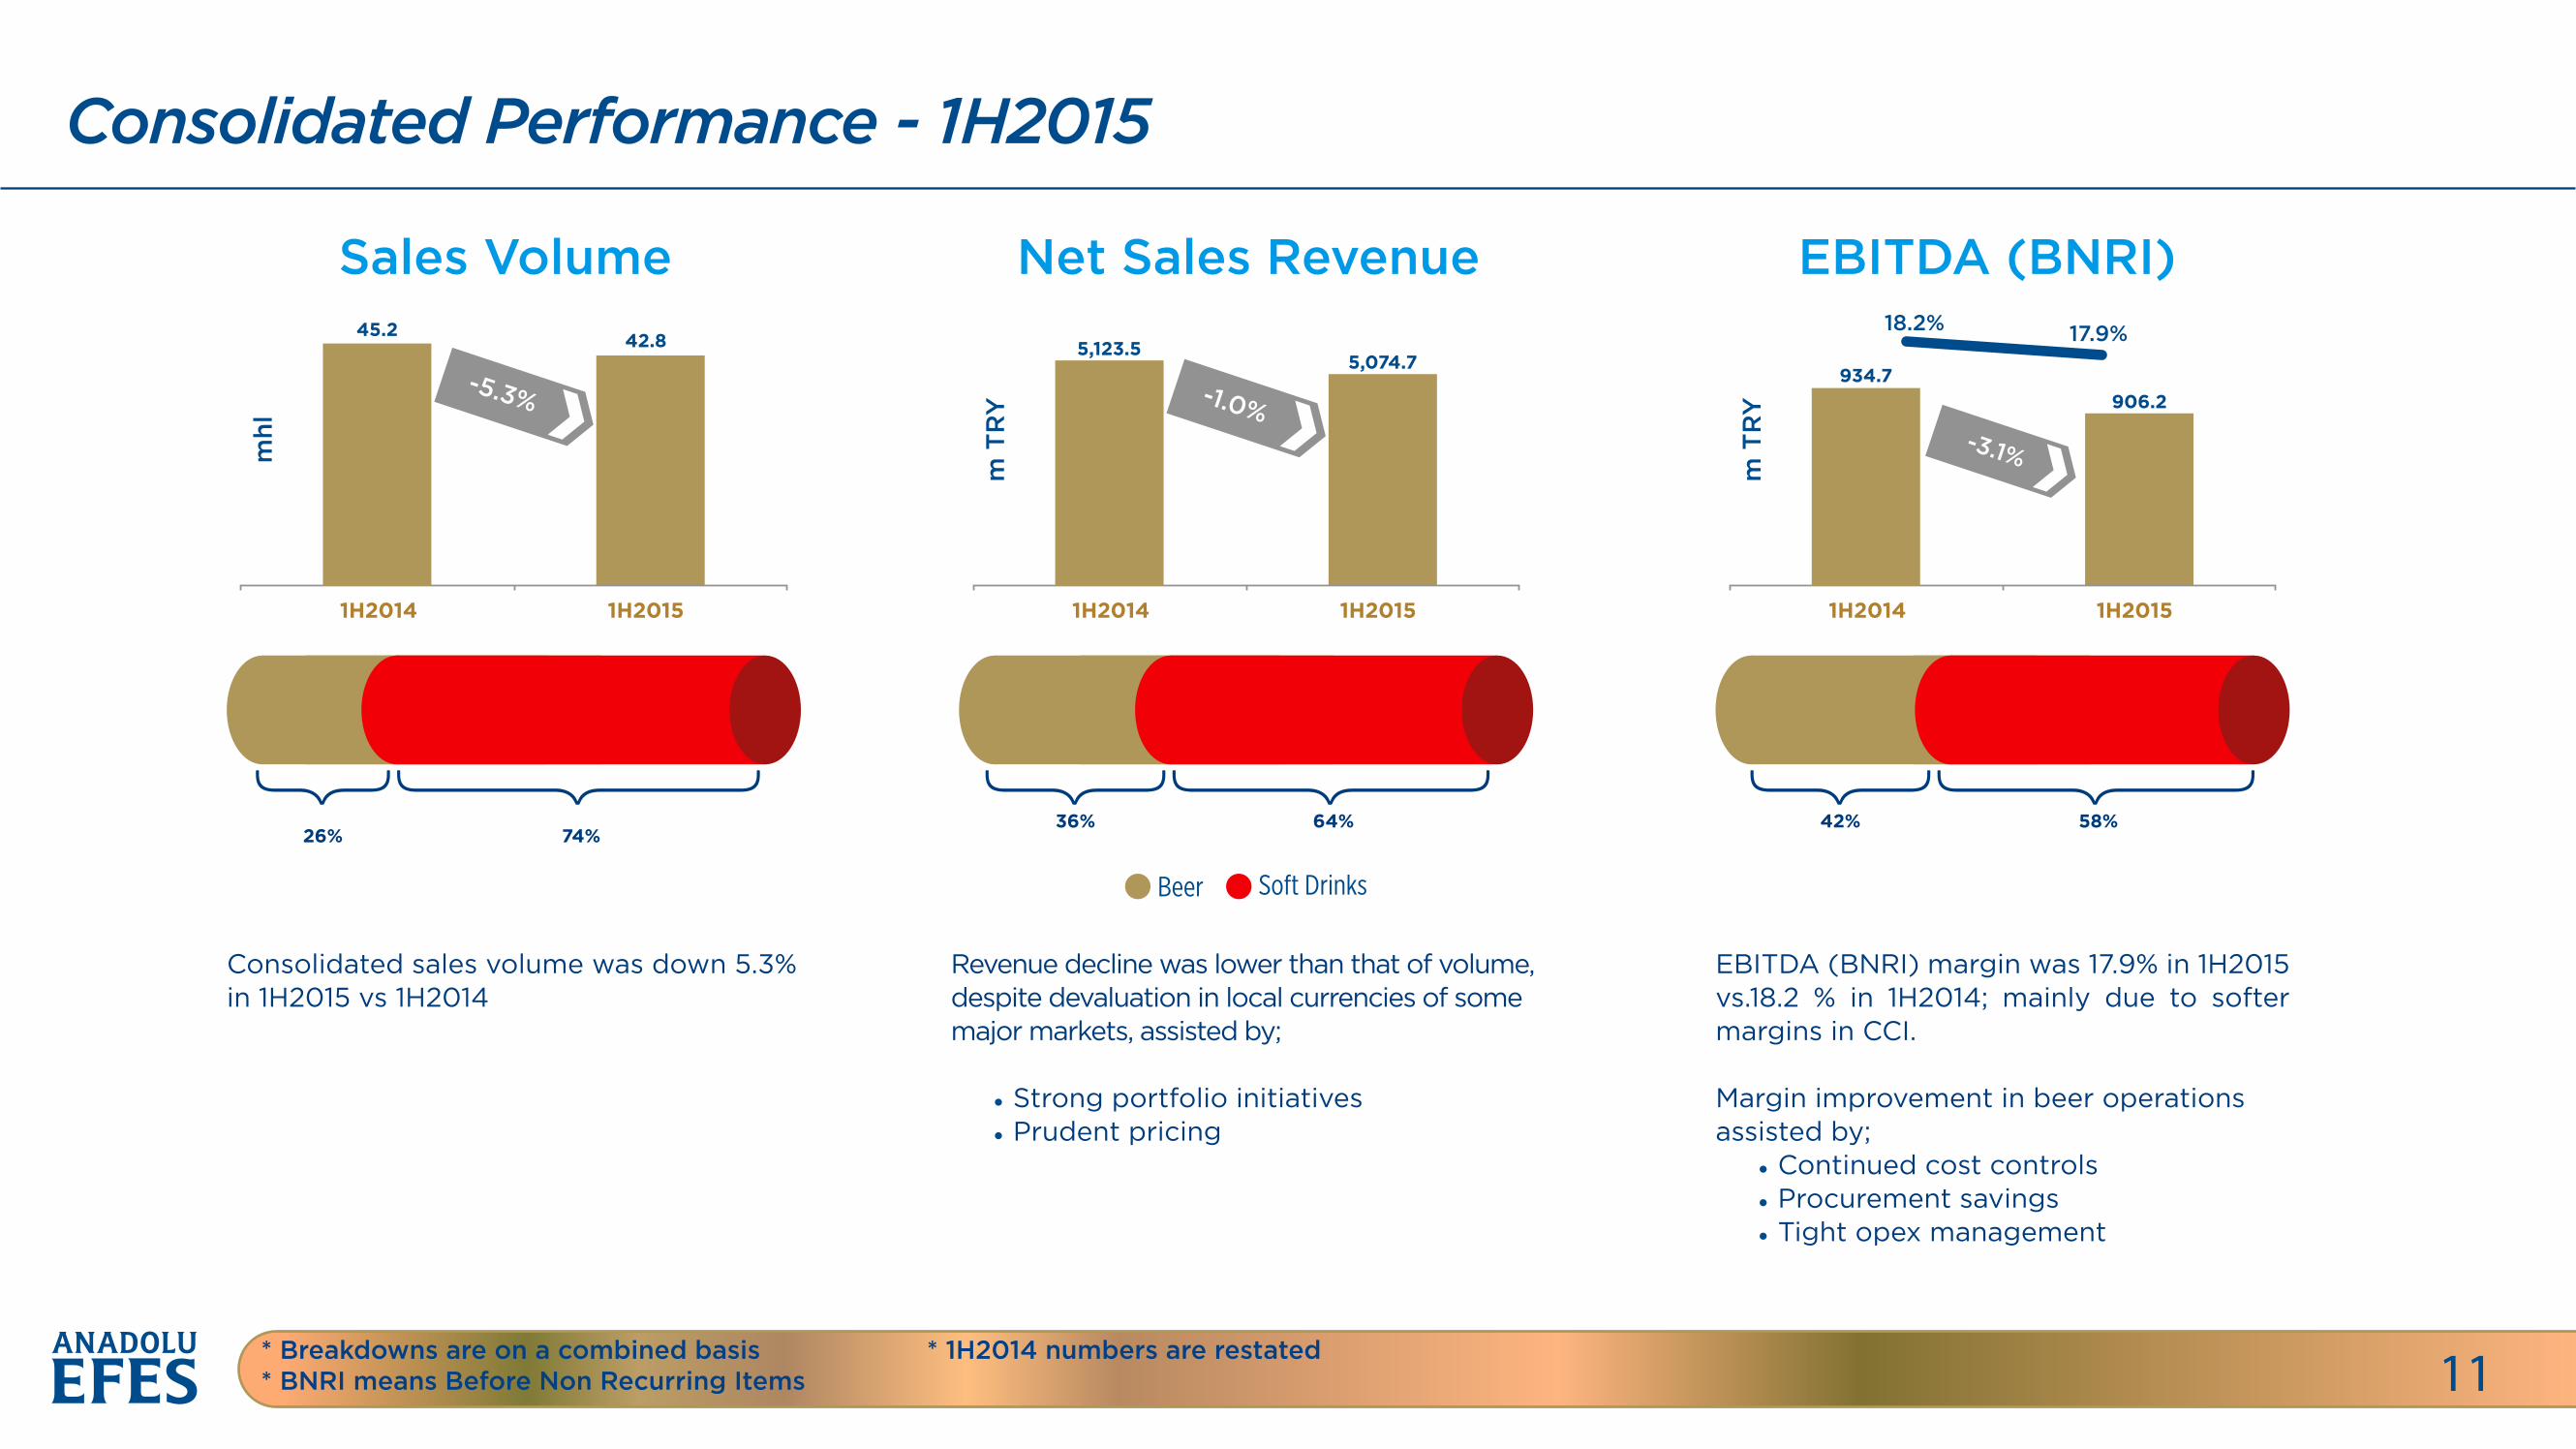
Consolidated Performance - 1H2015
11* Breakdowns are on a combined basis* BNRI means Before Non Recurring Items
* 1H2014 numbers are restated
1H2014 1H2015
mhl
-5.3%
Sales Volume45.2 42.8
1H2014 1H2015
m T
RY -1.0%
Net Sales Revenue
5,123.55,074.7
1H2014 1H2015
m T
RY
-3.1%
EBITDA (BNRI)
934.7906.2
18.2% 17.9%
Soft DrinksBeer
26% 74%
Consolidated sales volume was down 5.3% in 1H2015 vs 1H2014
Revenue decline was lower than that of volume, despite devaluation in local currencies of some major markets, assisted by;
• Strong portfolio initiatives • Prudent pricing
EBITDA (BNRI) margin was 17.9% in 1H2015 vs.18.2 % in 1H2014; mainly due to softer margins in CCI.
Margin improvement in beer operations assisted by; • Continued cost controls • Procurement savings • Tight opex management
36% 64% 42% 58%
Beer Operations
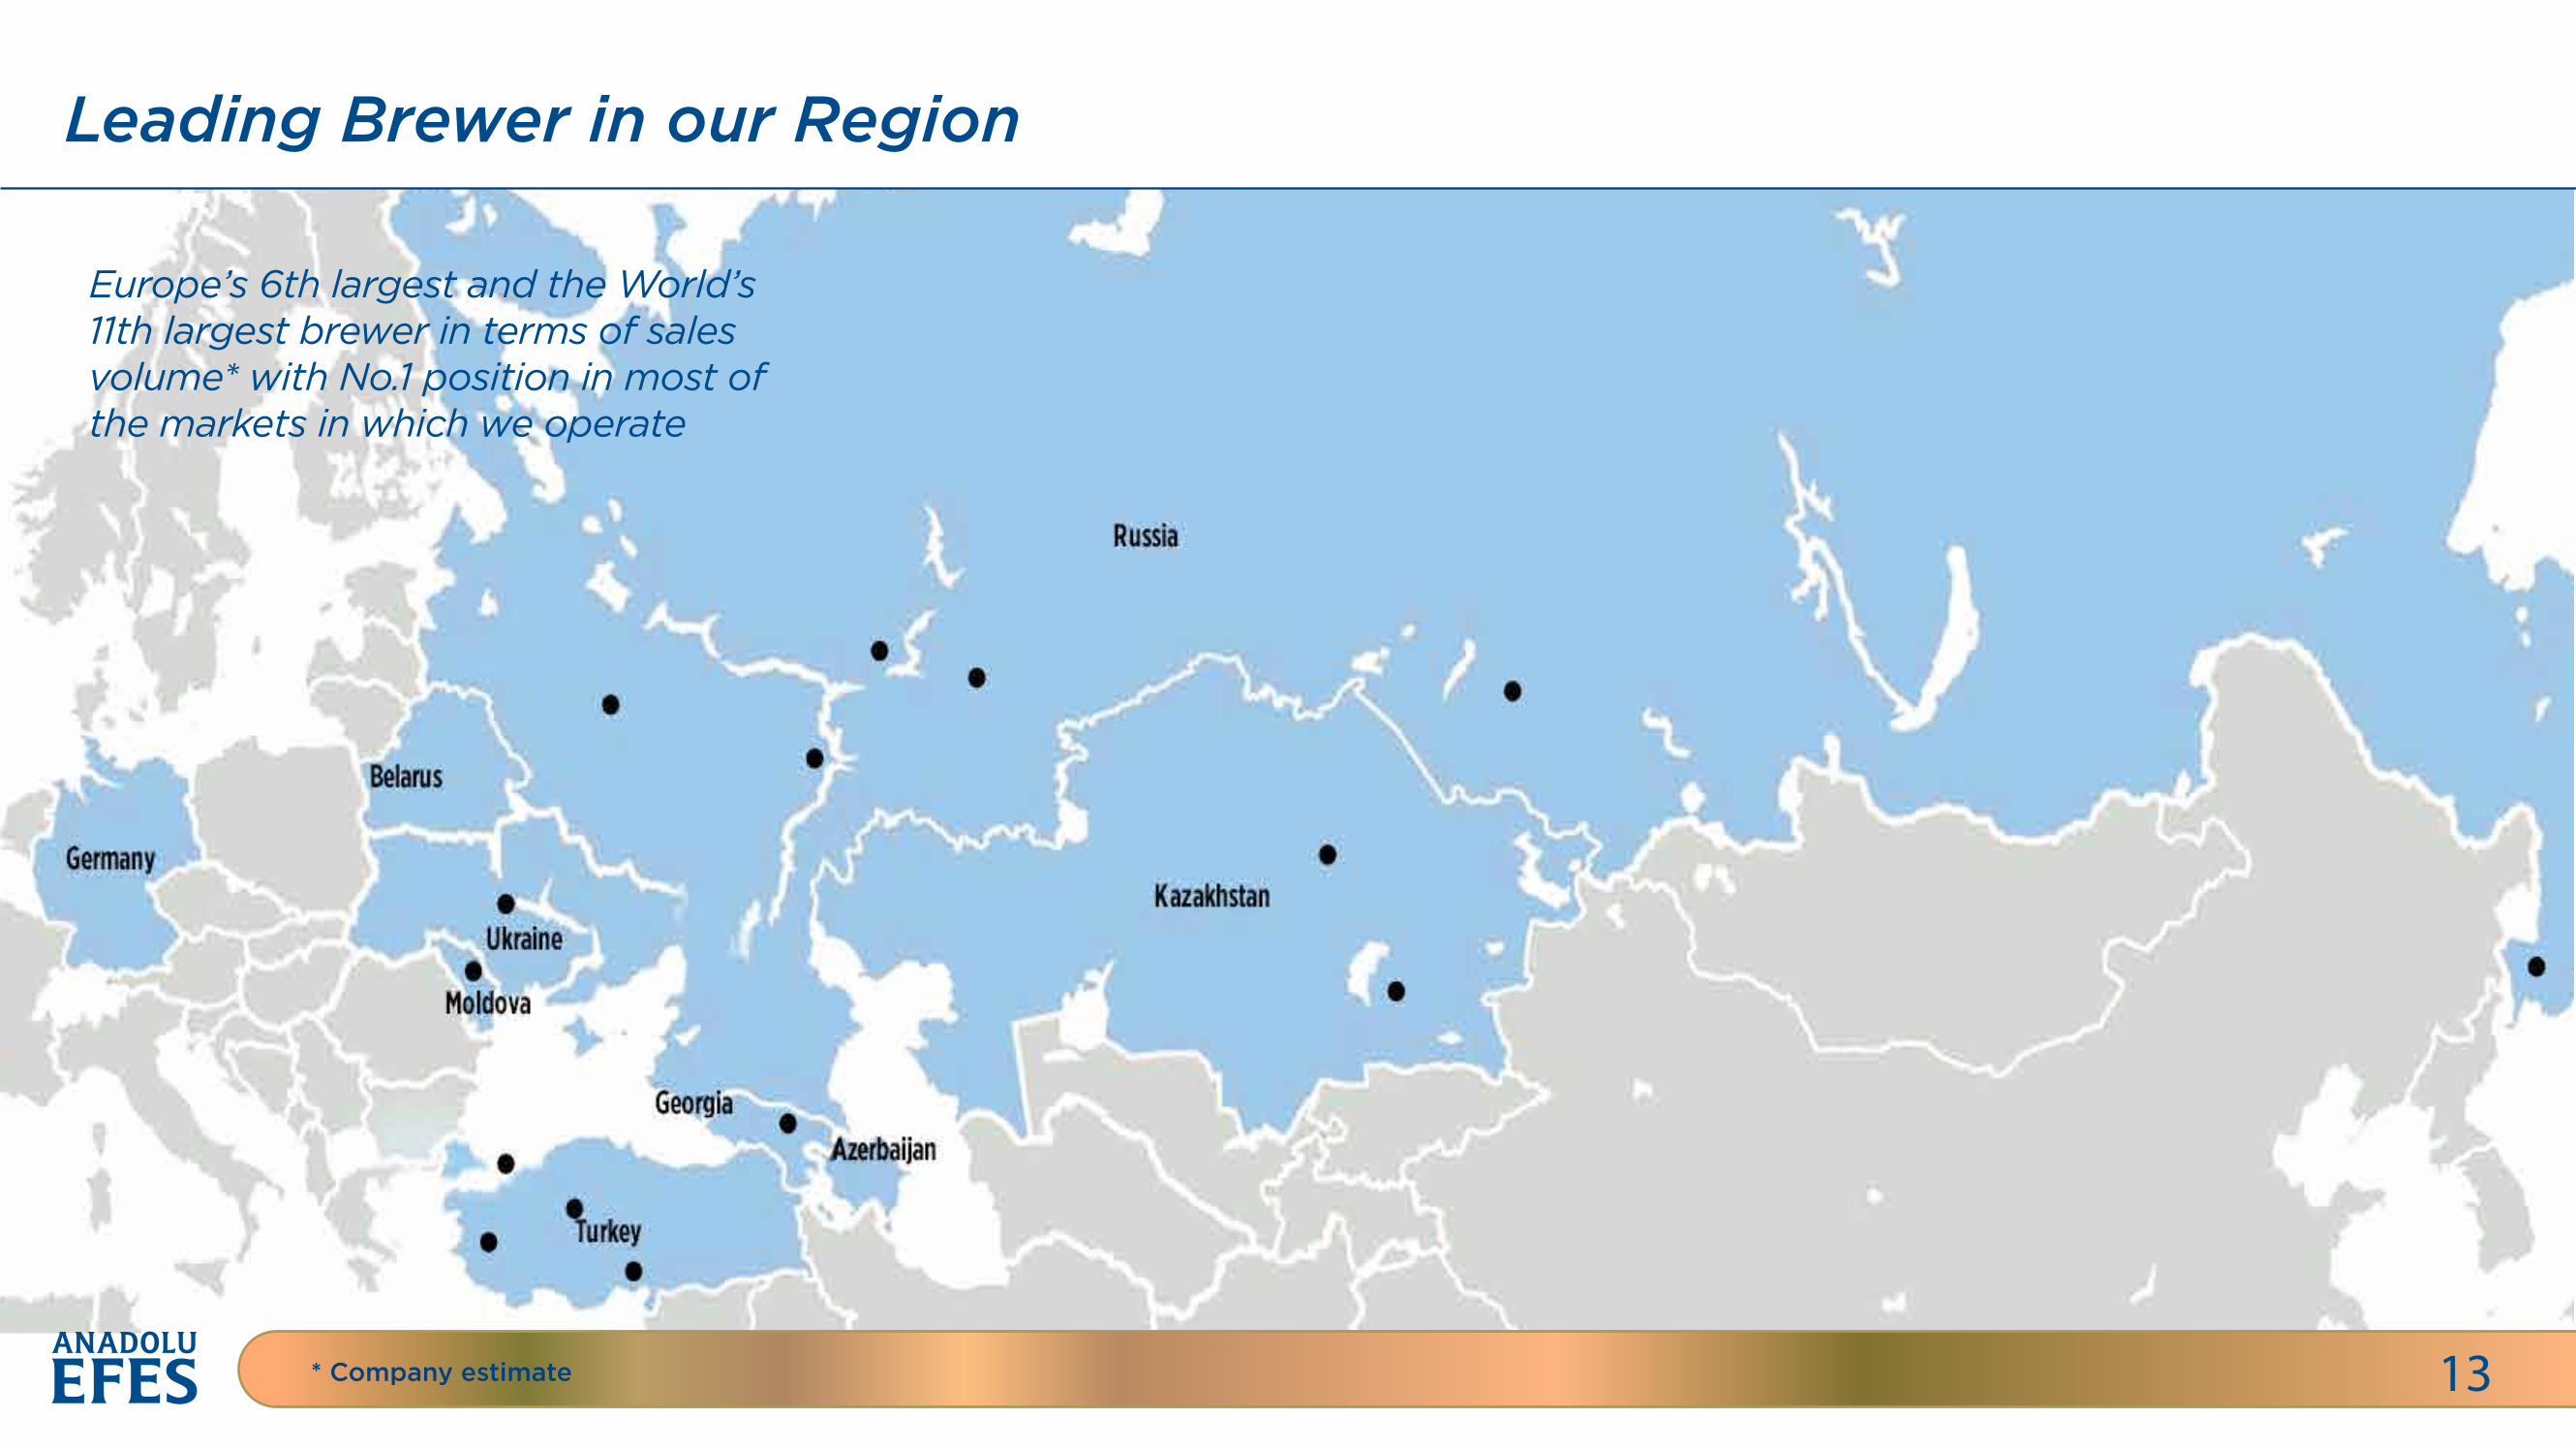
Europe’s 6th largest and the World’s 11th largest brewer in terms of sales volume* with No.1 position in most of the markets in which we operate
Leading Brewer in our Region
13* Company estimate
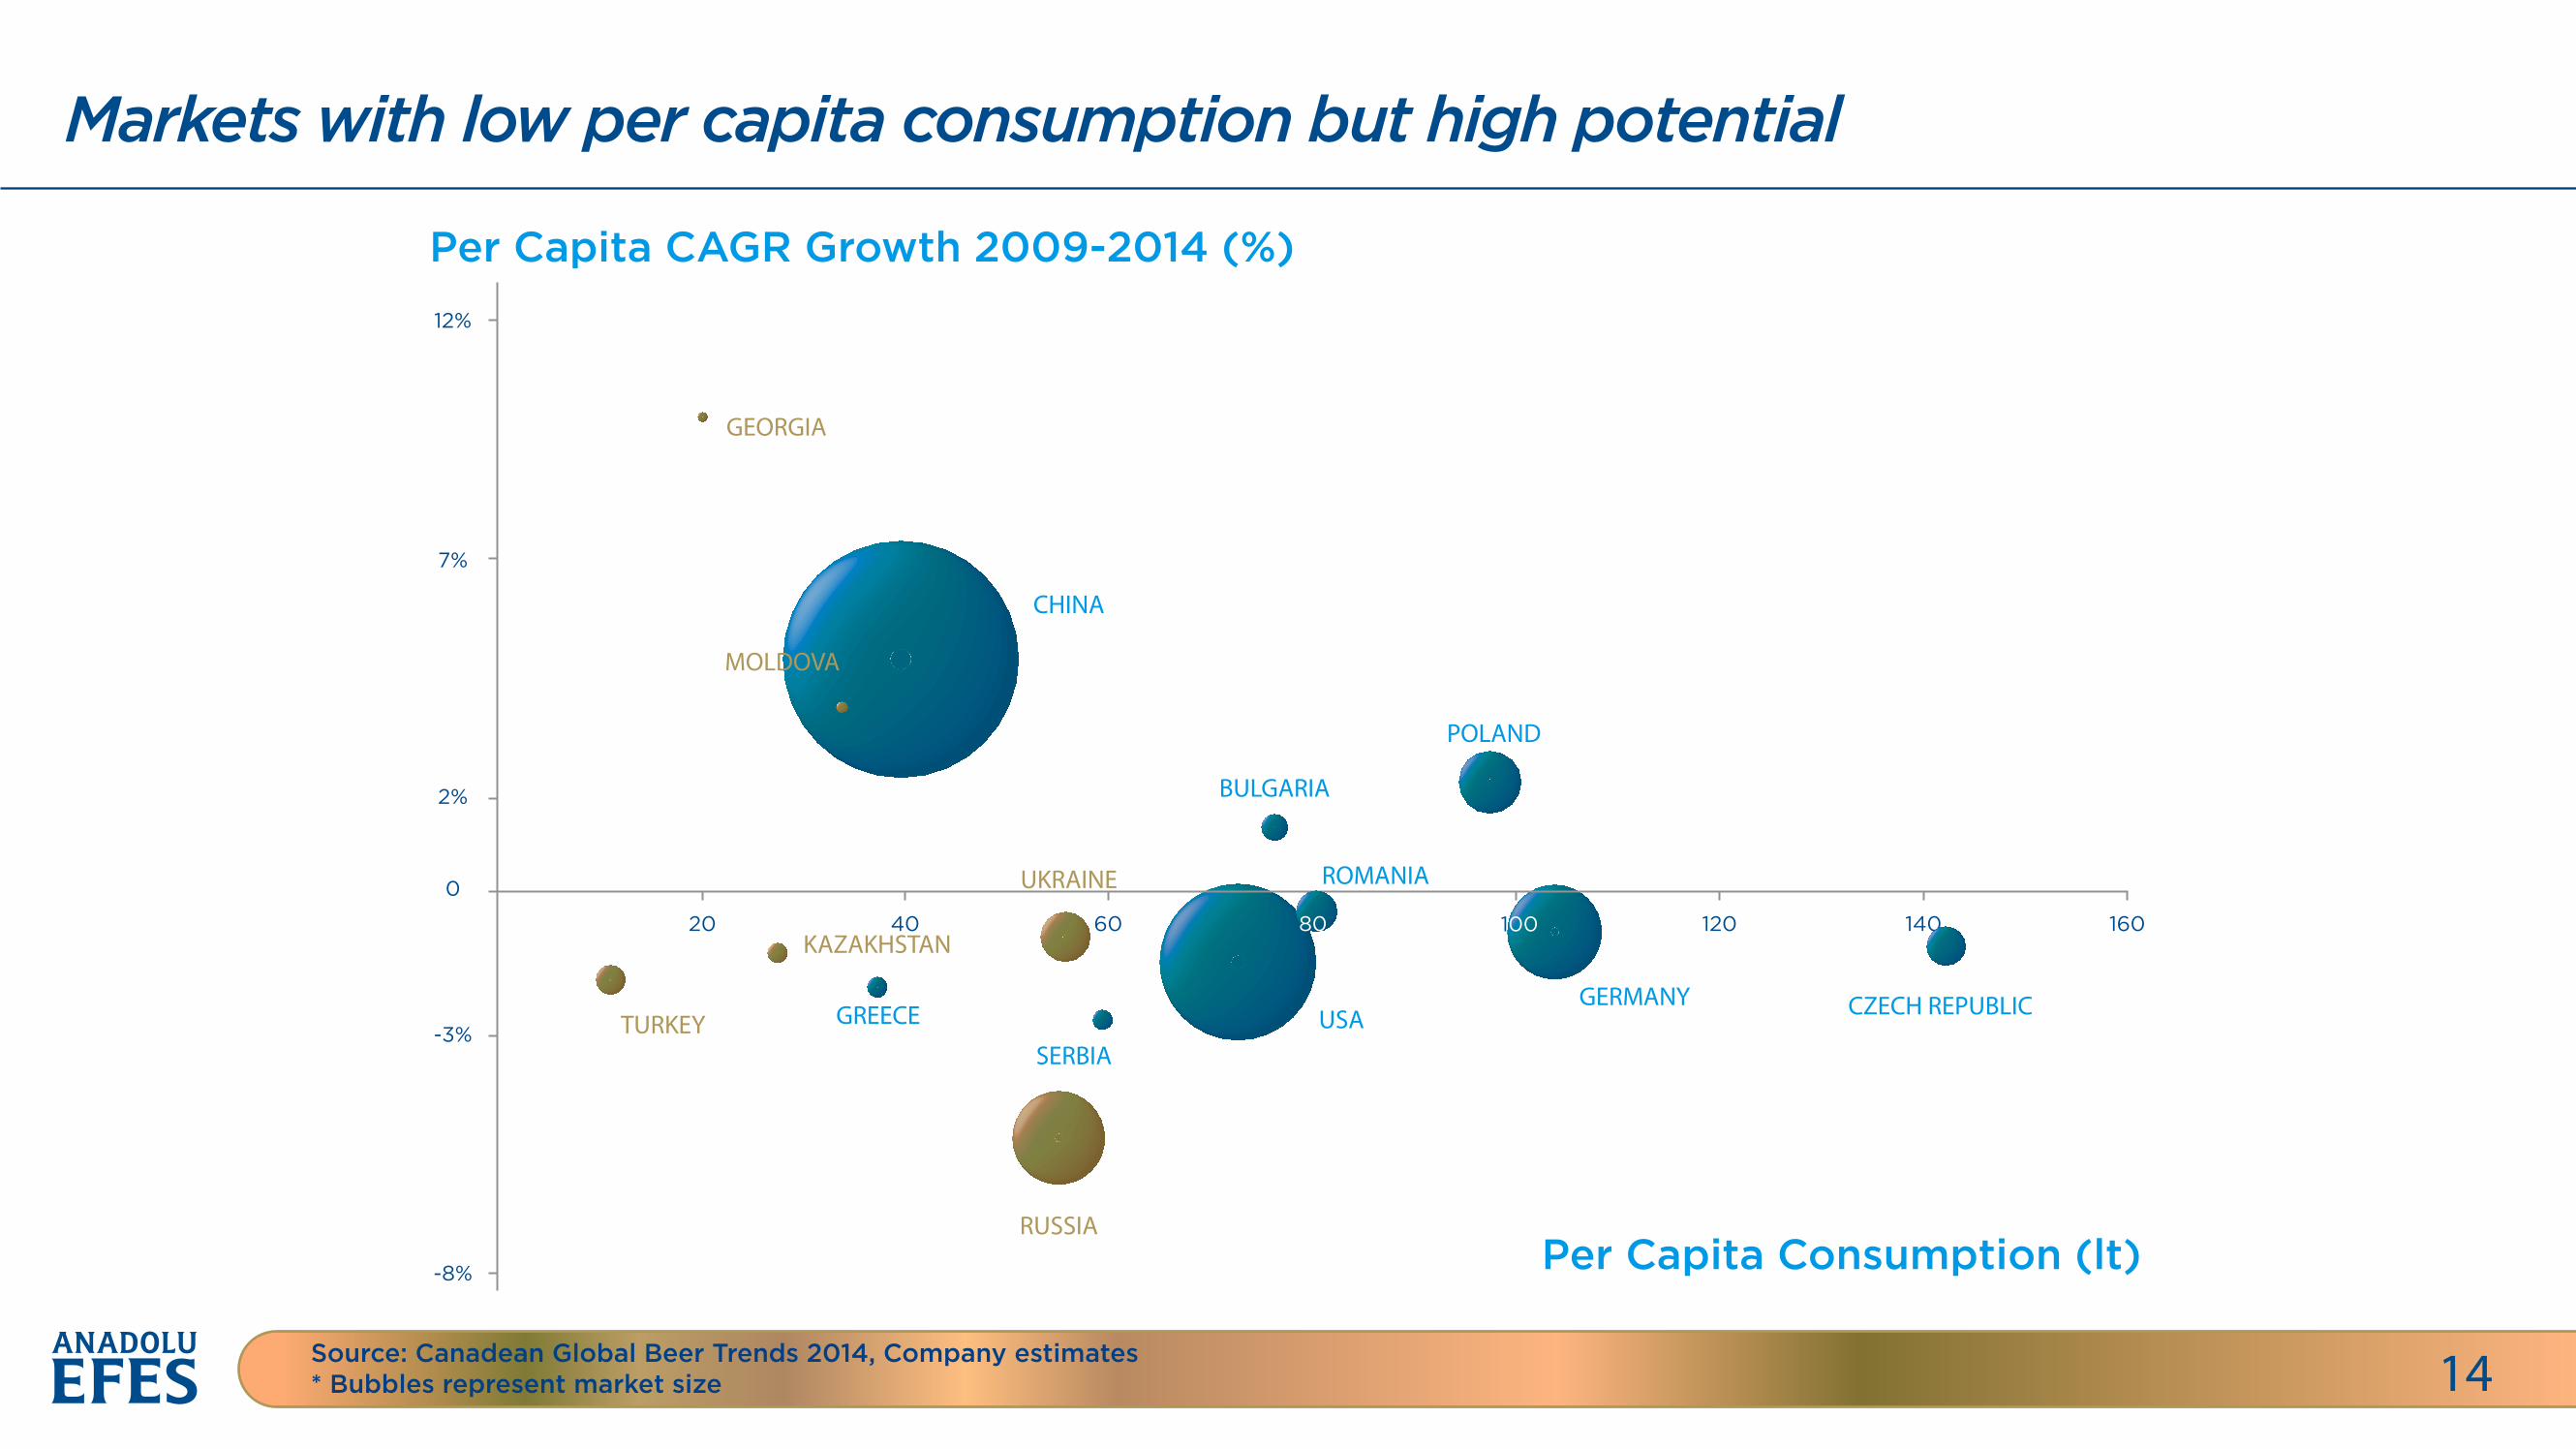
Markets with low per capita consumption but high potential
14Source: Canadean Global Beer Trends 2014, Company estimates* Bubbles represent market size
Per Capita CAGR Growth 2009-2014 (%)
GEORGIA
KAZAKHSTAN
UKRAINE
TURKEY
RUSSIA
CHINA
BULGARIA
POLAND
ROMANIA
GERMANY CZECH REPUBLICUSASERBIA
GREECE
Per Capita Consumption (lt)
12%
7%
2%
120 140 160
-3%
-8%
0
20 40 10060
MOLDOVA
80
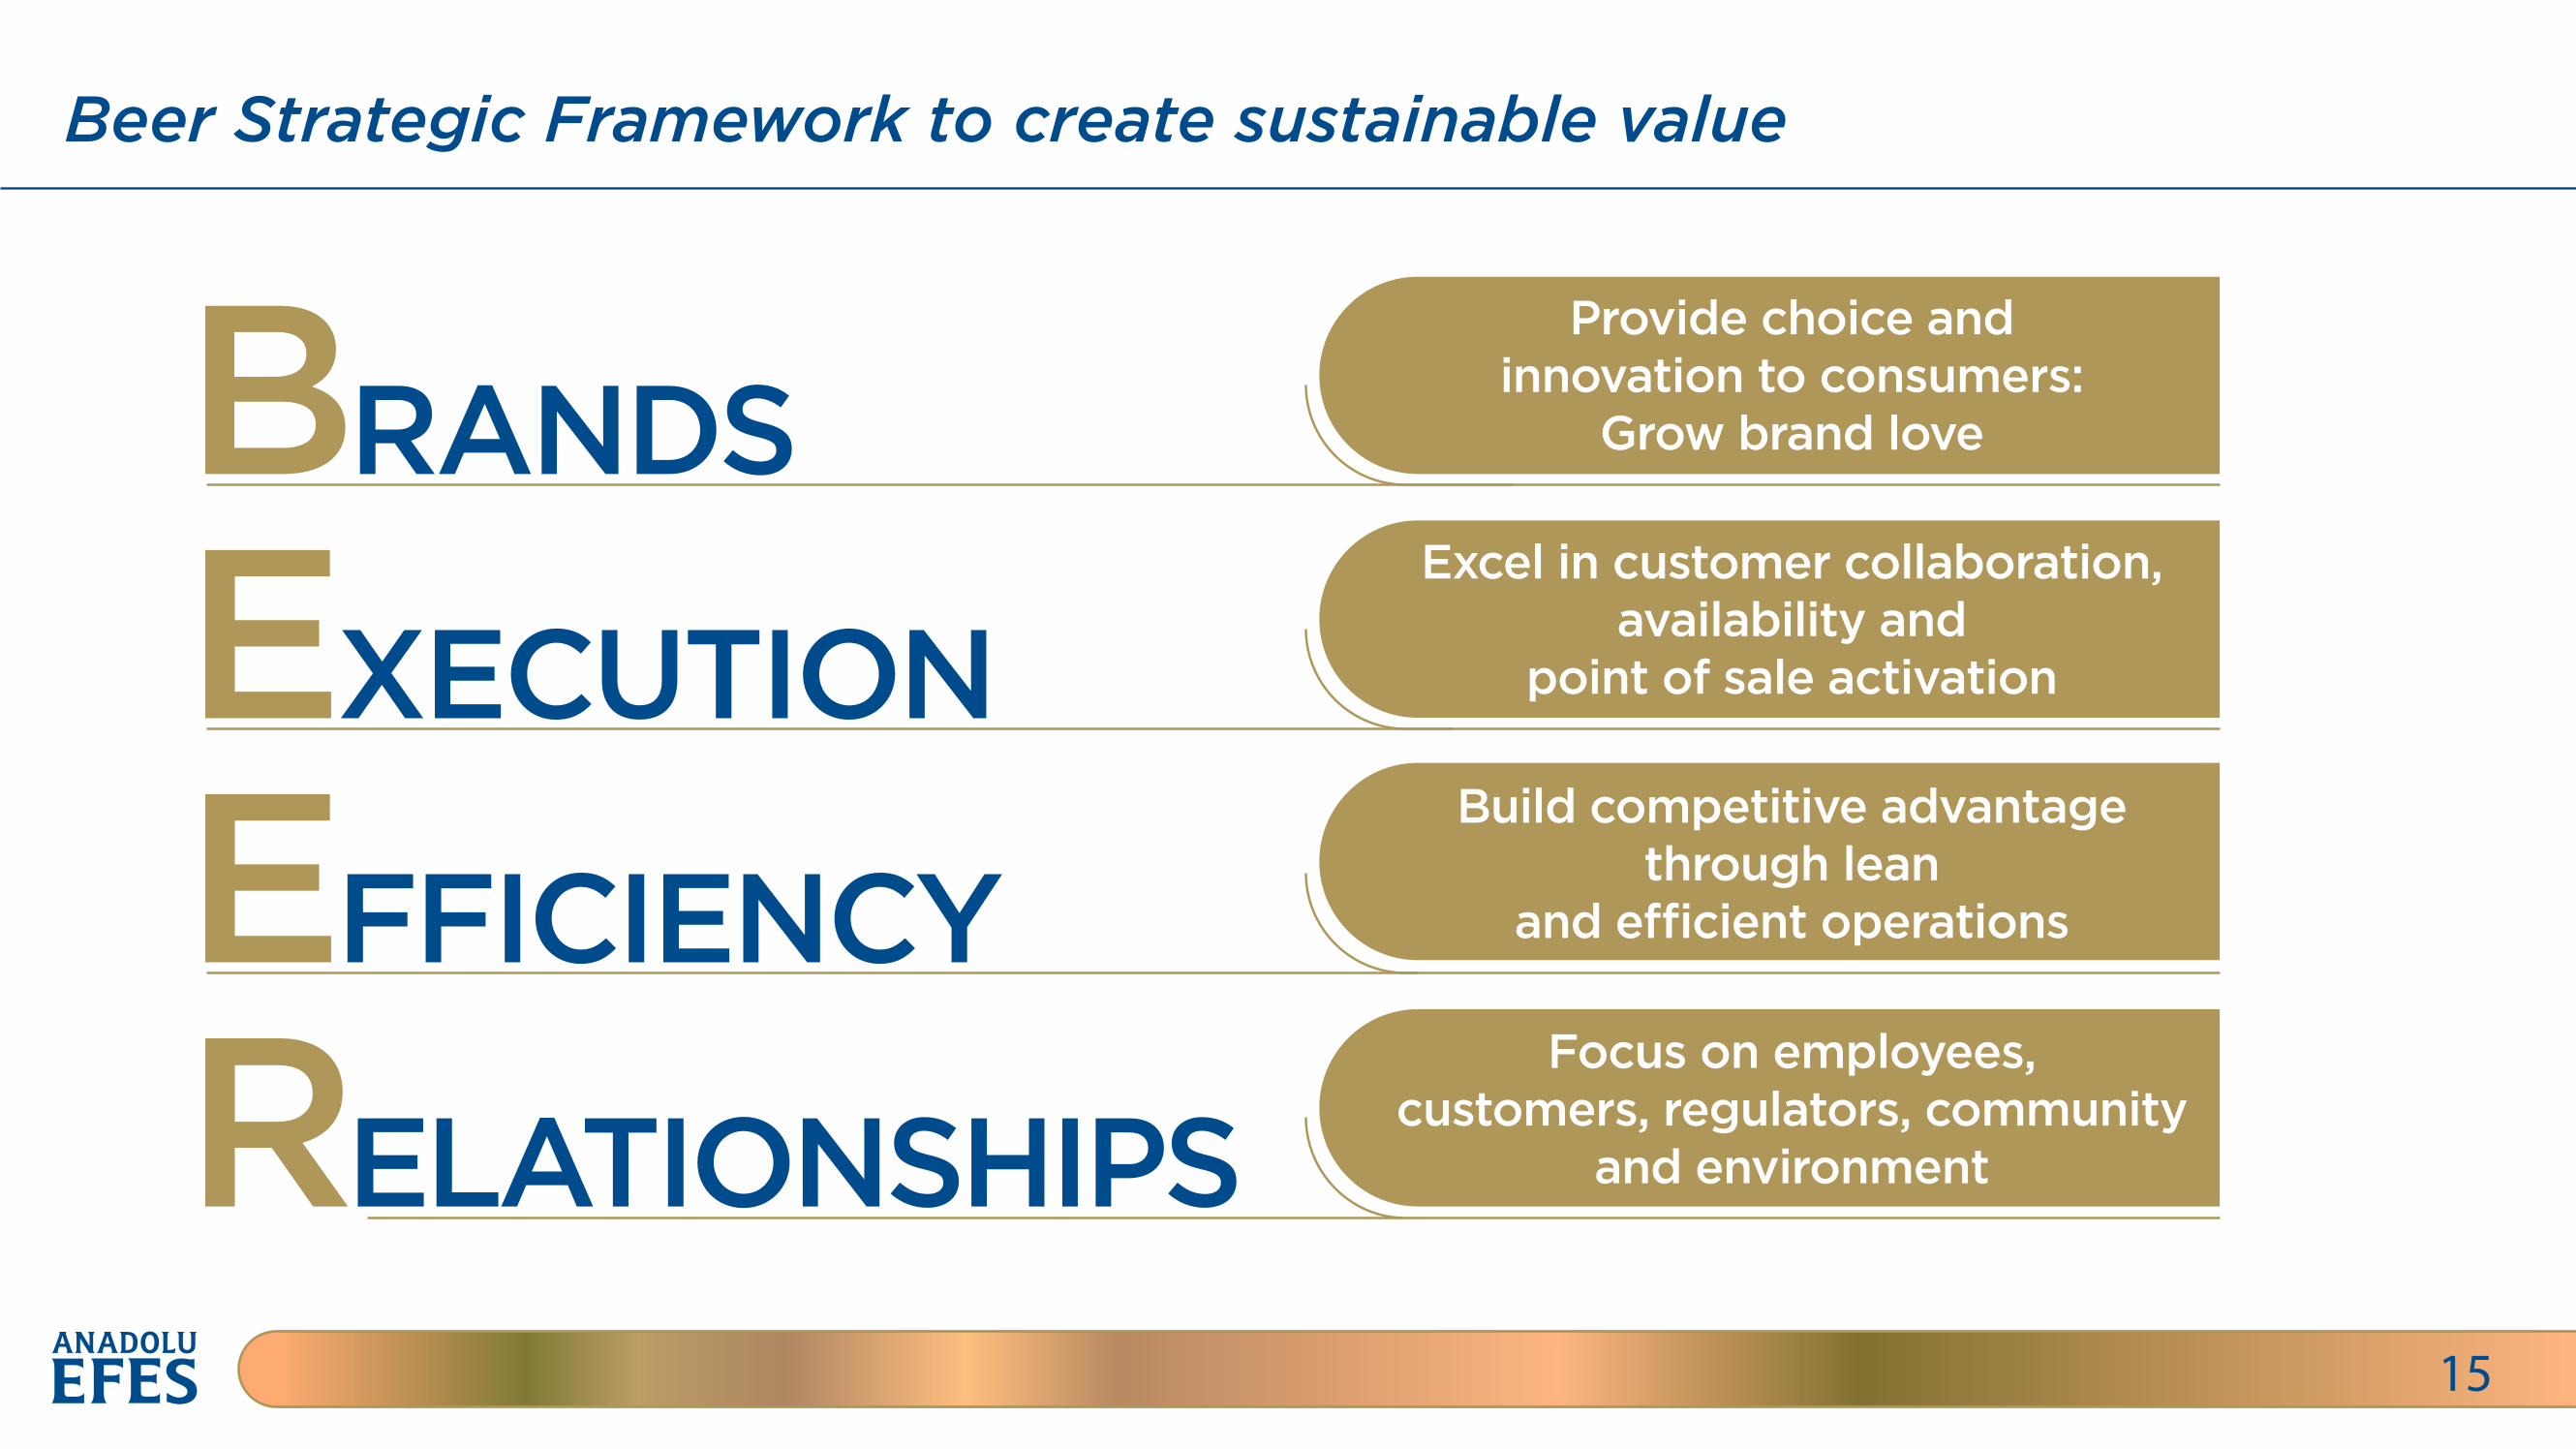
Beer Strategic Framework to create sustainable value
15
BRANDS
EXECUTION
EFFICIENCY
RELATIONSHIPS
Provide choice andinnovation to consumers:
Grow brand love
Excel in customer collaboration,availability and
point of sale activation
Build competitive advantagethrough lean
and e�cient operations
Focus on employees,customers, regulators, community
and environment
Beer Strategic Framework to create sustainable value
15
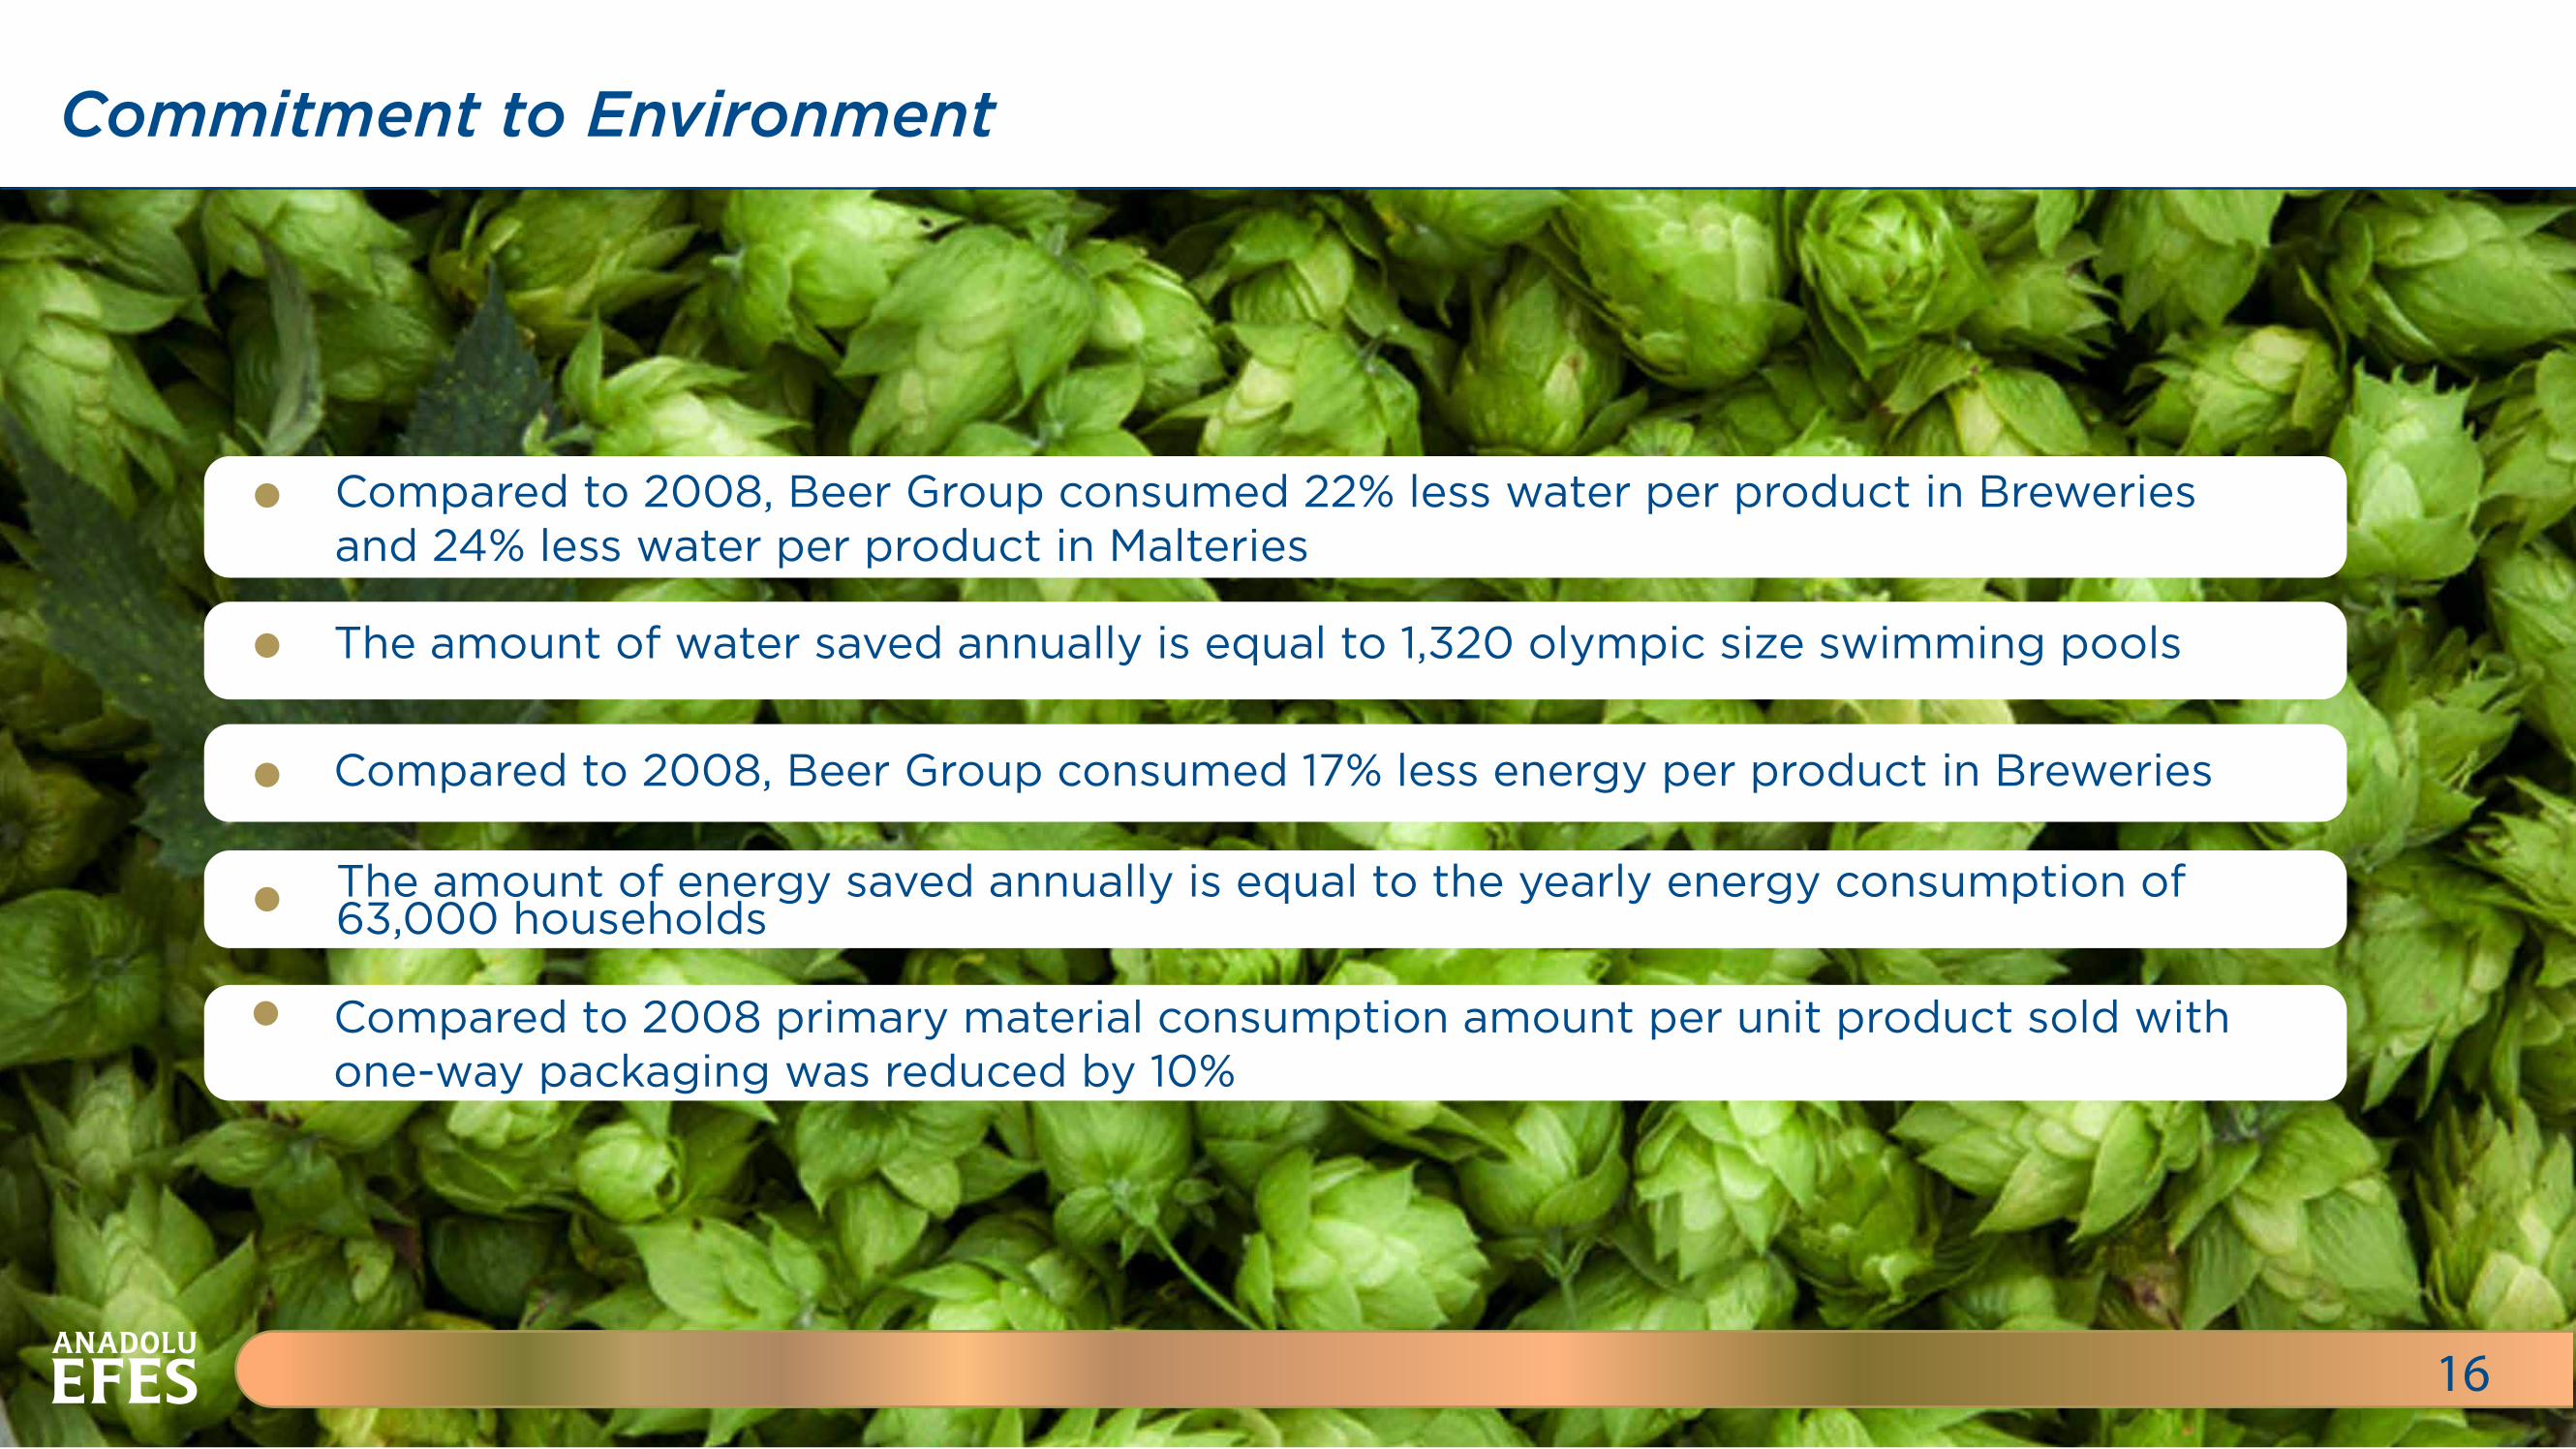
Compared to 2008, Beer Group consumed 22% less water per product in Breweries and 24% less water per product in Malteries
The amount of water saved annually is equal to 1,320 olympic size swimming pools
Compared to 2008, Beer Group consumed 17% less energy per product in Breweries
The amount of energy saved annually is equal to the yearly energy consumption of 63,000 households
16
Commitment to Environment
Compared to 2008 primary material consumption amount per unit product sold with one-way packaging was reduced by 10%
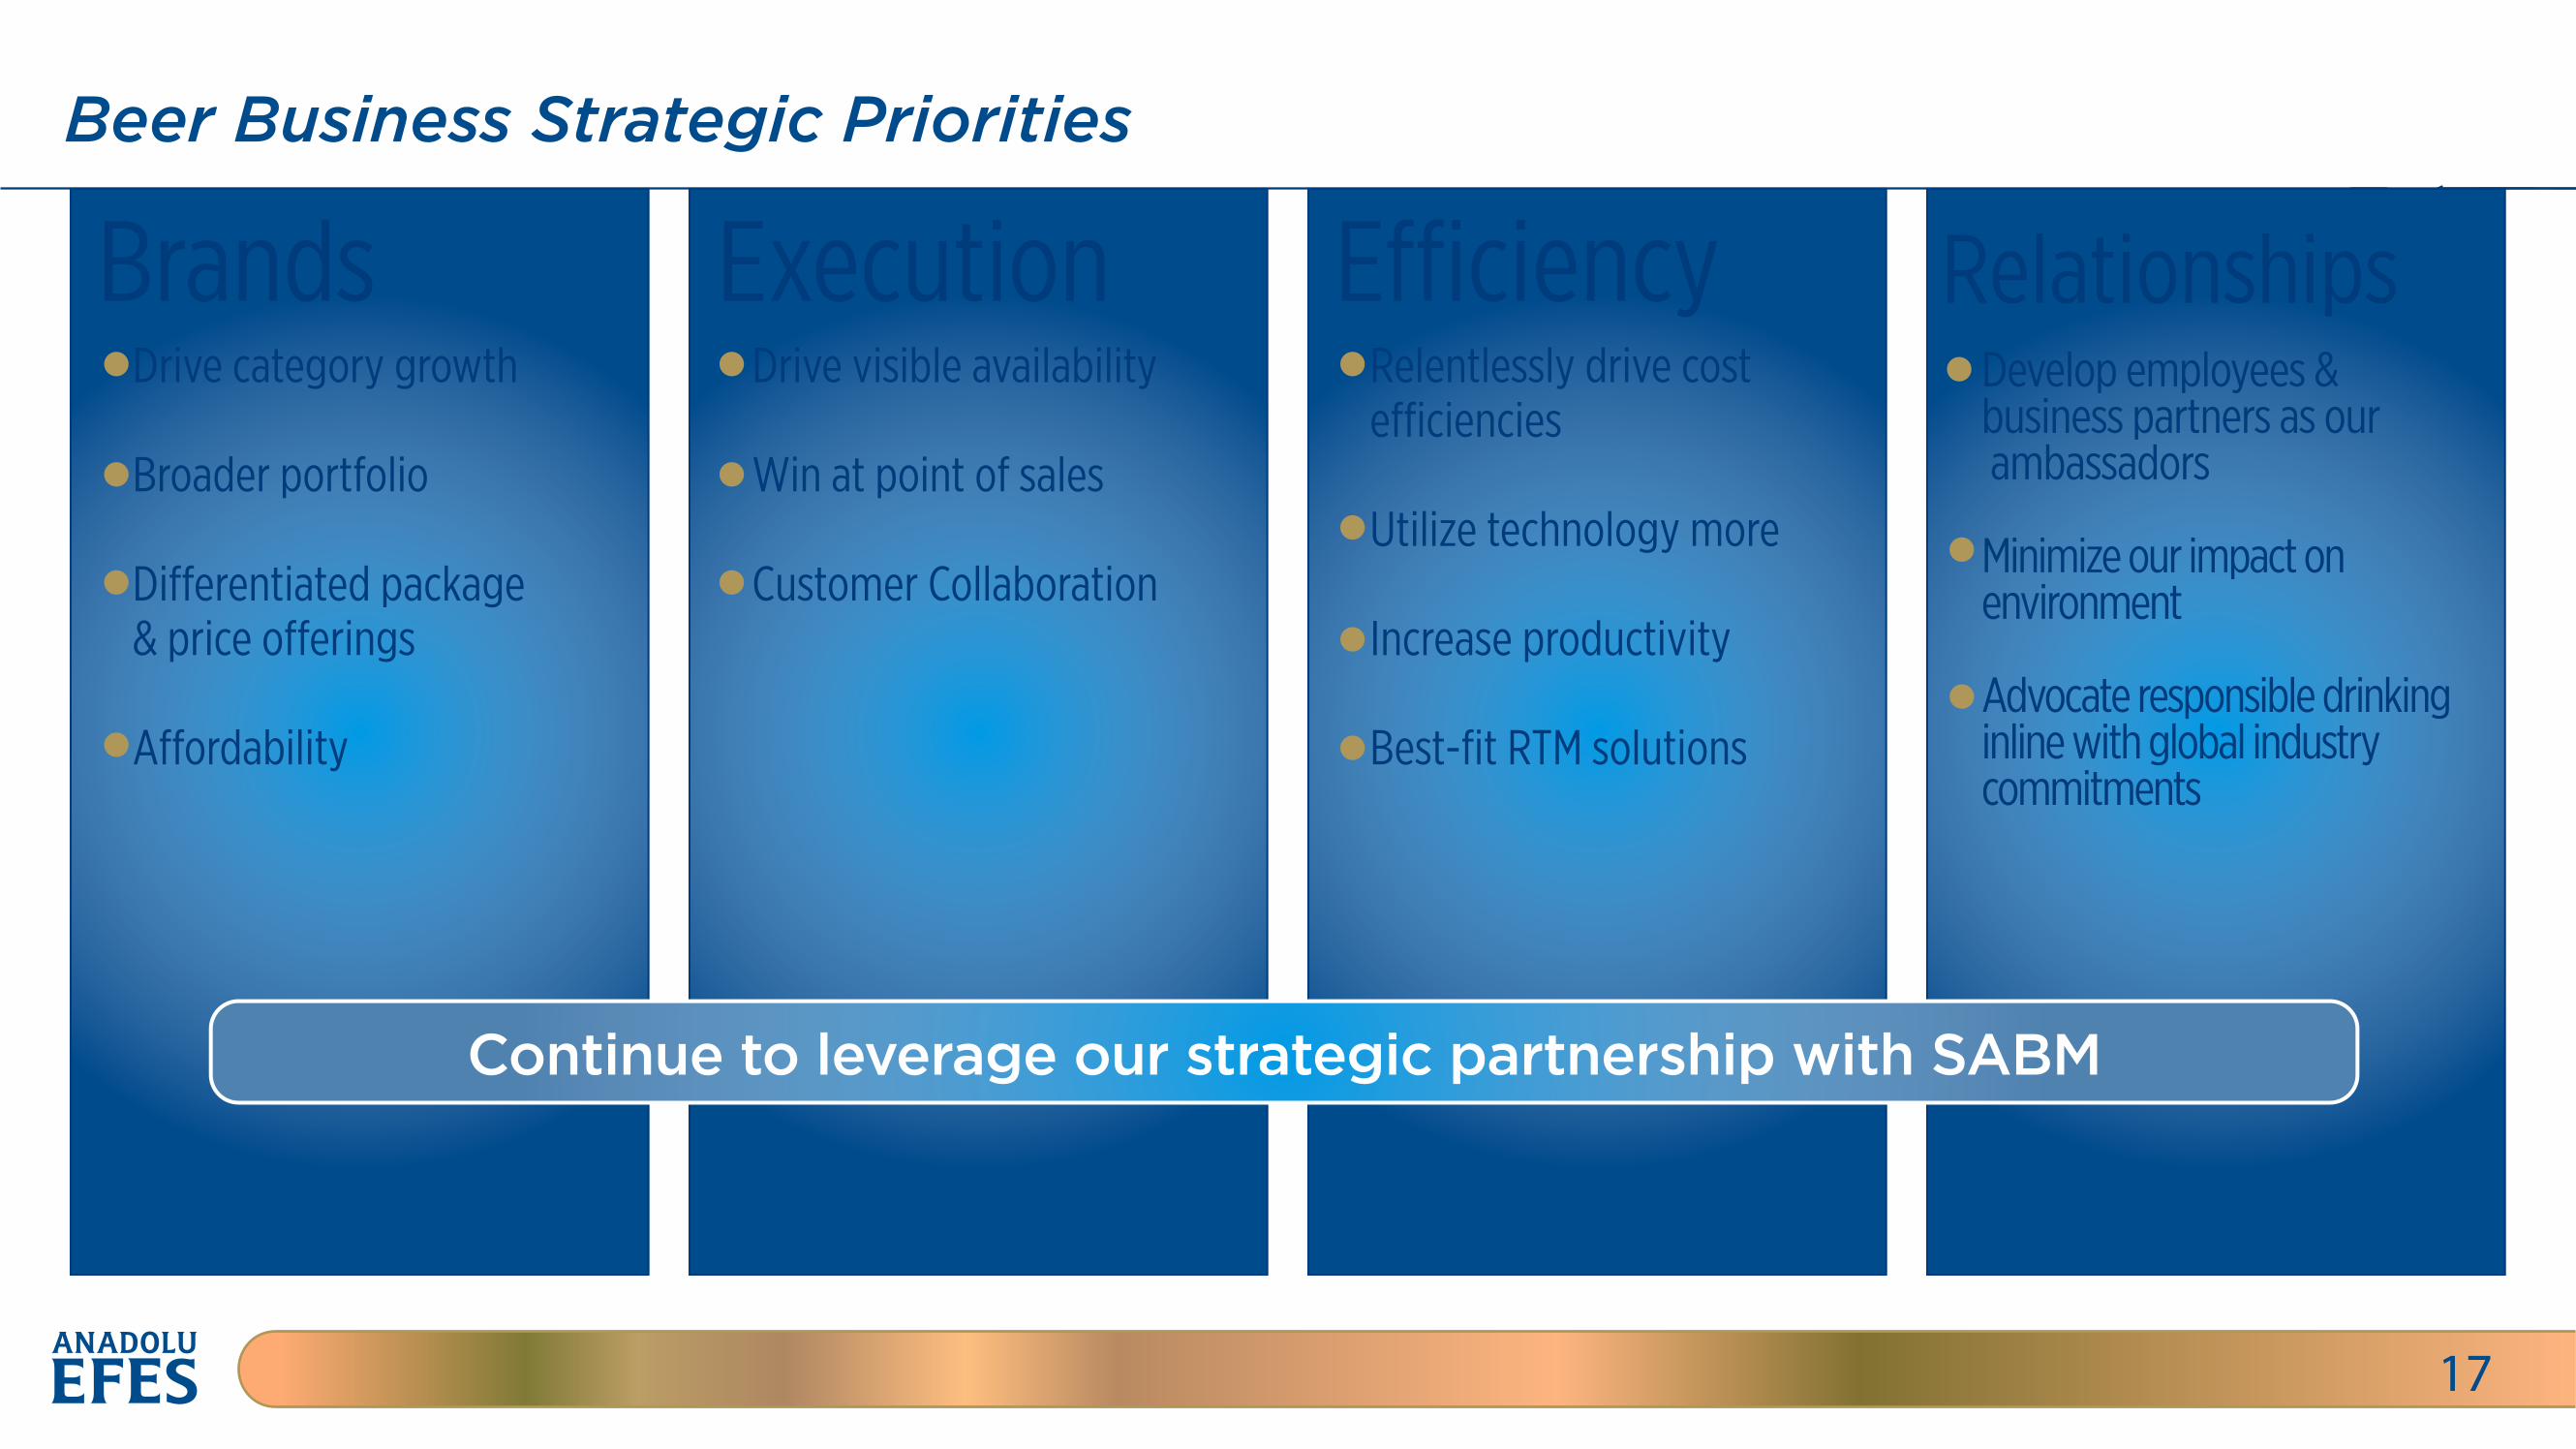
Beer Business Strategic Priorities
17
Brands Execution E�iciency RelationshipsDrive category growth
Broader portfolio
Di�erentiated package& price o�erings
A�ordability
Drive visible availability
Win at point of sales
Customer Collaboration
Relentlessly drive coste�iciencies
Utilize technology more
Increase productivity
Best-fit RTM solutions
Develop employees & business partners as our ambassadors Minimize our impact on environment
Advocate responsible drinking inline with global industrycommitments
Continue to leverage our strategic partnership with SABM
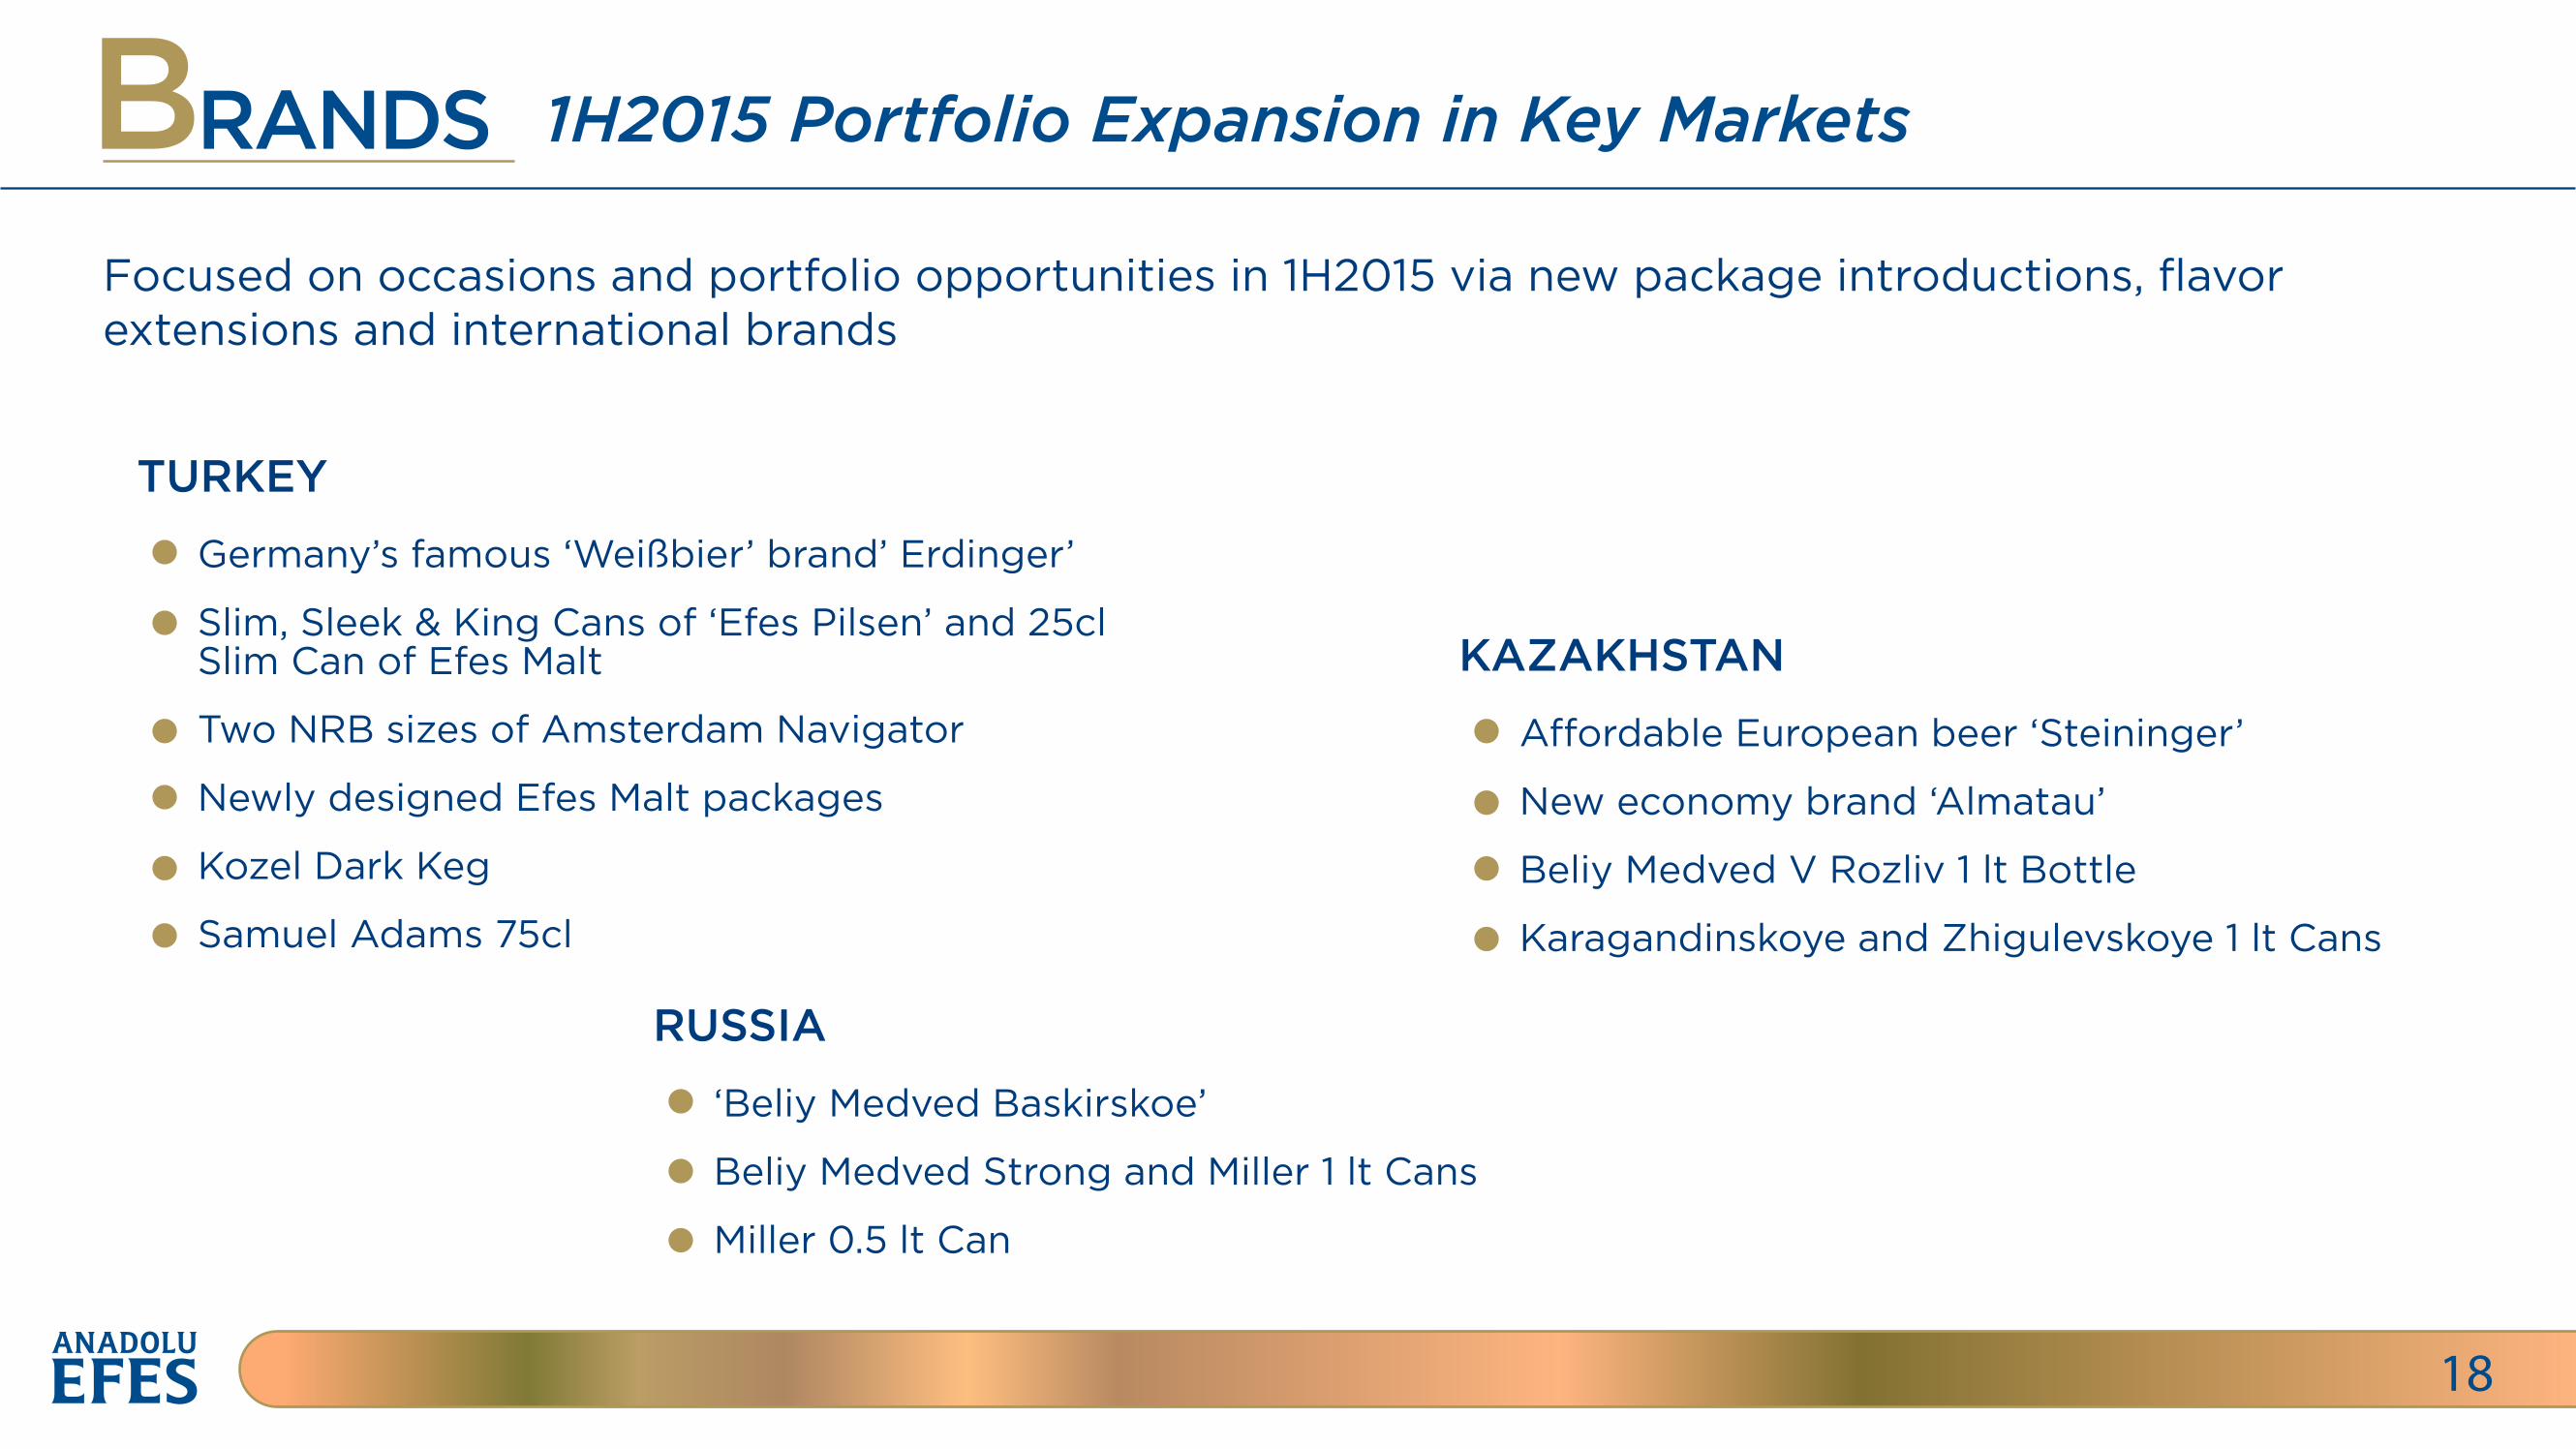
TURKEY
Germany’s famous ‘Weißbier’ brand’ Erdinger’
Slim, Sleek & King Cans of ‘Efes Pilsen’ and 25cl Slim Can of Efes Malt
Two NRB sizes of Amsterdam Navigator
Newly designed Efes Malt packages
Kozel Dark Keg
Samuel Adams 75cl
1H2015 Portfolio Expansion in Key Markets
18
BRANDS
Focused on occasions and portfolio opportunities in 1H2015 via new package introductions, flavor extensions and international brands
‘Beliy Medved Baskirskoe’
Beliy Medved Strong and Miller 1 lt Cans
Miller 0.5 lt Can
RUSSIA
KAZAKHSTAN
A�ordable European beer ‘Steininger’
New economy brand ‘Almatau’
Beliy Medved V Rozliv 1 lt Bottle
Karagandinskoye and Zhigulevskoye 1 lt Cans
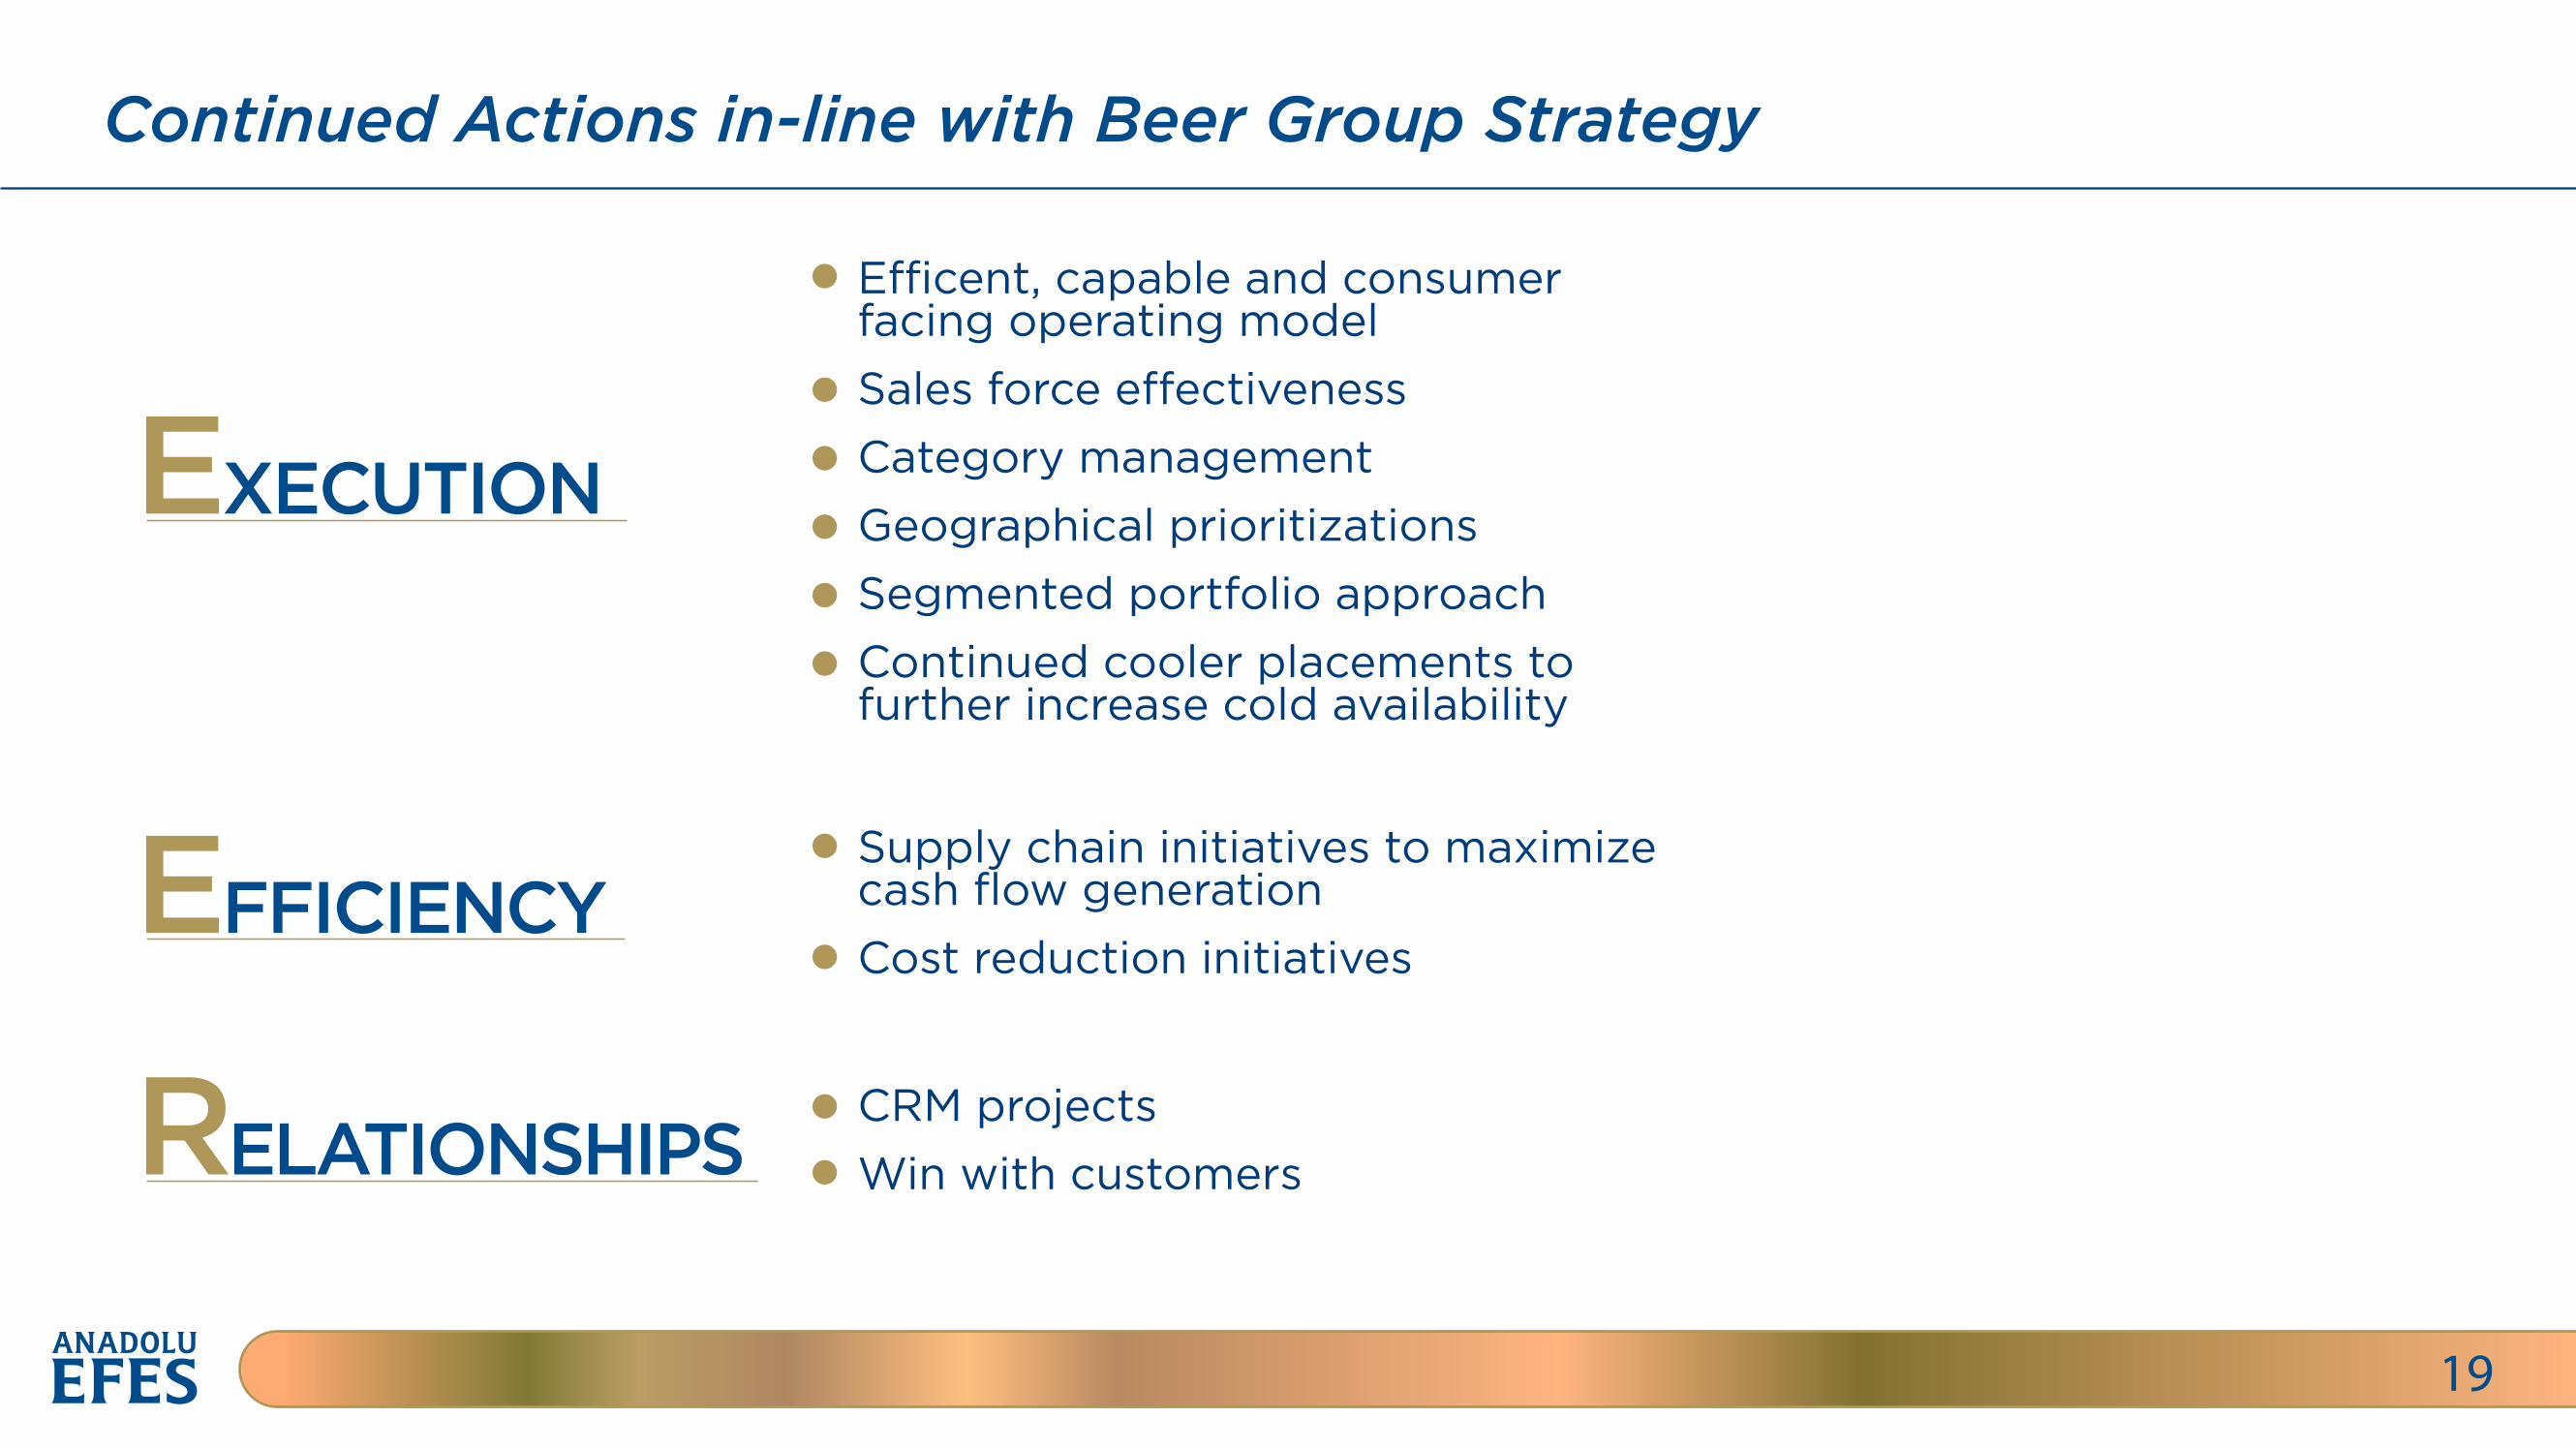
Continued Actions in-line with Beer Group Strategy
19
EXECUTION
EFFICIENCY
RELATIONSHIPS
E�cent, capable and consumer facing operating modelSales force e�ectivenessCategory managementGeographical prioritizationsSegmented portfolio approachContinued cooler placements to further increase cold availability
Supply chain initiatives to maximize cash flow generationCost reduction initiatives
CRM projectsWin with customers
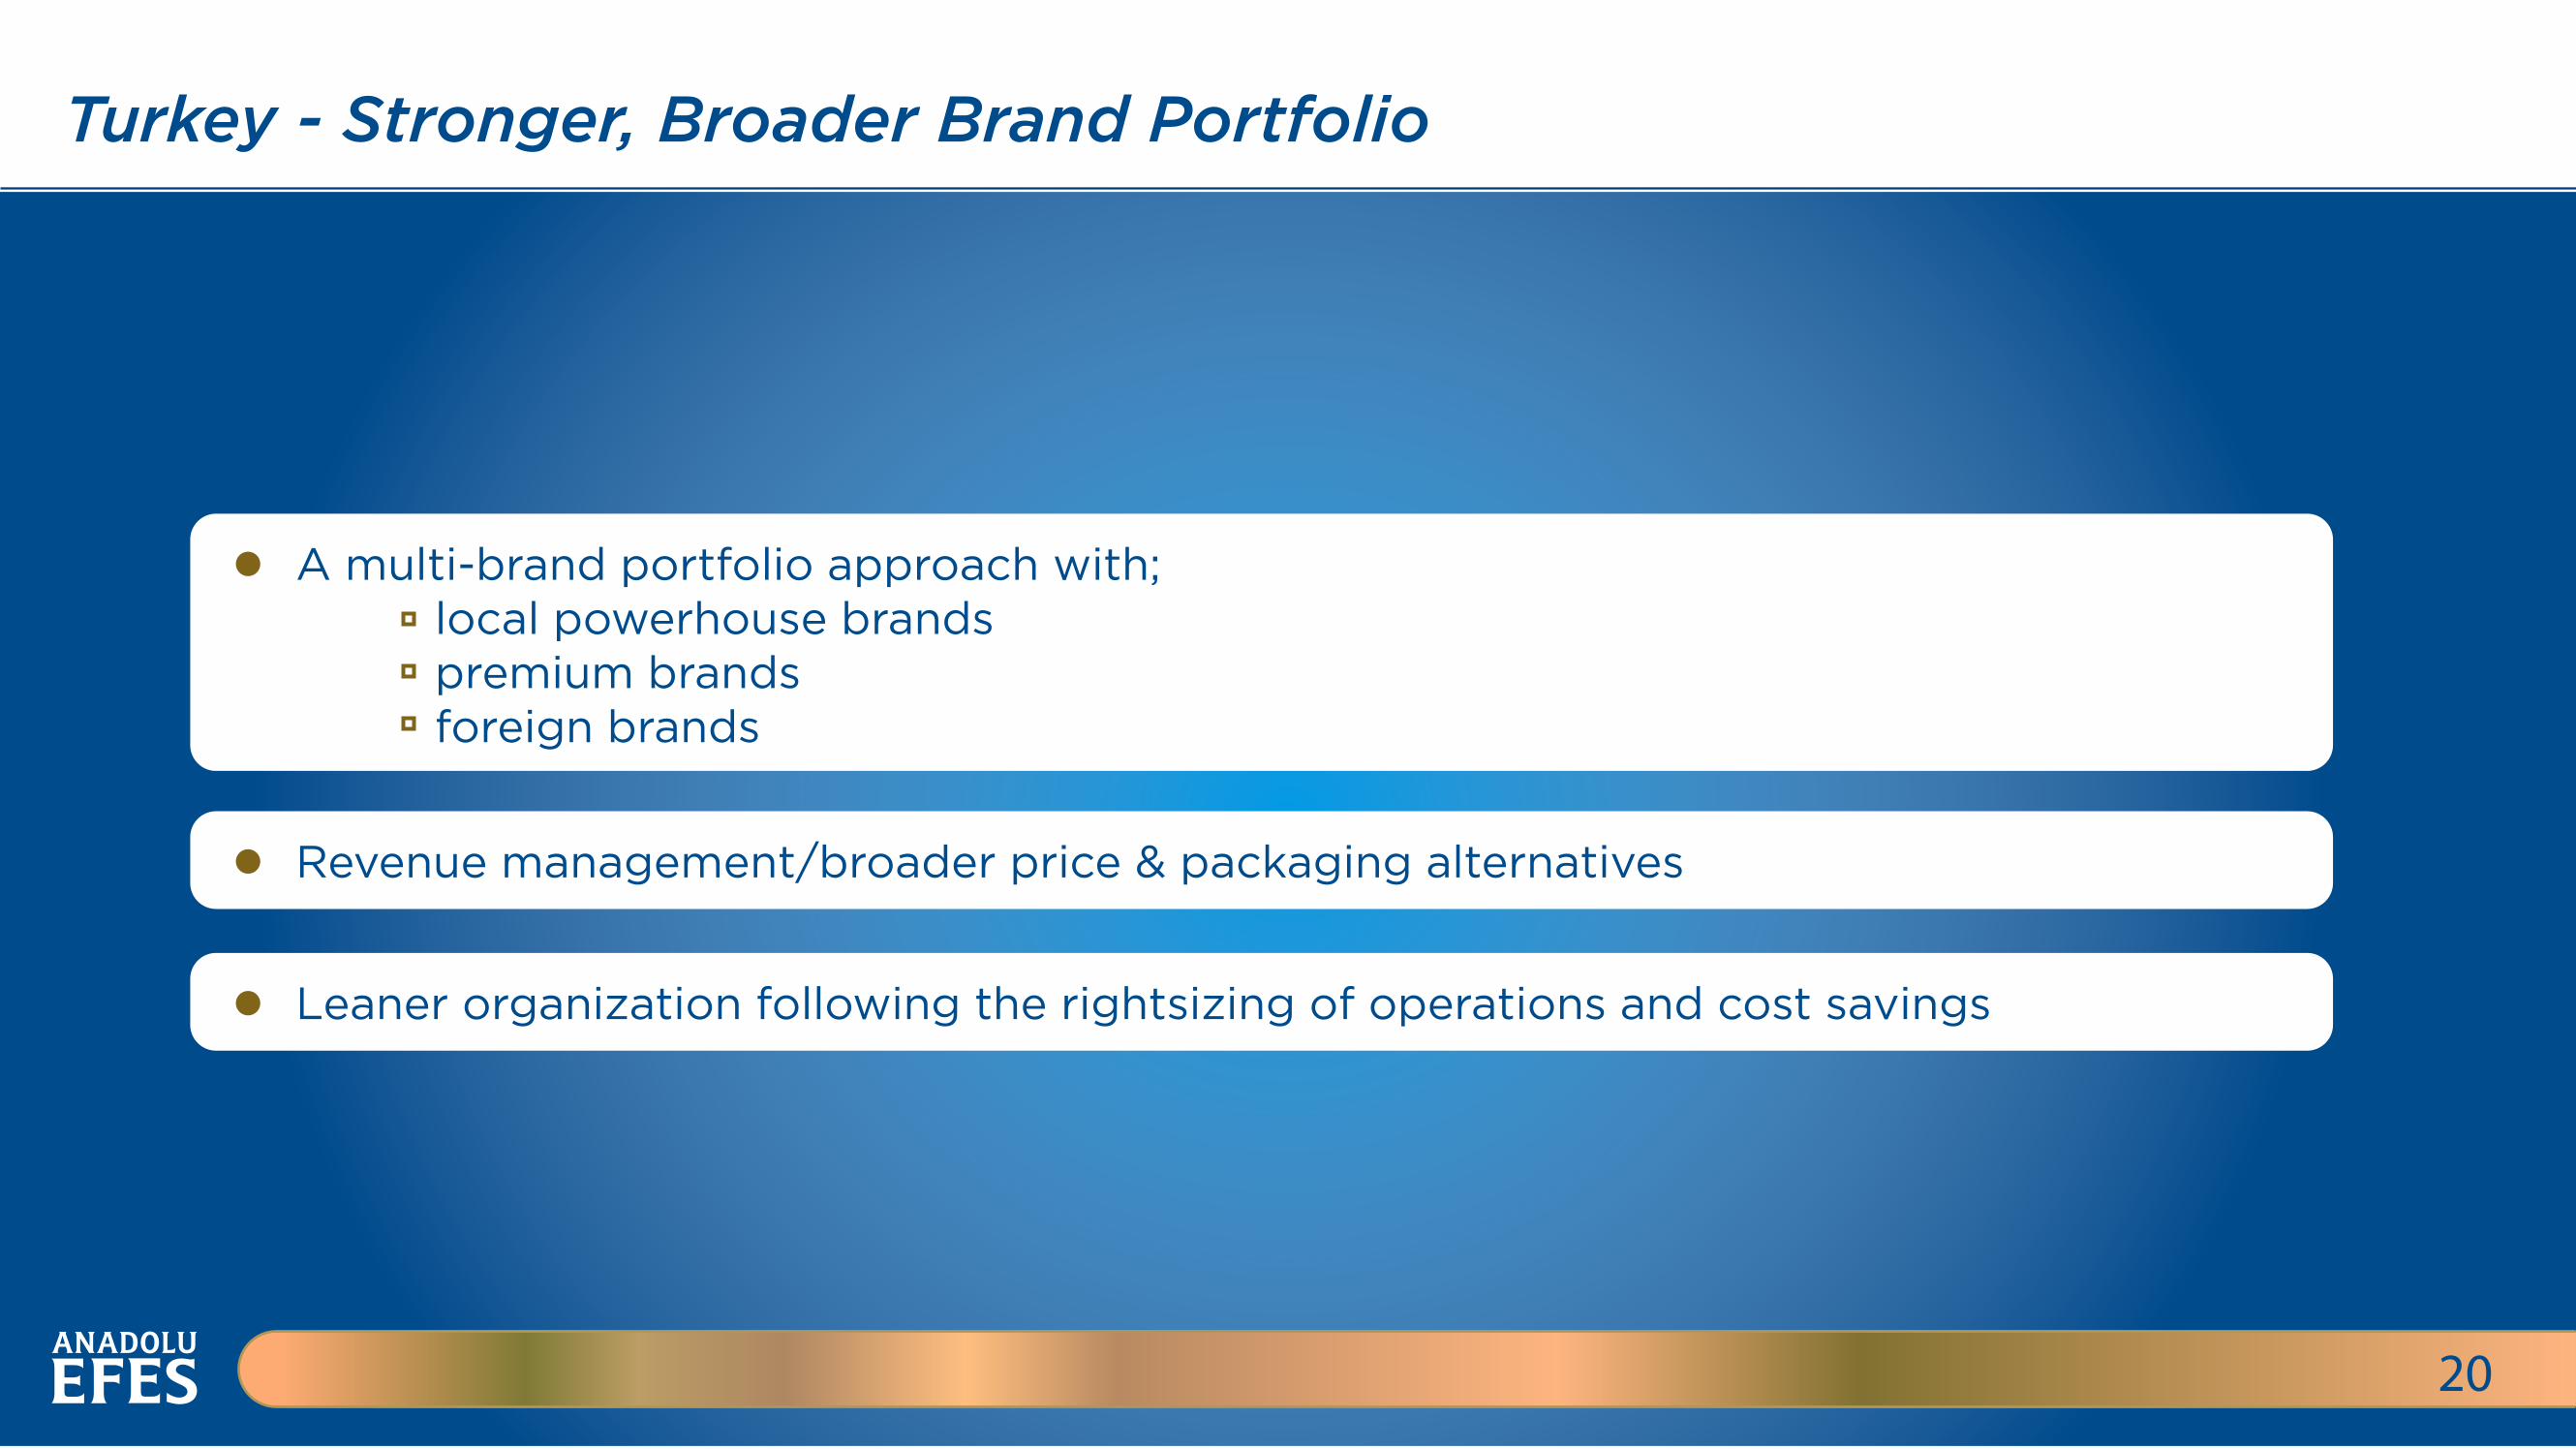
Turkey - Stronger, Broader Brand Portfolio
20
A multi-brand portfolio approach with; local powerhouse brands premium brands foreign brands
Revenue management/broader price & packaging alternatives
Leaner organization following the rightsizing of operations and cost savings
Russia - Well-positioned in the World’s 4th Largest Beer Market
21
Broader premium portfolio to grow value share
New sales operating model & RTM projects
E�cient footprint
Continued to beat our volume target in 2Q2015
Delayed opportunities due to continued challenges in 2015
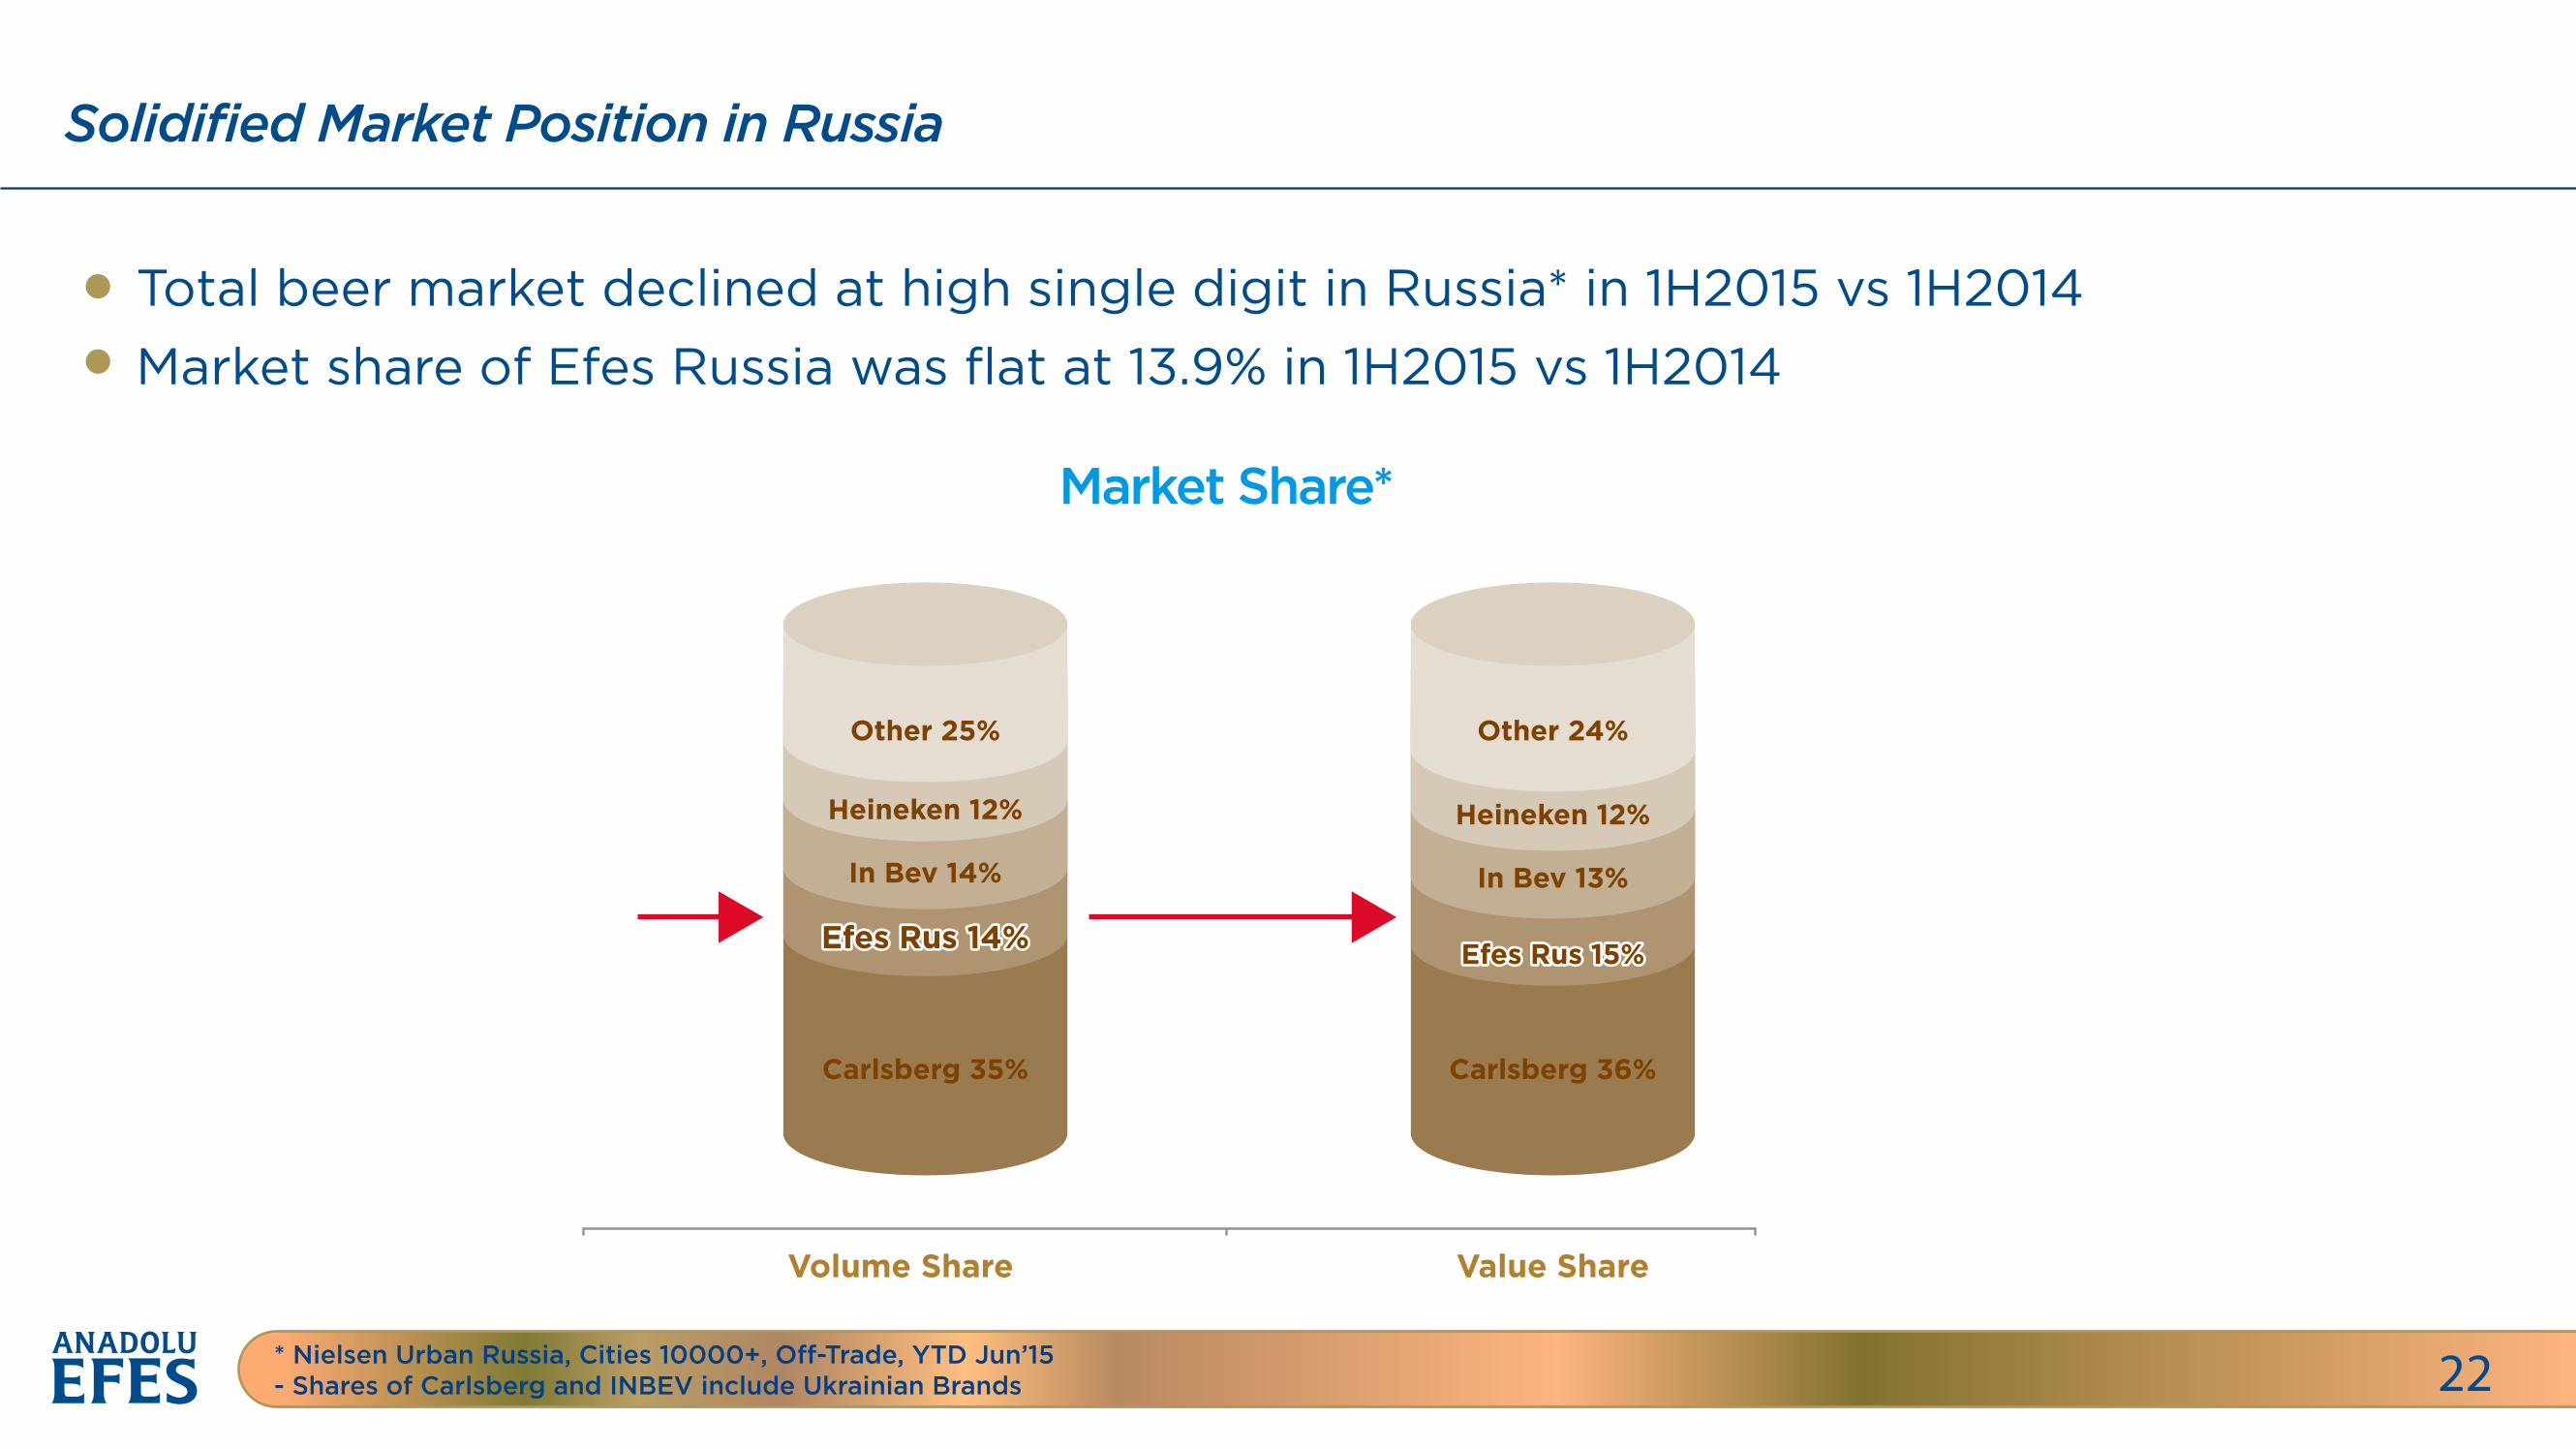
Solidified Market Position in Russia
22
Total beer market declined at high single digit in Russia* in 1H2015 vs 1H2014Market share of Efes Russia was flat at 13.9% in 1H2015 vs 1H2014
Carlsberg 35%
In Bev 14%
Heineken 12%
Other 25%
Carlsberg 36%
In Bev 13%
Heineken 12%
Other 24%
Volume Share Value Share
Market Share*
* Nielsen Urban Russia, Cities 10000+, O�-Trade, YTD Jun’15- Shares of Carlsberg and INBEV include Ukrainian Brands
Other Operations - Strongly Positioned in CIS Countries
23
Challenging period in the region marked with economic, political and industry-specific issues unresolved geo-political issues in Ukraine since 2014 political issues in Moldova and consumer demand weakness in Kazakhstan continued risk of further devaluations in 2015 in some countries
Savings in OPEX & other optimization projects successfully initiated
Excluding Ukraine, EBI’S volume decline was 8.7% in 1H2015
Risks
Risks & Strategic Priorities for 2015
24
Volatilities in the financial markets
Commodity price fluctuations
Macro/ political/geopolitical issues in the region
Priorities
Investments in brand equity to continue, fullfilling consumer trends in all operations
Continued focus on improving e�ciency
Continued focus on balance sheet management
Low capex policy without jeopardizing market investments
Driving value generation
Enhanced risk monitoring and risk mitigation
Soft Drink Operations
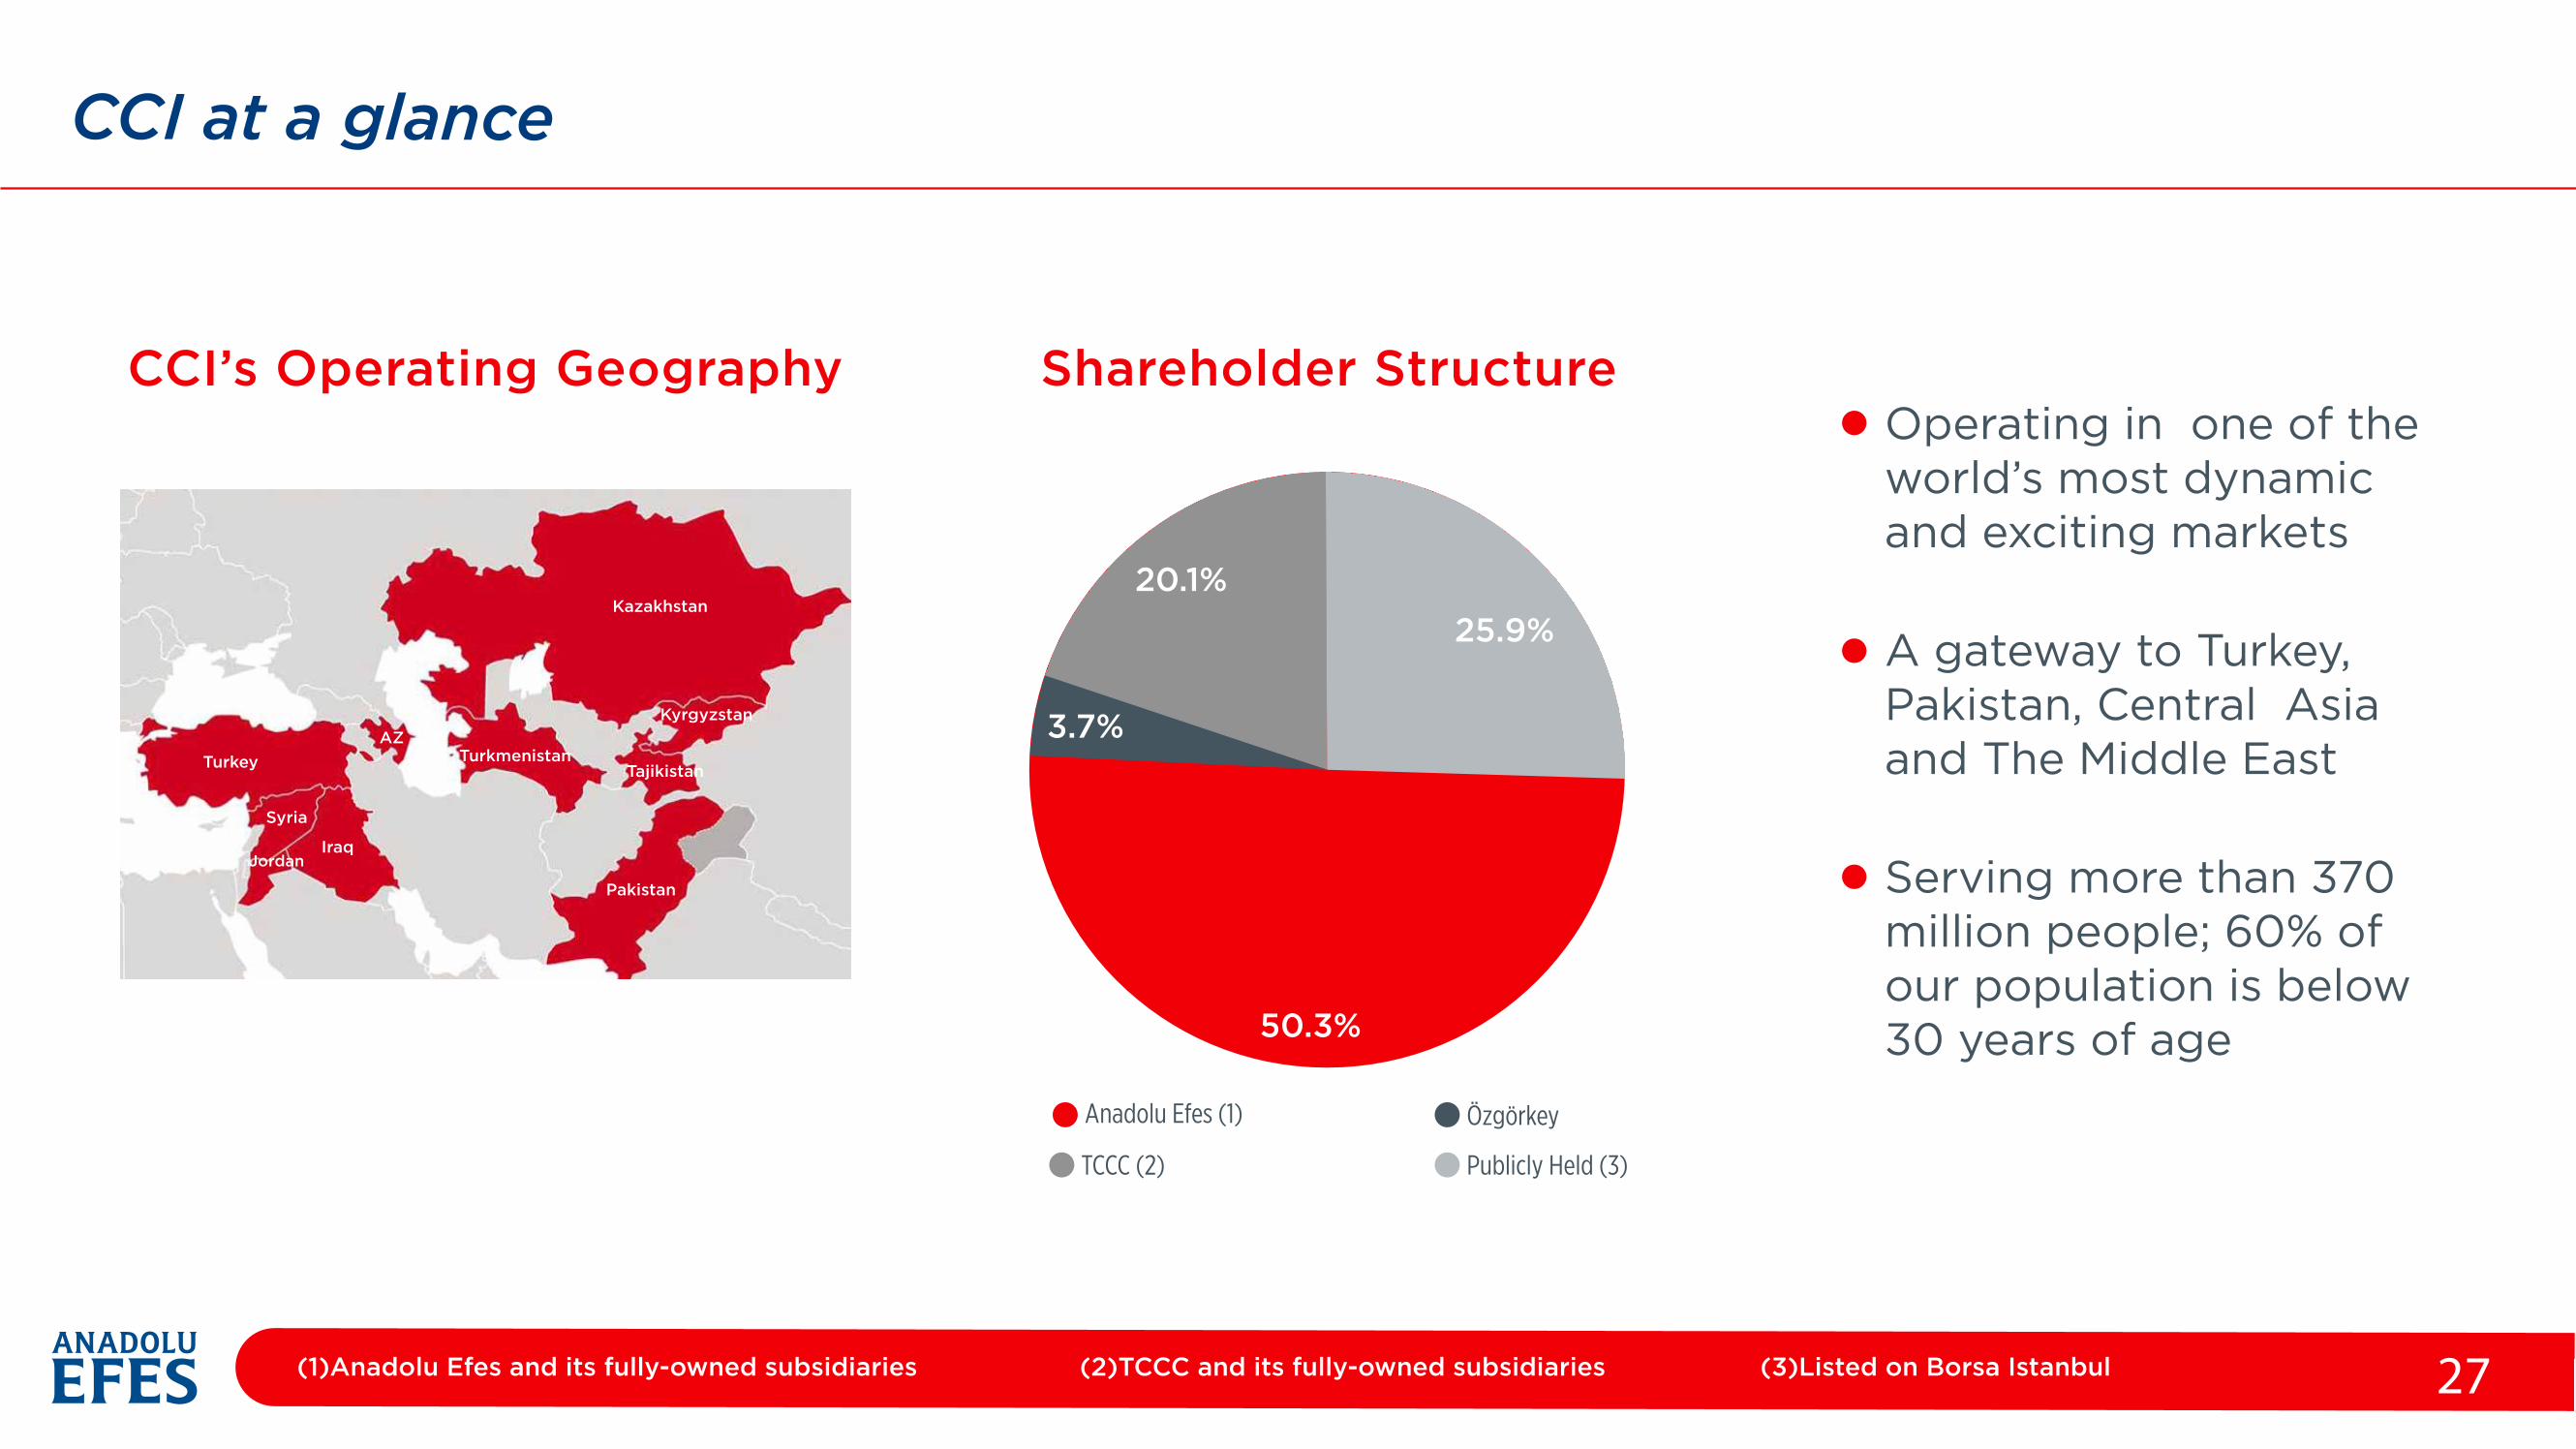
CCI at a glance
27
Shareholder Structure
3.7%
25.9% 20.1%
Anadolu Efes (1) Özgörkey
TCCC (2) Publicly Held (3)
Operating in one of the world’s most dynamic and exciting markets
A gateway to Turkey, Pakistan, Central Asia and The Middle East
Serving more than 370 million people; 60% of our population is below 30 years of age50.3%
(1)Anadolu Efes and its fully-owned subsidiaries (2)TCCC and its fully-owned subsidiaries (3)Listed on Borsa Istanbul
CCI’s Operating Geography
Turkey Turkmenistan
Pakistan
Tajikistan
AZ
Kazakhstan
Kyrgyzstan
Syria
IraqJordan
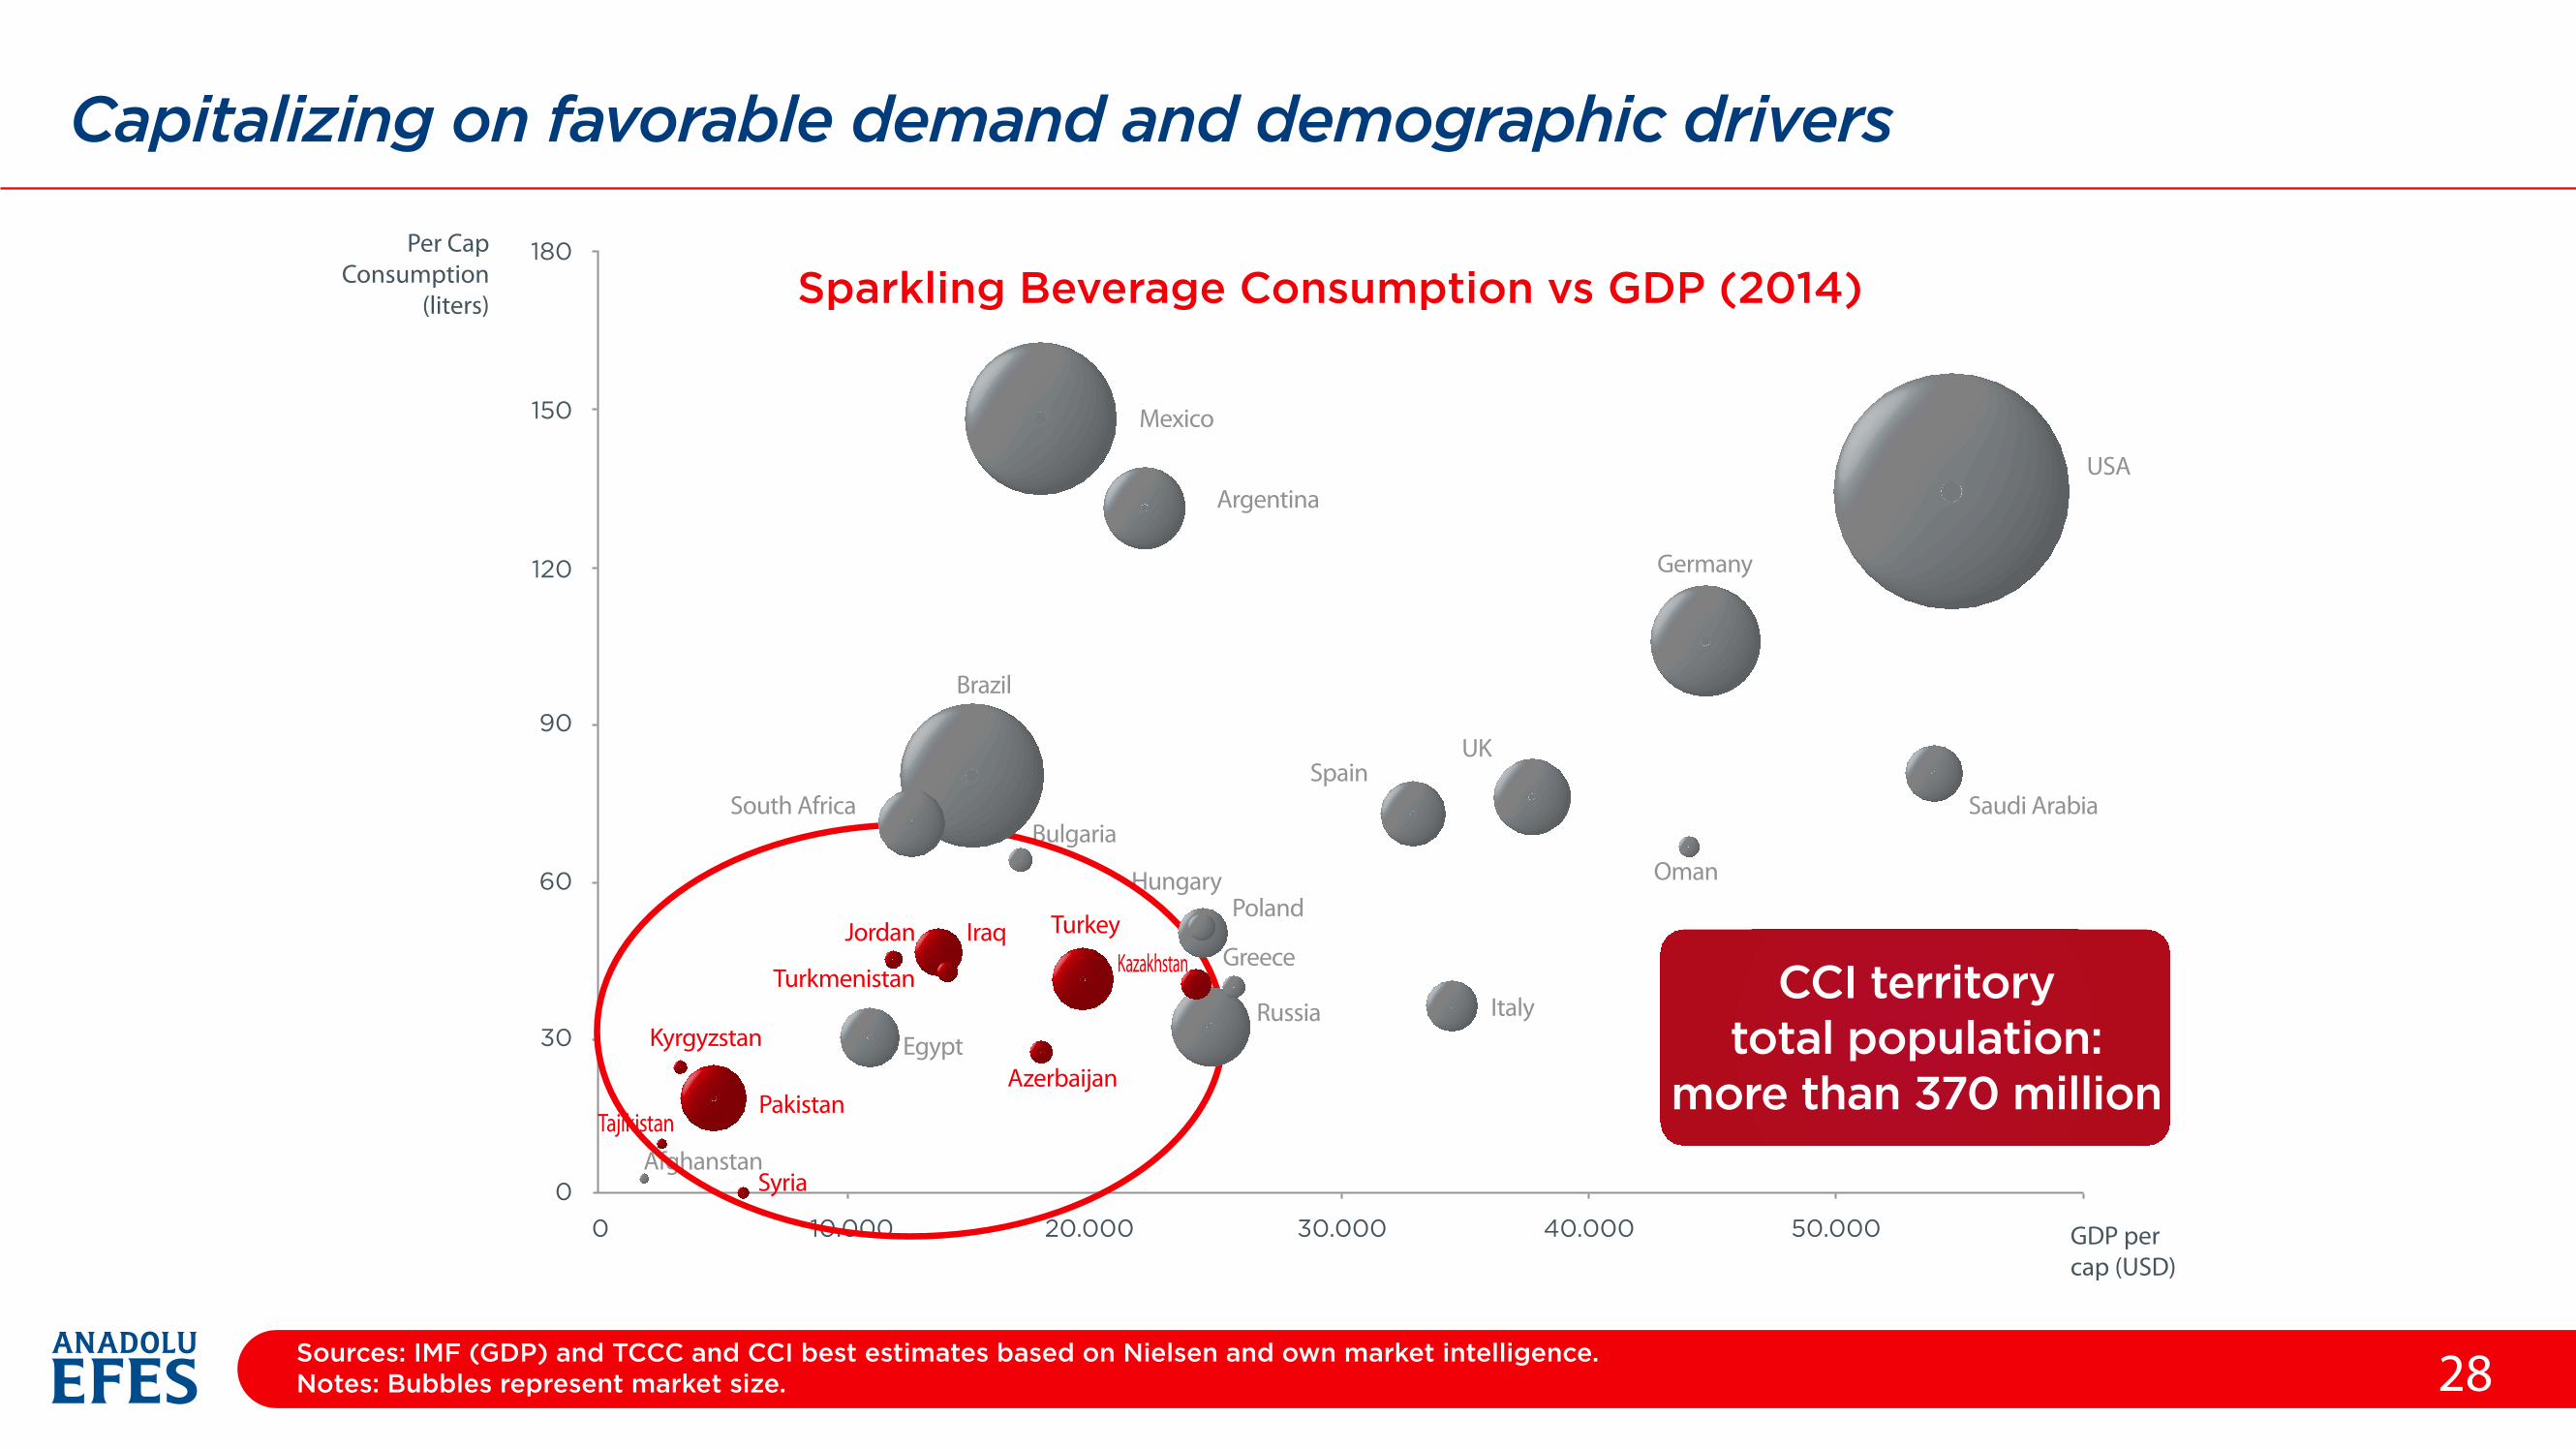
Capitalizing on favorable demand and demographic drivers
28Sources: IMF (GDP) and TCCC and CCI best estimates based on Nielsen and own market intelligence.Notes: Bubbles represent market size.
Sparkling Beverage Consumption vs GDP (2014)Per Cap
Consumption(liters)
150
120
90
60
30
00 10.000 20.000 30.000 40.000 50.000
180
GDP percap (USD)
CCI territorytotal population:
more than 370 million
Mexico
ArgentinaUSA
Germany
Oman
UKSpain
Italy
Brazil
Bulgaria
Hungary
Egypt
AfghanstanSyria
Kyrgyzstan
PakistanTajikistan
Poland
Greece
Russia
Kazakhstan
Azerbaijan
TurkeyIraqJordan
Turkmenistan
South Africa Saudi Arabia
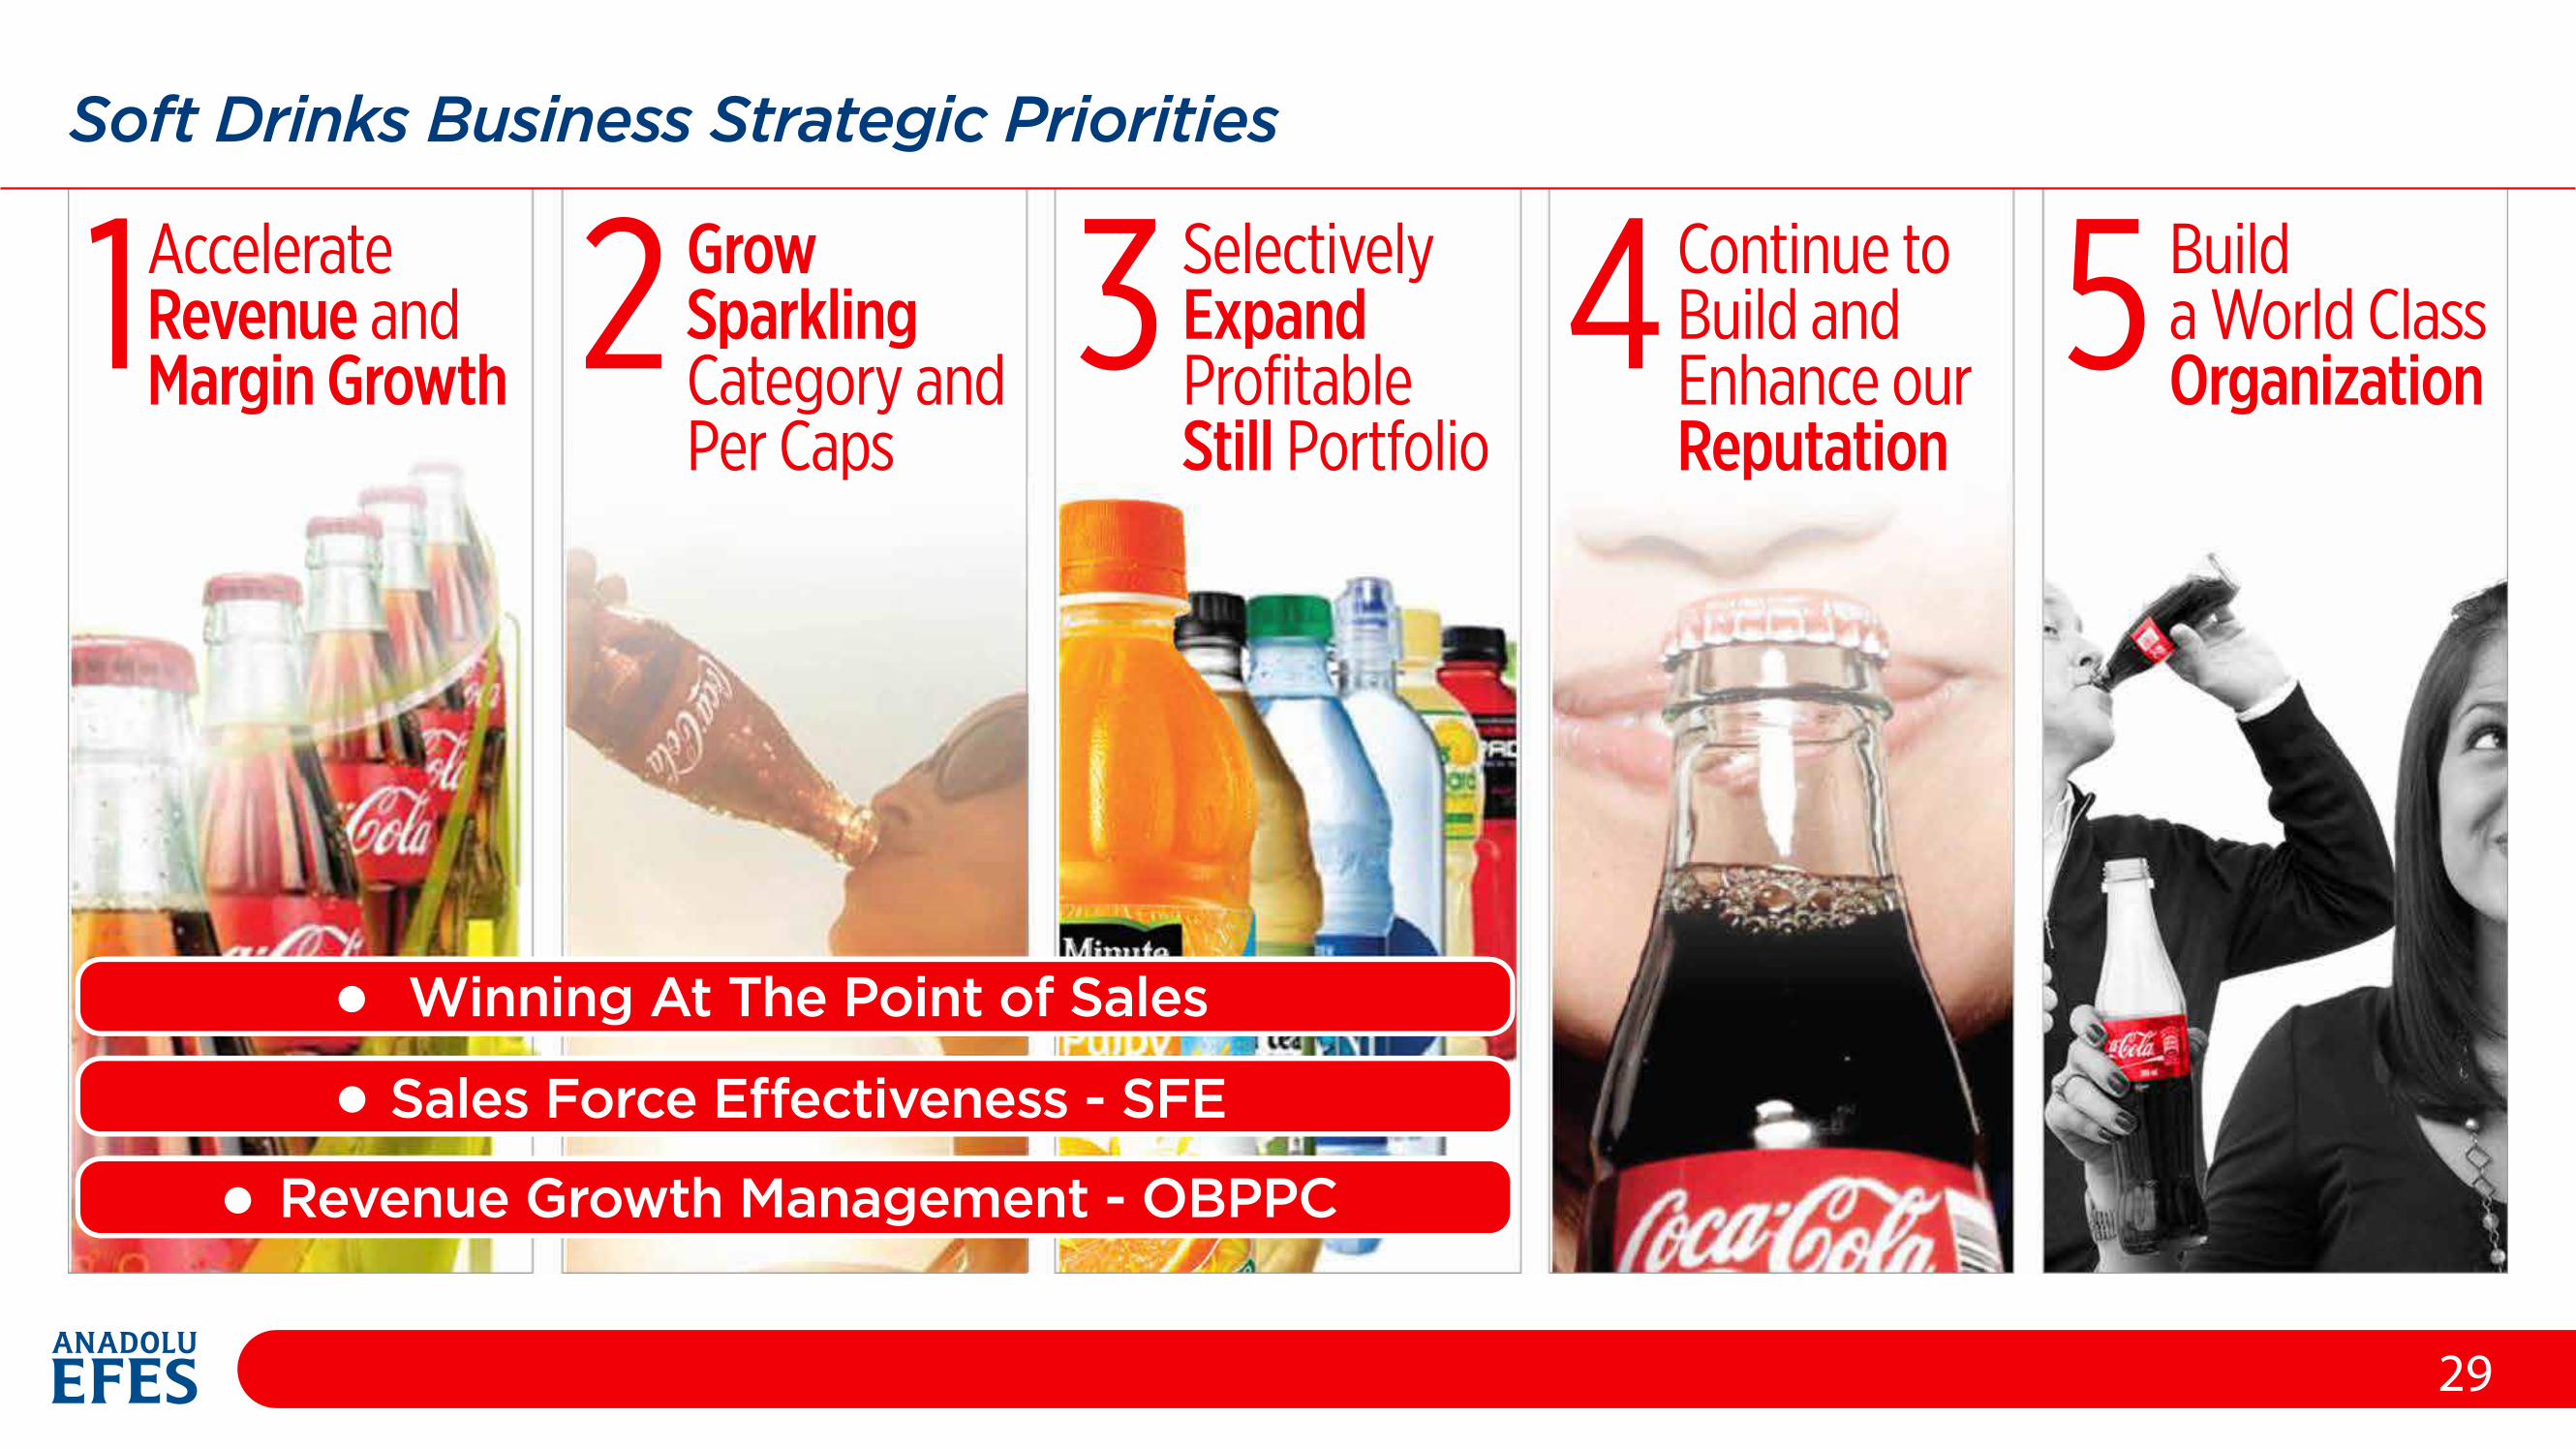
Soft Drinks Business Strategic Priorities
29
Winning At The Point of Sales
Sales Force E�ectiveness - SFE
Revenue Growth Management - OBPPC
1AccelerateRevenue andMargin Growth 2 Grow
SparklingCategory andPer Caps
3 SelectivelyExpandProfitableStill Portfolio
4Continue toBuild andEnhance ourReputation
5 Builda World ClassOrganization
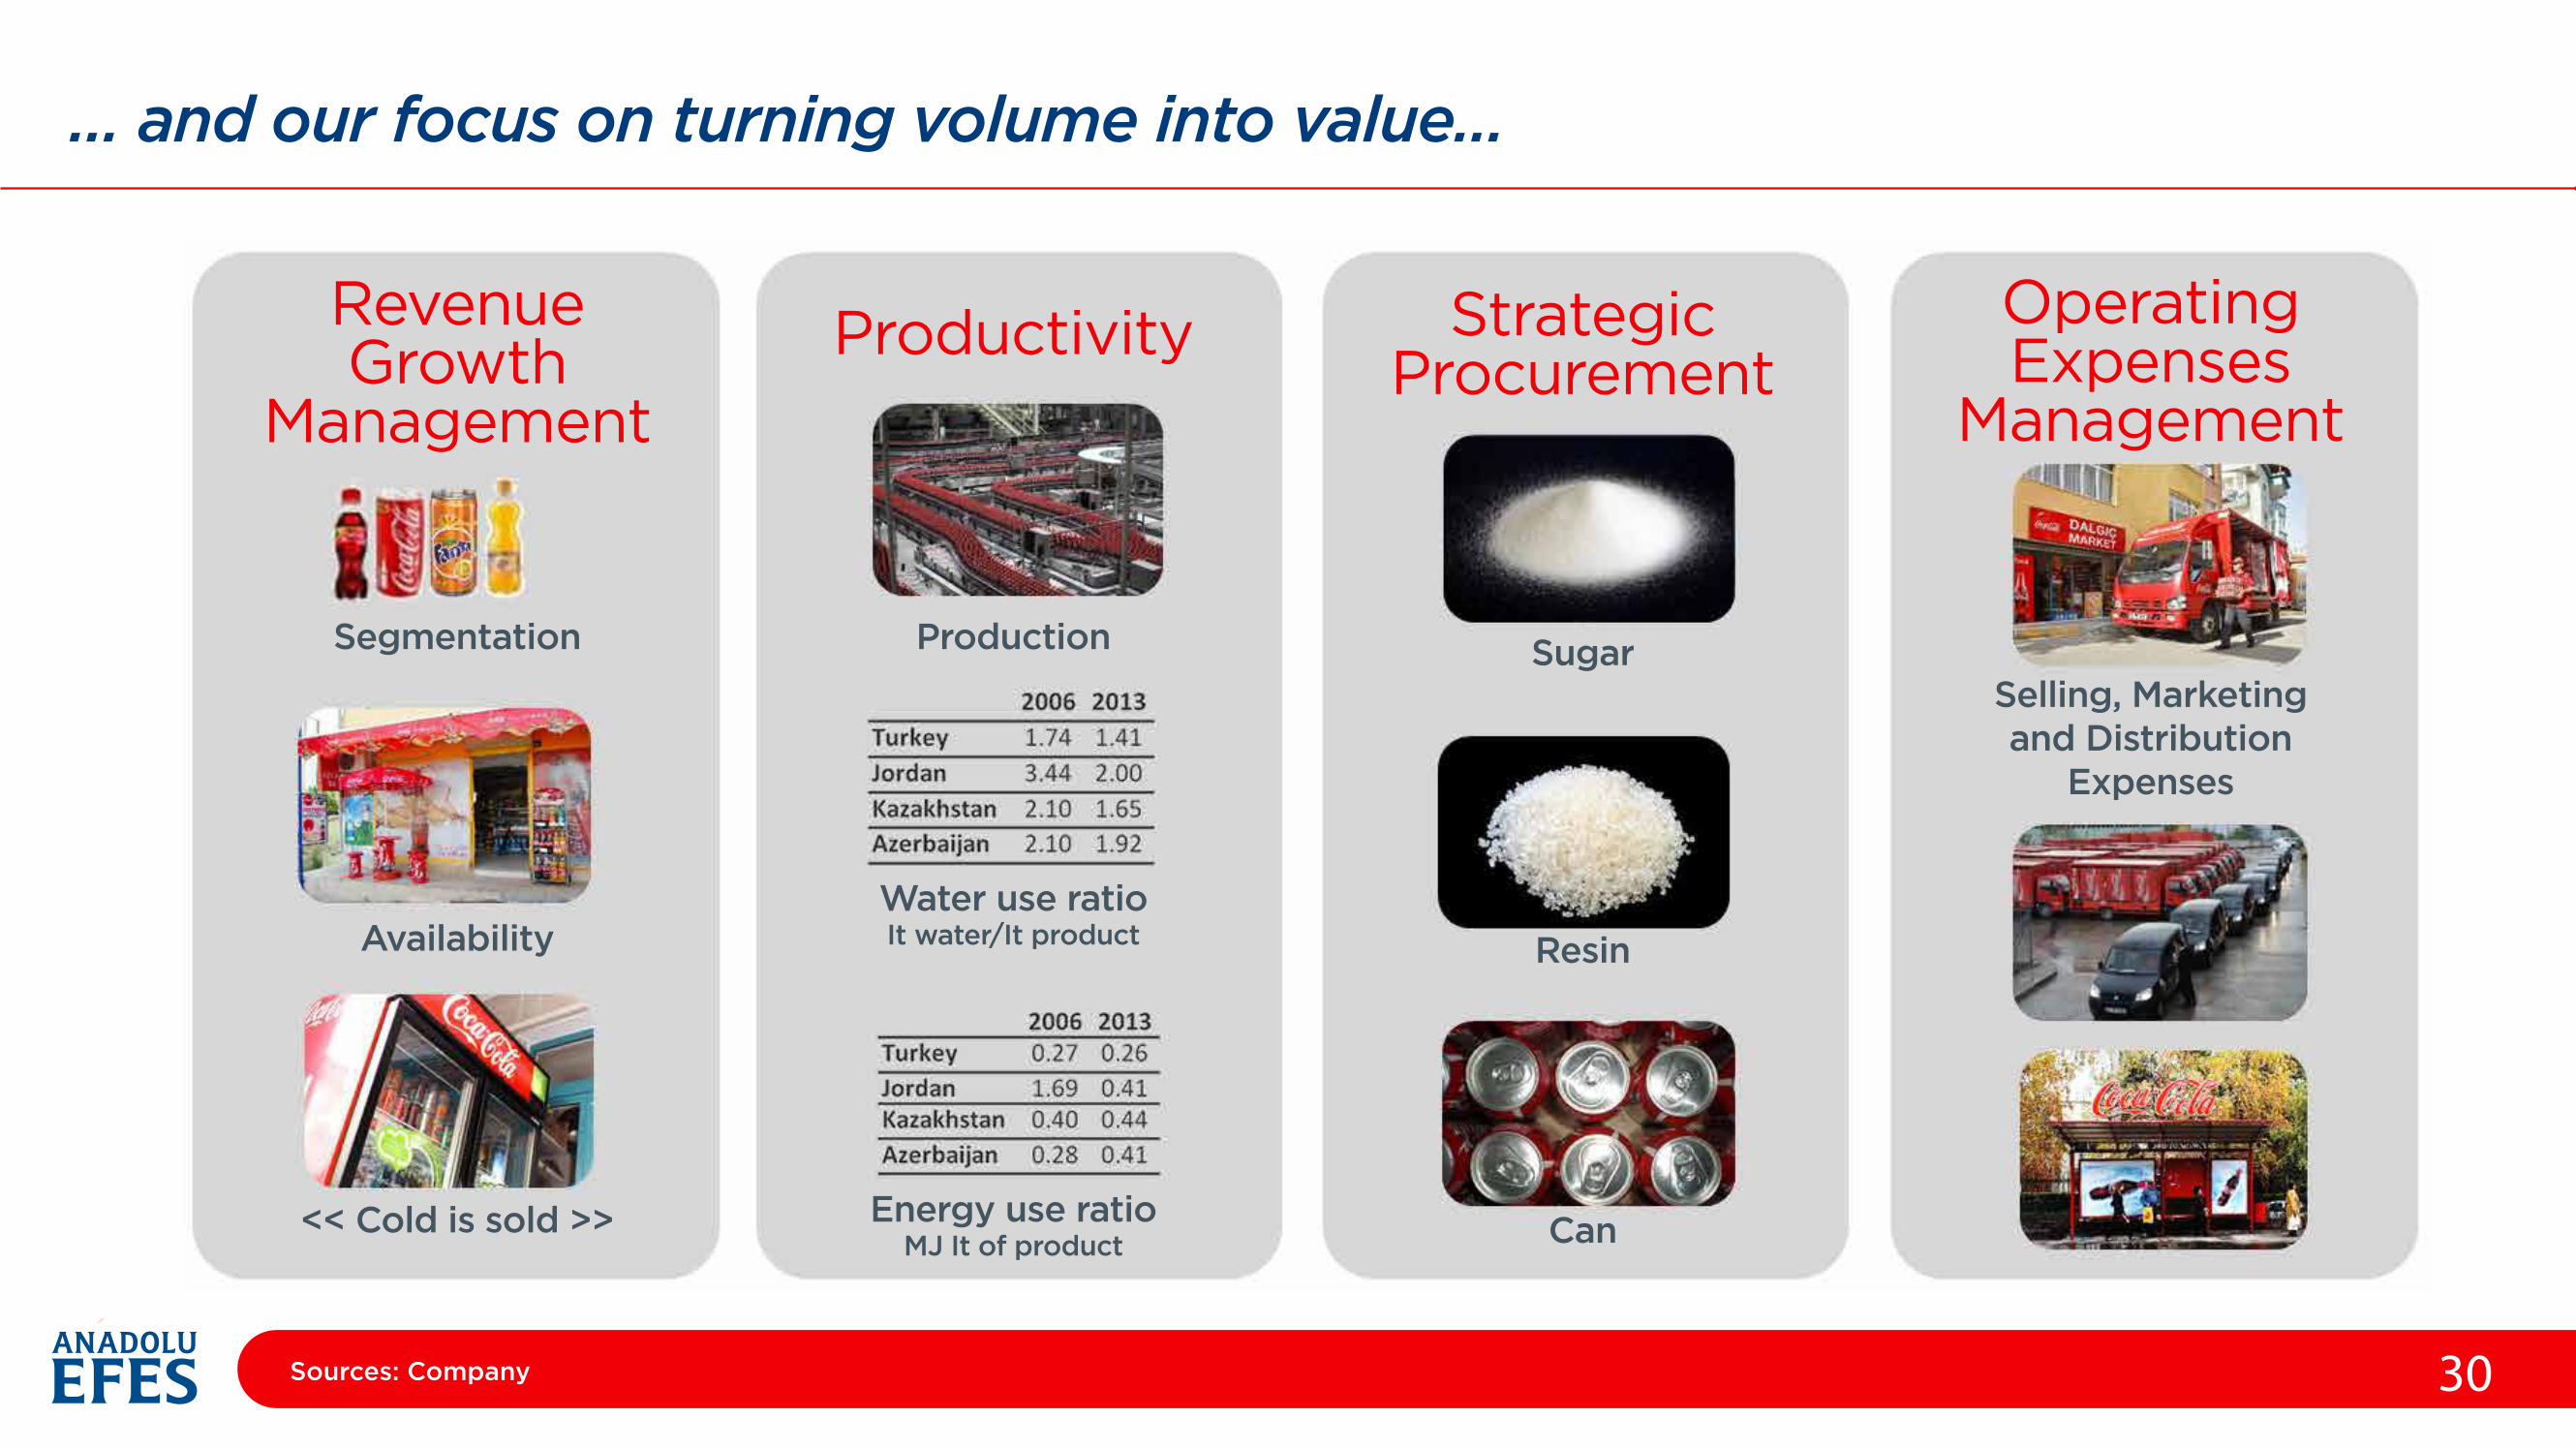
… and our focus on turning volume into value…
30
RevenueGrowth
Management
Segmentation Production SugarSelling, Marketingand Distribution
Expenses
Resin
Can
Water use ratioIt water/It product
Energy use ratioMJ It of product
Availability
<< Cold is sold >>
Productivity StrategicProcurement
OperatingExpenses
Management
Sources: Company
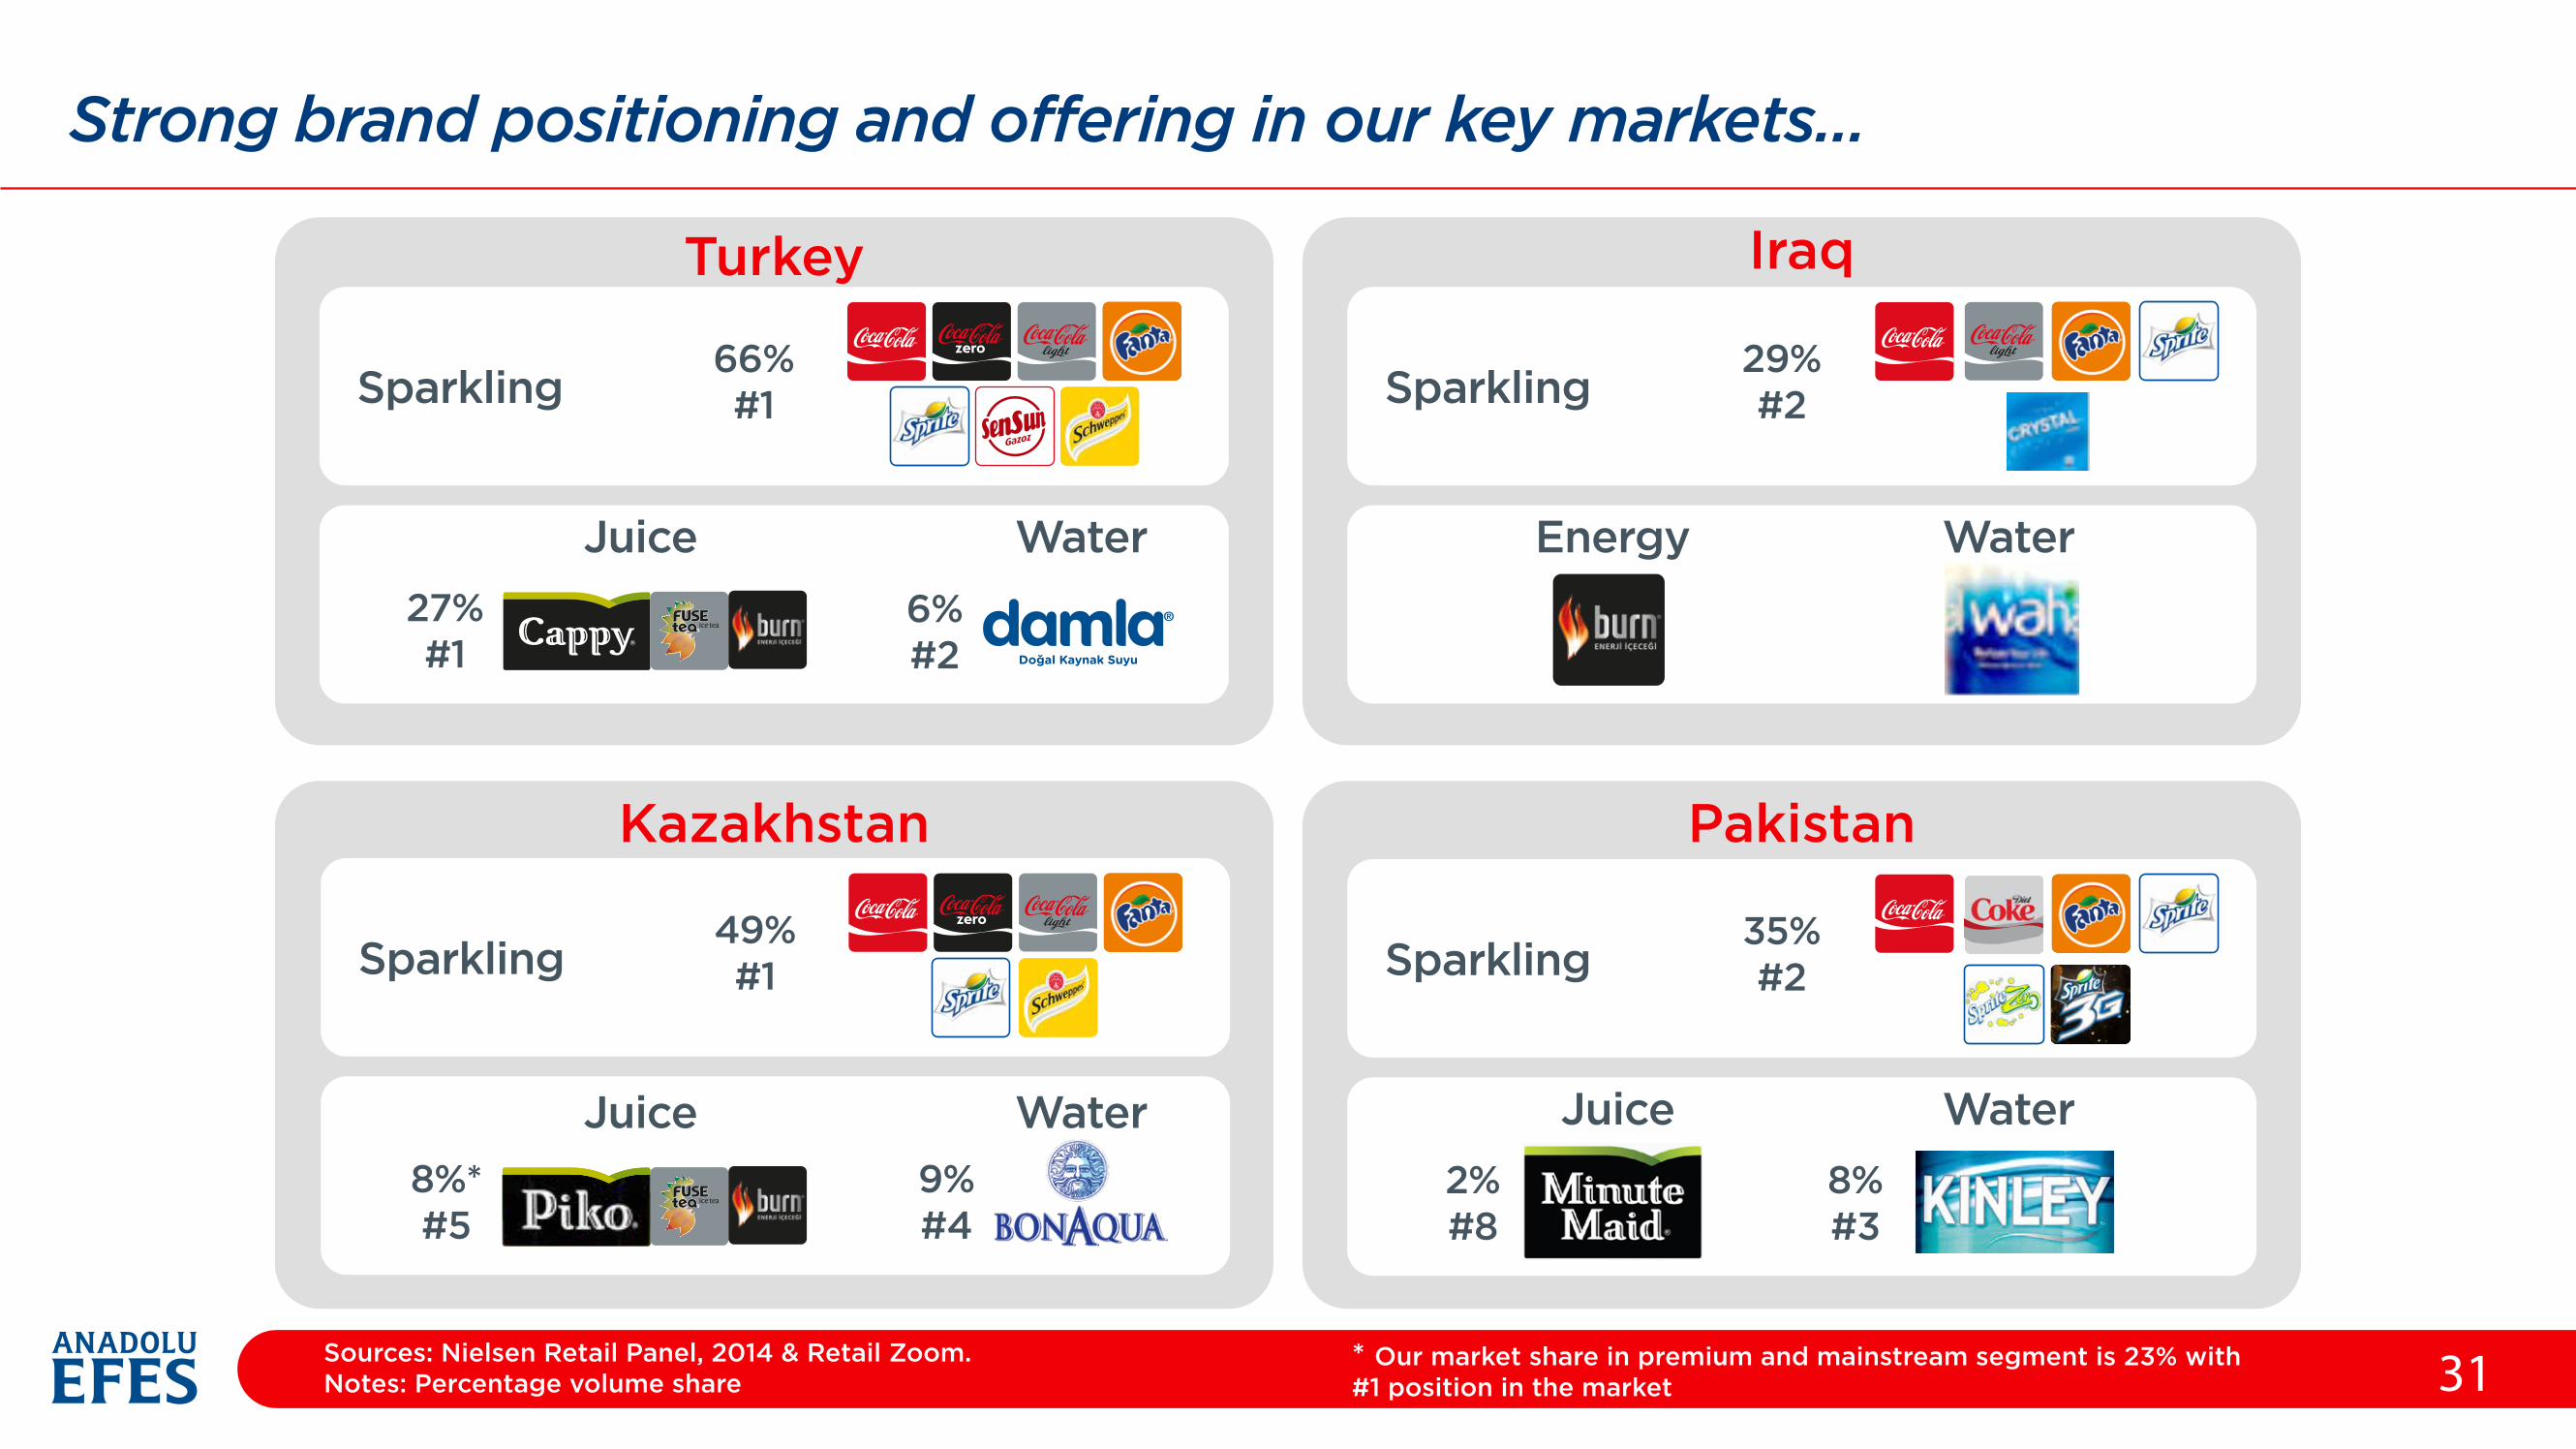
Strong brand positioning and offering in our key markets…
31
Turkey
Kazakhstan
Iraq
Pakistan
Sparkling
Juice Water
66%#1
27%#1
6%#2
Sparkling49%#1
8%*#5
9%#4
Sparkling
Juice Water
35%#2
2%#8
8%#3
Sparkling
Energy Water
29%#2
Sources: Nielsen Retail Panel, 2014 & Retail Zoom.Notes: Percentage volume share
* Our market share in premium and mainstream segment is 23% with#1 position in the market
Juice Water

Beer OperationsFinancials & Outlook
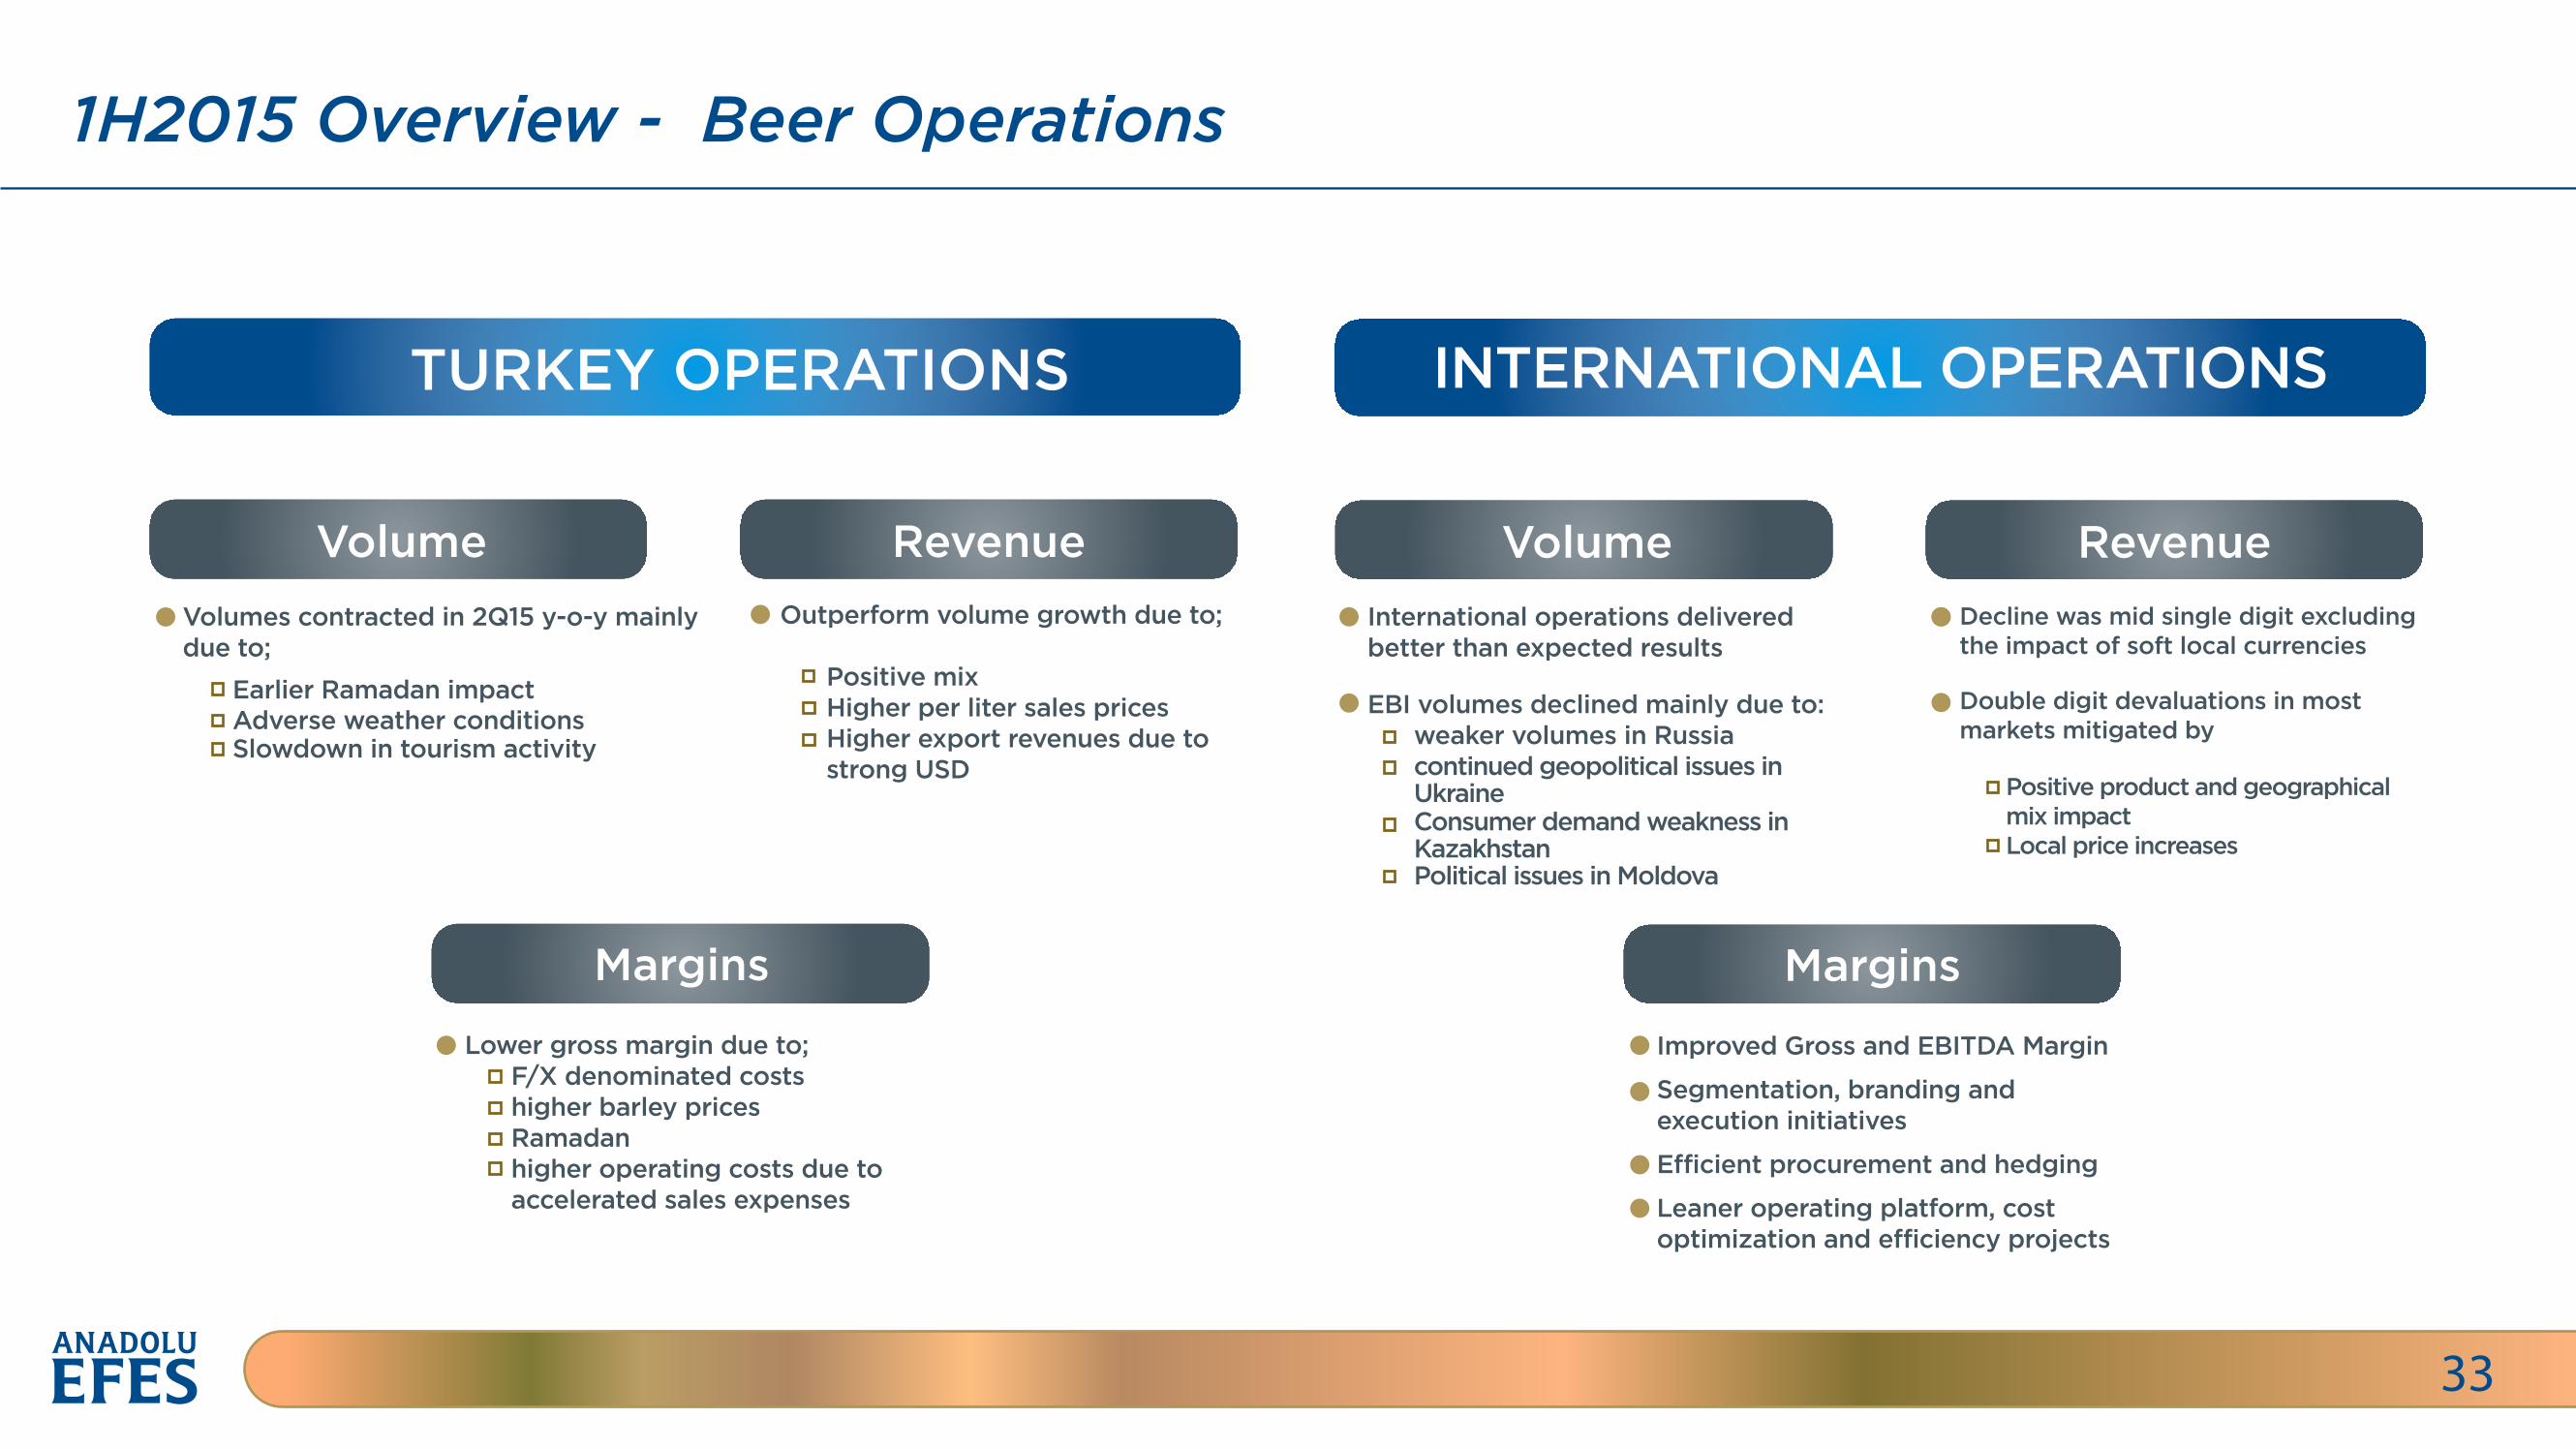
1H2015 Overview - Beer Operations
33
TURKEY OPERATIONS INTERNATIONAL OPERATIONS
Volume RevenueVolumes contracted in 2Q15 y-o-y mainly due to;
International operations delivered better than expected results
EBI volumes declined mainly due to: weaker volumes in Russia continued geopolitical issues in Ukraine Consumer demand weakness in Kazakhstan Political issues in Moldova
Margins
Volume Revenue
Margins
Improved Gross and EBITDA Margin
Segmentation, branding and execution initiatives
E�icient procurement and hedging
Leaner operating platform, cost optimization and e�iciency projects
Outperform volume growth due to; Positive mix Higher per liter sales prices Higher export revenues due to strong USD
Earlier Ramadan impactAdverse weather conditionsSlowdown in tourism activity
Lower gross margin due to; F/X denominated costs higher barley prices Ramadan higher operating costs due to accelerated sales expenses
Decline was mid single digit excluding the impact of soft local currencies
Double digit devaluations in most markets mitigated by
Positive product and geographical mix impact Local price increases
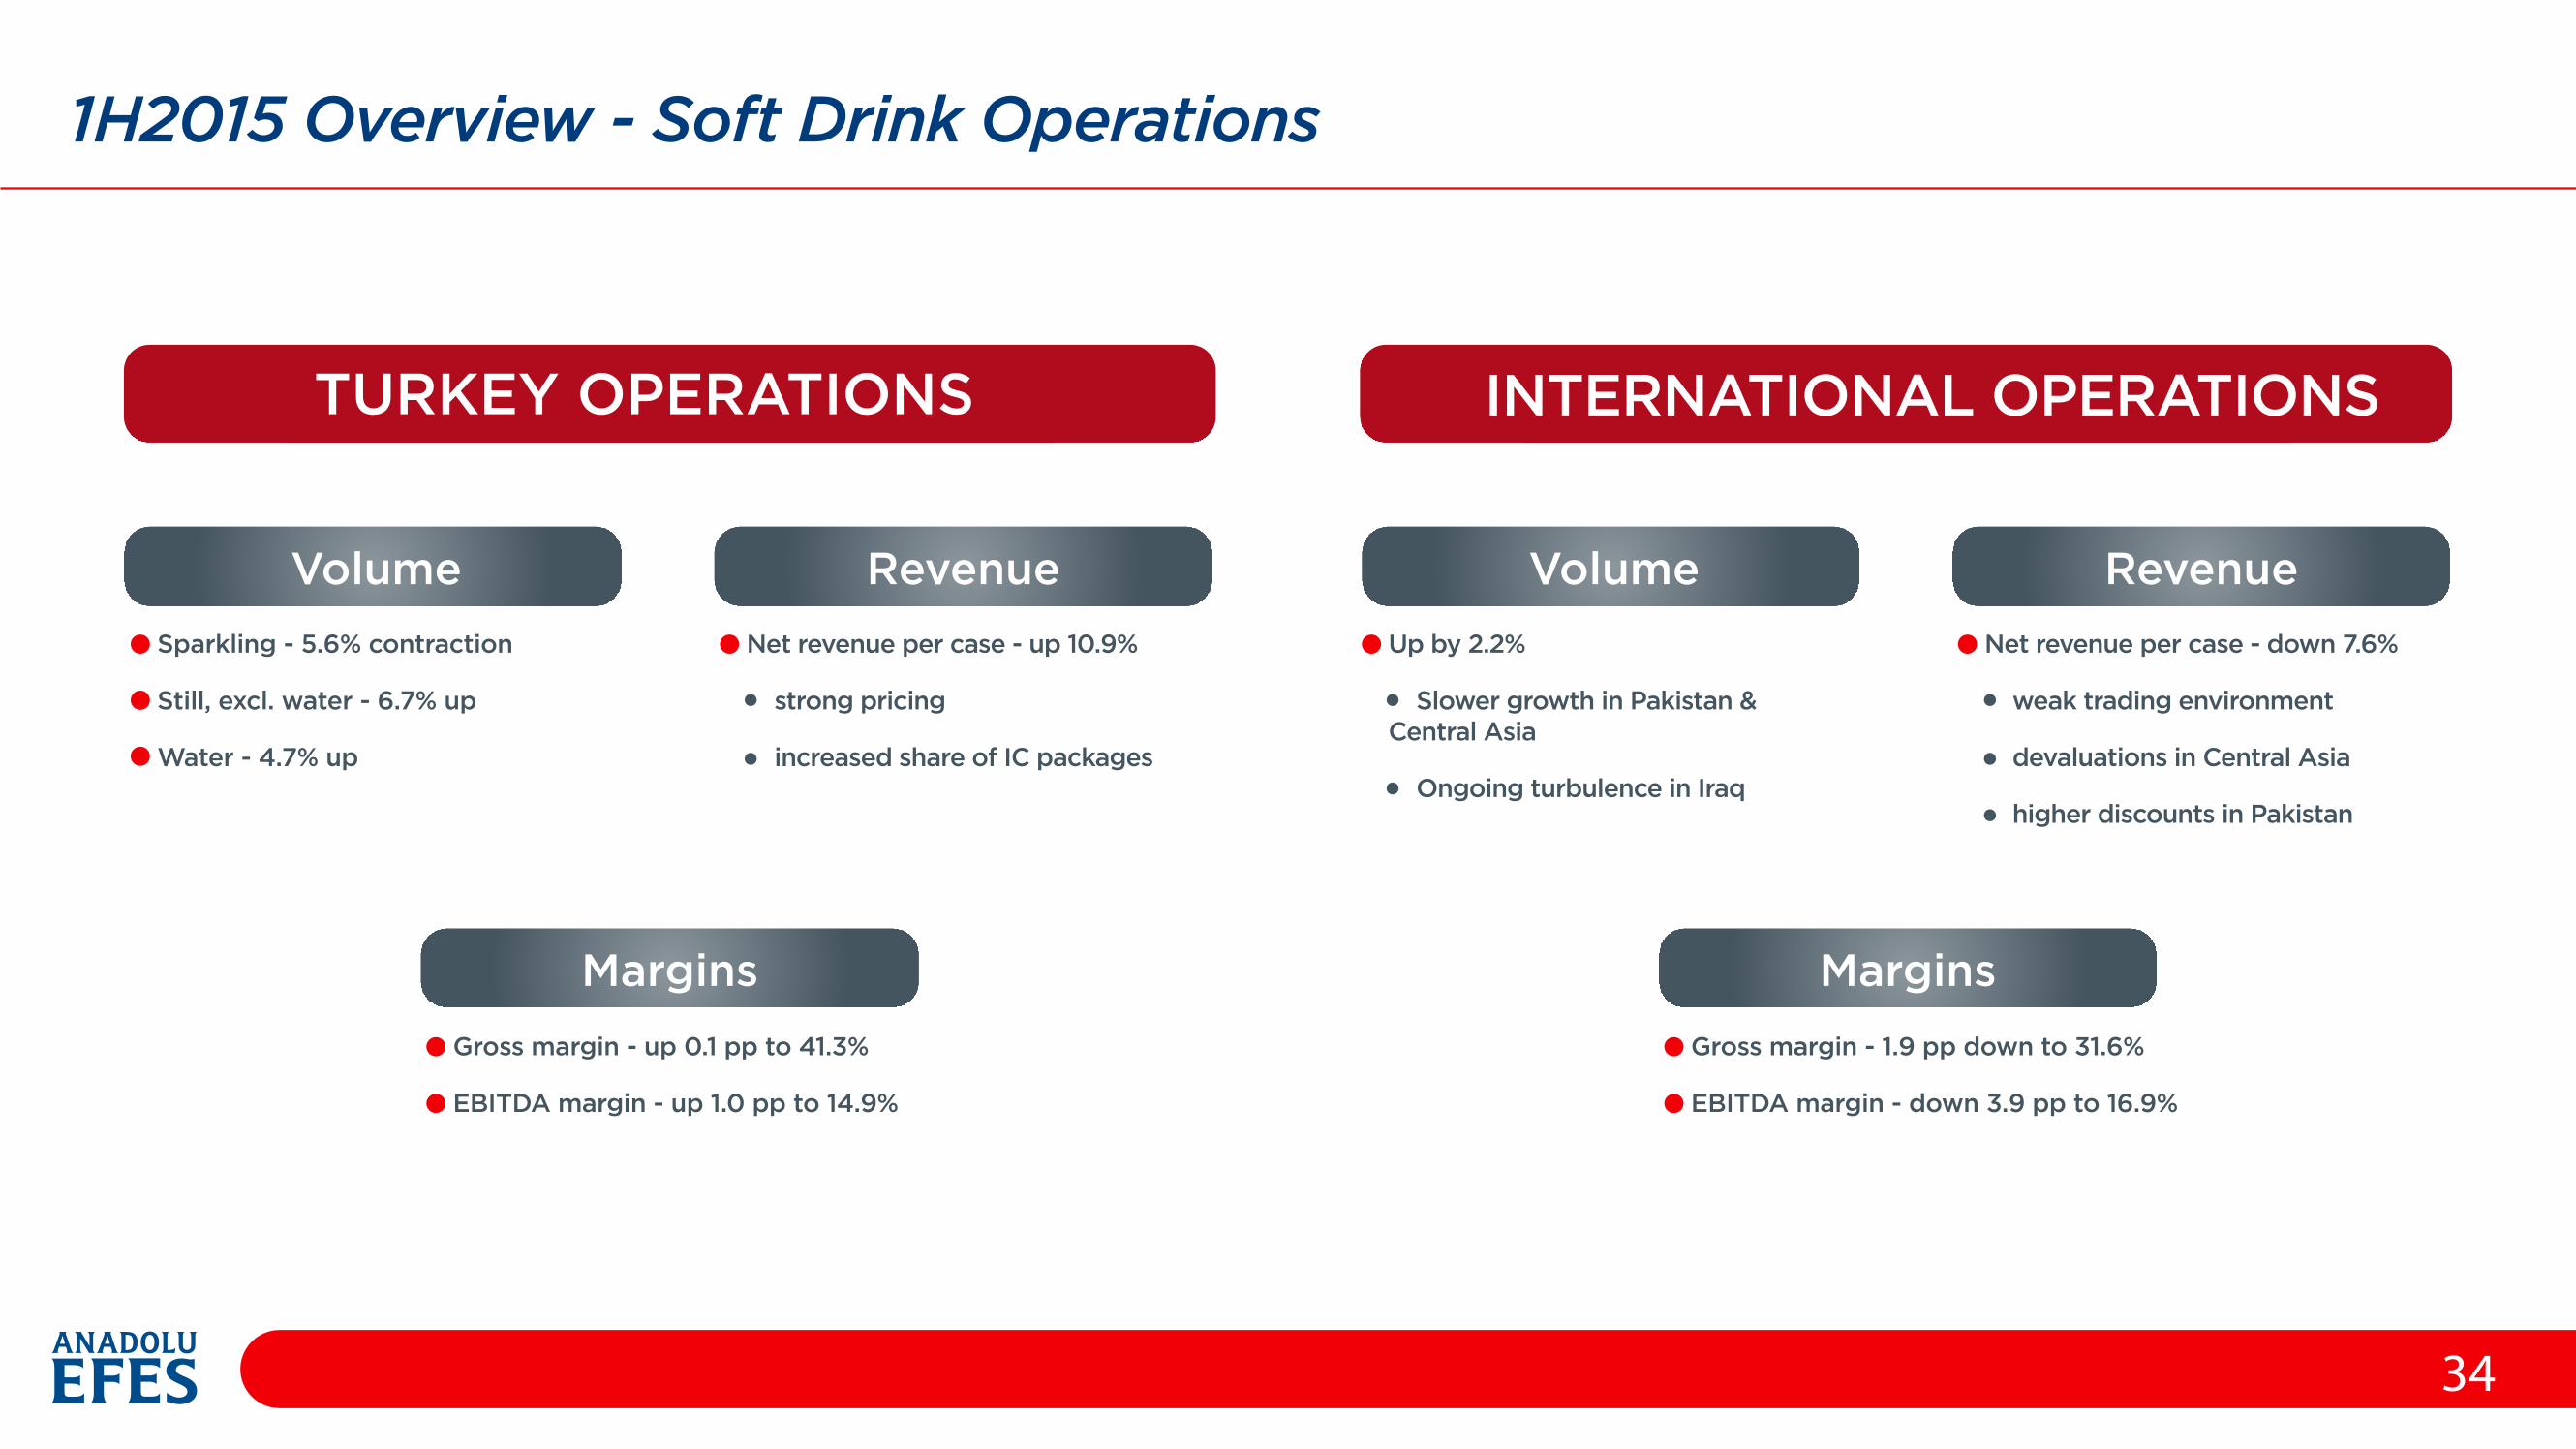
1H2015 Overview - Soft Drink Operations
34
TURKEY OPERATIONS INTERNATIONAL OPERATIONS
Volume Revenue
Margins
Sparkling - 5.6% contraction
Still, excl. water - 6.7% up
Water - 4.7% up
Net revenue per case - up 10.9%
strong pricing
increased share of IC packages
Gross margin - up 0.1 pp to 41.3%
EBITDA margin - up 1.0 pp to 14.9%
Volume Revenue
Margins
Net revenue per case - down 7.6%
weak trading environment
devaluations in Central Asia
higher discounts in Pakistan
Gross margin - 1.9 pp down to 31.6%
EBITDA margin - down 3.9 pp to 16.9%
Up by 2.2%
Slower growth in Pakistan & Central Asia
Ongoing turbulence in Iraq
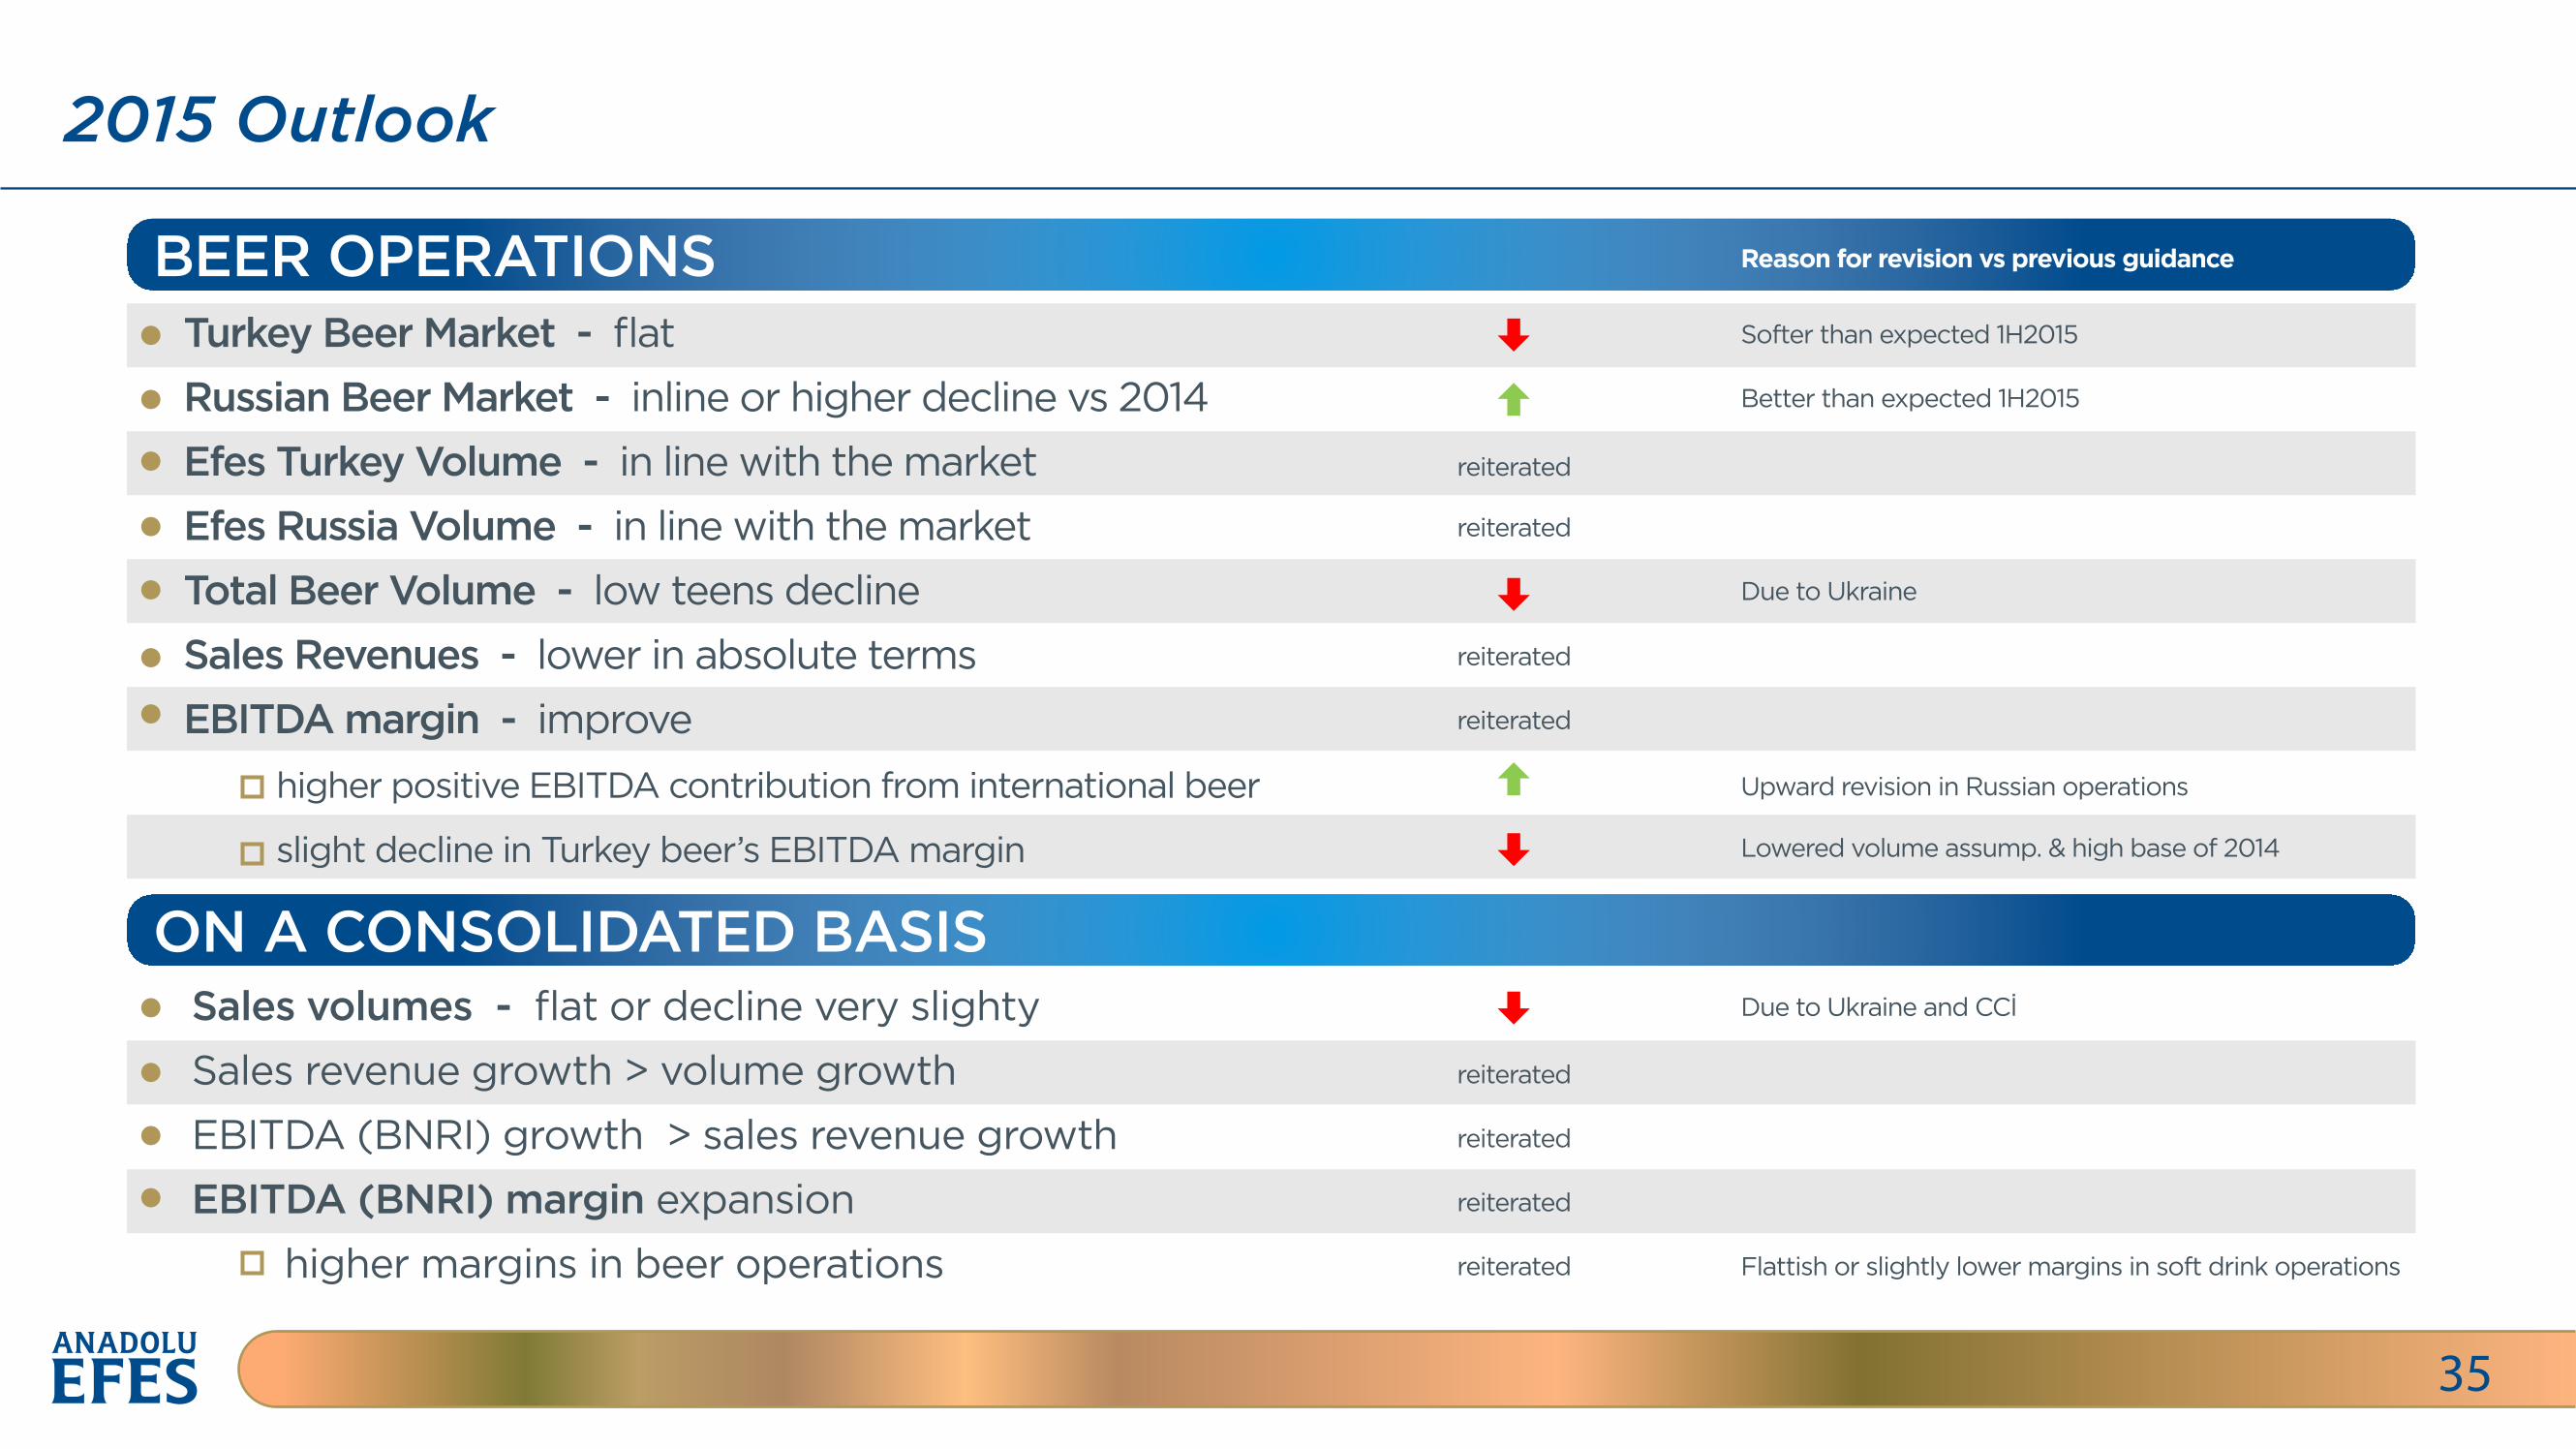
2015 Outlook
35
Turkey Beer Market - flat
Russian Beer Market - inline or higher decline vs 2014
Efes Turkey Volume - in line with the market
Efes Russia Volume - in line with the market
Total Beer Volume - low teens decline
Sales Revenues - lower in absolute terms
EBITDA margin - improve
higher positive EBITDA contribution from international beer
slight decline in Turkey beer’s EBITDA margin
BEER OPERATIONS
ON A CONSOLIDATED BASIS Sales volumes - flat or decline very slighty
Sales revenue growth > volume growth
EBITDA (BNRI) growth > sales revenue growth
EBITDA (BNRI) margin expansion
higher margins in beer operations
reiterated
Softer than expected 1H2015
Reason for revision vs previous guidance
Better than expected 1H2015
Upward revision in Russian operations
Lowered volume assump. & high base of 2014
Due to Ukraine
Due to Ukraine and CCİ
Flattish or slightly lower margins in soft drink operations
reiterated
reiterated
reiterated
reiterated
reiterated
reiterated
reiterated
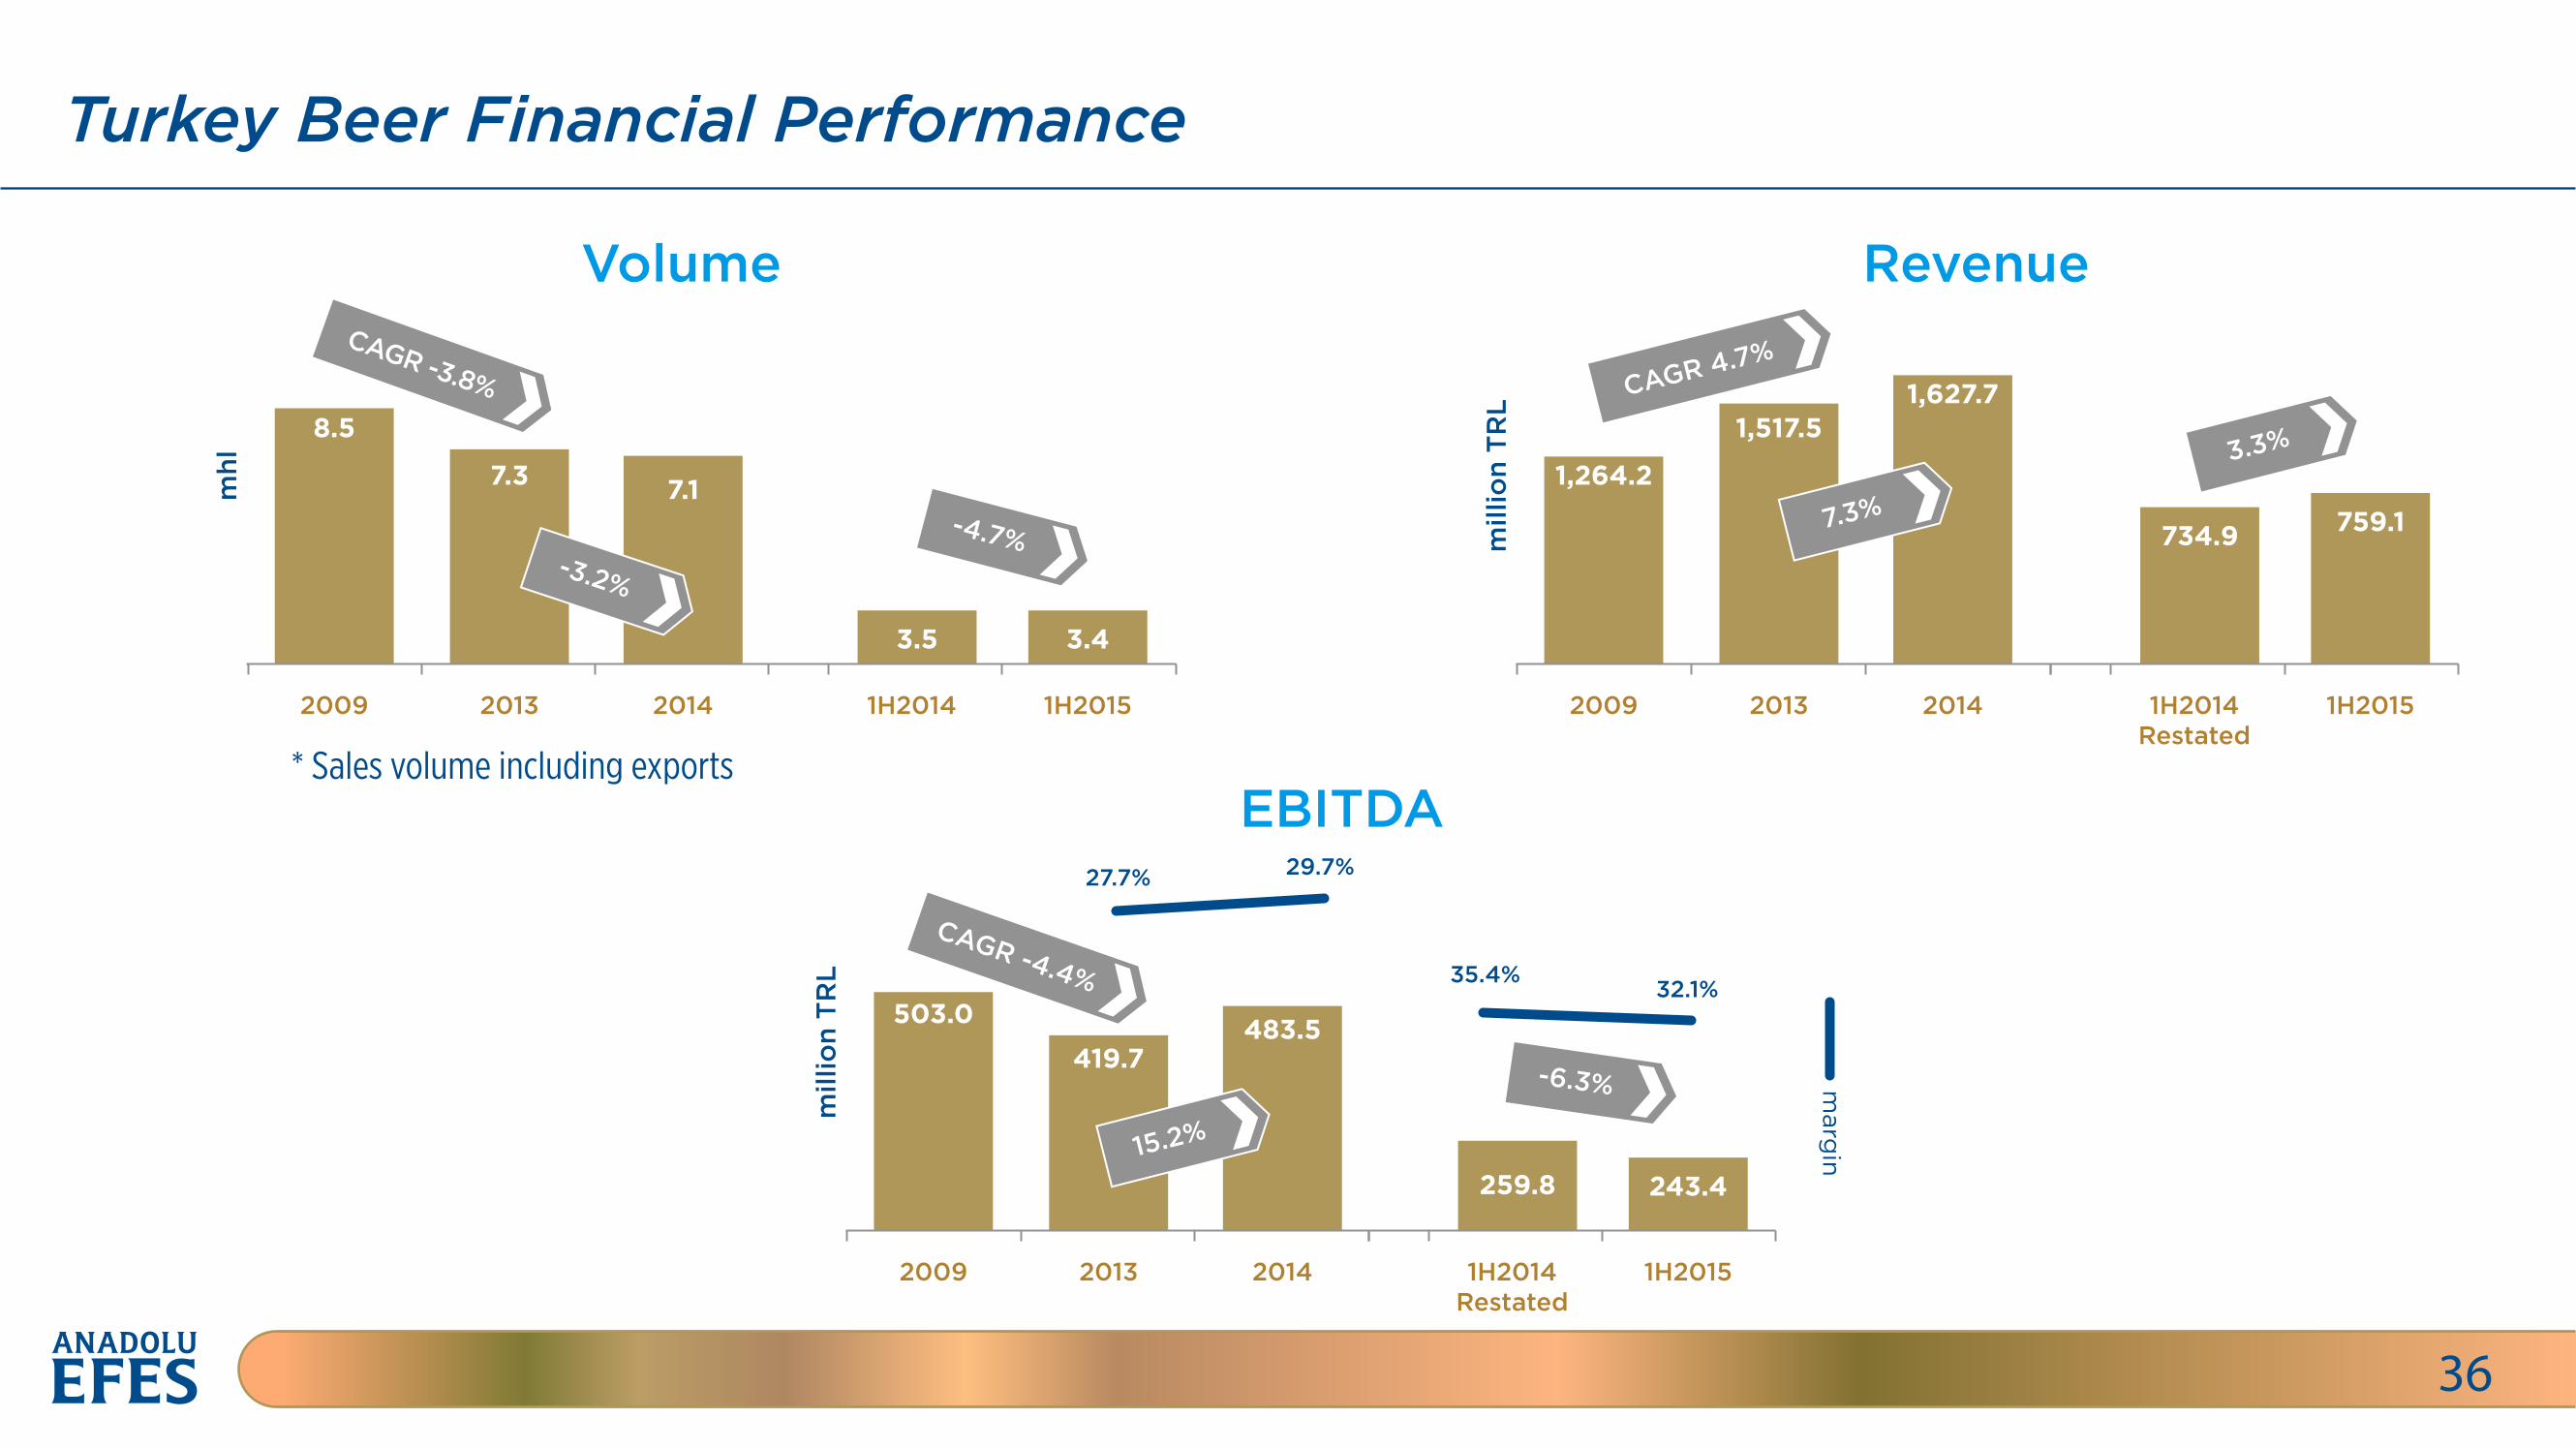
Turkey Beer Financial Performance
36
mhl
2009 2013
8.5
7.3
2014
7.1
1H2014 1H2015
3.5 3.4
CAGR -3.8%
* Sales volume including exports
-3.2%
-4.7%
Volume
1H2014Restated
1H2015
734.9 759.1
mill
ion
TR
L
2009 2013 2014
1,264.2
1,517.51,627.7CAGR 4.7%
7.3%
Revenue
3.3%
EBITDAm
illio
n T
RL
2009 2013 2014
27.7% 29.7%
503.0
419.7483.5
CAGR -4.4%
15.2%
35.4% 32.1%
marg
in
1H2014Restated
1H2015
259.8 243.4
-6.3%
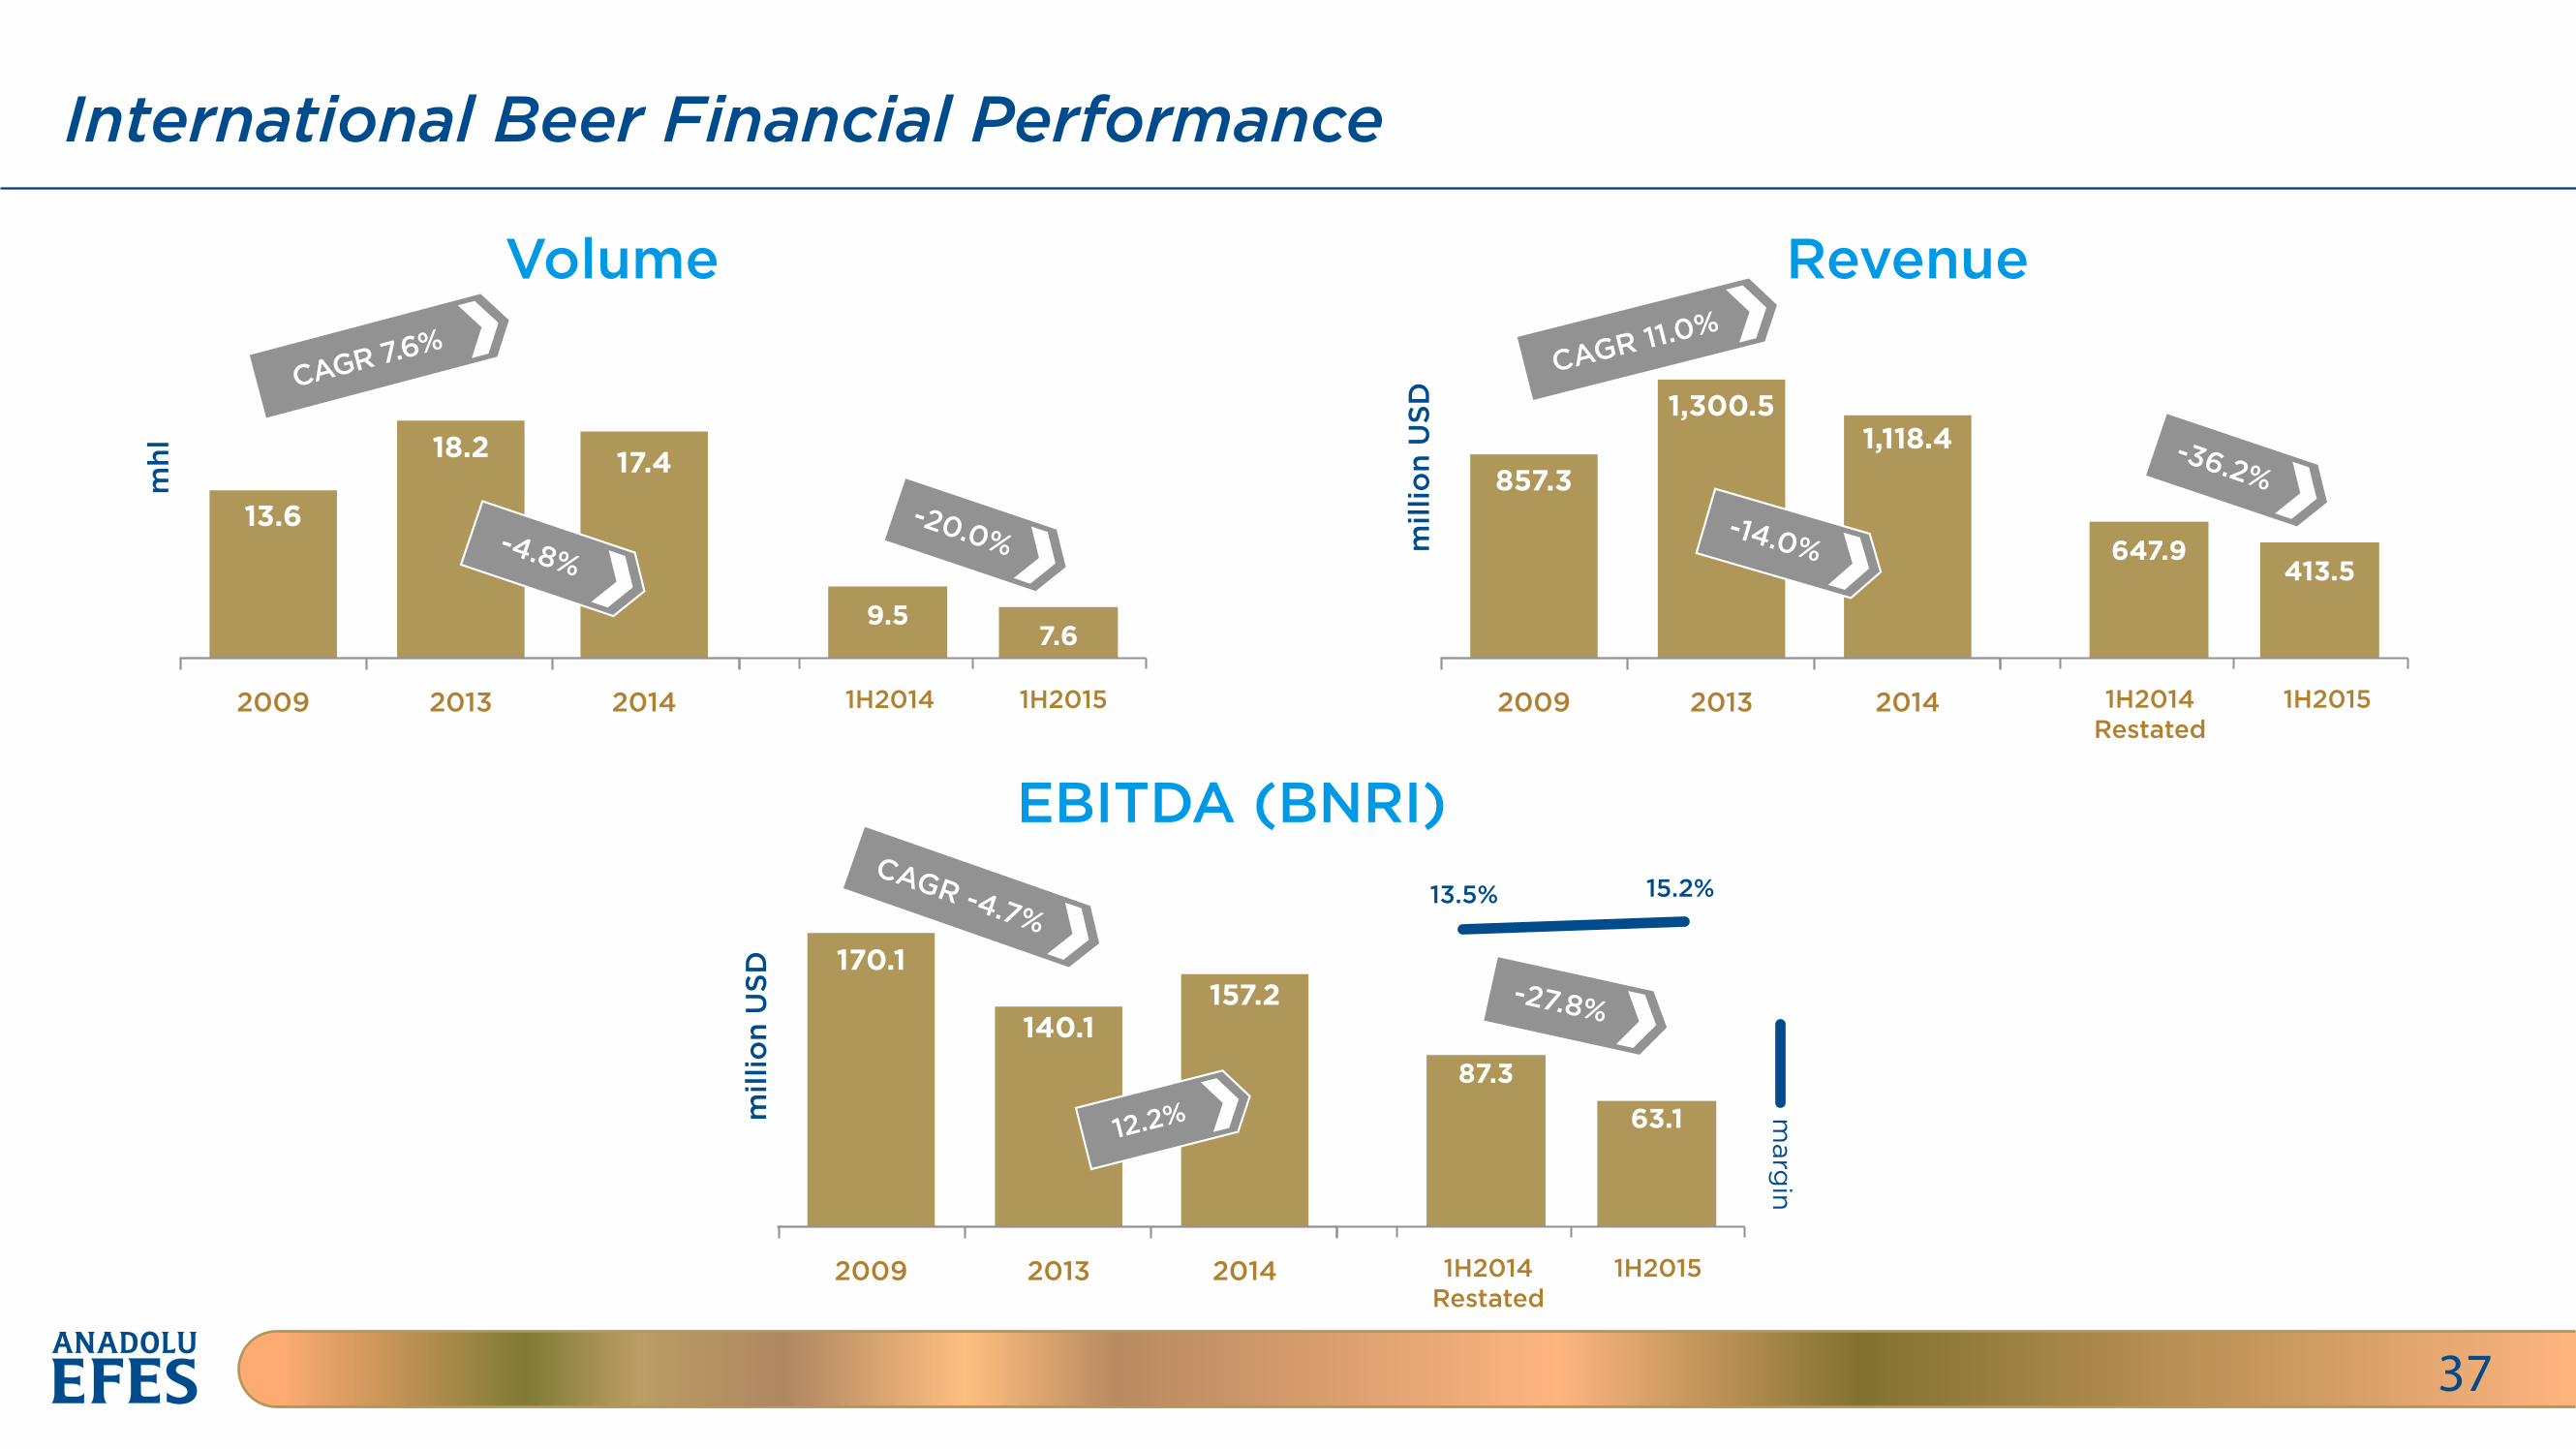
International Beer Financial Performance
37
Volume
mhl
2009 2013
13.6
18.2
2014
17.4
CAGR 7.6%
-4.8% mill
ion
USD
2009 2013 2014
857.3
1,300.51,118.4
CAGR 11.0%
-14.0%
Revenue
EBITDA (BNRI)m
illio
n U
SD
2009 2013 2014
13.5% 15.2%
170.1
140.1157.2
CAGR -4.7%
12.2% marg
in
1H2014 1H2015
9.57.6
-20.0%
1H2014Restated
1H2015
647.9413.5
-36.2%
1H2014Restated
1H2015
87.3
63.1
-27.8%
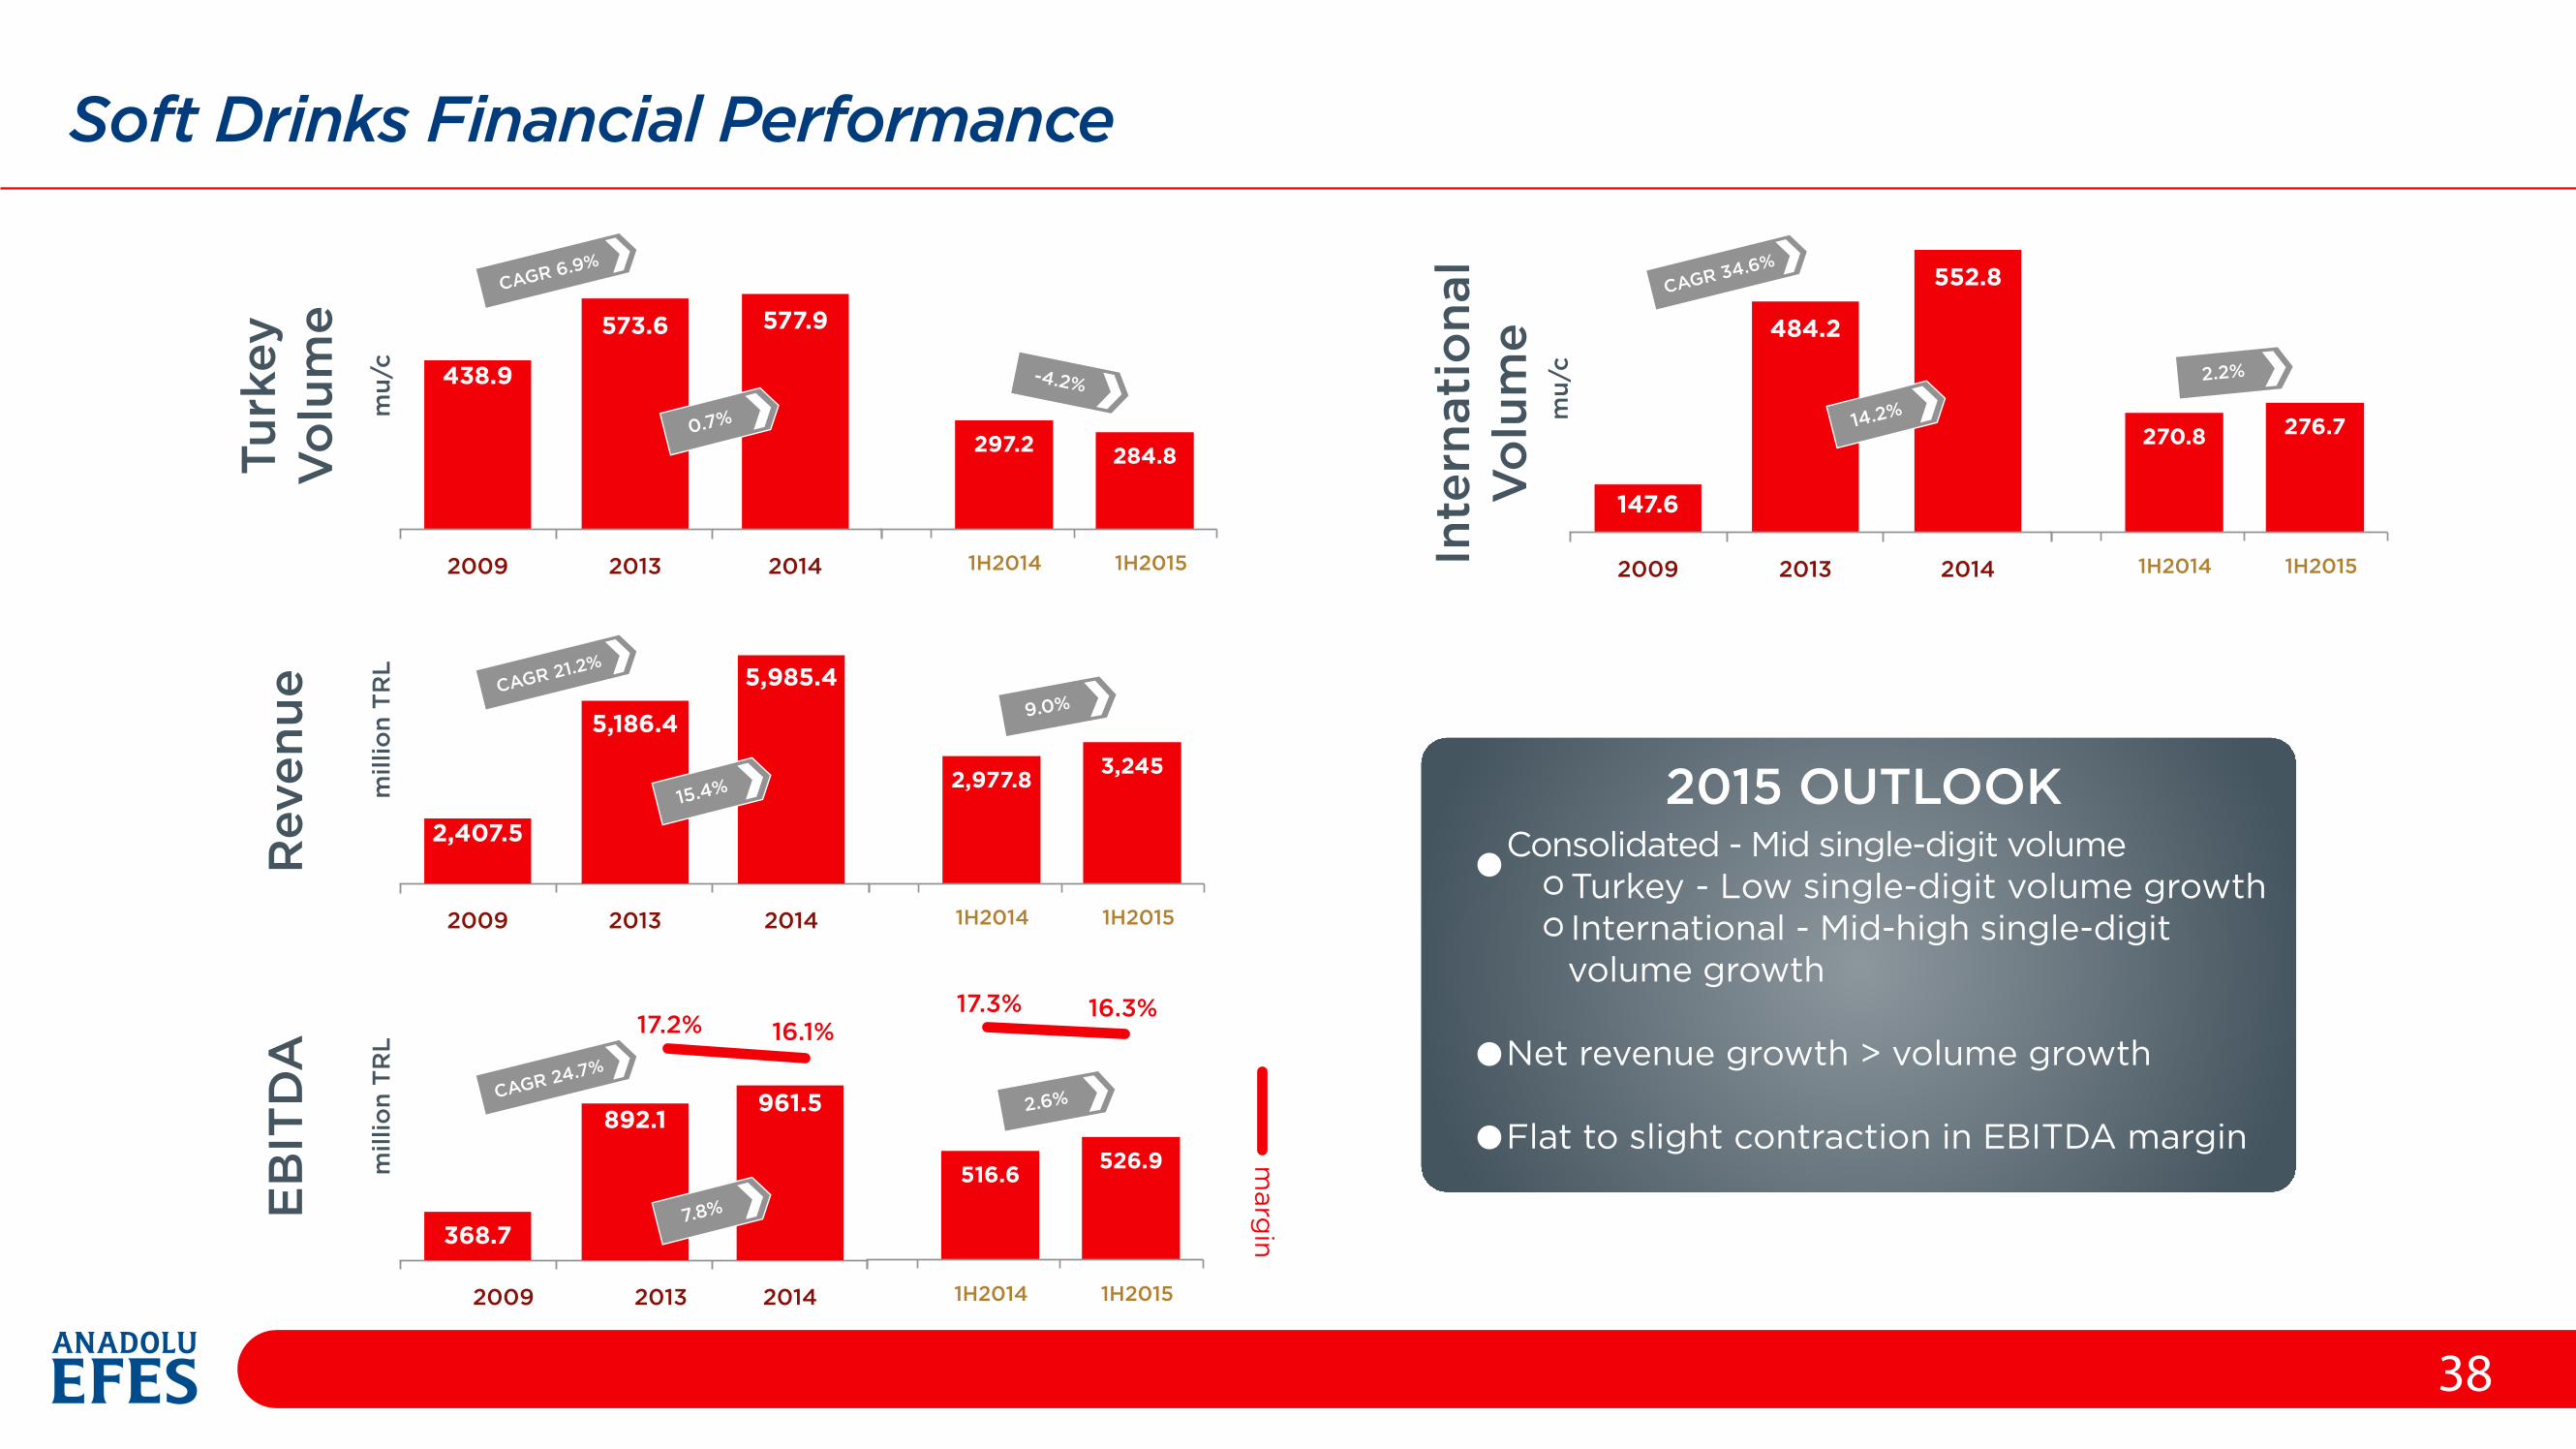
Soft Drinks Financial Performance
38
2015 OUTLOOKConsolidated - Mid single-digit volume Turkey - Low single-digit volume growth International - Mid-high single-digit volume growth
Net revenue growth > volume growth
Flat to slight contraction in EBITDA margin
mu/
c
2009 2013
438.9
573.6
2014
577.9CAGR 6.9%
0.7%
-4.2%m
illio
n T
RL
2009 2013 2014
2,407.5
5,186.4
5,985.4CAGR 21.2%
15.4%
mill
ion
TR
L
2009 2013 2014
368.7
892.1961.5CAGR 24.7%
7.8%
Turk
eyV
olu
me
Rev
enue
EB
ITD
A
Inte
rnat
iona
lV
olu
me
mu/
c
2009 2013
147.6
484.2
2014
552.8CAGR 34.6%
14.2%
17.2% 16.1%17.3% 16.3%
marg
in
1H2014 1H2015
297.2 284.8
2.2%
1H2014 1H2015
270.8 276.7
9.0%
1H2014 1H2015
2,977.8 3,245
2.6%
1H2014 1H2015
516.6 526.9
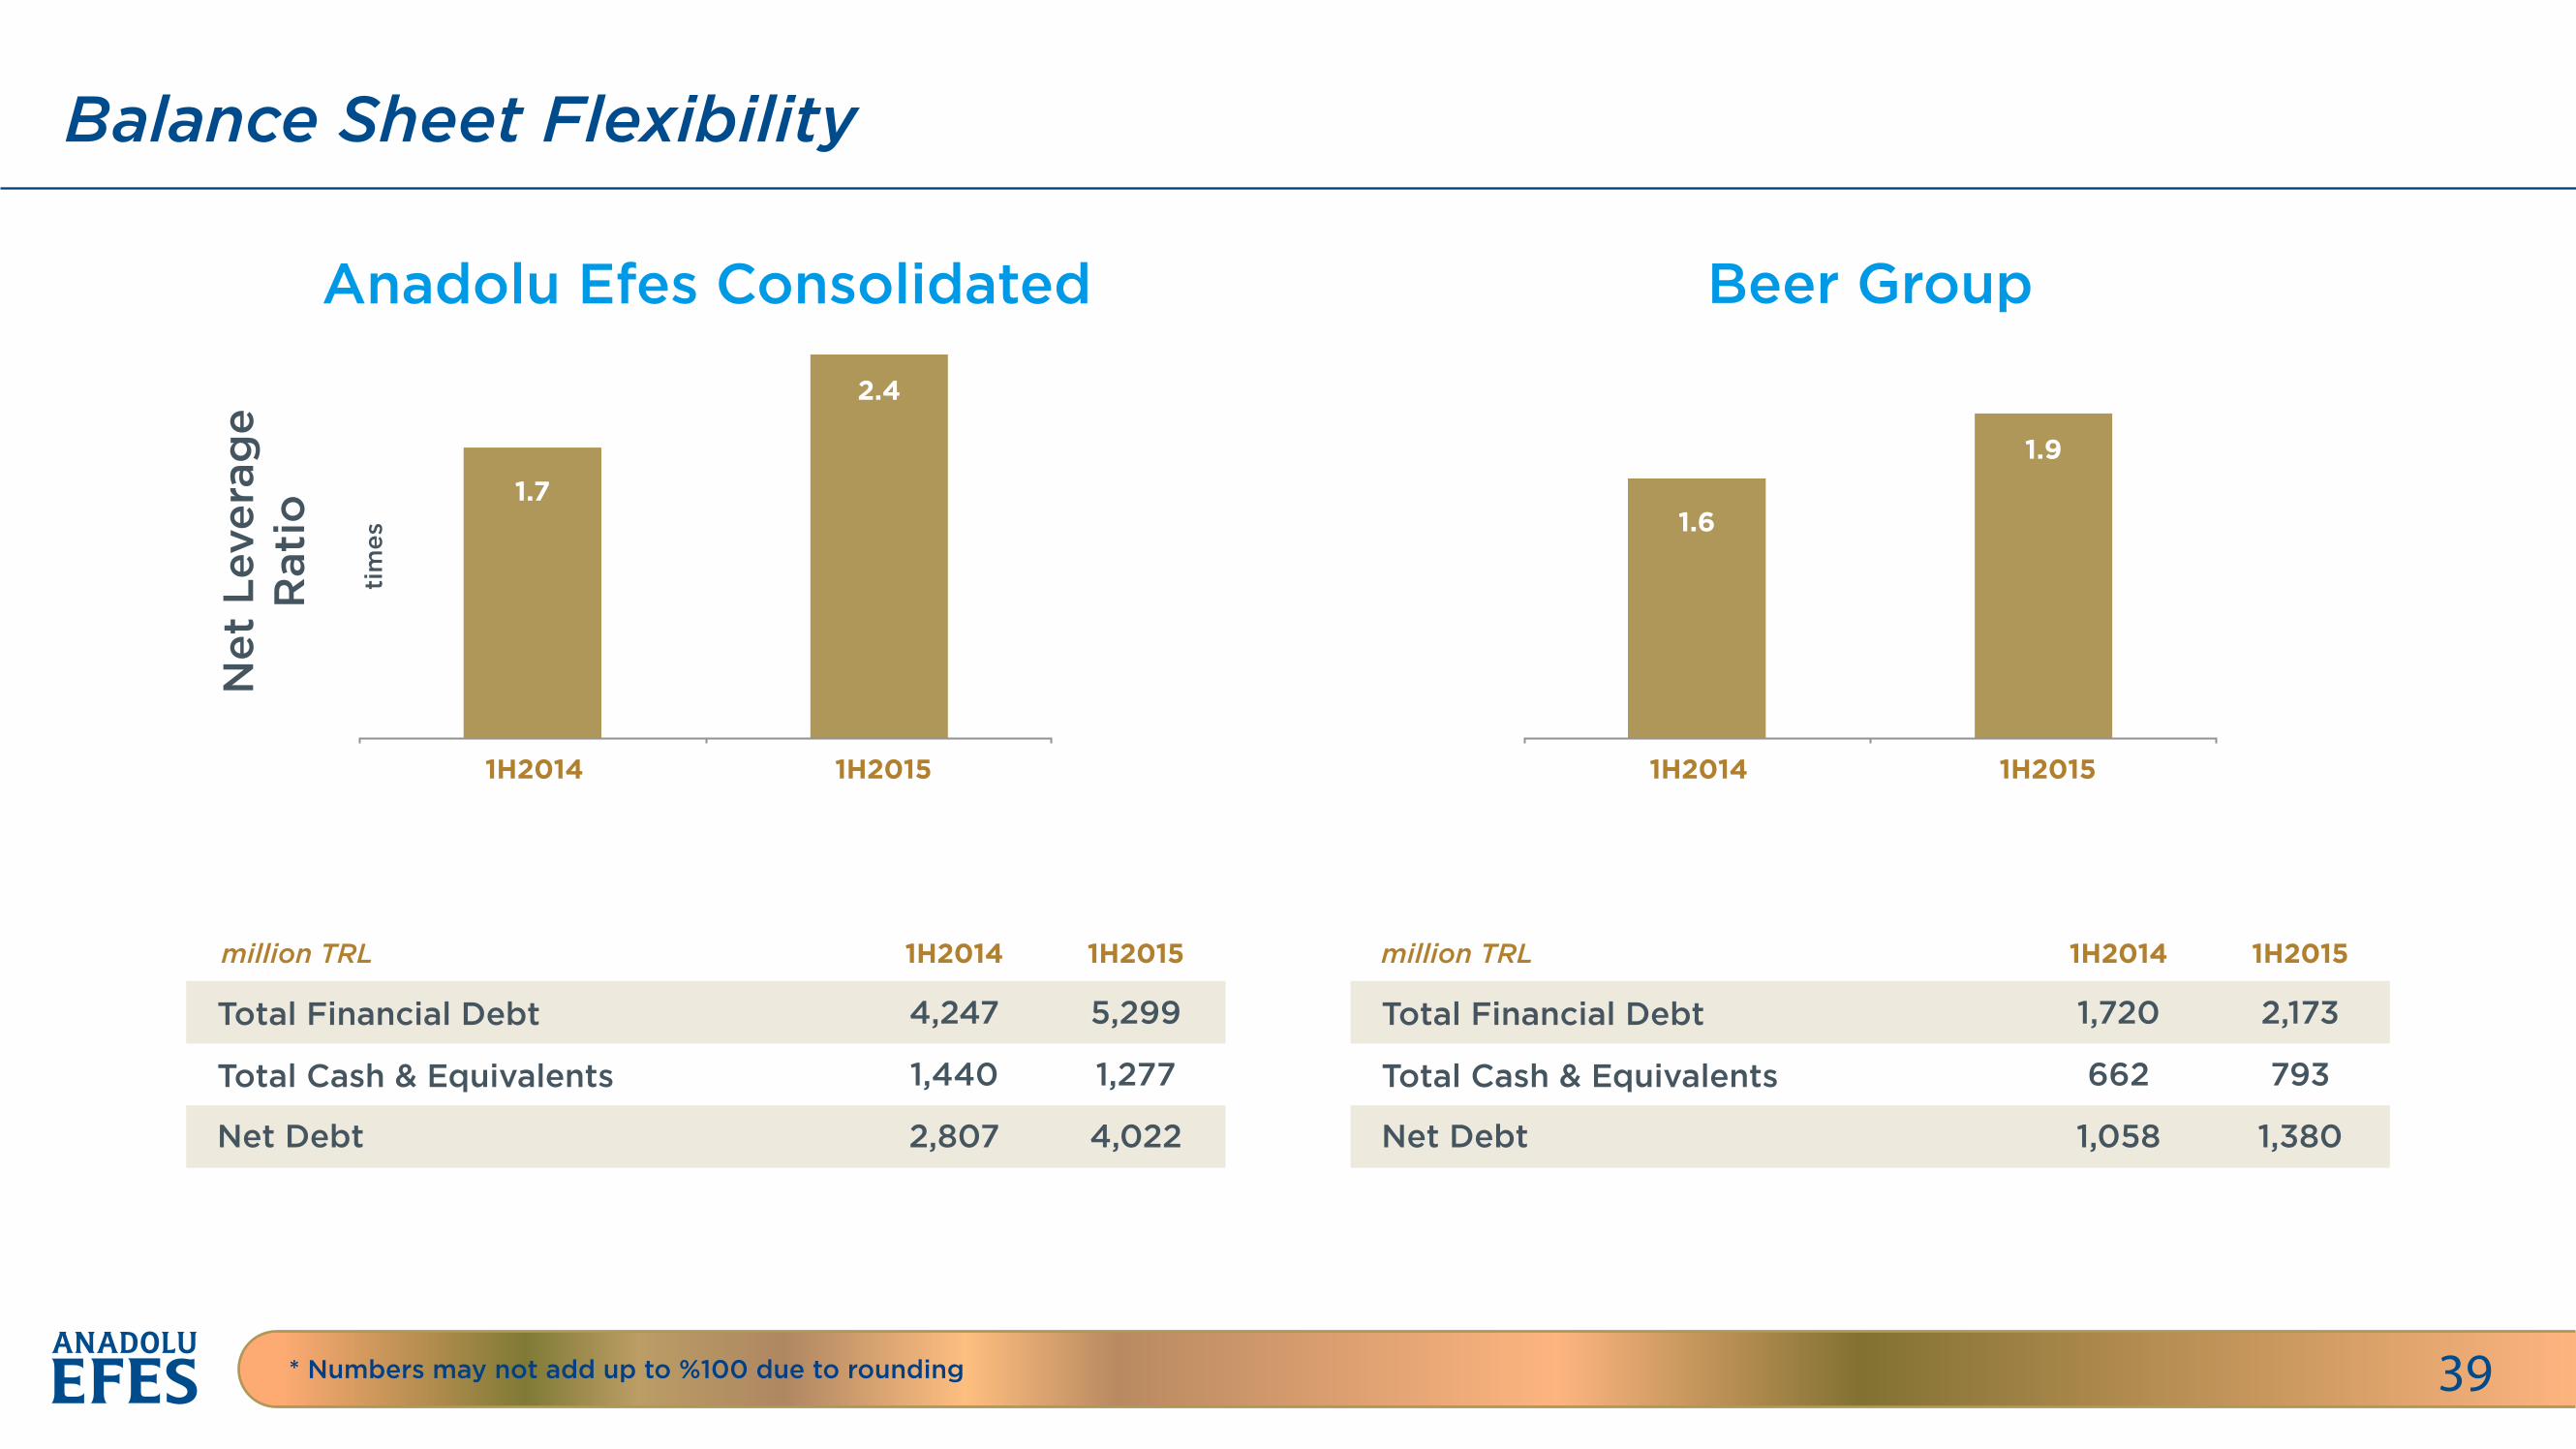
Balance Sheet Flexibility
39* Numbers may not add up to %100 due to rounding
Anadolu Efes Consolidated
1H2014 1H2015
2.4
1.7
tim
es
Beer Group
1H2014 1H2015
1.9
1.6
Net
Lev
erag
eR
atio
1H2014million TRL million TRL1H2015
4,247Total Financial Debt
Total Cash & Equivalents
Net Debt
5,299
1,440 1,277
2,807 4,022
1H2014 1H2015
1,720Total Financial Debt
Total Cash & Equivalents
Net Debt
2,173
662 793
1,058 1,380
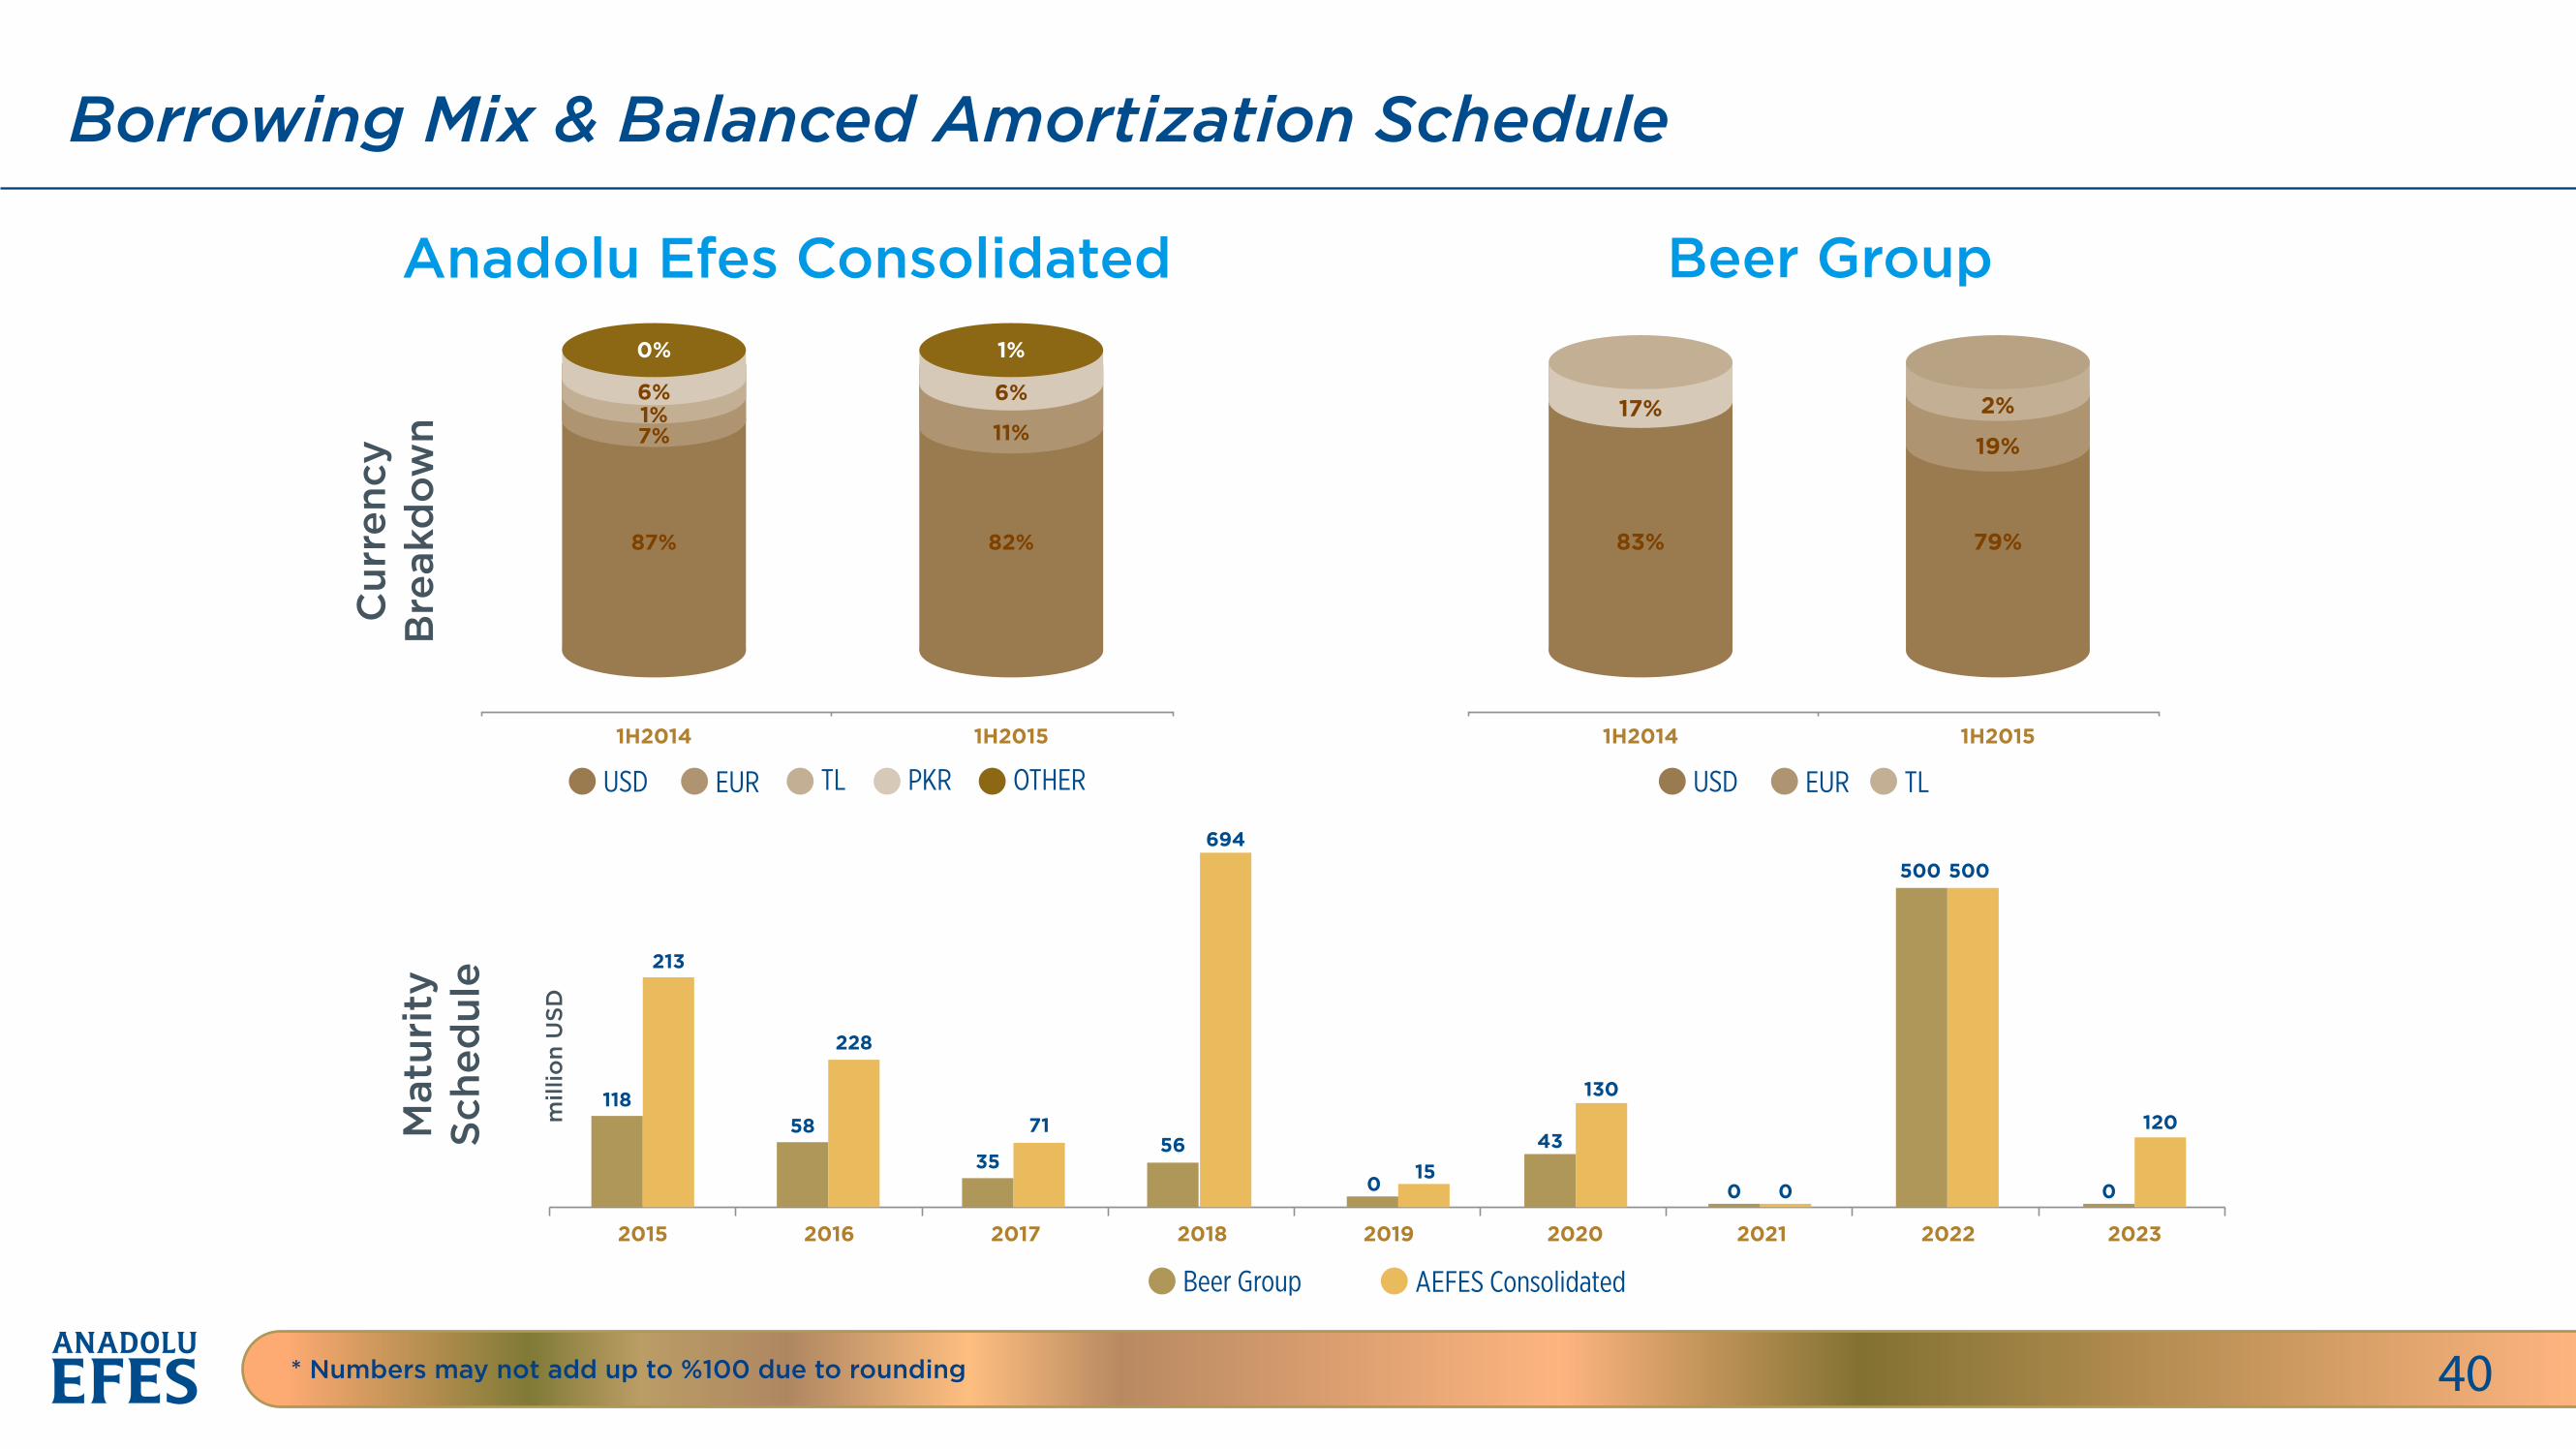
Borrowing Mix & Balanced Amortization Schedule
40* Numbers may not add up to %100 due to rounding
Anadolu Efes Consolidated Beer Group
87%
7%
6%1%
82%
11%
6%
1H2014 1H2015
0% 1%
83%
17%
79%
19%
2%
1H2014 1H2015
TL PKR OTHEREURUSD EUR TLUSD
Cur
renc
yB
reak
dow
nM
atur
ity
Sche
dul
e
AEFES ConsolidatedBeer Group
11858
228
35 150 00 0
43
130
500 500
1207156
694
213
2015 2016 2017 2018 2019 2020 2021 2022 2023
mill
ion
USD