58
Analisi di Fluorescenza X a dispersione di energia Tradizionale ed in Riflessione Totale (EDXRF e TXRF)

Analisi di Fluorescenza X a dispersione di energia
Tradizionale ed in Riflessione Totale(EDXRF e TXRF)

40 eV
400 keV
1 keV
40 keV
The EM spectrum – X-RaysThe EM spectrum – X-Rays

Interactions of X-Rays with matterInteractions of X-Rays with matter
X-ray Source Sample
Photoelectricabsorption
Elastic (Rayleigh)Scattering
Inelastic (Compton)Scattering

Incident photon
X-ray fluorescenceX-ray fluorescence
Photoelectron
Fluorescencephoton

Incident photon
Competition: Auger effectCompetition: Auger effect
Photoelectron
Augerelectron

Fluorescence yieldFluorescence yield
0 20 40 60 800.0
0.2
0.4
0.6
0.8
1.0
K 1-K L 1-L
Fluorescent Yield
Auger Electron Yield
Atomic Number Z

Transition probabilitiesTransition probabilities
Germanium

X-Ray line families - KX-Ray line families - K
5000 6000 7000 8000 9000 100000.0
0.2
0.4
0.6
0.8
1.0
1.2
1.4
1.6
1.8
2.0
2.2
2.4
counts
/(ch
annel
sec
ond)
photon energy [eV]
Fe K
21000 22000 23000 24000 25000 260000
2
4
6
8
10
12
14
16
18
counts
/(ch
annel
sec
ond)
photon energy [eV]
Ag K

8000 10000 12000 14000 160000
1
2
3
4
5co
unts
/ (
chan
nel
sec
ond)
photon energy [eV]
X-Ray line families - LX-Ray line families - L
Pb L
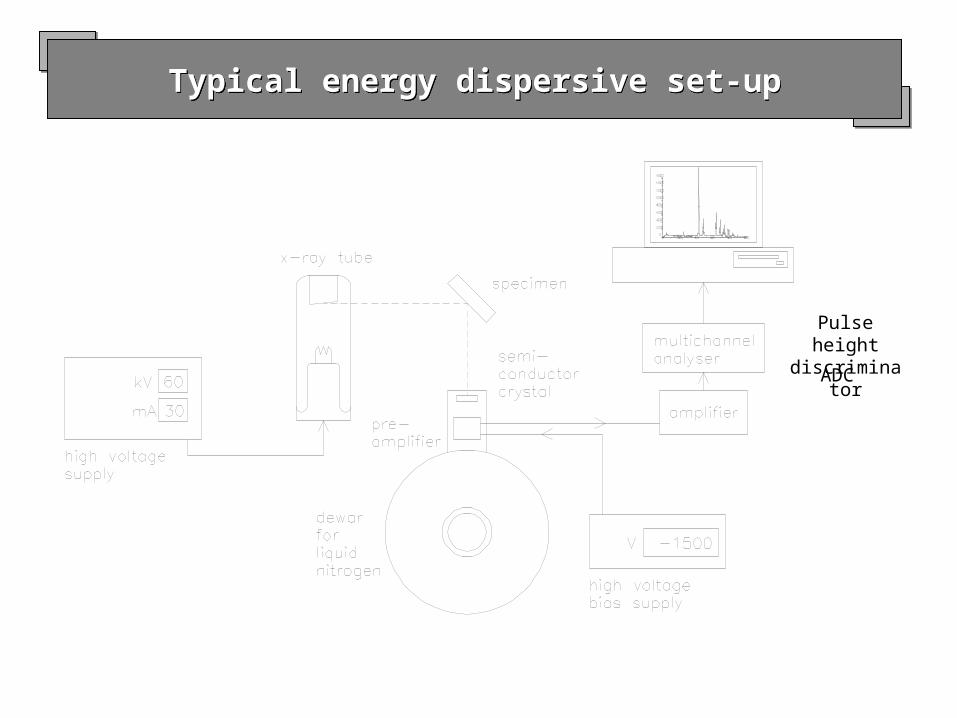
Typical energy dispersive set-upTypical energy dispersive set-up
ADC
Pulse height
discriminator
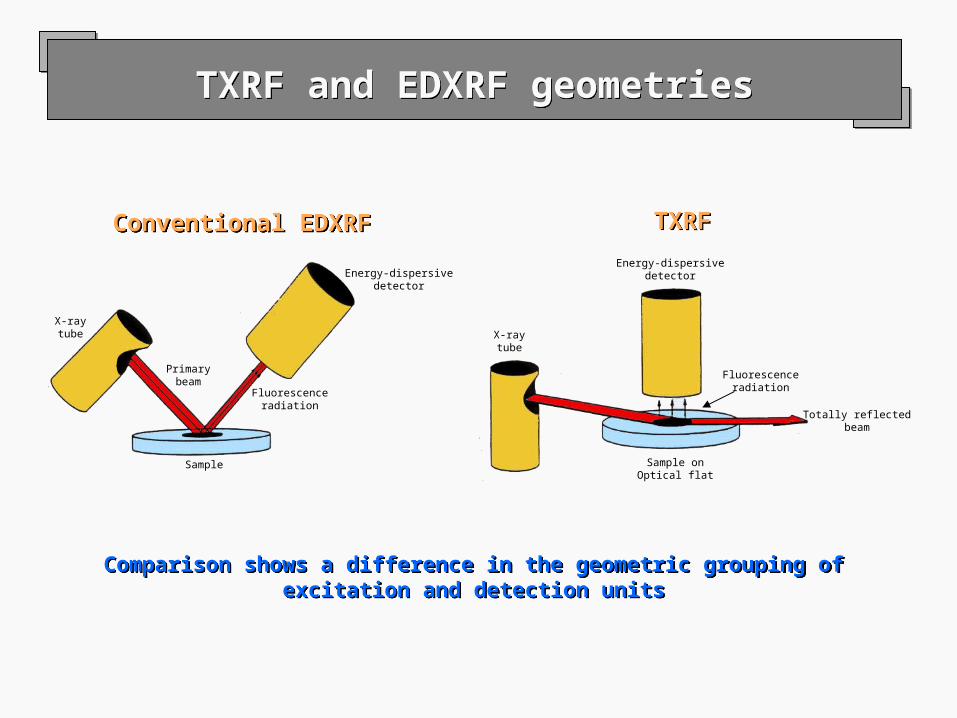
X-raytube
Primarybeam
Fluorescenceradiation
Sample
Energy-dispersivedetector
Conventional EDXRFConventional EDXRF
X-raytube
Sample onOptical flat
Fluorescenceradiation
Energy-dispersivedetector
Totally reflectedbeam
TXRFTXRF
Comparison shows a difference in the geometric grouping ofexcitation and detection units
Comparison shows a difference in the geometric grouping ofexcitation and detection units
TXRF and EDXRF geometriesTXRF and EDXRF geometries
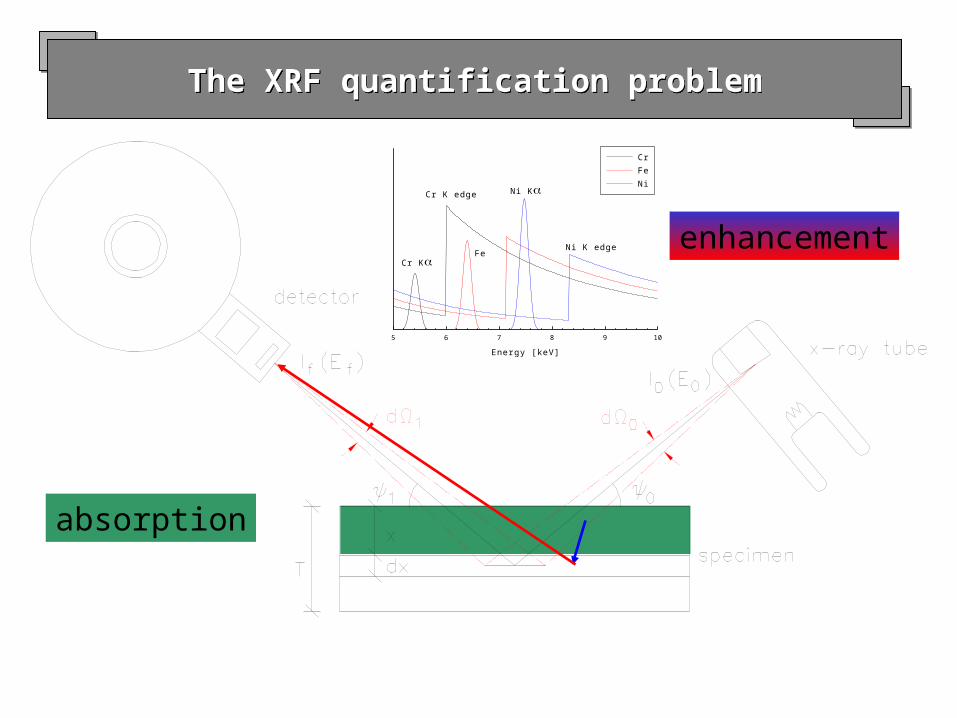
5 6 7 8 9 10
Ni K edge
Ni K
Fe
Cr K edge
Cr K
Cr Fe Ni
Energy [keV]
enhancement
absorption
The XRF quantification problemThe XRF quantification problem
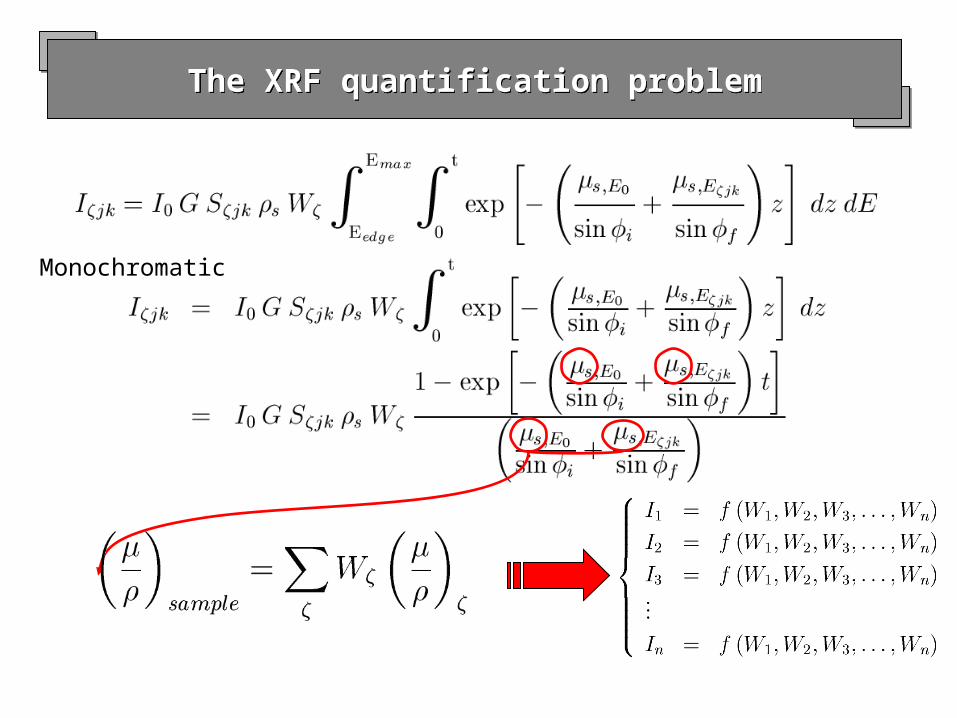
The XRF quantification problemThe XRF quantification problem
Monochromatic
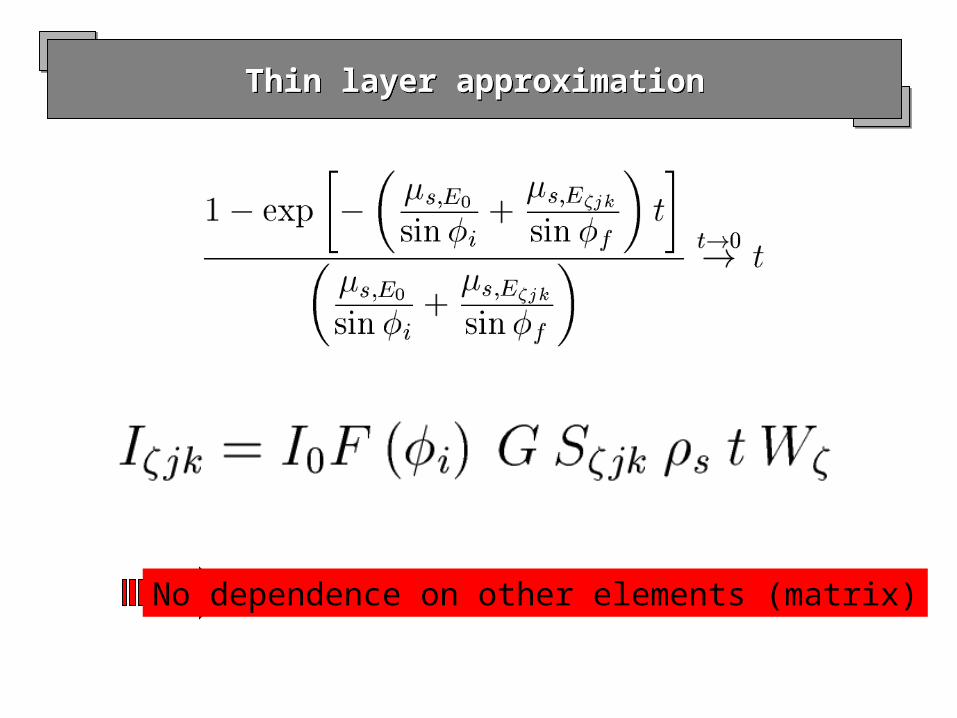
Thin layer approximationThin layer approximation
No dependence on other elements (matrix)

TXRFTXRF
EDXdetector
Incident X-ray beam
ReflectedX-raybeam
Reflector
• Thin sample layer deposited on a reflector• The total reflection effect makes the sample support “almost invisible”
n (x-ray range ) = 1- - i
~ 10-6
~ 10-8 critical 2
critical(Si, 17.5 keV) = 0.1° = 1.75 mrad
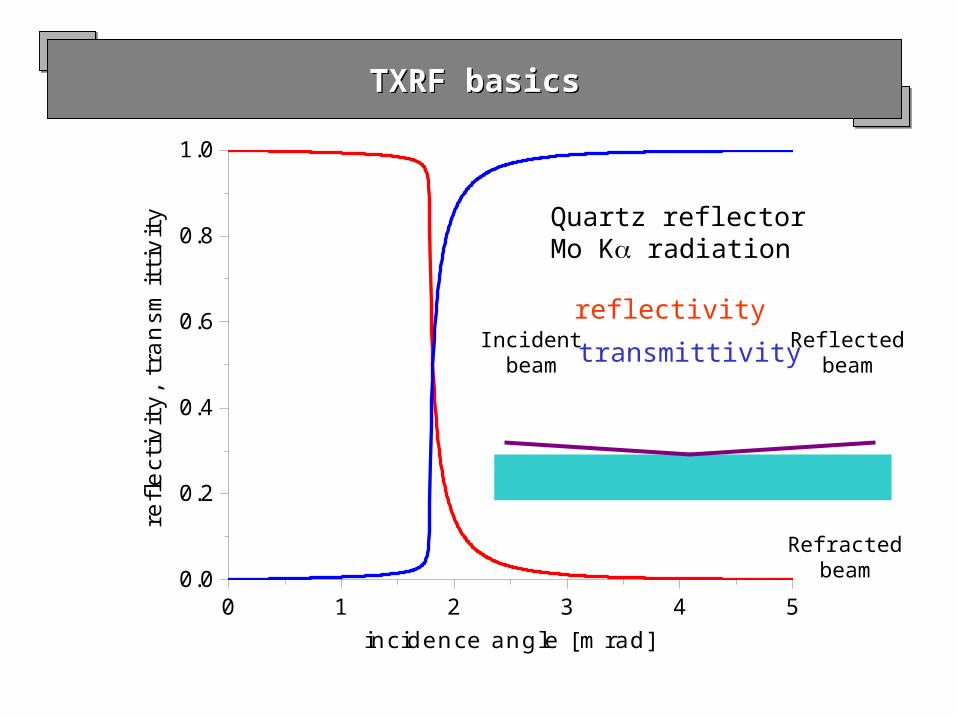
TXRF basicsTXRF basics
0 1 2 3 4 50.0
0.2
0.4
0.6
0.8
1.0re
flec
tivi
ty,
tran
smit
tivi
ty
incidence angle [mrad]
reflectivity
transmittivity
Quartz reflectorMo K radiation
Incidentbeam
Reflectedbeam
Refractedbeam
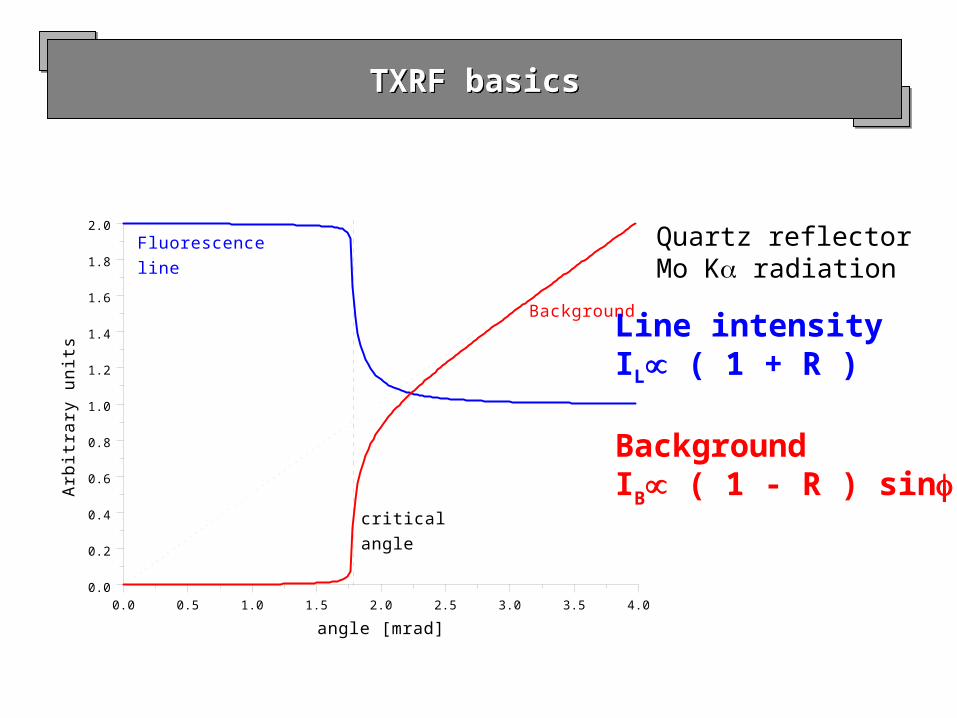
TXRF basicsTXRF basics
0.0 0.5 1.0 1.5 2.0 2.5 3.0 3.5 4.00.0
0.2
0.4
0.6
0.8
1.0
1.2
1.4
1.6
1.8
2.0
criticalangle
Background
Fluorescenceline
Arbitrary units
angle [mrad]
Line intensityIL ( 1 + R )
BackgroundIB ( 1 - R ) sin
Quartz reflectorMo K radiation
15 200
2000
scatter
Mo
Nb
Rb
Cou
nts
/ cha
nnel
Energy [keV]
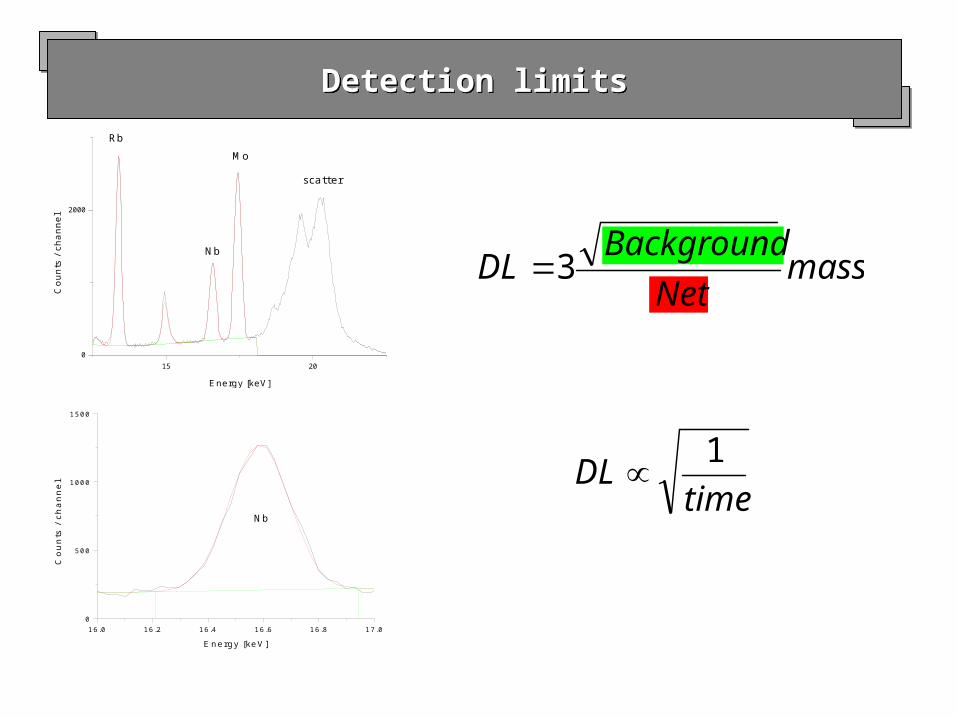
massNet
BackgroundDL 3
timeDL
1
Detection limitsDetection limits
16.0 16.2 16.4 16.6 16.8 17.00
500
1000
1500
Nb
Co
un
ts /
ch
an
ne
l
Energy [keV]

Easy quantification - Taking ratiosEasy quantification - Taking ratios

Internal standard – relative sensitivitiesInternal standard – relative sensitivities
CALIBRATE
QUANTIFY UNKNOWNS
Compare with theory

Mo Ka - calibration curveMo Ka - calibration curve
5 10 15 20 25 30 35 50 60 70 80 901E-4
1E-3
0.01
0.1
1
rela
tive
se
nsi
tivity
to G
a
Z
measured fundamental parameters Polynomial Fit of K data Exp fit of L data

Principle of TXRFPrinciple of TXRF
EDXdetector
Incident X-ray beam
ReflectedX-raybeam
Reflector
ADVANTAGESADVANTAGES
• Background reduction• Background reduction
• Double excitation of sample by both the primary and reflected beam• Double excitation of sample by both the primary and reflected beam
• Small distance sample-detector(~1mm) large solid angle• Small distance sample-detector(~1mm) large solid angle
• Small sample volumes required• Small sample volumes required
• Detection limits in the pg range with X-ray tube excitation• Detection limits in the pg range with X-ray tube excitation
DISAVANTAGESDISAVANTAGES
• Collimated beam required• Collimated beam required
• Sample preparation necessary for non liquid samples• Sample preparation necessary for non liquid samples
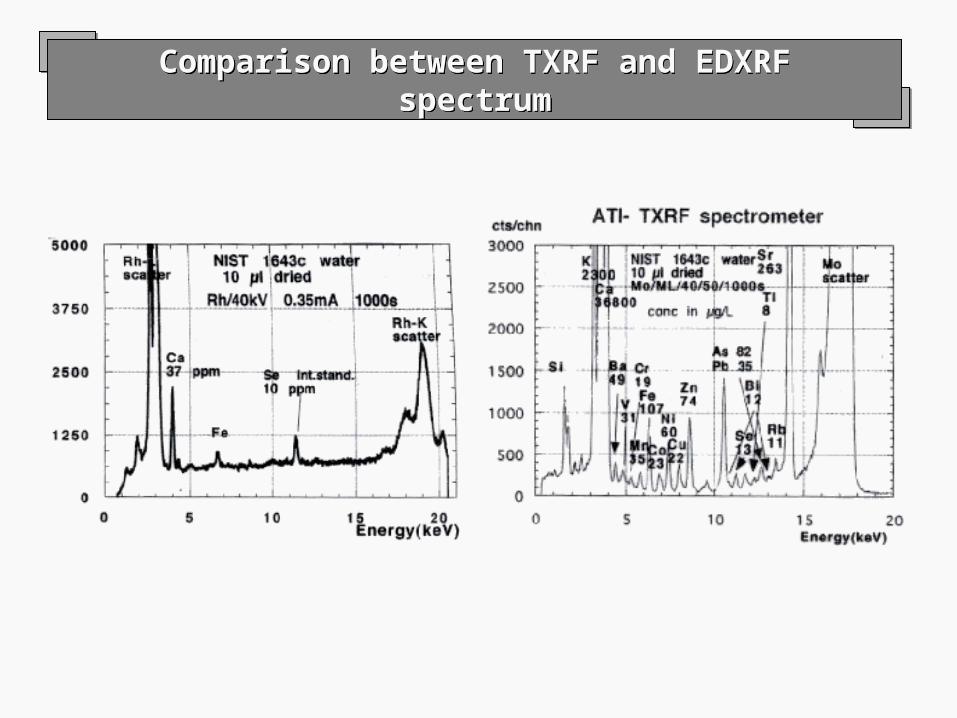
Comparison between TXRF and EDXRF spectrum
Comparison between TXRF and EDXRF spectrum

Main Advantages of TXRFMain Advantages of TXRF
• No matrix effects• No matrix effects
• A single internal standard greatly simplifies quantitative analyses
• A single internal standard greatly simplifies quantitative analyses• Calibration and quantification independent from any sample matrix
• Calibration and quantification independent from any sample matrix• Simultaneous multi-element ultra-trace analysis• Simultaneous multi-element ultra-trace analysis• Several different sample types and applications• Several different sample types and applications• Minimal quantity of sample required for the measurement (5 µl)
• Minimal quantity of sample required for the measurement (5 µl)
• Unique micro analytical applications for liquid and solid samples
• Unique micro analytical applications for liquid and solid samples• Excellent detection limits (ppt or pg) for all elements from sodium to plutonium
• Excellent detection limits (ppt or pg) for all elements from sodium to plutonium• Excellent dynamic range from ppt to percent• Excellent dynamic range from ppt to percent• Possibility to analyse the sample directly without chemical pre-treatment
• Possibility to analyse the sample directly without chemical pre-treatment• No memory effects• No memory effects
• Non destructive analysis• Non destructive analysis
• Low running cost• Low running cost

The TXRF equipmentThe TXRF equipment
Main components:• Double anode Mo/W X-ray tube• Multilayer monochromator MoK WL Bremsstr.• TXRF and EDXRF chambers•High resolution Si(Li) detector
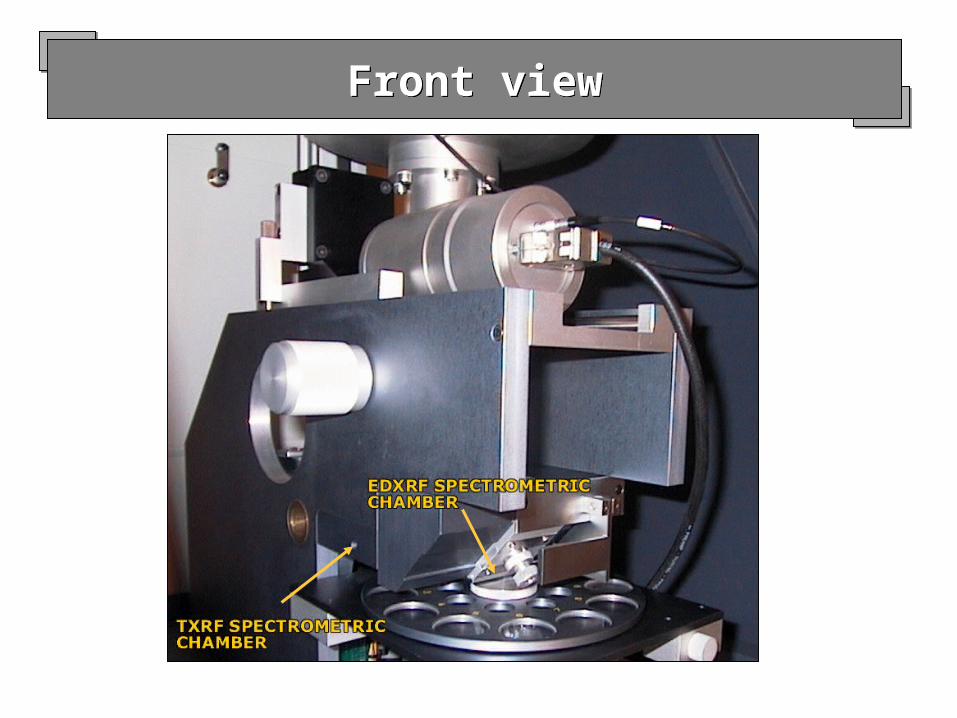
Front viewFront view

Back viewBack view
Minimum angular step
• monochromator 0.0074°
• tube shield 0.0016°

Alignment windowAlignment window
Control
• multilayer
• tube shield
Visualise
• X-ray line counts
• Total counts

• TXRF and EDXRF (traditional45° geometry) spectroscopy inthe same equipment
• TXRF and EDXRF (traditional45° geometry) spectroscopy inthe same equipment
• Automatic switching of primary beam (MoKW/L and Brems-strahlung 33 keV) using double anode Mo/W X-ray tube, based on innovative software. We select the energy required using a high reflectivity 80% (WL/L/MoK) multilayer. We can choose also other X-ray tubes and monochromatise the energy that you need
• Automatic switching of primary beam (MoKW/L and Brems-strahlung 33 keV) using double anode Mo/W X-ray tube, based on innovative software. We select the energy required using a high reflectivity 80% (WL/L/MoK) multilayer. We can choose also other X-ray tubes and monochromatise the energy that you need• 3.8 liters UHV (Si(Li) 20 mm2 detector area) high resolution detector <137 eV (K Mn radiation at 5.89 keV), with an ultra-thin and highly corrosion resistant window (8 mm Dura-Beryllium)
• 3.8 liters UHV (Si(Li) 20 mm2 detector area) high resolution detector <137 eV (K Mn radiation at 5.89 keV), with an ultra-thin and highly corrosion resistant window (8 mm Dura-Beryllium)
• Minimal distance between the sample and the detector (mounted to the axis normal plane of the sample). In this position the detector is also completely out of the primary beam, as the angle between the incident and the reflected beams is so large
• Minimal distance between the sample and the detector (mounted to the axis normal plane of the sample). In this position the detector is also completely out of the primary beam, as the angle between the incident and the reflected beams is so large
• Instrumental detection limits for more than 50 elements below 10 pg• Instrumental detection limits for more than 50 elements below 10 pg• Helium device to improve the detection limits for the light elements
• Helium device to improve the detection limits for the light elements
• The spectrometer is fully automated and you can control different total reflection conditions for different energies from the PC, using stepping-motors moving monochromator and tube shield and MS Windows software.
• The spectrometer is fully automated and you can control different total reflection conditions for different energies from the PC, using stepping-motors moving monochromator and tube shield and MS Windows software.
The main features of the TX 2000 SpectrometerThe main features of the TX 2000 Spectrometer

Multielement standard - WLMultielement standard - WL
0 1 2 3 4 5 6 7 8 9 100
1000
2000
3000
4000
5000
6000co
unts
/chan
nel
photon energy [keV]
Zn
CuNi
Co
FeMn
Cr
KCaBa
Ba
Tl, Pb, Bi
Al SiSr
K
K
L
L
M
CuNiAgCd
W Lscatter
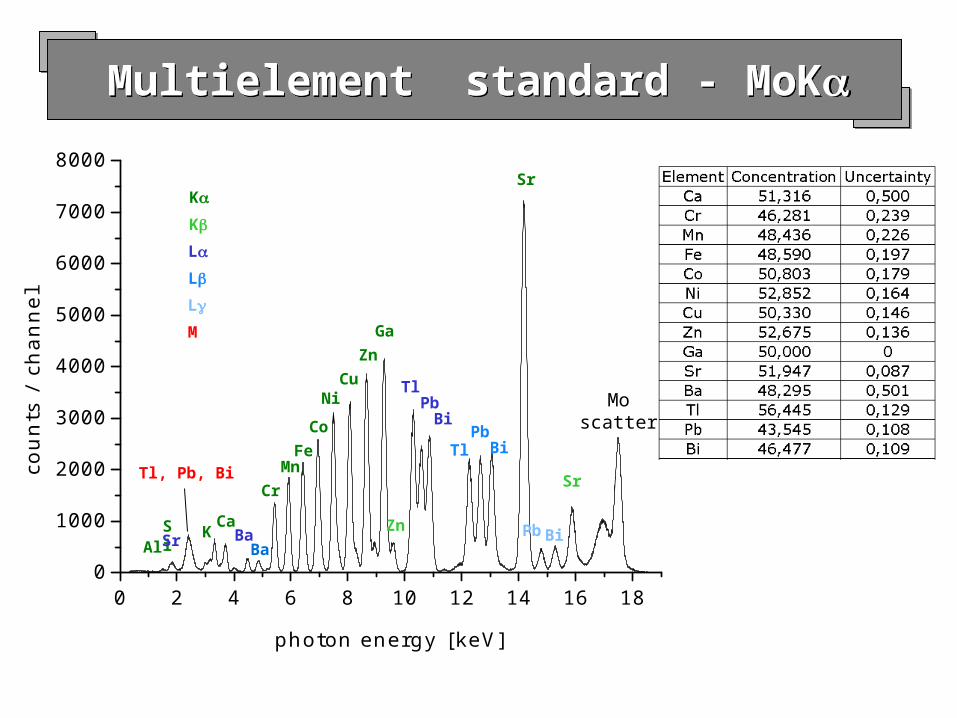
0 2 4 6 8 10 12 14 16 180
1000
2000
3000
4000
5000
6000
7000
8000
counts
/ c
han
nel
photon energy [keV]
Sr
Ga
Zn
CuNi
Co
FeMn
Cr
KCa
Moscatter
TlPb
Bi
Tl BiPb
Sr
BaBa
Tl, Pb, Bi
ZnAl
SiSr
PbBi
K
K
L
L
L
M
Multielement standard - MoKMultielement standard - MoK
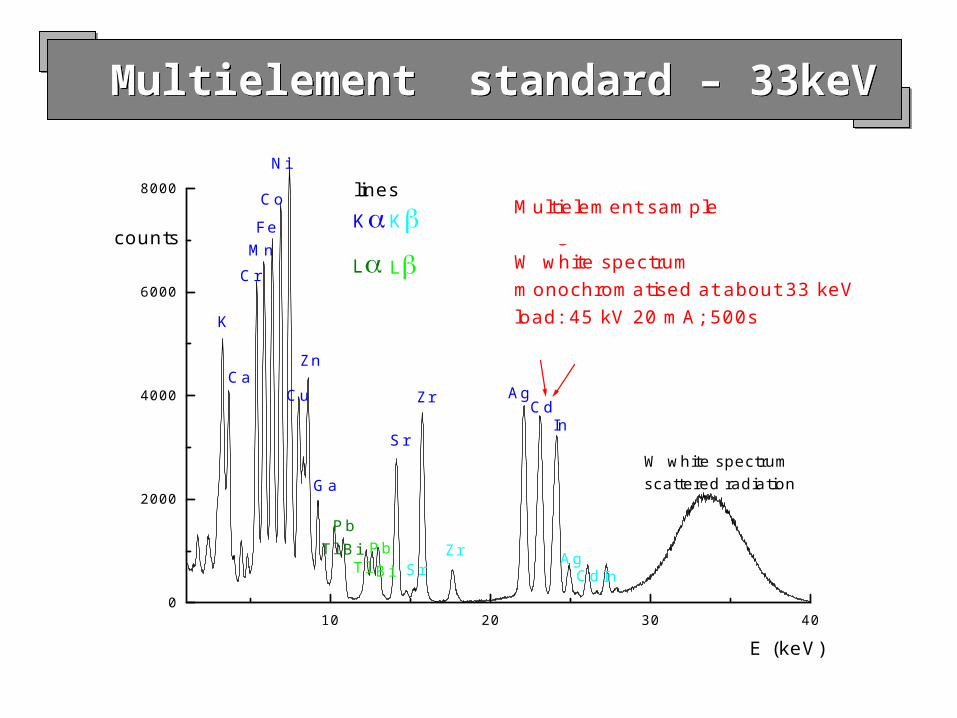
Multielement standard – 33keVMultielement standard – 33keV
10 20 30 400
2000
4000
6000
8000 lines
LL
KK Multielement sample10 ng CdW white spectrum monochromatised at about 33 keVload: 45 kV 20 mA; 500s
TlBiTl
PbBi Pb
CrMnFe
Co
Ni
Cu
Zn
Ga
Ca
K
Sr
In
Zr
ZrSr
Ag
Cd
Cd
In
Ag
W white spectrumscattered radiation
counts
E (keV)
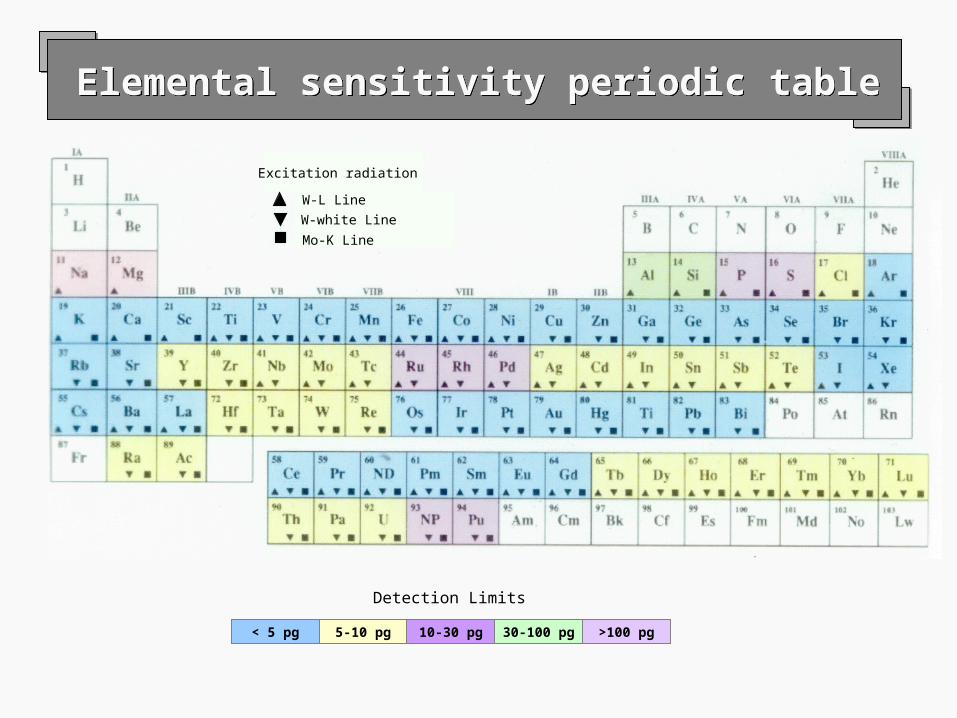
Excitation radiation
W-L Line
W-white Line
Mo-K Line
< 5 pg 5-10 pg 10-30 pg 30-100 pg >100 pg
Detection Limits
Elemental sensitivity periodic tableElemental sensitivity periodic table

[email protected] www.italstructures.com
A droplet of 10 µL is pipetted on a carrier with a diameter of 3 cmThe droplet leaves a dry residue after evaporation.
A droplet of 10 µL is pipetted on a carrier with a diameter of 3 cmThe droplet leaves a dry residue after evaporation.
Sample holderSample holder
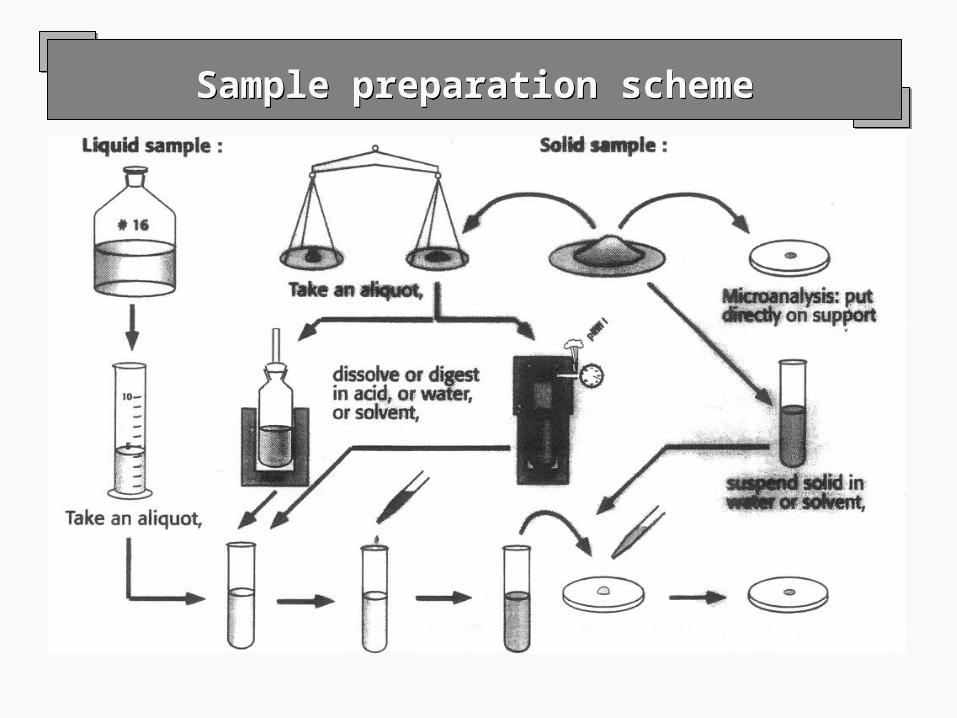
Sample preparation schemeSample preparation scheme

Preparation of a TXRF measuring samplePreparation of a TXRF measuring sample
Aliquotationof some mL
Addition ofsome µLinternalstandard
Homogenizationby shaking
Taking offsome µL
Pipetting onclean carrier
Drying byevaporation
Measurement
Si(Li)-Detector

ApplicationsApplications
•Environmental Analysis: water, dust, sediment, aerosol•Environmental Analysis: water, dust, sediment, aerosol
• Medicine: toxic elements in biological fluids and tissue samples
• Medicine: toxic elements in biological fluids and tissue samples
• Forensic Science: analysis of extremely small sample quantities
• Forensic Science: analysis of extremely small sample quantities
• Pure chemicals: acids, bases, salts, solvents, water, ultra pure reagents
• Pure chemicals: acids, bases, salts, solvents, water, ultra pure reagents
• Oils and greases: crude oil, essential oil, fuel oil• Oils and greases: crude oil, essential oil, fuel oil
• Pigments: ink, oil pants, powder• Pigments: ink, oil pants, powder
• Semiconductor Industry(direct or after VPD-VPT)• Semiconductor Industry(direct or after VPD-VPT)
• Nuclear Industry: measurements of radioactive elements
• Nuclear Industry: measurements of radioactive elements

Spectrum of detection limits Chromium in distilled water
Spectrum of detection limits Chromium in distilled water

Example of detection limits Chromium in distilled water
Example of detection limits Chromium in distilled water
Concentration (ppb)
Volume µl(5 x N)
Live Time(seconds)
Detection Limit (ppt)
Detection Limit (pg) = ppt x
µl/1000
24.5 10 (5 x 2) 500 370 3.70
24.5 50 (5 x 10) 500 120 6.00
24.5 50 (5 x 10) 300 170 8.50
24.5* (spectr.) 100 (5 x 20) 500 70 7.00
24.5 100 (5 x 20) 1000 55 5.50
24.5 100 (5 x 20) 5000 35 3.50
1.97 10 (5 x 2) 500 400 4.00
1.97 10 (5 x 2) 300 440 4.40
1.97 50 (5 x 10) 500 80 4.00
1.97 50 (5 x 10) 300 125 6.25
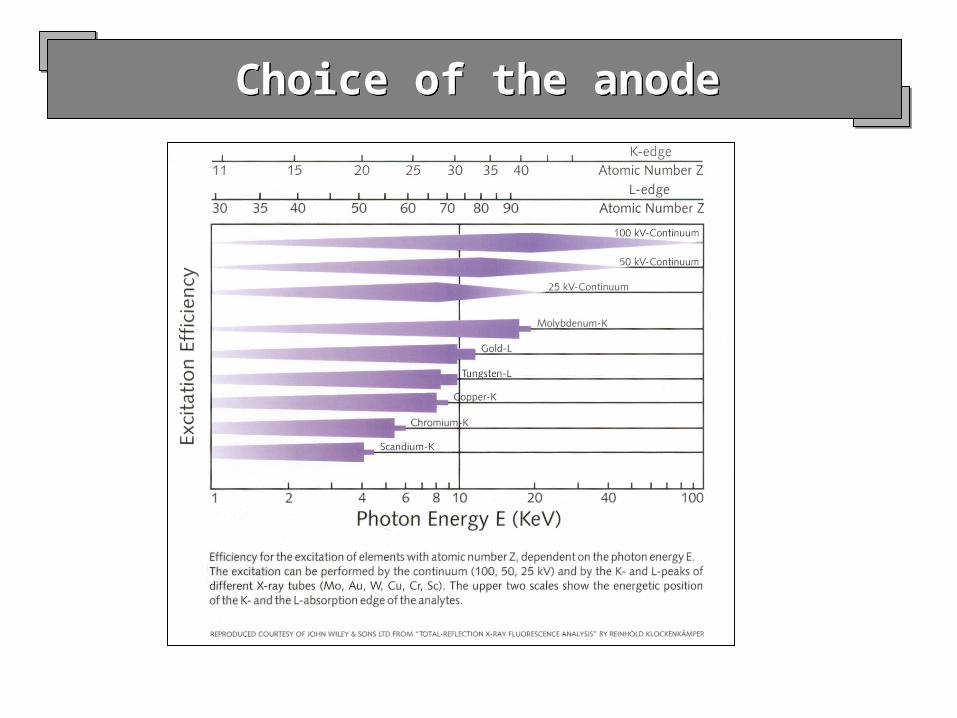
Choice of the anodeChoice of the anode
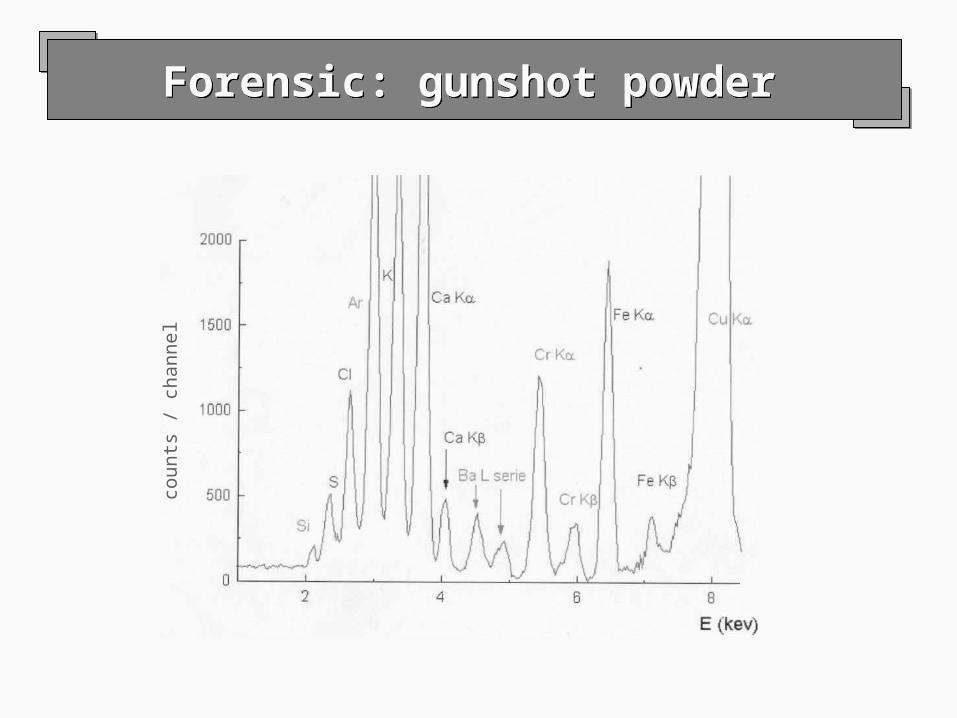
Forensic: gunshot powderForensic: gunshot powder
coun
ts /
cha
nnel
0 5 10 15 200
200
400
600
800
Figure 5
counts
Pb
Pb
SrRb
Br
NiCu
Zn
Zn
CuNi
CoFe
Fe
Cr
Cr
Ti
Ti
Ca
Ca
K
ArCl
S
P
Si
Moscattered radiation
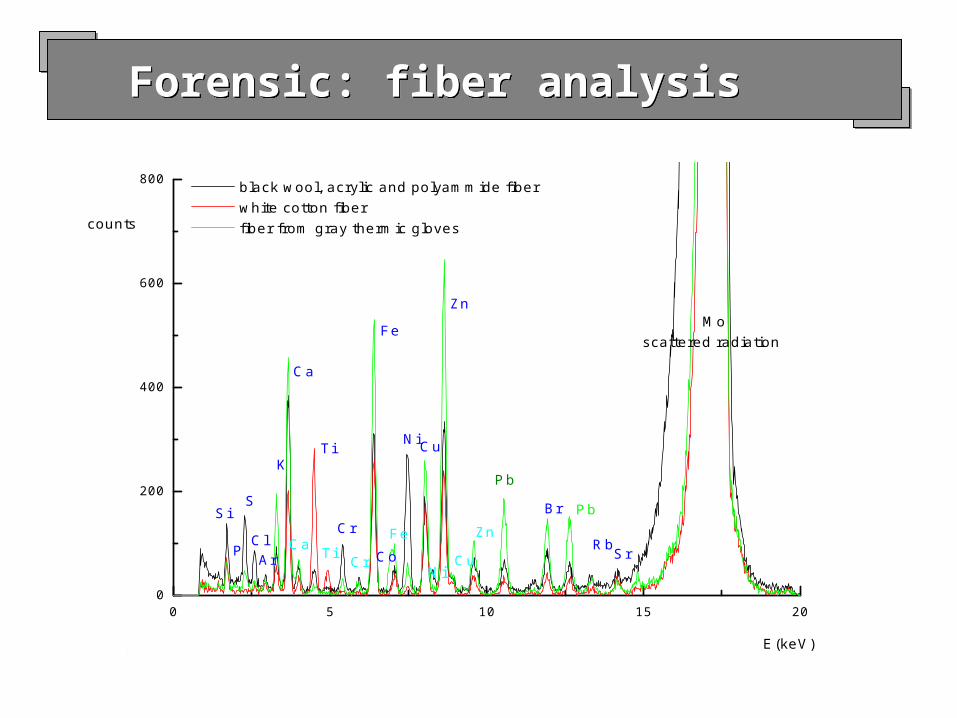
black wool, acrylic and polyammide fiber white cotton fiber fiber from gray thermic gloves
E(keV)
Forensic: fiber analysisForensic: fiber analysis
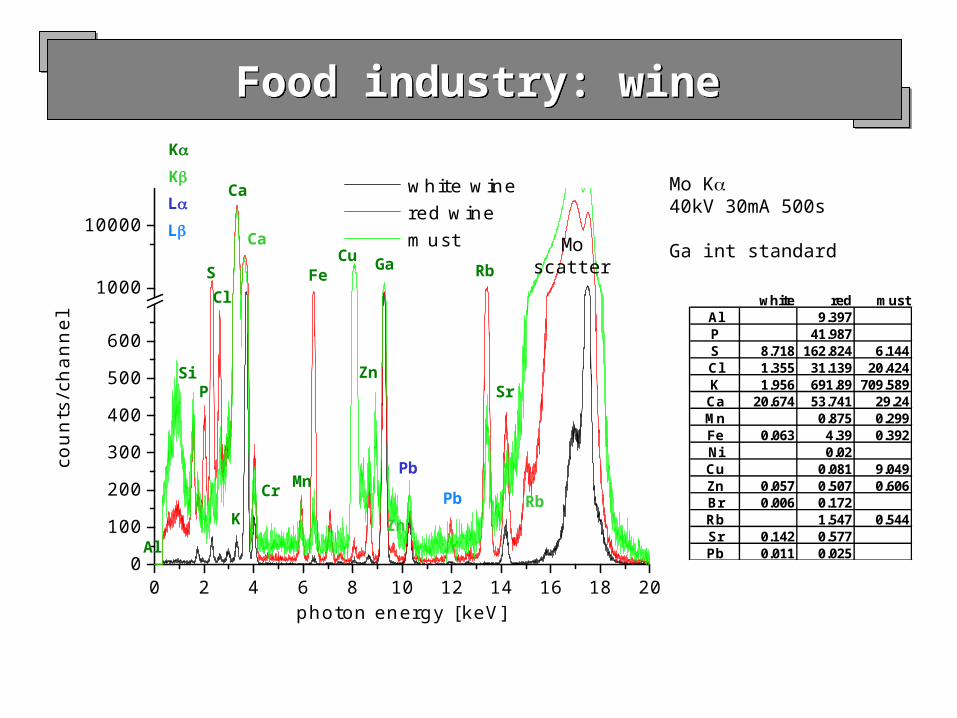
Food industry: wineFood industry: wine
0 2 4 6 8 10 12 14 16 18 200
100
200
300
400
500
600
1000
10000
counts
/chan
nel
photon energy [keV]
white wine red wine must
Mo K40kV 30mA 500s
Ga int standard
white red mustAl 9.397P 41.987S 8.718 162.824 6.144Cl 1.355 31.139 20.424K 1.956 691.89 709.589
Ca 20.674 53.741 29.24Mn 0.875 0.299Fe 0.063 4.39 0.392Ni 0.02Cu 0.081 9.049Zn 0.057 0.507 0.606Br 0.006 0.172Rb 1.547 0.544Sr 0.142 0.577Pb 0.011 0.025
RbGa
Zn
CuFe
MnCr
K
Ca
Moscatter
Pb
Pb
ZnAl
K
K
L
L
SrSi
Ca
P
S
Cl
Rb

Industrial application case study:Petrochemical transformation
Industrial application case study:Petrochemical transformation
Monitor corrosion phenomena and possibly give indications on the origin (Fe, Ni, Cr, Mn)
Process assistance and quality control
Individuate transport processes of elements deriving for catalyst (Co, Ni, Pt, Rh, Cr, Cu, …)
Logistics
• Search the probable causes of deterioration (contamination) of the products during Transport and Stocking – Reflects on product price and on logistic costs (e.g. ship stop)
Raw materials for intermediate products
Intermediate compounds for the synthesis of final products destined to high consumption markets
Cosmetics
Detergents
Lubrication
Paper Industry
Plastics
Food industry
Leather industry
The limits for the metals content are regulated by different norms,
mostly dictated by Acceptance Specifications of the client.
ApplicationsApplications
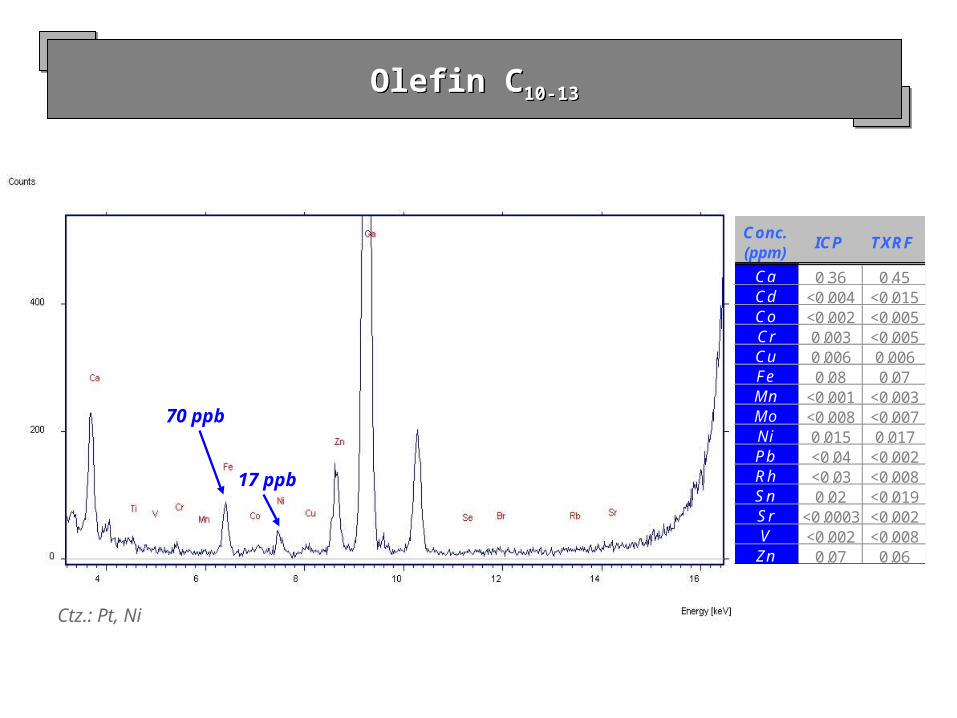
Olefin C10-13Olefin C10-13
Conc. (ppm)
ICP TXRF
Ca 0.36 0.45Cd <0.004 <0.015Co <0.002 <0.005Cr 0.003 <0.005Cu 0.006 0.006Fe 0.08 0.07Mn <0.001 <0.003Mo <0.008 <0.007Ni 0.015 0.017Pb <0.04 <0.002Rh <0.03 <0.008Sn 0.02 <0.019Sr <0.0003 <0.002V <0.002 <0.008Zn 0.07 0.06
70 ppb
Ctz.: Pt, Ni
17 ppb
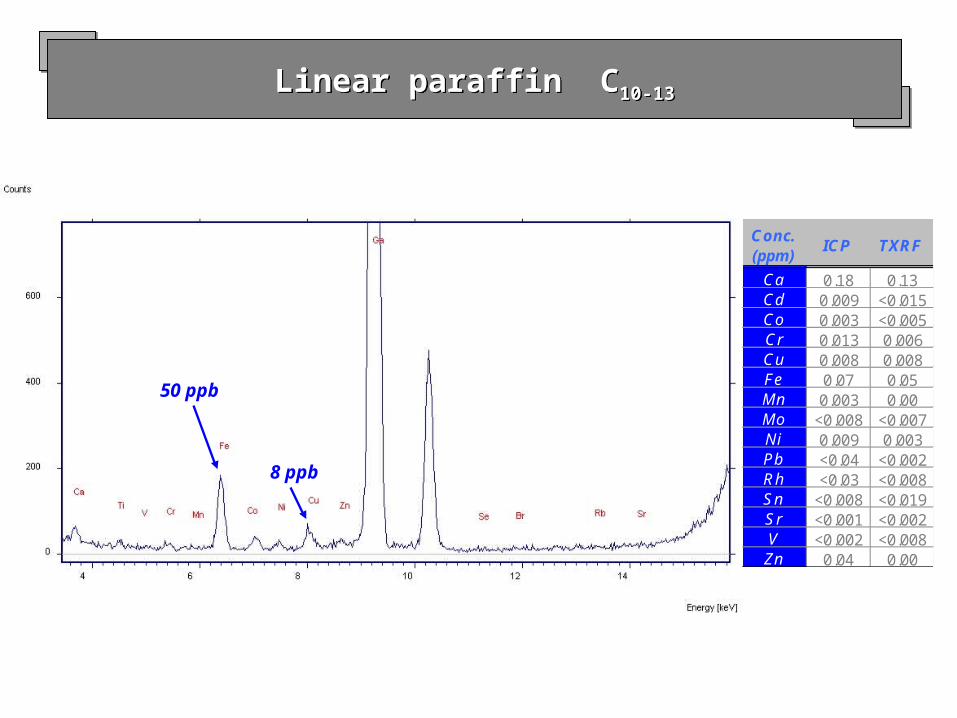
Linear paraffin C10-13Linear paraffin C10-13
Conc. (ppm)
ICP TXRF
Ca 0.18 0.13Cd 0.009 <0.015Co 0.003 <0.005Cr 0.013 0.006Cu 0.008 0.008Fe 0.07 0.05Mn 0.003 0.00Mo <0.008 <0.007Ni 0.009 0.003Pb <0.04 <0.002Rh <0.03 <0.008Sn <0.008 <0.019Sr <0.001 <0.002V <0.002 <0.008Zn 0.04 0.00
50 ppb
8 ppb

Detection limits: ICP-OES vs. TXRFDetection limits: ICP-OES vs. TXRF
ICP-OES (ASTM: D 5708-B)Campione : 10g @ 25 ml

Correlation ICP-OES vs. TXRFCorrelation ICP-OES vs. TXRF
0.0 0.2 0.4 0.6 0.8
0.0
0.2
0.4
0.6
0.8
TXR
F (p
pm)
ICP OES (ppm)
ICP-OES vs. TXRF Paired t-test : results do
not differ significantly Linearly correlated
Y = A + B * X N = 32 R = 0.998 --------------------------------------Param Value IC (t*s)--------------------------------------A -0.0039 0.0046B 1.0137 0.0252-------------------------------------

ICP-OES TXRF
SensitivityComparable, except for Rh
and PbDecreases with atomic
number
Sample preparation
Time consuming treatment (days) with risk of
contaminationSimple and fast
Time 3-4 days A few hours (about 3)
CalibrationMultielement: depending
on the element to be determined
ONE ONLY internal standard
Field of application
"non volatile” metals (no Hg, Se, As..)
Simultaneous and accurate determination of the elements with Z > 15
ConclusionsConclusions
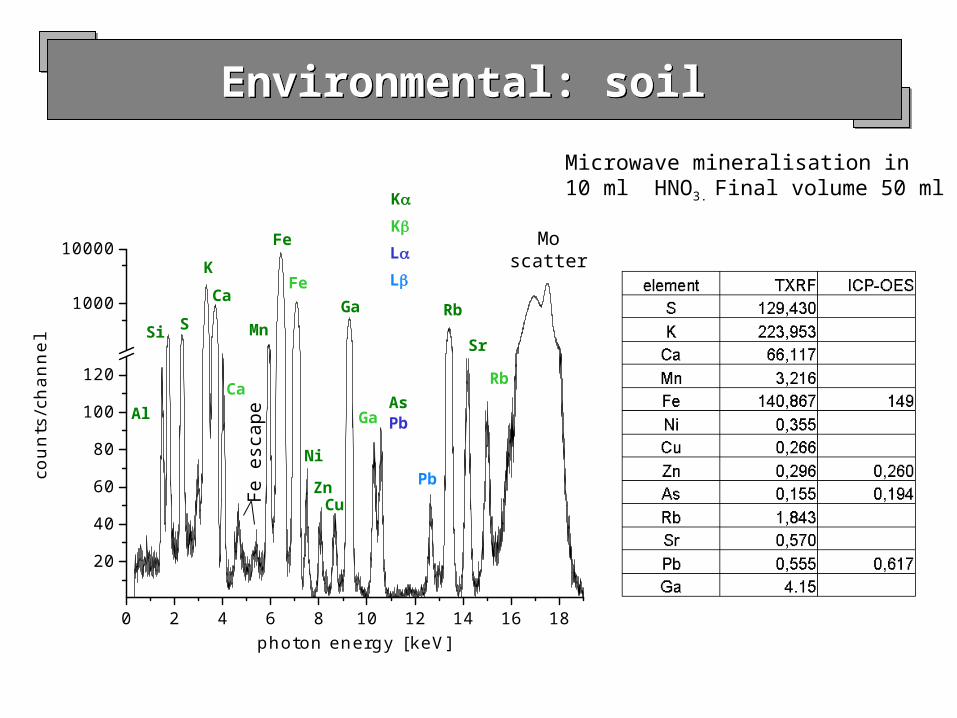
Environmental: soilEnvironmental: soil
0 2 4 6 8 10 12 14 16 18
20
40
60
80
100
120
1000
10000
counts
/chan
nel
photon energy [keV]
Sr
Ga
ZnCu
Ni
Fe
Mn
K
Ca
Moscatter
Pb
Pb
Rb
Al
K
K
L
L
Rb
Fe
Ca
Si S
Fe e
scape Ga
As
Microwave mineralisation in10 ml HNO3. Final volume 50 ml

0 5 10 15 200
200
400
600
800
1000
1200
1400
Sorgente di Mo 35 kV, 30 mA10 L di campioneTempo di conteggio 200 s.
Benzina Standard ICIP Pb 0.324 g/l
PbPb
Pb
Pb
Pb
Moradiazione scatterata
Ga K
Ga K 15 ppmstandard interno
VS
Si
Conteggi
E (keV)
Counts
Standard Petrol ICP Pb 0.324 g/l
Internal standard
Scattered radiation
Mo X-ray tube 35kV, 30mASample: 10 µLLive time: 200 s
Environmental: gasolineEnvironmental: gasoline

Environmental: compostEnvironmental: compost
microwave
microwaveTXRF no treatment
ARPAVRING_3-02: esercizio di interconfronto

Particulate matter monitoringParticulate matter monitoring
Multi-stage Cascade impactors can be usedin order to collect the the particulate matter onto standard quartz carriers that can be analysed directly with the TXRF without anysample preparation.
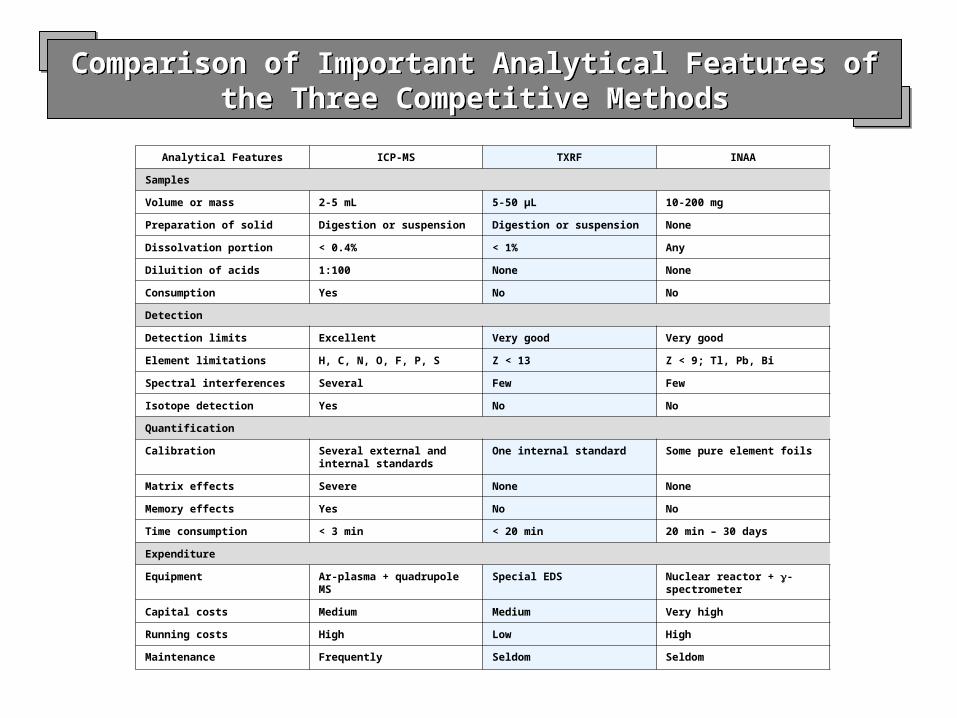
Analytical Features ICP-MS TXRF INAA
Samples
Volume or mass 2-5 mL 5-50 µL 10-200 mg
Preparation of solid Digestion or suspension Digestion or suspension None
Dissolvation portion < 0.4% < 1% Any
Diluition of acids 1:100 None None
Consumption Yes No No
Detection
Detection limits Excellent Very good Very good
Element limitations H, C, N, O, F, P, S Z < 13 Z < 9; Tl, Pb, Bi
Spectral interferences Several Few Few
Isotope detection Yes No No
Quantification
Calibration Several external and internal standards
One internal standard Some pure element foils
Matrix effects Severe None None
Memory effects Yes No No
Time consumption < 3 min < 20 min 20 min – 30 days
Expenditure
Equipment Ar-plasma + quadrupole MS
Special EDS Nuclear reactor + -spectrometer
Capital costs Medium Medium Very high
Running costs High Low High
Maintenance Frequently Seldom Seldom
Comparison of Important Analytical Features of the Three Competitive Methods
Comparison of Important Analytical Features of the Three Competitive Methods

Benefits and Drawbacks of TXRF Applied to Element Analyses
Benefits and Drawbacks of TXRF Applied to Element Analyses
• Unique micro analytical capability• Unique micro analytical capability
• Great variety of samples and applications• Great variety of samples and applications
• Simultaneous multielement determination• Simultaneous multielement determination
• Low detection limits• Low detection limits
• Impossibility of totally non-destructive analysis• Impossibility of totally non-destructive analysis
• Limitation for non-volatile liquids• Limitation for non-volatile liquids
• Exception of low-Z elements• Exception of low-Z elements
• Limitation by high matrix contents• Limitation by high matrix contents
Benefits:Benefits: Drawbacks or limitations:Drawbacks or limitations:
• Simple quantification by internal standardization• Simple quantification by internal standardization
• No matrix or memory effects• No matrix or memory effects
• Wide dynamic range• Wide dynamic range
• Non-destructive surface and thin-layer analysis• Non-destructive surface and thin-layer analysis
• Simple automated operations• Simple automated operations
• Low running costs and maintenance• Low running costs and maintenance
• Restriction to flat or polished samples• Restriction to flat or polished samples

ReferencesReferences
R. Klockenkämper, Total-Reflection X-Ray Fluorescence Analysis, John Wiley and Sons Inc., New York, 1997, ISBN 0-471-30524-3
Spectrochimica Acta Part B: Atomic SpectroscopyTXRF Special Issues – TXRF conference proceedings
Vol. 44, Issue 5 (1989) Vol. 46, Issue 10 (1991) Vol. 48, Issue 2 (1993)Vol. 52, Issue 7 (1997)Vol. 54, Issue 10 (1999)Vol. 56, Issue 11 (2001)Vol. 58, Issue 12 (2003)

ReferencesReferences
Total Reflection XRF (TXRF), P.Kregsamer, C.Streli, P.Wobrauschek,Book chapter "Handbook of X-ray Spectrometry",Ed: R.Van Grieken, A.Markowicz, Marcel Dekker, 2002
Handbook of X-Ray SpectrometryRene E. Van GriekenAndrzej A. Markowicz
ISBN: 0824706005Publisher: Marcel Dekker
Total Reflection X-ray Fluorescence Analysis,P.Wobrauschek, C.Streli, Chapter in :Encyclopedia of Analytical Chemistry,Ed.:R.A.Meyers,Wiley & Sons, 2000, 13384-13414


