EPA/600/R-03/114F April 2003 Analyses of Laboratory and Field Studies of Reproductive Toxicity in Birds Exposed to Dioxin-like Compounds for Use in Ecological Risk Assessment National Center for Environmental Assessment Office of Research and Development U.S. Environmental Protection Agency Cincinnati, OH 45268
Transcript
EPA/600/R-03/114FApril 2003
Analyses of Laboratory and FieldStudies of Reproductive Toxicity in
Birds Exposed to Dioxin-likeCompounds for Use in Ecological Risk
Assessment
National Center for Environmental AssessmentOffice of Research and Development
U.S. Environmental Protection AgencyCincinnati, OH 45268
NOTICE
The U.S. Environmental Protection Agency through its Office of Research andDevelopment funded and managed the research described here under contract no. 68-C-98-187 to TN&Associates and under order no. 2C-R163-NASA to Michael C. Newman, Ph.D. It has been subjected to the Agency’s peer and administrative reviewand has been approved for publication as an EPA document. Mention of trade names or commercial products does not constitute endorsement or recommendation for use.
Glenn Suter II, Office of Research and Development
Statistical Analysis:
Michael Newman, Virginia Institute of Marine SciencesPatricia Shaw-Allen, Office of Research and Development
Work Assignment Manager:
Christopher Cubbison, Office of Research and Development
Peer Reviewers:
Mace Barron, P.E.A.K. ResearchJames Chapman, Region 5Patricia Cirone, Region 10Hector Galbraith, Galbraith Environmental SciencesTala Henry, Office of Research and DevelopmentDiane Henshel, Indiana University
vi
LIST OF ABBREVIATIONS
AhR Aryl hydrocarbon receptorCASRN Chemical Abstract Service Registry NumberEDx Effective dose for x (percent of test subjects)ERA Ecological risk assessmentEROD Ethoxyresorufin-O-deethylase
FEL Frank effect levelGLM General linear modelHCx Hazardous concentration for x (percent of tested species)LDx Lethal dose for x (percent of test subjects)LOAEL Lowest-observed-adverse-effect levelNOAEL No-observed-adverse-effect levelPBT Persistent bioaccumulative toxicantPCB Polychlorinated biphenylPCDD/F Polychlorinated dibenzodioxin/furan
PHAH Polyhalogenated aromatic hydrocarbon
REP/TEF Relative potency/Toxicological equivalency factorRTECS Registry of Toxic Effects of Chemical Substances
SAS Statistical analysis system
SSD Species sensitivity distribution
TCDD Tetrachlorodibenzo-p-dioxin
TEC Toxicological equivalent concentration
TEQ Toxicity equivalent concentration
TRV Toxicity reference value
vii
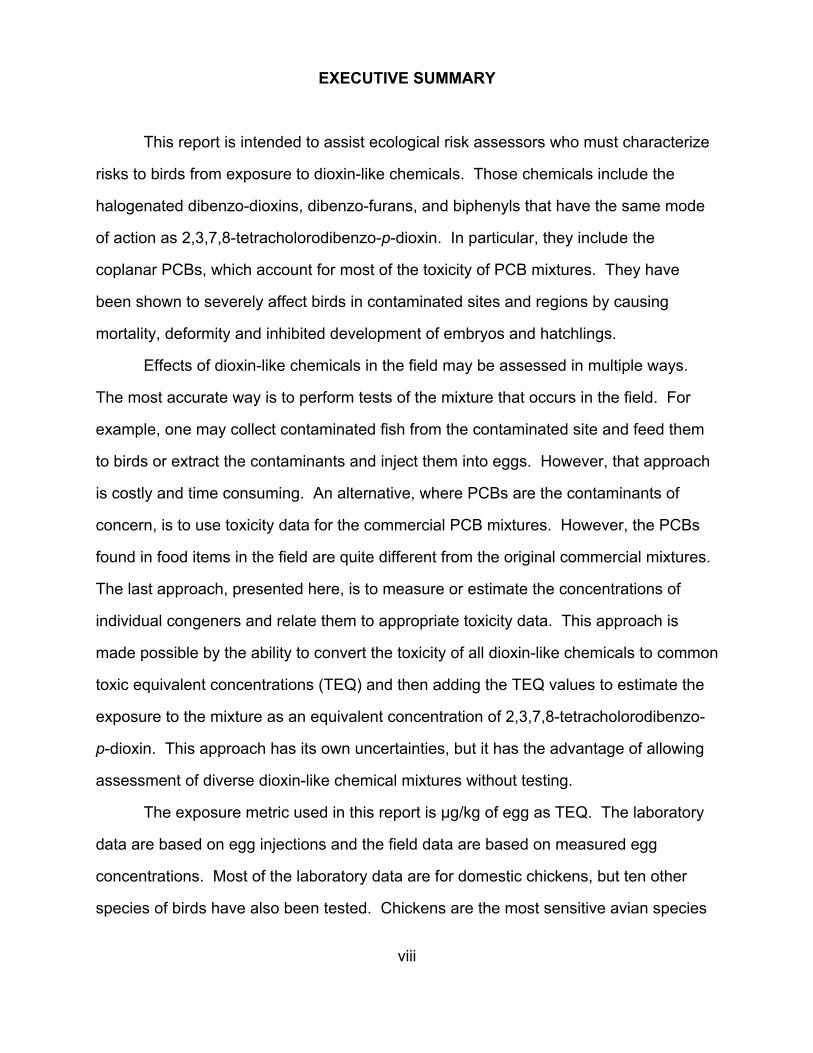
EXECUTIVE SUMMARY
This report is intended to assist ecological risk assessors who must characterize
risks to birds from exposure to dioxin-like chemicals. Those chemicals include the
halogenated dibenzo-dioxins, dibenzo-furans, and biphenyls that have the same mode
of action as 2,3,7,8-tetracholorodibenzo-p-dioxin. In particular, they include the
coplanar PCBs, which account for most of the toxicity of PCB mixtures. They have
been shown to severely affect birds in contaminated sites and regions by causing
mortality, deformity and inhibited development of embryos and hatchlings.
Effects of dioxin-like chemicals in the field may be assessed in multiple ways.
The most accurate way is to perform tests of the mixture that occurs in the field. For
example, one may collect contaminated fish from the contaminated site and feed them
to birds or extract the contaminants and inject them into eggs. However, that approach
is costly and time consuming. An alternative, where PCBs are the contaminants of
concern, is to use toxicity data for the commercial PCB mixtures. However, the PCBs
found in food items in the field are quite different from the original commercial mixtures.
The last approach, presented here, is to measure or estimate the concentrations of
individual congeners and relate them to appropriate toxicity data. This approach is
made possible by the ability to convert the toxicity of all dioxin-like chemicals to common
toxic equivalent concentrations (TEQ) and then adding the TEQ values to estimate the
exposure to the mixture as an equivalent concentration of 2,3,7,8-tetracholorodibenzo-
p-dioxin. This approach has its own uncertainties, but it has the advantage of allowing
assessment of diverse dioxin-like chemical mixtures without testing.
The exposure metric used in this report is :g/kg of egg as TEQ. The laboratory
data are based on egg injections and the field data are based on measured egg
concentrations. Most of the laboratory data are for domestic chickens, but ten other
species of birds have also been tested. Chickens are the most sensitive avian species
viii
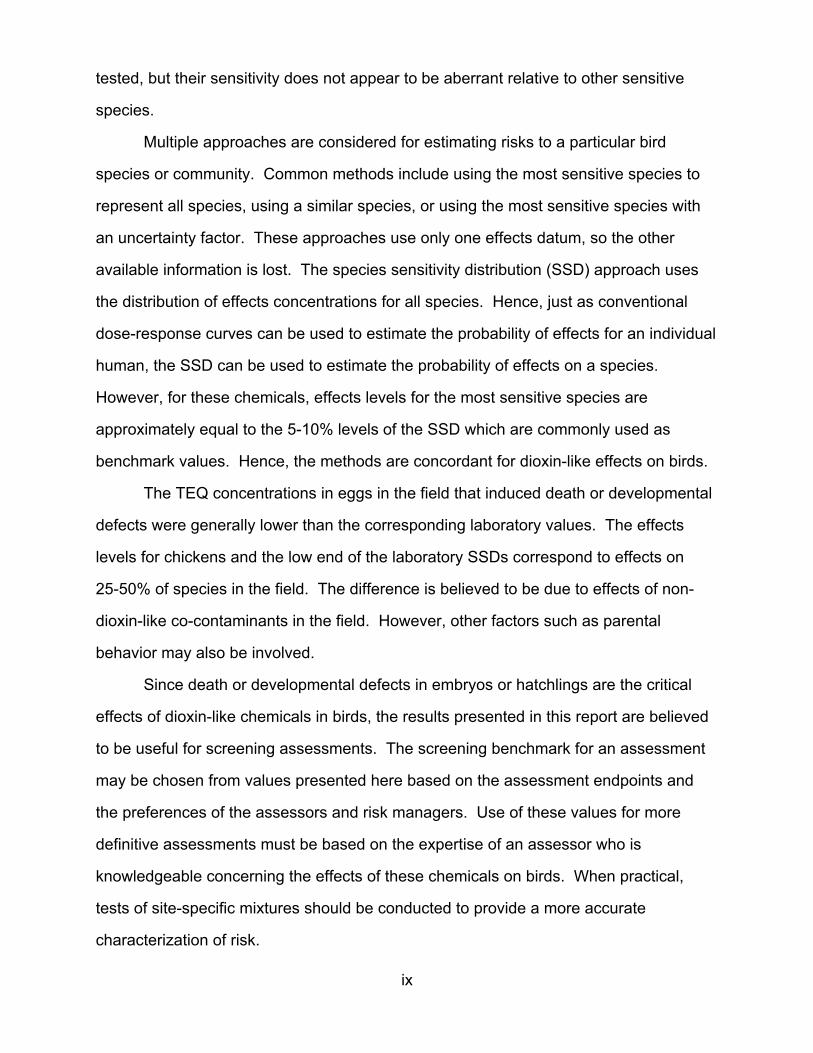
tested, but their sensitivity does not appear to be aberrant relative to other sensitive
species.
Multiple approaches are considered for estimating risks to a particular bird
species or community. Common methods include using the most sensitive species to
represent all species, using a similar species, or using the most sensitive species with
an uncertainty factor. These approaches use only one effects datum, so the other
available information is lost. The species sensitivity distribution (SSD) approach uses
the distribution of effects concentrations for all species. Hence, just as conventional
dose-response curves can be used to estimate the probability of effects for an individual
human, the SSD can be used to estimate the probability of effects on a species.
However, for these chemicals, effects levels for the most sensitive species are
approximately equal to the 5-10% levels of the SSD which are commonly used as
benchmark values. Hence, the methods are concordant for dioxin-like effects on birds.
The TEQ concentrations in eggs in the field that induced death or developmental
defects were generally lower than the corresponding laboratory values. The effects
levels for chickens and the low end of the laboratory SSDs correspond to effects on
25-50% of species in the field. The difference is believed to be due to effects of non-
dioxin-like co-contaminants in the field. However, other factors such as parental
behavior may also be involved.
Since death or developmental defects in embryos or hatchlings are the critical
effects of dioxin-like chemicals in birds, the results presented in this report are believed
to be useful for screening assessments. The screening benchmark for an assessment
may be chosen from values presented here based on the assessment endpoints and
the preferences of the assessors and risk managers. Use of these values for more
definitive assessments must be based on the expertise of an assessor who is
knowledgeable concerning the effects of these chemicals on birds. When practical,
tests of site-specific mixtures should be conducted to provide a more accurate
characterization of risk.
ix
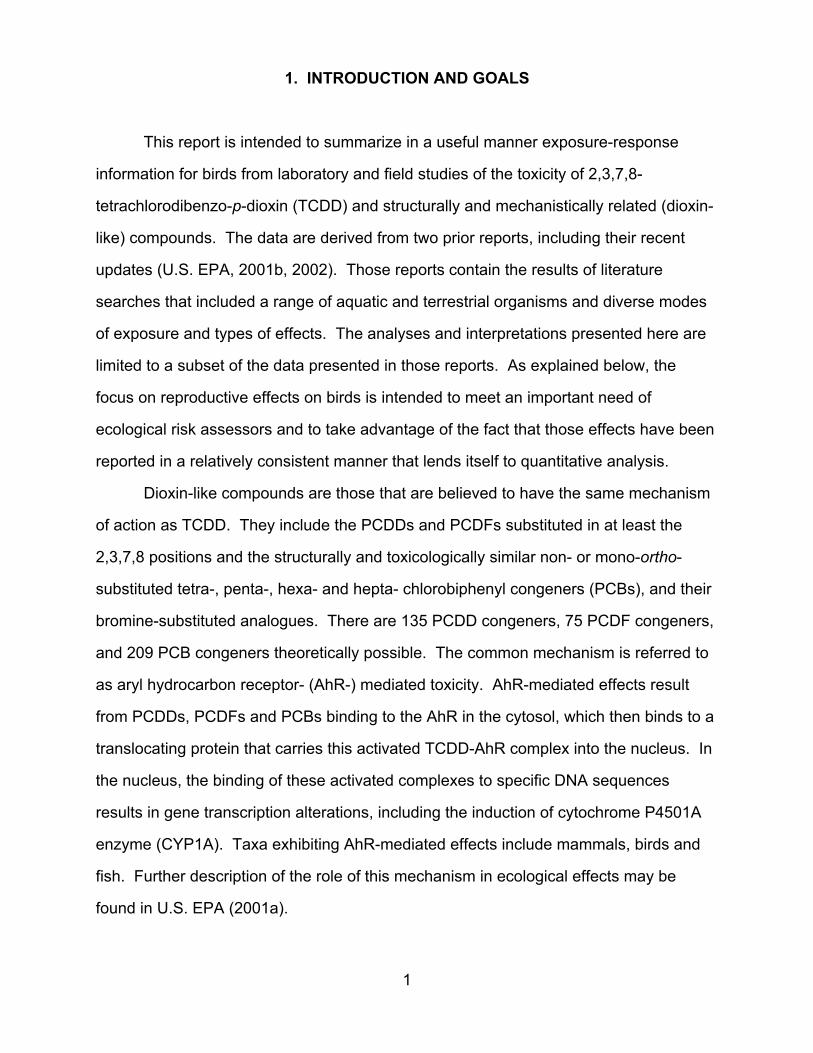
1. INTRODUCTION AND GOALS
This report is intended to summarize in a useful manner exposure-response
information for birds from laboratory and field studies of the toxicity of 2,3,7,8-
tetrachlorodibenzo-p-dioxin (TCDD) and structurally and mechanistically related (dioxin-
like) compounds. The data are derived from two prior reports, including their recent
updates (U.S. EPA, 2001b, 2002). Those reports contain the results of literature
searches that included a range of aquatic and terrestrial organisms and diverse modes
of exposure and types of effects. The analyses and interpretations presented here are
limited to a subset of the data presented in those reports. As explained below, the
focus on reproductive effects on birds is intended to meet an important need of
ecological risk assessors and to take advantage of the fact that those effects have been
reported in a relatively consistent manner that lends itself to quantitative analysis.
Dioxin-like compounds are those that are believed to have the same mechanism
of action as TCDD. They include the PCDDs and PCDFs substituted in at least the
2,3,7,8 positions and the structurally and toxicologically similar non- or mono-ortho
substituted tetra-, penta-, hexa- and hepta- chlorobiphenyl congeners (PCBs), and their
bromine-substituted analogues. There are 135 PCDD congeners, 75 PCDF congeners,
and 209 PCB congeners theoretically possible. The common mechanism is referred to
as aryl hydrocarbon receptor- (AhR-) mediated toxicity. AhR-mediated effects result
from PCDDs, PCDFs and PCBs binding to the AhR in the cytosol, which then binds to a
translocating protein that carries this activated TCDD-AhR complex into the nucleus. In
the nucleus, the binding of these activated complexes to specific DNA sequences
results in gene transcription alterations, including the induction of cytochrome P4501A
enzyme (CYP1A). Taxa exhibiting AhR-mediated effects include mammals, birds and
fish. Further description of the role of this mechanism in ecological effects may be
found in U.S. EPA (2001a).
1
The goal of this report is to provide to ecological risk assessors a relatively
consistent set of avian toxicity data for dioxin-like chemicals and a useful set of
alternative analyses of those data. Each of those alternatives may be useful in a
particular assessment context. It is important to recognize that none of the values or
relationships presented here constitute in any sense a criterion, standard, TRV, or other
U.S. EPA-endorsed benchmark. Rather, the appropriateness of any estimated
threshold value or effects level must be determined by the risk manager or other
decision maker in consultation with risk assessors. Similarly, although we believe that
the type of data used here are, in general, the most appropriate for estimating risks to
birds from dioxin-like chemicals, other data may be more appropriate in specific cases.
The full literature reviews are found in U.S. EPA (2001b, 2002).
2
2. APPROACH
This section describes the approach taken to this report and explains the intent
and rationale for that approach. Specific methods for deriving exposure-response
relationships are discussed in the following section.
2.1. DATA SOURCES
The data used in this report were obtained from previously published literature
searches (U.S. EPA, 2001b, 2002). The search terms included common names,
chemical name synonyms and registration numbers such as CASRN (Chemical
Abstract Service Registry Number) for each congener. A second list of search terms
included potentially affected wildlife species (fish, birds, mammals, reptiles/amphibians
and invertebrates). A third list contained an extensive array of ecotoxicological
endpoints. Electronic searches were conducted for studies published in peer-refereed
journals which contained one or more terms from each list. Papers were retained if they
contained all of the following:
• More than one quantitative dose or exposure. The many single exposurestudies were not included because of the uncertainty of their interpretationin a dose-response context.
• One or more quantifiable, toxicological endpoint was identified
• Appropriate statistical tests showing significant changes in response asdose or exposure levels change
• The study authors evaluated the potential of co-contaminants to bias the results in the field-exposure studies
For the selected studies, information on the experimental design or field study
design, exposure, and effects was recorded and entered into an electronic data base.
The searches included toxicological information from laboratory studies of the full set of
taxa and from field studies with birds. The searches extended back to 1980 and were
last updated in mid-2002. A subset of those laboratory and field data sets was used in
this study. They were studies of avian embryo or hatchling mortality, deformities, or
3
other developmental effects which were accompanied by concentrations in eggs. That
data set is presented in Appendix A. The criteria for selection of data for these analyses
from the prior literature reviews are presented in Box 2-1.
TEXT BOX 2-1. Criteria for data selection .
The studies used in these analyses were selected from those in the literature reviews in U.S. EPA (2001b, 2002). The criteria used for selecting studies to foranalysis were based on the criteria described in Appendix D to Part 132 GreatLakes Water Quality Initiative (GLWQI) Methodology for the Development of WildlifeCriteria (U.S. EPA, 1993, 1995). Those criteria were refined as follows to producesufficiently consistent data sets.
Included: • Studies of any avian species • Laboratory studies in which exposure was by egg injection • Laboratory studies that expressed exposure as egg concentrations of
individual dioxin-like chemicals or defined mixtures of dioxin-like chemicals • Field studies in which exposure was expressed as or could be converted to
egg concentrations in TEQs • Laboratory studies in which the reported effects included mortality or
developmental decrements or defects of embryos or hatchlings • Field studies in which the recorded effects included mortality, developmental
decrements or defects of embryos or hatchlings, or reductions in fledging success
• The NOEC and LOEC for the most sensitive appropriate response
Excluded: • Effects on enzyme induction or other effects that are not considered adverse • Studies in which exposure was defined as concentrations of an Aroclor or
other commercial mixture • Laboratory studies in which chicken eggs were injected after day four or the
equivalent developmental stage for other species
2.2. USE OF INDIVIDUAL CONGENERS
This report assesses the individual compounds and estimates their toxicity in a
common unit, mg/kg egg 2,3,7,8-TCDD equivalents (TEQs). There are three
alternatives to this approach. First, one may perform tests of the actual mixture of
concern collected at the contaminated site (Summer et al., 1996; Halbrook et al., 1999).
This is the most reliable approach, but it is expensive and time consuming. Even if such
tests are a potential option, some screening assessment method is required to
4
determine where they are justified. The second approach is to use published toxicity
information for whole PCB product mixtures such as the seven Aroclors marketed in the
U.S. or equivalent products marketed elsewhere (Chapman, 2003). This approach is
not appropriate if halogenated dioxins or furans are present in significant amounts.
Even if PCBs are the only contaminants of concern, this approach is questionable. In
the years since PCB use was halted, component PCB congeners have undergone
differential degradation and partitioning so that the mixtures in abiotic media differ from
the original mixtures. In addition, differential uptake by biota, which occurs at each step
in a food chain, results in dietary exposure to a mixture that differs from that in the
abiotic media. These weathered and bioaccumulated mixtures tend to be more toxic
than the parent product mixture (Giesy and Kannan, 1998). Further, toxicity data for
specific Aroclors or other product mixtures are often unavailable for taxa of interest.
The last alternative approach is to use total PCBs as the exposure concentration which
may be related to effects data for some PCB mixture. This reduces the problem of data
availability and the fact that ambient concentrations cannot be accurately represented
as Araclor concentrations. However, total PCB exposure concentrations cannot be
matched to toxicity data for any particular tested material. One solution is to use data
from a study in which weathered and bioaccumulated PCBs in biota from a site are
used to expose test organisms (Giesy and Kannan, 1998). One such study, in which
contaminated carp were fed to chickens, is available in Summer et al. (1996). That
approach requires that the site mixture be sufficiently similar to the tested mixture.
Since there is no guidance on how to judge that the similarity is sufficient, the
judgement must be ad hoc (U.S. EPA, 2000a).
The use of individual compounds to assess risks from dioxin-like toxicity has
advantages and disadvantages. The chief advantage is that it provides flexibility in
addressing a wide variety of mixtures. High-resolution analytical techniques now allow
the characterization and quantification of individual congeners in abiotic or biotic
materials. While avian toxicity data are not available for all dioxin-like compounds, the
5
development of Toxicity Equivalency Factors (TEFs) allows estimation of the effects of
the individual members of the group or of the combined toxicity of the dioxin-like
constituents of contaminant mixtures. One significant limitation of this approach is the
uncertainty associated with the TEFs. They are described as order-of-magnitude
estimates (van den Berg et al., 1998). A second disadvantage of this approach is that
effects that are not mediated by the Ah receptor are not included. Some congeners that
weakly bind the Ah receptor may be more toxic through other mechanisms of action,
and the ortho-substituted PCBs that do not bind to the Ah receptor are not represented
in this method. Because non-dioxin-like mechanisms are not well known, there is no
good way to address them currently other than testing the ambient mixture. Hence, the
TEF approach used in this report estimates risks arising from only one mechanism of
action. One may assume that the dioxin-like effects are the only ones that need be
considered when assessing halogenated dioxins, furans and PCBs. This assumption is
supported by the fact that, even for PCB mixtures, the AhR-mediated effects are the
critical effects in tests on animals (Giesy and Kannan, 1998). Critical effects are the
biologically significant effects that occur at the lowest exposures and would result in the
lowest allowable total concentration in environmental media. Alternatively, one may
simply assume that this approach addresses one important mechanism of action for
halogenated dioxins, furans and PCBs, and other mechanisms must be addressed
separately. More research is needed concerning those other mechanisms of action of
halogenated dicyclic aromatic compounds. A final disadvantage is the cost of analytical
chemistry for the many compounds in contaminated media.
The use of TEFs to toxicity-normalize the concentrations of dioxin-like
compounds and to estimate their combined toxicity in mixtures is based on their
concentration-additivity (U.S. EPA, 2000a). Chemicals with a common mechanism of
action have parallel concentration-response curves, so concentrations of one may be
converted to effective concentrations of another by multiplying by a factor. If one
chemical’s toxicity is well-characterized, the concentrations of the other members of the
6
group may be converted to equivalent concentrations of that chemical by multiplying by
the appropriate TEFs. The product of the concentration of a chemical and its TEF is the
toxicity equivalent concentration (TEQ). The effective concentration of a mixture of
such chemicals may be estimated by adding the converted concentrations to derive a
TEQ for the mixture (TEQm). That is,
TEQm = 3(TEFi * ci) (1)
where, ci is the concentration of an individual compound and TEFi is the corresponding
factor. In this case, the well-characterized index chemical is 2,3,7,8-TCDD and the
TEQs are estimates of mixture concentrations equal to the same concentration of that
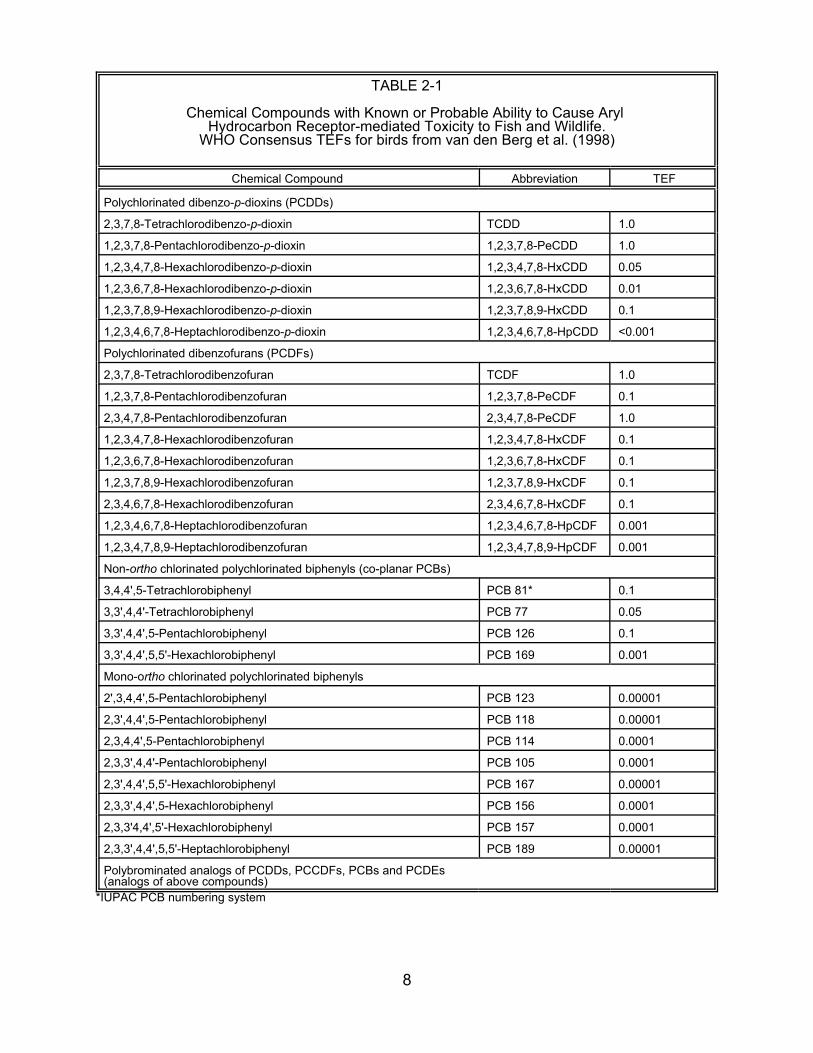
dioxin. The TEFs for birds (Table 2-1) were estimated by a WHO expert panel based
on all available scientific data (van den Berg et al., 1998). A U.S. EPA report suggested
that the TEF approach and the WHO values for the calculation of risks from coplanar
PCBs and PCDD/Fs to fish and wildlife are useful for ecological risk assesment, and
they are used by U.S. EPA asessors (U.S. EPA, 2001a; Valoppi et al., 1999). However,
ecological risk assessments based on Aroclor concentrations are still found to be useful
in some U.S. EPA regions (Chapman, 2003).
Although the use of congener concentrations and TEFs to estimate risks has
conceptual difficulties and quantitative uncertainties, it has proven to be useful in
practice. TEQs are well correlated with effects on avian populations in the field and
normalization using TEFs reduces variance in toxic exposure levels among studies
(Giesy et al., 1994; Giesy and Kannan, 1998).
7
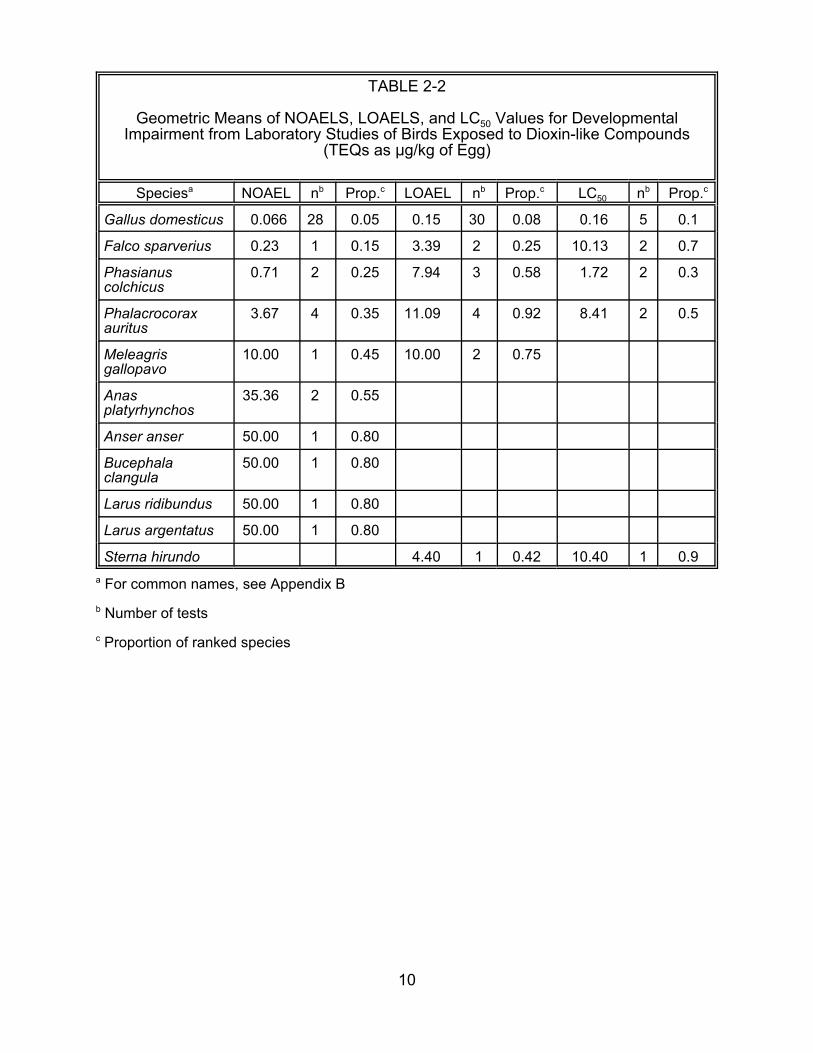
TABLE 2-1
Chemical Compounds with Known or Probable Ability to Cause ArylHydrocarbon Receptor-mediated Toxicity to Fish and Wildlife.
WHO Consensus TEFs for birds from van den Berg et al. (1998)
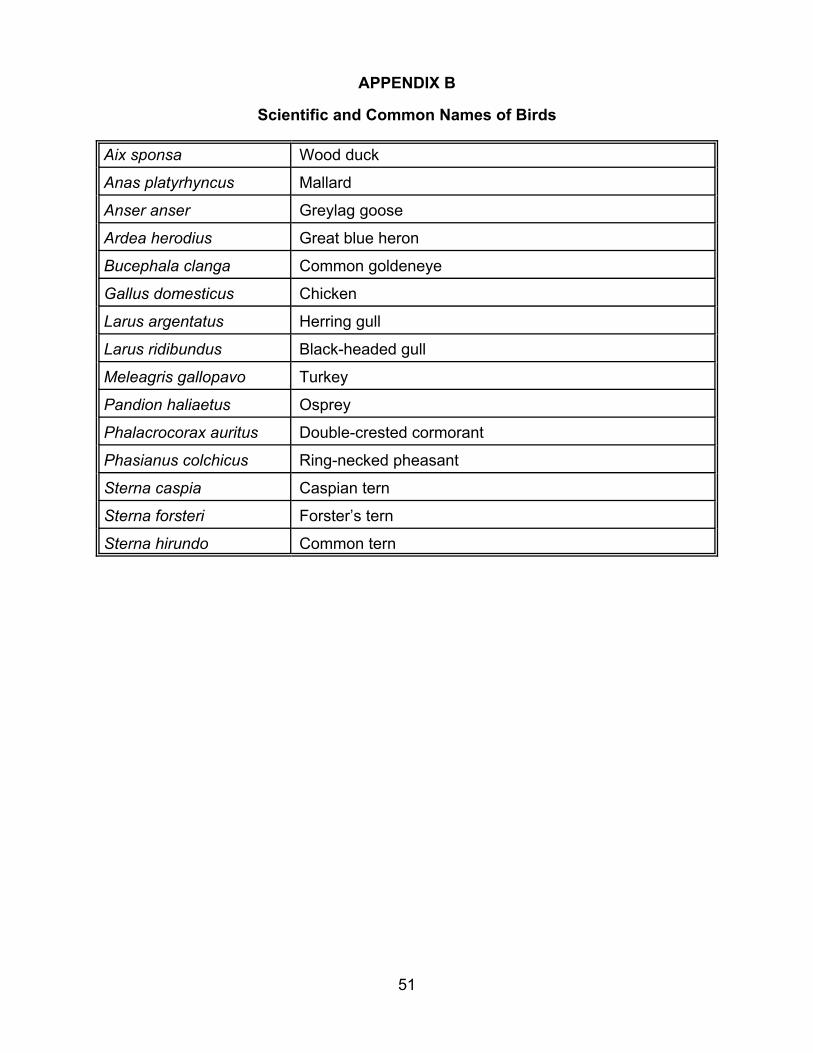
Sterna hirundo 4.40 1 0.42 10.40 1 0.9 a For common names, see Appendix B
b Number of tests
c Proportion of ranked species
10
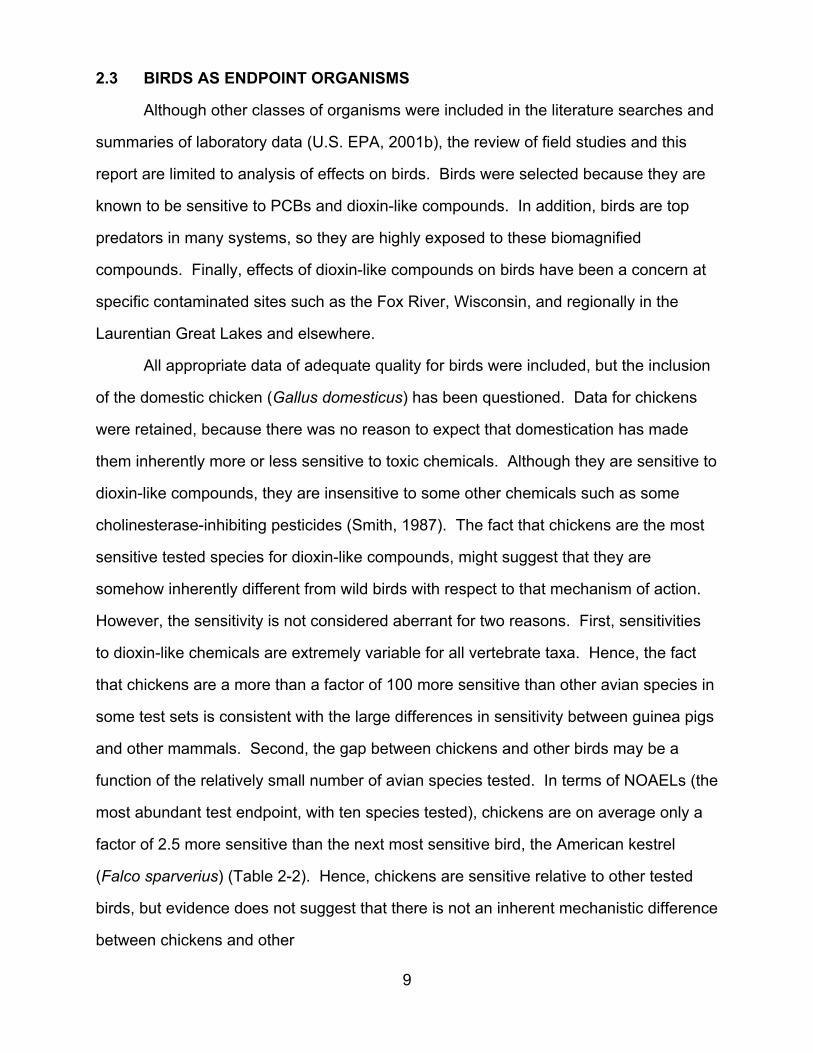
birds that would preclude the possibility that some species of wild birds are equally or
more sensitive.
Chickens are not recommended by the U.S. EPA for avian pesticide testing, but
not because their sensitivity is unusual. Rather, they are not appropriate for
reproduction tests because of their high egg production, and acute tests are not
performed on species that are not used in reproduction tests (Edward Fite, U.S. EPA
Office of Pesticide Programs, personal communication). Hence, the reason for not
using chickens in pesticide testing does not apply to these tests and field studies,
because egg production is not an endpoint.
2.4. MEASURES OF EFFECTS
Dioxin-like chemicals have a variety of effects including enzyme induction,
immunotoxic effects and cancer. However, this report addresses effects on the survival
and development of avian embryos and chicks. These effects were chosen because of
data availability, comparability among studies and the clear relevance of reproductive
success to avian populations. Embryo developmental and lethal effects constitute the
most common test endpoints for effects of dioxin-like chemicals on birds, because they
appear to be the most important sensitive effects for those chemicals (Giesy and
Kannan, 1998). Further, embryo lethality, based on in ovo exposures, is the preferred
response for the derivation of avian TEFs (van den Berg et al., 1998). This is also
consistent with the proposed soil screening levels for wildlife, which use reproductive
data preferentially for all chemicals (U.S. EPA, 2000b). Two types of effects endpoints
are analyzed. First, an aggregate endpoint including lethality to embryos (failure to
hatch) or to hatchlings, deformities, and reduced growth was used. These effects were
considered to be effectively equivalent because deformed and poorly developed birds
are less likely to survive and reproduce. In addition, mortality, deformity, growth
retardation, and edema co-occur in birds exposed to dioxin-like chemicals, so that they
may be considered a syndrom rather than discrete effects (Gilbertson et al., 1991).
Hence, the deformities and lethalities will be referred to here as developmental effects,
11
because failure to hatch or survive after hatching represents the extremity of
developmental failure. This aggregate developmental endpoint is needed to compare
the laboratory data to the field data, which are less consistent and more focused on
deformities. Second, for the sake of consistency, the mortality data from laboratory
tests were analyzed, without the deformities or growth effects.
From each study, one or more of the following measurement endpoints for
reproductive and developmental effects were obtained from the study:
• NOAEL - No-Observed-Adverse-Effect Level. This is the highest eggconcentration from a study that did not have a statistically significant effecton mortality or development.
• LOAEL - Lowest-Observed-Adverse-Effect Level. This is the lowest eggconcentration from a study that had a statistically significant effect onmortality or development.
• LC50 - Median Lethal Concentration.
• FEL - Frank-Effects Level, defined here as an exposure level causing highmortality, up to total reproductive failure, of a nesting colony.
All effective concentrations were converted to consistent units, :g TEQ/kg egg, wet
weight.
2.5. EXPOSURE METRICS
The exposure metric is the concentration in eggs, expressed as 2,3,7,8-TCDD
toxicity equivalents (TEQs), wet weight. Egg concentrations were used because they
are the most directly relevant exposure metric for effects on development, and because
they can be compared among laboratory and field studies. In addition, the use of egg
concentrations should reduce the interspecies variance by avoiding the variance among
species in uptake and toxicokinetics as well as the variance among oral toxicity tests
due to variance in the administered form. Concentrations may result from egg injections
or from maternal contribution. These modes of egg contamination appear to be
equivalent in their effect on the developing chick, if injections occur early in
development. After preliminary analysis, data from studies that injected eggs after day
four in chickens or at a comparable stages of development in other species were
12
eliminated to obtain a data set based on effectively equivalent exposures. After day
four, chicken embryos have developed all organs and are less susceptible to
developmental toxicity.
Egg concentrations may be used in two ways in ecological risk assessments.
First, eggs may be collected at a site and the measured concentrations, normalized to
TEQs, may be related to the effects information presented here. Second, the
concentrations in eggs may be estimated by modeling from concentrations in abiotic
media or in prey organisms (U.S. EPA, 1993; MacIntosh et al., 1994). The estimated
TEQ concentrations may then be compared to the effects concentrations presented
here.
2.6. LABORATORY VERSUS FIELD STUDIES
Avian effects data are available from both laboratory toxicity tests and field
studies of birds at contaminated sites. Each type of study has advantages and
disadvantages. Laboratory studies allow control of exposure, replication, and random
assignment of treatments. Hence, the differences among exposure groups and controls
can be assumed to be caused by the treatment or error. However, laboratory studies
are always subject to the criticism that conditions or the mode of exposure are
unrealistic. Field studies are inherently realistic, but are inevitably uncontrolled,
unrandomized and, at best, imperfectly replicated. Hence, field studies are subject to
confounding. The most obvious confounding factor is the presence of contaminants
other than dioxin-like compounds. Other differences between field sites may confound
results by affecting the size and quality of the eggs, the nest-attentiveness of the adults,
or genetic characteristics of the populations. In addition, the treatment levels used for
estimating field NOAELs, LOAELs and FELs are imprecise. They are based on binning
the continuum of egg concentrations in intervals and then choosing a concentration to
represent each interval. Hence, the laboratory and field results represent alternative
estimates of the effects of exposure to dioxin-like compounds, each with strengths and
weaknesses.
13
2.7. ALTERNATIVE EXTRAPOLATION MODELS
Currently, there are no standard models for estimating effects on one wildlife
species or a wildlife community from data concerning a set of test species. Hence, we
take the approach in this report of applying multiple methods to the problem of
estimating risks to birds.
14
3. METHODS AND RESULTS
Ecological risk assessors must determine how to use existing data for multiple
species to estimate the effects on individual avian species or the avian community. This
section considers the utility of the common approaches to that problem for risks from
dioxin-like chemical effects. It does not include techniques such as toxicokinetic
modeling which are beyond the current state of practice, particularly for embryonic
exposures.
3.1. USE THE SPECIES OF CONCERN
One solution to the extrapolation problem is to avoid it by using data from the
species of concern (i.e., an assessment endpoint species). A relatively large number of
avian species have been tested or studied in the field for their responses to dioxin-like
compounds (U.S. EPA, 2001b, 2002). If one of them is present at a contaminated site
and is sufficiently significant, it might be selected as an endpoint species. Alternatively,
new tests or field studies may be performed on a species that has been selected for its
significance at a site. However, there are some constraints on new studies. Some bird
species are difficult to obtain, to maintain or to breed in the laboratory. Field studies
have been largely limited to colonial-nesting birds, because of the difficulty of defining
treatment groups and observing enough eggs and hatchlings with solitary-nesting
species. Hence, using data for the endpoint species is a good option that is not likely to
be available for most assessments.
3.2. MOST SENSITIVE TESTED SPECIES
It is common practice in risk assessment to use the most sensitive tested species
to represent all endpoint species. This approach is assumed to be conservative.
However, if few species are tested, it is likely that some species will be more sensitive
than the most sensitive tested species. For example, if five species are tested, the most
sensitive species represents the lower 20th percentile of species. Even if we assume
that the most sensitive species is exactly the 10th percentile species (i.e., it is at the
15
midpoint of its range), in a 100 species avian community, ten would be expected to be
more sensitive. Given the sigmoid shape of most species sensitivity distributions, some
of those species may be considerably more sensitive.
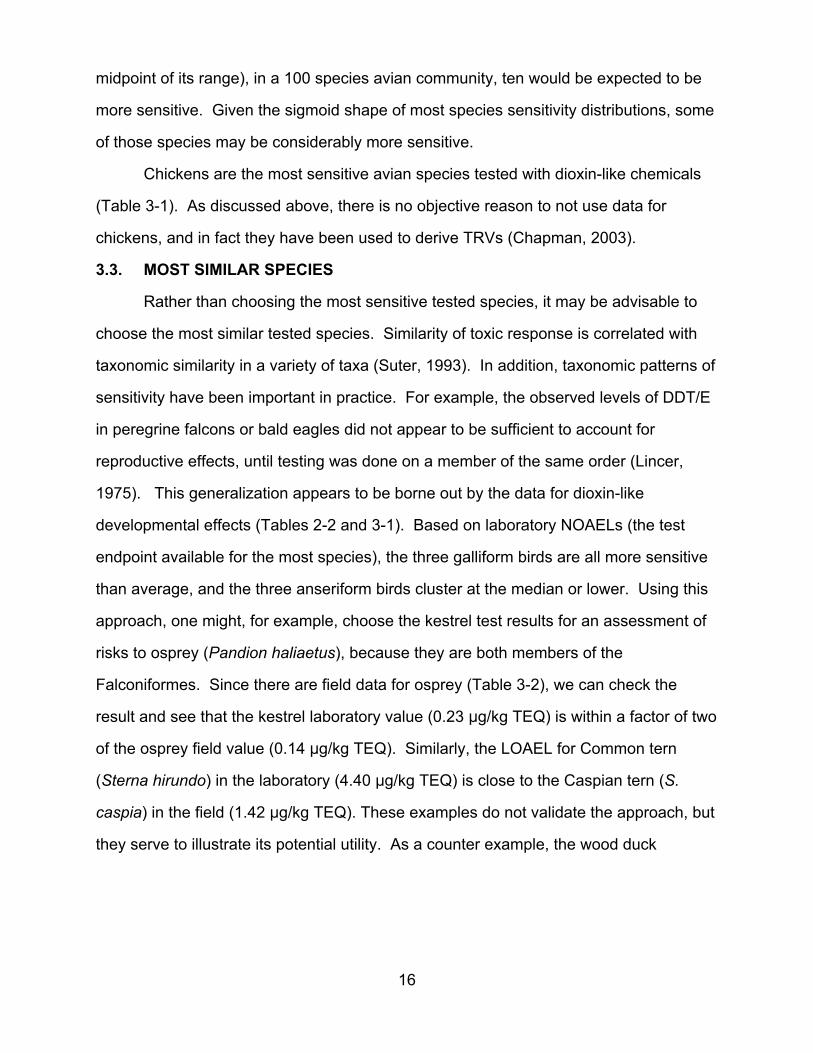
Chickens are the most sensitive avian species tested with dioxin-like chemicals
(Table 3-1). As discussed above, there is no objective reason to not use data for
chickens, and in fact they have been used to derive TRVs (Chapman, 2003).
3.3. MOST SIMILAR SPECIES
Rather than choosing the most sensitive tested species, it may be advisable to
choose the most similar tested species. Similarity of toxic response is correlated with
taxonomic similarity in a variety of taxa (Suter, 1993). In addition, taxonomic patterns of
sensitivity have been important in practice. For example, the observed levels of DDT/E
in peregrine falcons or bald eagles did not appear to be sufficient to account for
reproductive effects, until testing was done on a member of the same order (Lincer,
1975). This generalization appears to be borne out by the data for dioxin-like
developmental effects (Tables 2-2 and 3-1). Based on laboratory NOAELs (the test
endpoint available for the most species), the three galliform birds are all more sensitive
than average, and the three anseriform birds cluster at the median or lower. Using this
approach, one might, for example, choose the kestrel test results for an assessment of
risks to osprey (Pandion haliaetus), because they are both members of the
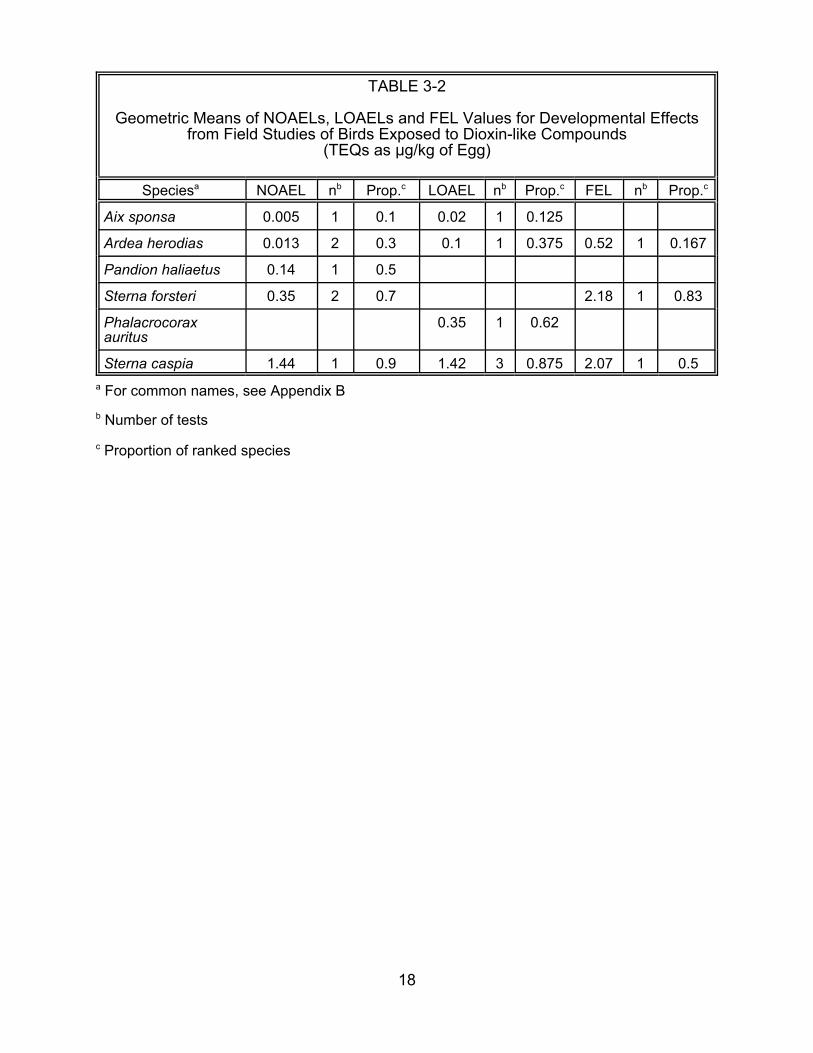
Falconiformes. Since there are field data for osprey (Table 3-2), we can check the
result and see that the kestrel laboratory value (0.23 :g/kg TEQ) is within a factor of two
of the osprey field value (0.14 :g/kg TEQ). Similarly, the LOAEL for Common tern
(Sterna hirundo) in the laboratory (4.40 :g/kg TEQ) is close to the Caspian tern (S.
caspia) in the field (1.42 :g/kg TEQ). These examples do not validate the approach, but
they serve to illustrate its potential utility. As a counter example, the wood duck
16
TABLE 3-1
Geometric Means of NOAELs, LOAELs for Embryo Mortality and LC50s from Laboratory Studies of Birds Exposed to Dioxin-like Compounds
(TEQs as :g/kg of Egg)
Speciesa NOAEL nb Prop.c LOAEL nb Prop.c LC50 nb Prop.c
Sterna caspia 1.44 1 0.9 1.42 3 0.875 2.07 1 0.5 a For common names, see Appendix B
b Number of tests
c Proportion of ranked species
18
appears to be the most sensitive species in the field, while the three anseriform species
tested in the laboratory are insensitive.
Ecological similarity may also be important. Giesy and Kannan (1998) suggested
that piscivorous birds are less sensitive to dioxin-like compounds than terrestrial birds
such as chickens. The evidence for this generalization is weak, but suggestive (Tables
2-2 and 3-1).
3.4. EXTRAPOLATION FACTORS
Ecotoxicological test endpoints may be divided by a factor to account for the
potential sensitivity of untested species. A factor of 10 is often used, based on the use
of a factor of ten to account for interspecies differences in calculating reference doses
for humans. The guidance for Great Lakes wildlife criteria recommends applying a
factor in the range 1 to 10 to the most sensitive species, if reproductive or
developmental data are available for multiple species (U.S. EPA, 1993). However, the
draft guidance for soil screening levels for wildlife does not recommend a factor for
interspecies differences for any chemicals (U.S. EPA, 1996). Giesy and Kannan (1998)
recommend using chicken data for dioxin-like chemicals without an interspecies factor.
Hence, a factor may be applied to chicken responses if a high certainty of protection is
required (e.g., an endangered species is potentially exposed), particularly if the
endpoint species belongs to an untested avian order. If the most similar species is
used, a factor in the range 1 to 10 may be applied, depending on the degree of
similarity, to account for the variance within the taxon.
Factors may also be used to extrapolate between life stages, exposure durations,
and types of response. However, the body of research and testing supports the
premise that embryo development is the critical response in the critical avian life stage
for dioxin-like chemicals. Therefore, no factor is recommended for those
considerations.
19
3.5. ALLOMETRIC SCALING
Allometric scaling is the adjustment of physiological, pharmacological or
toxicological effective levels based on some dimension of the organisms. The most
common practice is to use weight to the 0.66 or 0.75 power to scale to metabolism,
which adjusts for the fact that smaller organisms tend to metabolize and excrete
chemicals more rapidly. Recent studies have found that these fractional exponents do
not apply to birds for many classes of chemicals, and smaller species may be more
sensitive to some classes such as organophosphate pesticides (Mineau et al., 1996;
Sample and Arenal, 1999). Finally, those allometric scaling models would be
inappropriate for the egg exposures used in this report.
3.6. SPECIES SENSITIVITY DISTRIBUTIONS
Species sensitivity distributions (SSDs) are exposure-response relationships that
represent the distribution of species sensitivities relative to exposure. SSDs are
analogous to the distributions of sensitivities of individuals in conventional exposure-
response relationships. Because the variance among species in sensitivity to chemicals
is often more important to ecological risk assessments than variance among individuals,
SSDs have become a common ecological effects model in the U.S., Europe and
elsewhere (Posthuma et al., 2002).
3.6.1. Uses of Species Sensitivity Distributions. SSDs may be used in a variety of
ways. First, they may be used heuristically to display the distributions of species
sensitivities to assist interpretation of a multi-species data set. That is, they may serve
simply as a visual summary of the data that facilitates understanding of the range of
values that the effective concentrations may assume for an individual species or how an
avian guild (e.g., birds that feed on soil invertebrates) or community (e.g., all birds
feeding from a contaminated lake) may respond.
Second, SSDs may be used quantitatively to estimate the proportion of a taxon
(e.g., herons), trophic group (e.g., piscivorous birds) or community that will be affected
by an exposure (Suter et al., 2002). This is equivalent to using a conventional dose-
20
response function to estimate the proportion of a population that will be affected. It
requires fitting some function to the SSD so that, as in other exposure-response
models, the response can be estimated from the exposure level. The most common
functions are the log normal or its linearized version the log probit and the log logistic or
its linearized version the log logit. However, one might simply use the empirical
relationship, and linearly interpolate between the points. The use of tested species to
represent communities relies on the assumption that the tested species are an unbiased
sample of the community. Test species are not chosen randomly, but, since species
sensitivities are not known prior to testing, there is no reason to expect that the
selection is biased. However, some avian families are absent from the set. This
approach is common in aquatic ecological risk assessment, where endpoints are often
chosen at the community level. However, endpoints for avian risk assessments are
seldom defined at the community level.
Third, SSDs may be used quantitatively to estimate the probability that a species
will be affected by an exposure (Suter et al., 2002). This use is more consistent with
practices in avian risk assessments where the focus has been on species populations
rather than taxa or communities. It is equivalent to using conventional dose-response
models to estimate the individual risks (i.e., the probability that an individual will
experience cancer or some other effect at a given dose) in human health risk
assessments. The models are the same as those used for estimating community
effects, but the effects scale is interpreted as the probability of effects on a species
rather than the proportion of species affected. The underlying concept is that we do not
know the sensitivity of an untested species, but we may assume that it is a random
draw from the distribution of avian species sensitivities. Like the community
interpretation (above), the species interpretation of SSDs depends on the set of test
species being an unbiased sample of the community or taxon from which the species is
drawn.
21
Fourth, SSDs are used to set regulatory criteria and standards in the U.S. and
many other nations (Stephan, 2002; Posthuma et al., 2002). For that purpose, a
proportional effect (e.g., 0.05) is selected and the corresponding concentration (e.g., the
HC5) is estimated by inverse regression.1 This use is mentioned here in order to make it
clear that this report does not derive such values. The HC5 values calculated here are
intended only to provide a point of comparison for different SSDs or for SSDs versus
other values. We could have used HC50 values, but, because the curves are not
parallel, it is preferable to compare points in the effects range that is more of concern in
risk assessments.
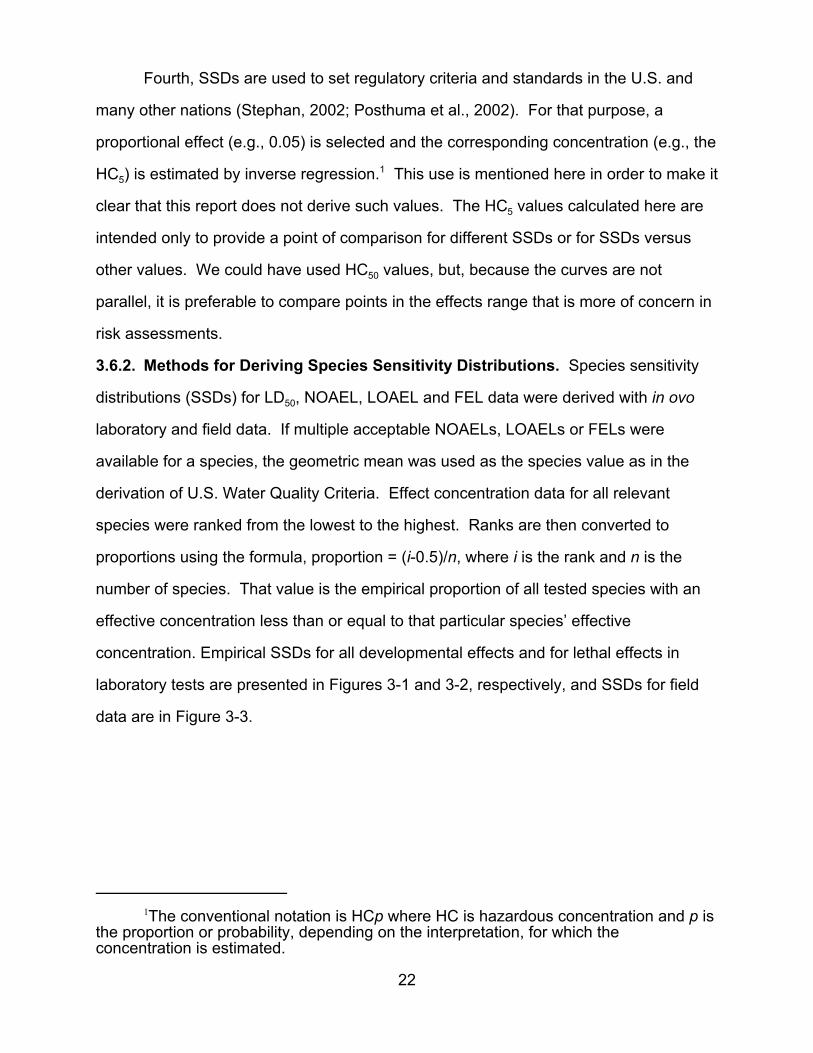
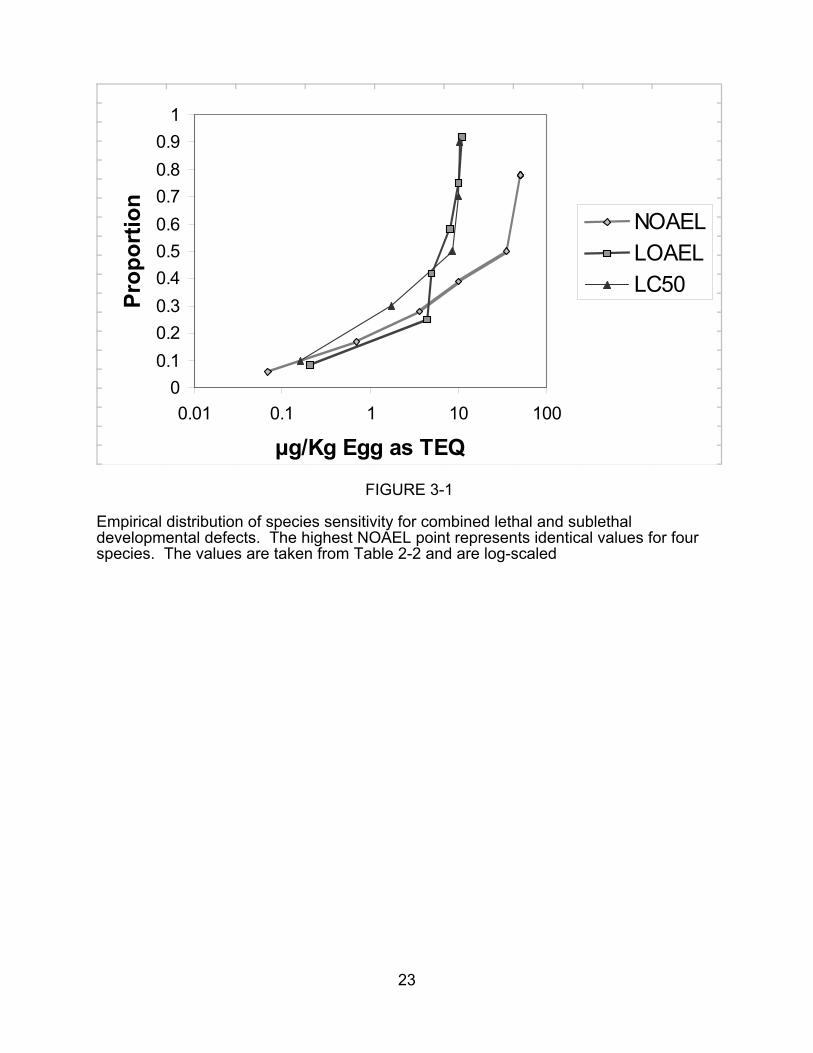
3.6.2. Methods for Deriving Species Sensitivity Distributions. Species sensitivity
distributions (SSDs) for LD50, NOAEL, LOAEL and FEL data were derived with in ovo
laboratory and field data. If multiple acceptable NOAELs, LOAELs or FELs were
available for a species, the geometric mean was used as the species value as in the
derivation of U.S. Water Quality Criteria. Effect concentration data for all relevant
species were ranked from the lowest to the highest. Ranks are then converted to
proportions using the formula, proportion = (i-0.5)/n, where i is the rank and n is the
number of species. That value is the empirical proportion of all tested species with an
effective concentration less than or equal to that particular species’ effective
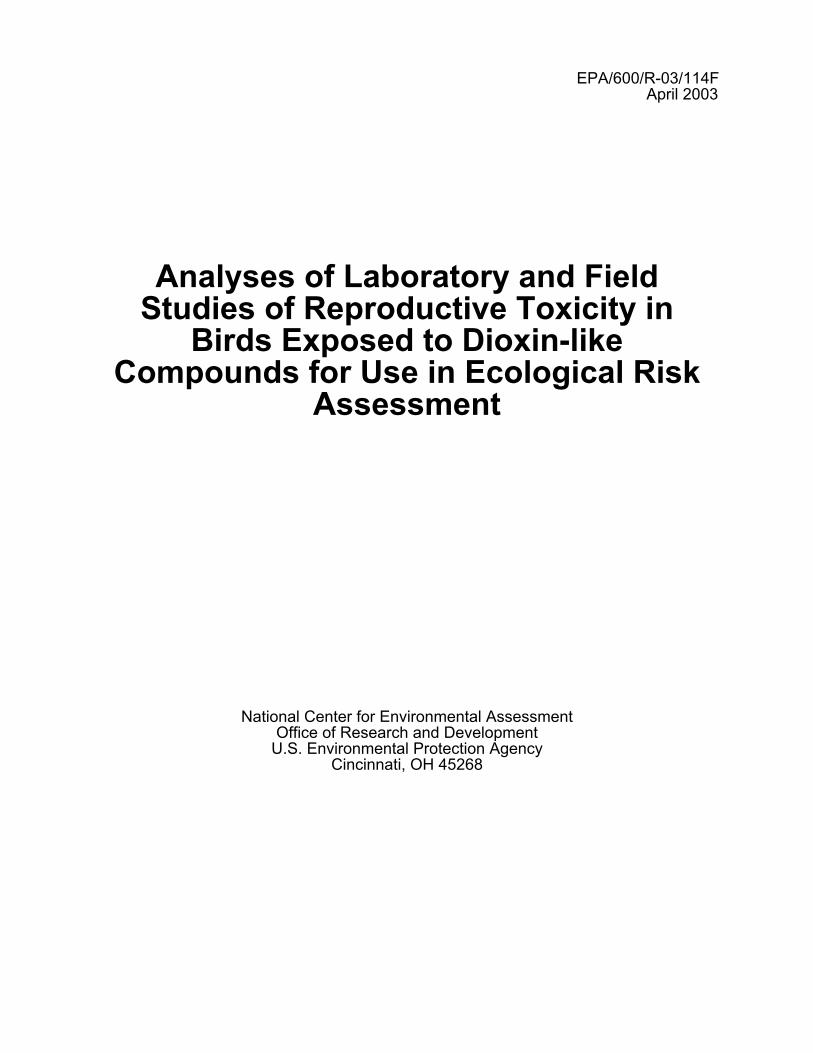
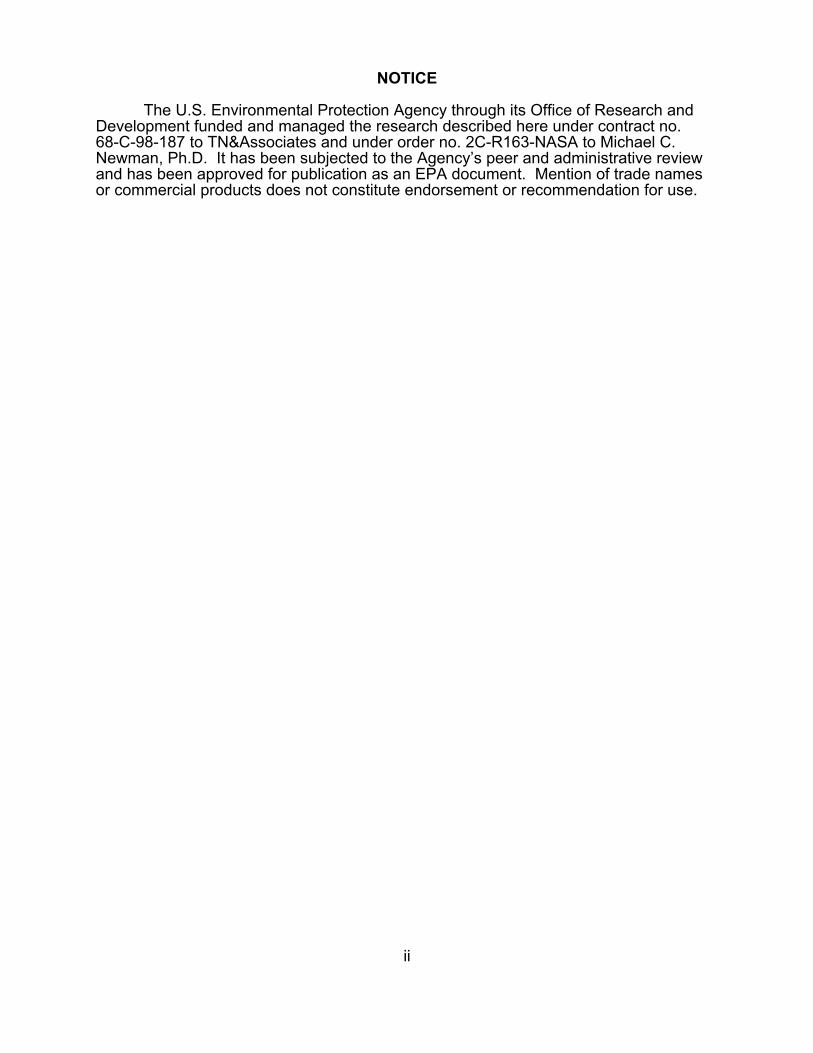
concentration. Empirical SSDs for all developmental effects and for lethal effects in
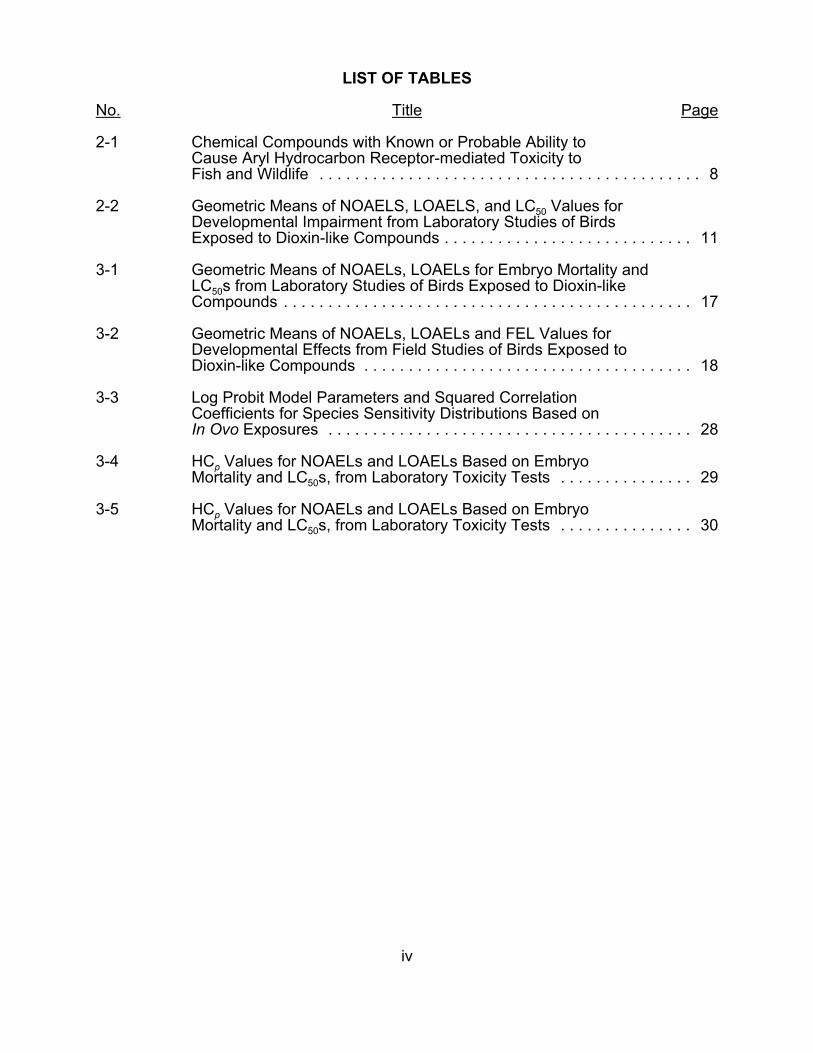
laboratory tests are presented in Figures 3-1 and 3-2, respectively, and SSDs for field
data are in Figure 3-3.
1The conventional notation is HCp where HC is hazardous concentration and p is the proportion or probability, depending on the interpretation, for which theconcentration is estimated.
22
0 0.1 0.2 0.3 0.4 0.5 0.6 0.7 0.8 0.9
1
0.01 0.1 1 10 100
µg/Kg Egg as TEQ
Prop
ortio
n
NOAEL LOAEL LC50
FIGURE 3-1
Empirical distribution of species sensitivity for combined lethal and sublethaldevelopmental defects. The highest NOAEL point represents identical values for fourspecies. The values are taken from Table 2-2 and are log-scaled
23
1 0.9 0.8 0.7 0.6 0.5 0.4 0.3 0.2 0.1
NOAEL LOAEL LC50
0 0.01 0.1 1 10 100
µg/Kg Egg as TEQ
FIGURE 3-2
Empirical distribution of species sensitivity for lethal developmental effects. The highest NOAEL point represents identical values for four species. The values are taken from Table 3-1 and are log-scaled
.
Prop
ortio
n
24
1 0.9 0.8 0.7 0.6 0.5 0.4 0.3 0.2 0.1
NOAEL LOAEL FEL
0 0.001 0.01 0.1 1 10
µg/Kg Egg as TEQ FIGURE 3-3
Empirical distribution of species sensitivity for lethal and sublethal developmentaleffects observed in the field. The values are taken from Table 3-2 and are log-scaled.
Prop
ortio
n
25
Models were then fit to the data (species’ ranks expressed as proportions paired
with corresponding species’ effect concentrations) in Tables 2-2 and 3-1. The SAS
General Linear Models (GLM) procedure was used to fit the log-probit, log-logit and log
weibit (the linearized Weibull) models to a preliminary data set. The log-probit and log
logit models were picked as candidate models because they are the most commonly
used for SSD modeling. Although less commonly used, the Weibull model was
considered because it has often been found to fit SSD data better (e.g., Jagoe and
Newman, 1997; Newman et al., 2000). The differences between r2 values for the log
probit and log-logistic models were minimal. Therefore, the log-probit model was
applied to estimating HCp values to make comparison to the general SSD literature
easier because the log-probit is the most commonly applied model. Although the log
weibit model had the best fit for eight of the nine data sets as gauged by the r2 statistic
and residual plots, the improvement over the log-probit and log-logit was not sufficient to
justify an unconventional model.
Most regulatory practitioners of SSD modeling recommend a minimum of five to
eight observations, but Dutch standards may be derived with as few as four (e.g., Suter
et al., 2002). A frequent consequence of small numbers of species is high estimation
error. Newman et al. (2002) and de Zwart (2002) suggested that optimal estimation
might require as many as 25 to 60 observations, but optimal data sets are seldom
available for risk assessments. The number of observations in Tables 2-2, 3-1 and 3-2
ranged from 5 to 10 for the laboratory data, and 3 to 6 for the field data. Based on
these low numbers of observations, the HCp values calculated for the laboratory data do
not meet most criteria for regulatory uses, but they are judged to be sufficient for
screening. The HCp values were not derived for the field studies because of the
inconsistent exposures and endpoints as wells the low numbers of species.
Consequently, laboratory-derived metrics were emphasized in this section of the report.
The log probit model is: Probit(p)= a + b(log10 EC). The Probit(p) is the probit
transformation of the species proportion, EC is the effective concentration (NOAEL,
26
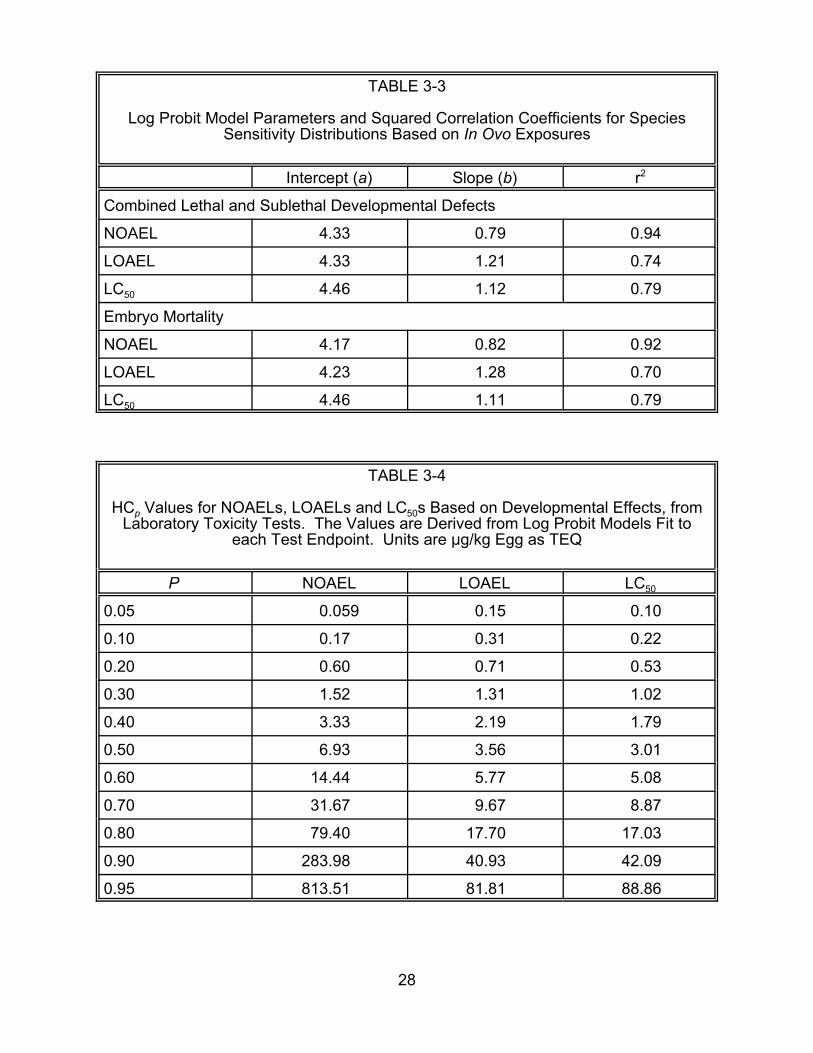
LOAEL, or LC50), and a and b are the fitted intercept and slope variables, respectively.
(Derivation of the species proportion is described above.) The model parameters and r2
values are presented in Table 3-3.
These models may be used to estimate the proportion of bird species affected or
the probability that a species will be affected by substituting the concentrations
estimated to occur in eggs of birds at a site. They may also be used to estimate the
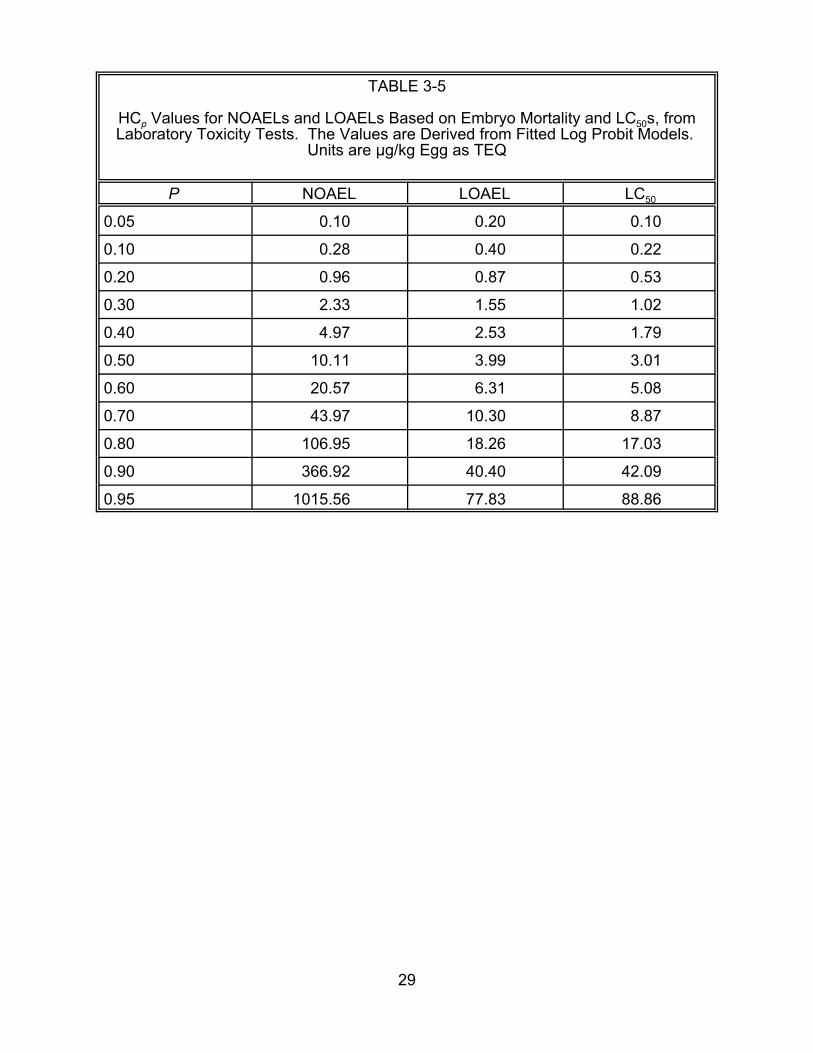
concentrations corresponding to particular proportions or probabilities (HCp) values.
HCp values for given values of p are presented in Tables 3-4 and 3-5 for all
developmental effects and embryo mortality, respectively.
3.6.3. A Worked Example. This worked example summarizes the SSD model fitting
process and the use of the models. The laboratory-derived NOAEL data set (Appendix
A) is used for that purpose. First the SAS program converted all observations to TEQs.
Next, the geometric means of the TEQs were calculated for each combination of
species and test endpoint. The species TEQ geometric means were ranked from the
lowest (i=1) to the highest (i=10) (Tables 2-2 and 3-1). The ranks for these 10 TEQ
values were then transformed into proportions using the formula, proportion = (i-0.5)/10.
To fit a linearized lognormal (log probit) model, the log10 of the geometric mean of
each species TEQ and the probit of the proportion are taken. The probit is the
proportion expressed in units of standard deviations from the mean (normal equivalent
deviation or N.E.D.) with 5 added. Most statistical programs have special functions to
produce N.E.D. or probit values for any proportion. Table 7 in the appendix of Newman
(1995) or similar tables in other texts also can be used for this purpose.
A linearized lognormal model is fit to the nine data pairs (log10 of NOAEL values
versus probit of the species proportion) for embryo mortality using the SAS GLM
procedure. The resulting model (see Table 3-3) is the following: Probit (proportion) =
27
TABLE 3-3
Log Probit Model Parameters and Squared Correlation Coefficients for SpeciesSensitivity Distributions Based on In Ovo Exposures
Intercept (a)
Combined Lethal and Sublethal Developmental Defects
Slope (b) 2 r
4.33 0.79 0.94
4.33 0.74
4.46 1.12 0.79
4.17 0.82 0.92
4.23 1.28 0.70
4.46 1.11 0.79
1.21
NOAEL
LOAEL
LC50
Embryo Mortality
NOAEL
LOAEL
LC50
TABLE 3-4
HCp Values for NOAELs, LOAELs and LC50s Based on Developmental Effects, fromLaboratory Toxicity Tests. are Derived from Log Probit Models Fit to
each Test Endpoint. :g/kg Egg as TEQ The Values
Units are
P NOAEL LOAEL LC50
0.05 0.059 0.15 0.10
0.10 0.17 0.31 0.22
0.20 0.60 0.71 0.53
0.30 1.52 1.31 1.02
0.40 3.33 2.19 1.79
0.50 6.93 3.56 3.01
0.60 14.44 5.77 5.08
0.70 31.67 9.67 8.87
0.80 79.40 17.70 17.03
0.90 283.98 40.93 42.09
0.95 813.51 81.81 88.86
28
TABLE 3-5
HCp Values for NOAELs and LOAELs Based on Embryo Mortality and LC50s, fromLaboratory Toxicity Tests. are Derived from Fitted Log Probit Models.
Units are :g/kg Egg as TEQ The Values
P NOAEL LOAEL LC50
0.05 0.10 0.20 0.10
0.10 0.28 0.40 0.22
0.20 0.96 0.87 0.53
0.30 2.33 1.55 1.02
0.40 4.97 2.53 1.79
0.50 10.11 3.99 3.01
0.60 20.57 6.31 5.08
0.70 43.97 10.30 8.87
0.80 106.95 18.26 17.03
0.90 366.92 40.40 42.09
0.95 1015.56 77.83 88.86
29
0.82(log10 of the geometric mean of the NOAEL) + 4.17. The log10 HC5 could be
estimated by inserting the probit for 0.05 (i.e., 3.35515) into this equation and solving for
log10 NOAEL. The antilogarithm of this predicted log10 NOAEL for the proportion of 0.05
(i.e., the antilogarithm of -0.99) is 0.10 :g/kg of egg (TEQ). Hence, HC5 can be
estimated as follows:
Probit P = 4.17 + 0.82 (log HC5)
Log HC5 = -0.99
HC5 = antilog (-0.99) = 0.10
For risk assessment one would estimate P, the proportion of species at or below
the benchmark or the probability of being at or below the benchmark for a given
concentration C. If C is 0.10 :g/kg egg as TEQ, the solution for the developmental
failure NOAEL is as follows:
Probit P = 4.17 + 0.82 (log C)
Probit P = 3.35
From a table of probits or statistical software:
P = 0.05
Hence, at 0.10 :g/kg egg as TEQ and given the model, the developmental NOAEL is
exceeded for 5% of species, or the probability that the developmental NOAEL for a
particular species is exceeded is 5%.
3.6.4. Results from Species Sensitivity Distributions. The chief advantage of the
SSD approach is that it clearly demonstrates the wide range of sensitivities of birds to
dioxin-like chemicals. A wide range of effects levels has also been observed for
mammals. It also demonstrates the importance of testing a large number of species.
30
For example, the increase in the number of species from six for LOAELs to nine or ten
for NOAELs results in an order-of-magnitude increase in the range of observed values
(Tables 2-2 and 3-1) and changes the form of the SSDs (Figures 3-1 and 3-2). This is
because the added species are relatively insensitive ducks, geese and gulls. Those
effects of species number and selection on the distributions results in the ironic result
that, for proportions greater than 0.3, the NOAELs are higher than LOAELs and median
lethal levels. However, the distributions are reasonably similar for low effects levels
(i.e., for p<0.2). If this approach were used to derive a HCp for use as a clean-up level
or other benchmark, the effects of the high NOAEL values could be eliminated by using
linear interpolation or by refitting the log-probit or other function with the values above
the median weighted to zero.
3.7. COMPARISON OF LABORATORY AND FIELD
As discussed above, field observations and laboratory tests provide independent
estimates of the effects of dioxin-like chemicals on birds. Each has its strengths and
weaknesses. Comparisons of results are difficult because of the lack of data for the
same effects on the same species in the laboratory and field. The only exception is the
double-crested cormorant (Phalacrocorax auritus). The field LOAEL for cormorant
terata is 0.35 :g/kg egg TEQ, while the geometric mean LOAEL for embryo mortality in
the laboratory is 14 :g/kg egg TEQ, a 40-fold difference. However, another field study
of this species found that the LOAEL for EROD induction was 1.6 :g/kg egg TEQ, a
9-fold difference from the laboratory value for a nominally more sensitive endpoint.
Hence, the differences between field studies for this species are nearly as large as
those between laboratory and field.
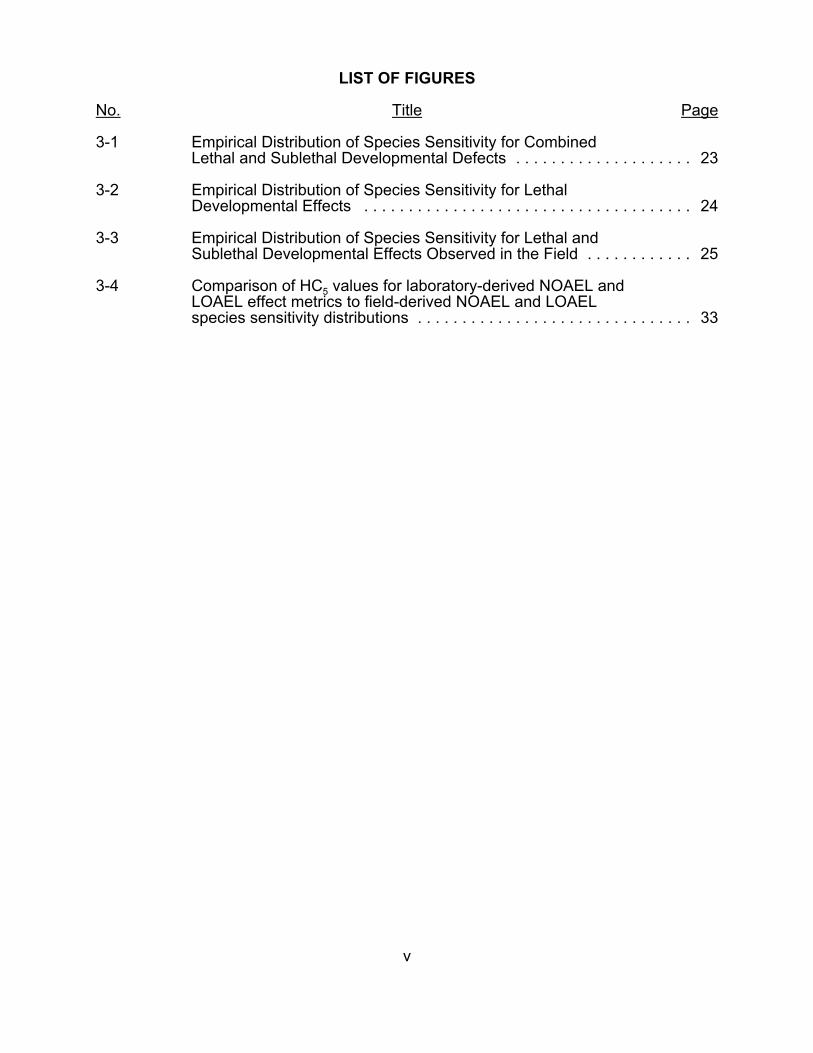
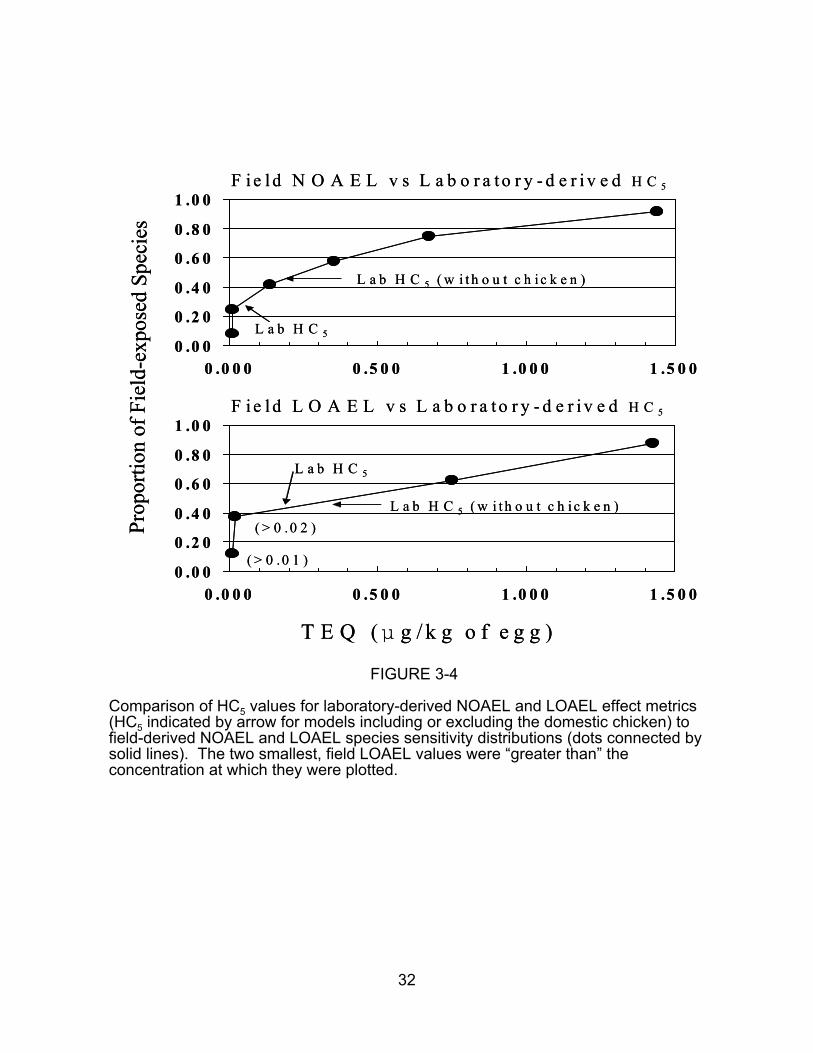
Comparing the distributions of effects levels in the laboratory and field data sets
provides a better basis for inference. Figure 3-4 shows the relationship between HC5
values from laboratory SSDs (with and without chickens) and field SSDs for both
31
0 . 0 0
0 . 2 0
0 . 4 0
0 . 6 0
0 . 8 0
1 . 0 0
0 . 0 0 0 0 . 5 0 0 1 . 0 0 0 1 . 5 0 0
F i e l d N O A E L v s L a b o r a t o r y - d e r i v e d H C 5
0 . 0 0
0 . 2 0
0 . 4 0
0 . 6 0
0 . 8 0
1 . 0 0
0 . 0 0 0 0 . 5 0 0 1 . 0 0 0 1 . 5 0 0
F i e l d L O A E L v s L a b o r a t o r y - d e r i v e d H C 5
T E Q ( : g / k g o f e g g )
Prop
orti o
n of
Fi e
ld- e
xpos
ed S
peci
es
F i e l d N O A E L v s L a b o r a t o r y - d e r i v e d H C 5 1 .0 0
0 .8 0
0 .6 0
0 .4 0
0 .2 0
0 .0 0 0 .0 0 0 0 .5 0 0 1 .0 0 0 1 .5 0 0
L a b H C 5
L a b H C 5 ( w i t h o u t c h i c k e n )
L a b H C 5
L a b H C 5 ( w i t h o u t c h i c k e n )
F i e l d L O A E L v s L a b o r a t o r y - d e r i v e d H C 5 1 .0 0
0 .8 0
0 .6 0
0 .4 0
0 .2 0
0 .0 0 0 .0 0 0 0 .5 0 0 1 .0 0 0 1 .5 0 0
L a b H C 5
( > 0 . 0 1 )
( > 0 . 0 2 ) L a b H C 5 ( w i t h o u t c h i c k e n )
L a b H C 5
( > 0 . 0 1 )
( > 0 . 0 2 ) L a b H C 5 ( w i t h o u t c h i c k e n )
T E Q ( : g / k g o f e g g )
FIGURE 3-4
Comparison of HC5 values for laboratory-derived NOAEL and LOAEL effect metrics(HC5 indicated by arrow for models including or excluding the domestic chicken) tofield-derived NOAEL and LOAEL species sensitivity distributions (dots connected bysolid lines). The two smallest, field LOAEL values were “greater than” theconcentration at which they were plotted.
Prop
orti o
n of
Fi e
ld- e
xpos
ed S
peci
es
32
NOAELs and LOAELs. The field effects are more sensitive, but, if chickens are
included, the laboratory fifth percentiles (HC5 values) for NOAELs and LOAELs
correspond to field proportions of 27% and 40%, respectively. Hence, the
discrepancies are not inordinately large, given the many differences between the
laboratory and field exposures. However, without the data for chickens, the
discrepancies are larger.
The presence of non-dioxin-like chemicals in field eggs seems to be the most
likely explanation for the apparently greater sensitivity in the field. The authors of the
field studies tried to focus on characteristic dioxin-like effects and studies were not
included if other contaminants were reported to be significant concerns with respect to
avian toxicity, but contributions of other contaminants could not be excluded. That is
particularly the case for the most sensitive species, the wood duck (Aix sponsa) for
which the most sensitive effect was reduced hatching success. However, other inherent
differences cannot be excluded. In particular, differences in field and laboratory
conditions may contribute to the greater field sensitivity. Laboratory incubators may
promote the survival of embryos that might succumb in the field. Alternatively, the use
of statistical significance rather than biological significance in deriving measures of
effect can result in unintended biases. However, NOAELs and LOAELs should tend to
be higher in field studies, because the variance is higher and the number of replicates
tends to be lower than in laboratory tests. Hence, that bias would not account for the
observed differences, but rather would tend to minimize them.
33
4. SUMMARY AND CONCLUSIONS
The critical effects of dioxin-like chemicals on birds are in ovo developmental
effects, including deformities and mortality. The contaminant composition of eggs, from
either injection or maternal contribution, is the appropriate exposure metric. This
exposure may be converted to a common exposure metric, the TEQ, by TEF
normalization. Such normalized concentrations in eggs were used to derive a relatively
consistent data set of the comparison of different measures of effect in the laboratory
and field. These measures of effect may be used with measures of exposure derived
either by measuring concentrations in eggs at a contaminated site or by modeling egg
concentrations to characterize avian risks from a single dioxin-like chemical or a mixture
of such chemicals.
The applicability of the available avian effects data to assessments of specific
species and communities were considered using alternative approaches. Because
none of these methods has been endorsed by the U.S. EPA as best for wildlife risk
assessments, and each has been used by the Agency in some assessments, they are
simply presented here without recommendation. Risk assessors should consult with the
relevant risk manager before selecting and using a method for deriving screening
benchmarks.
A conclusion of these analyses is that the domestic chicken is, as is generally
recognized, the most sensitive tested species, but it is not aberrantly sensitive. Given
the wide range of sensitivities within birds and within mammals to dioxin-like chemicals,
test data for chickens should be used.
As in most effects analyses for ecological risk assessment, a major conclusion of
this report is that more data are needed. As discussed in Section 3.6.3, the small
number of species tested relative to the range of avian taxa that may be exposed and
the differences in the number of species for each test endpoint complicate comparisons.
Some major avian taxa are conspicuously absent. These data deficiencies are common
34
to all data analyses, but are most conspicuous when SSDs are derived, because they
reveal the size of the data set and data patterns that are not apparent when only the
most sensitive or most similar species is used. The quality and consistency, as well as
the number of data, are problems which make differences among species and test
endpoints hard to interpret. The data set might be expanded somewhat by including
publications other than peer-reviewed journals and some species may have been
missed due to the emphasis on aquatic birds in the original searches. However, the
problem must be solved by more consistent, high quality, peer-reviewed studies.
An advantage of the SSD approach is that it is less sensitive to moderately small
data sets like that for dioxin-like effects (e.g., 4-10 species) than the conventional use of
the most sensitive tested species. If, for example, there are values for a particular
response in six species, it is unlikely that the most sensitive of those species is the most
sensitive bird. However, if the model fit to those values is a good representation of the
underlying distribution of sensitivity, then we can estimate any percentile of the
distribution.
One commonly expressed concern in ecotoxicological risk assessment is that
toxicity tests are more sensitive than field effects. This does not appear to be the case
for avian effects of dioxin-like chemicals. The field studies analyzed here tended to
yield effects at lower concentrations than the laboratory tests. This difference may be
due to the presence of toxic contaminants other than dioxin-like chemicals or to other
field conditions. Hence, to assess risks from dioxin-like chemicals in the field given the
background of co-contaminants and imperfect parental incubation, the field data may be
used as effects estimates. To assess effects of dioxin-like chemicals per se, the
laboratory data should be used.
One lesson from this analysis and the prior reviews is that, although the
ecotoxicological literature on dioxin-like chemicals is voluminous, relatively little of it is
useful for risk assessment. Many of the studies have only one or a few exposure levels,
the exposures are poorly specified, the statistics are inappropriate, the effects are not
35
demonstrably adverse, and other problems. A few more well-conducted studies with
new species might significantly change the results of all of the approaches presented.
In addition, there are no generally accepted standard protocols for egg injection studies
or for field studies of reproductive effects in birds. For example, eggs may be injected in
the yolk or air sac and the test chemical may be diluted in any carrier. Hence, there is
extraneous variance in the data used here due to differences in the way that even the
best studies are conducted, their endpoints are defined, and their data are analyzed.
One way to improve this and similar analyses would be to derive consistent test
endpoints from the published studies rather than using the various endpoints reported
by the authors. The assortment of NOAEC, LOAEC, LC50, and FELs obscures the
underlying exposure response relationships. In addition, the test endpoints based on
hypothesis testing statistics do not indicate any particular effect level and are influenced
by test design and performance as much as by biological response. A standard
response metric might be the proportion of eggs producing normal chicks surviving at
least two days post-hatch. A similar standard reproductive metric (weight of juveniles
per egg) has been used successfully in analysis of chronic tests of fish (Suter et al.,
1987).
In sum, the results presented here provide a defensible basis for screening
ecological risk assessments of dioxin-like effects on birds. Such assessments are
sufficient if exposure levels are found to be clearly in the toxic or non-toxic ranges.
Where risks are marginal, it may be desirable to perform tests of the site-specific
mixture. If that is not possible, the risk characterization must be performed by qualified
experts to ensure proper interpretation of the results presented here in the context of
the available science concerning dioxin-like toxicity.
36
5. REFERENCES
Brunström, B., L. Anderson, E. Nikolaidis and L. Dencker. 1990. Non-ortho- and monoortho-chlorine-substituted polychlorinated biphenyls – embyrotoxicity and inhibition oflymphocyte development. Chemosphere. 20: 1125-1128.
Chapman, J. 2003. Toxicity reference values (TRVs) for mammals and birds based onselected Aroclors. Memo of March 6, 2003, to Shari Kolak. U.S. Environmental Protection Agency, Region 5, Chicago, IL.
de Zwart, D. 2002. Observed regularities in species sensitivity distributions for aquaticspecies. In: Species Sensitivity Distributions in Ecotoxicology, L. Posthuma, G.W. SuterII and T.P. Traas, Ed. Lewis Publishers, Boca Raton, FL. p.133-154.
Giesy, J.P. and K. Kannan. 1998. Dioxin-like and non-dioxin-like toxic effects of polychlorinated biphenyls (PCBs): Implications for risk assessment. Crit. Rev. Toxicol. 28(6): 511-569.
Giesy, J.P., J.P. Ludwig and D.E. Tillitt. 1994. Deformities in birds of the Great Lakes region: Assigning causality. Environ. Sci. Technol. 28:128-135A.
Gilbertson, M., T. Kubiak, J. Ludwig and G. Fox. 1991. Great Lakes embryo mortality,edema, and deformaties syndrome (GLEMEDS) in colonial fish-eating birds: Similarityto chick-edema disease. J. Toxicol. Environ. Health. 33: 455-5220.
Halbrook, R.S., R.L. Brewer, Jr. and D.A. Buehler. 1999. Ecological risk assessment ofa large river-reservoir: 8. Experimental study of the effects of polychlorinated biphenylson reproductive success of mink. Environ. Toxicol. Chem. 18(4): 649-654.
Jagoe, R. and M.C. Newman. 1997. Bootstrap estimation of community NOEC values.Ecotoxicology. 6: 293-306.
Lincer, J.L. 1975. DDE-induced egshell-thinning in the American kestrel: A comparisonof the field situation and laboratory results. J. Appl. Ecol. 12: 781-793.
MacIntosh, D.L., G.W. Suter, II and F.O. Hoffman. 1994. Uses of probabilisticexposure models in ecological risk assessments of contaminated sites. Risk Anal. 14: 405-419.
Mineau, P., B.T. Collins and A. Baril. 1996. On the use of scaling factors to improveinterspecies extrapolation of acute toxicity in birds. Regul. Toxicol. Pharmacol.24: 24-29.
Newman, M.C. 1995. Quantitative Methods in Aquatic Ecotoxicology. CRC Lewis Publishers, Boca Raton, FL.
Newman, M.C., D.R. Ownby, L.C.A. Mézin et al. 2000. Applying species sensitivitydistributions in ecological risk assessment: Assumptions of distribution type andsufficient numbers of species. Environ. Toxicol. Chem. 19: 508-515.
37
Newman, M.C., D.R. Ownby, L.C.A. Mézin et al. 2002. Species sensitivity distributionsin ecological risk assessment: Distributional assumptions, alternate bootstraptechniques, and estimation of adequate number of species. In: Species SensitivityDistributions in Ecotoxicology, L. Posthuma, G.W. Suter II and T.P. Traas, Ed. Lewis Publishers, Boca Raton, FL. p.119-132.
Posthuma, L., G.S. Suter II and T.P. Traas. 2002. Species Sensitivity Distributions inEcotoxicology. Lewis Publishers, Boca Raton, FL.
Sample, B.E. and C.A. Arenal. 1999. Allometric models for interspecies extrapolationfor wildlife toxicity data. Bull. Environ. Contam. Toxicol. 62: 653-663.
Smith, G.J. 1987. Pesticide Use and Toxicology in Relation to Wildlife:Organophosphate and Carbamate Compounds. U.S. Fish and Wildlife Service,Washington, DC. Resource Pub. 170.
Stephan, C.E. 2002. Use of species sensitivity distributions in the derivation of waterquality criteria for aquatic life by the U.S. Environmental Protection Agency. In: SpeciesSensitivity Distributions in Ecotoxicology, L. Posthuma, G.S. Suter II and T.P. Traas, Ed.Lewis Publishers, Boca Raton, FL.
Summer, C.L., J.P. Giesy, S.J. Bursian et al. 1996. Effects induced by feedingorganochlorine-contaminated carp from Saginaw Bay, Lake Huron, to laying whiteleghorn hens. II. Embryotoxic and teratogenic effects. J. Toxicol. Environ. Health. 49:409.
Suter II, G.W. 1993. Ecological Risk Assessment. Lewis Publishers, Boca Raton, FL.p. 538.
Suter II, G.W., A.E. Rosen, E. Linder and D.F. Parkhurst. 1987. Endpoints forresponses of fish to chronic toxic exposures. Environ. Toxicol. Chem. 6: 793-809.
Suter II, G.W., T.P. Traas and L. Posthuma. 2002. Issues and practices in thederivation and use of species sensitivity distributions. In: Species SensitivityDistributions in Ecotoxicology, L. Posthuma, G.W. Suter II and T.P. Traas, Ed. Lewis Publishers, Boca Raton, FL. p. 437-474.
U.S. EPA. 1993. Wildlife criteria portions of the proposed water quality criteria for theGreat Lakes system. Office of Science and Technology, Washington, DC.EPA/822/R-93/006.
U.S. EPA. 1995. Great Lakes Water Quality Initiative Criteria Documents for theProtection of Wildlife DDT; Mercury; 2,3,7,8-TCDD; PCBs. Prepared by the Office ofScience and Technology for the Office of Water, Washington, DC. EPA-820-B-95-008.
U.S. EPA. 1996. Soil Screening Guidance: Technical Background Document. Office of Solid Waste and Emergency Response, Washington, DC.
U.S. EPA. 2000a. Supplementary Guidance for Conducting Health Risk Assessment ofChemical Mixtures. Risk Assessment Forum, Washington, DC. EPA/630/R-00/002.Available in pdf format at: http://www.epa.gov/NCEA/raf/chem_mix.htm.
U.S. EPA. 2000b. Ecological Soil Screening Level Guidance, Draft. Office of Emergency and Remedial Response, Washington, DC.
38
U.S. EPA. 2001a. Workshop Report on the Application of 2,3,7,8-TCDD ToxicityEquivalence Factors to Fish and Wildlife. Office of Research and Development, RiskAssessment Forum, Washington DC. EPA/603/R-01/002.
U.S. EPA. 2001b. Critical Review and Assessment of Published Research on Dioxins and Related Compounds in Avian Wildlife - Field Studies. External Review Draft. National Center for Environmental Assessment, Office of Research and Development,Cincinnati, OH.
U.S. EPA. 2002. Dose-Response Assessment from Published Research of the Toxicityof 2,3,7,8-Tetrachlorodibenzo-p-dioxin and Related Compounds to Aquatic Wildlife -Laboratory Studies. National Center for Environmental Assessment, Office of Researchand Development, Cincinnati, OH. EPA/600/R-02/095.
Valoppi, L., M. Petreas, R. M. Donahoe, L. Sullivan, and C. A. Callahan. 1999. Use ofPCB congener and homologue analysis in ecological risk assessment. In: Environmental Toxicology and Risk Assessment: Recent Achievements inEnvironmental Fate and Transport: Ninth Volume, ASTM STP 1381, F.T. Prive, K.V.Brix, and N.K. Lane, Ed. American Society for Testing and Materials, WestConshohocken, PA.
van den Berg, M., L. Birnbaum, A.T.C. Bosveld et al. 1998. Toxic equivalency factors(TEFs) for PCBs, PCDDs, PCDFs for humans and wildlife. Environ. Health Perspect.106: 775-792.
39
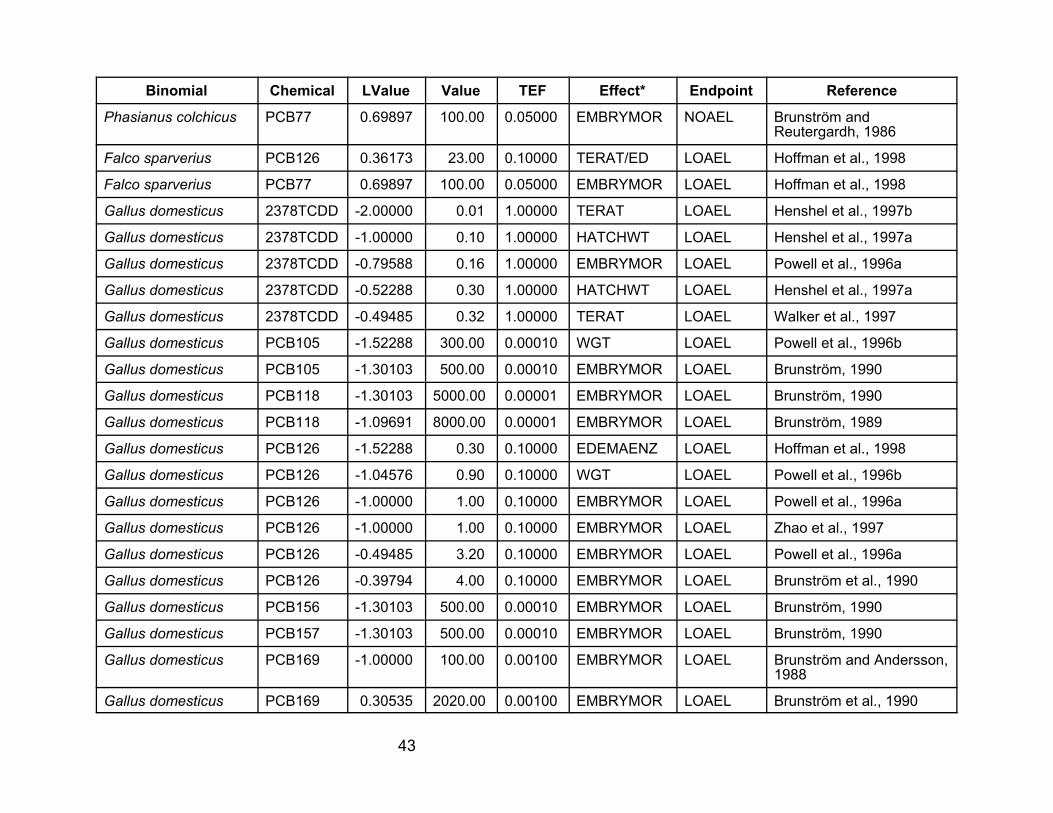
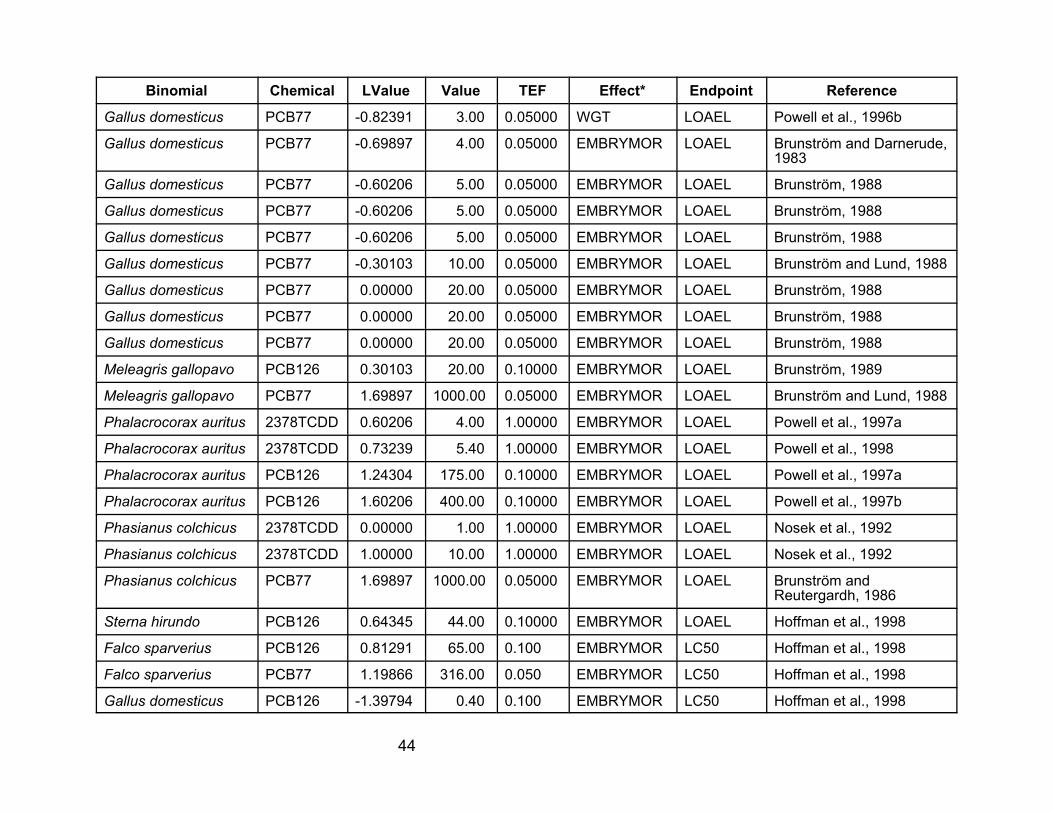
APPENDIX A
Laboratory and Field Data Sets for Effect of Dioxin-Like Chemicals
on Avian Development from In Ovo Exposures
The first two tables in this appendix contain the data used in this report. They
are a subset of the data contained in U.S. EPA (2001, 2002). Those reports also
contain descriptions of the studies. Effects other than mortality (including failure to
hatch) and developmental defects were deleted. For NOAELs and LOAELs, only the
value for the most sensitive response within a study was retained. The full data sets in
Tables A-1 and A-2 are referred to in the text as the developmental effects data. The
mortality data set was obtained by further editing these data sets to remove nonlethal
effects.
40
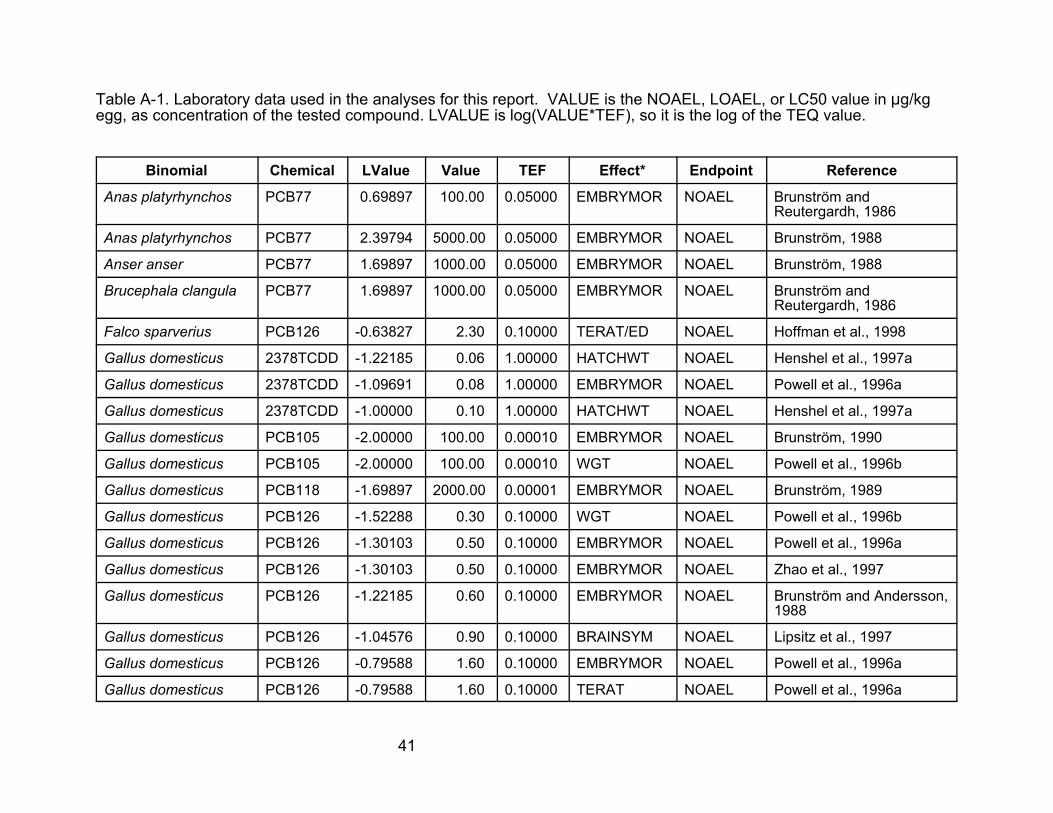
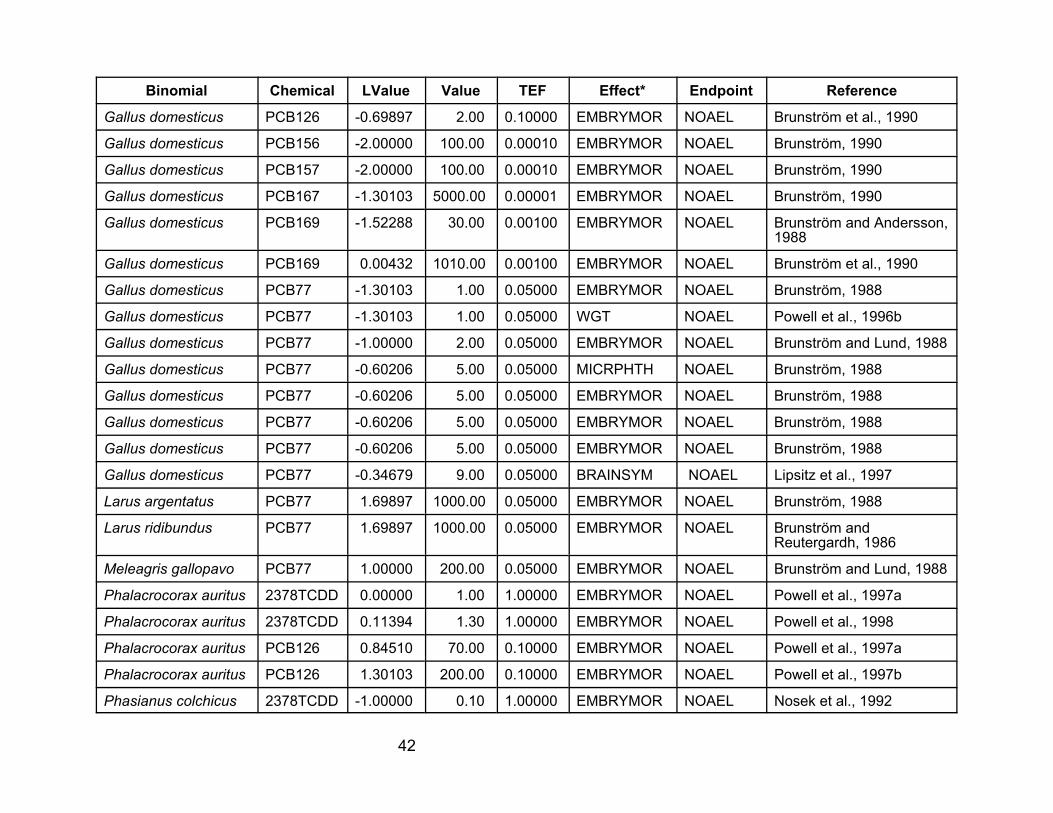
Table A-1. Laboratory data used in the analyses for this report. VALUE is the NOAEL, LOAEL, or LC50 value in :g/kgegg, as concentration of the tested compound. LVALUE is log(VALUE*TEF), so it is the log of the TEQ value.
Binomial
Anas platyrhynchos
Anas platyrhynchos
Anser anser
Brucephala clangula
Falco sparverius
Gallus domesticus
Gallus domesticus
Gallus domesticus
Gallus domesticus
Gallus domesticus
Gallus domesticus
Gallus domesticus
Gallus domesticus
Gallus domesticus
Gallus domesticus
Gallus domesticus
Gallus domesticus
Gallus domesticus
Chemical LValue Value TEF Effect* Endpoint Reference
PCB77 0.69897 100.00 0.05000 EMBRYMOR NOAEL Brunström and Reutergardh, 1986
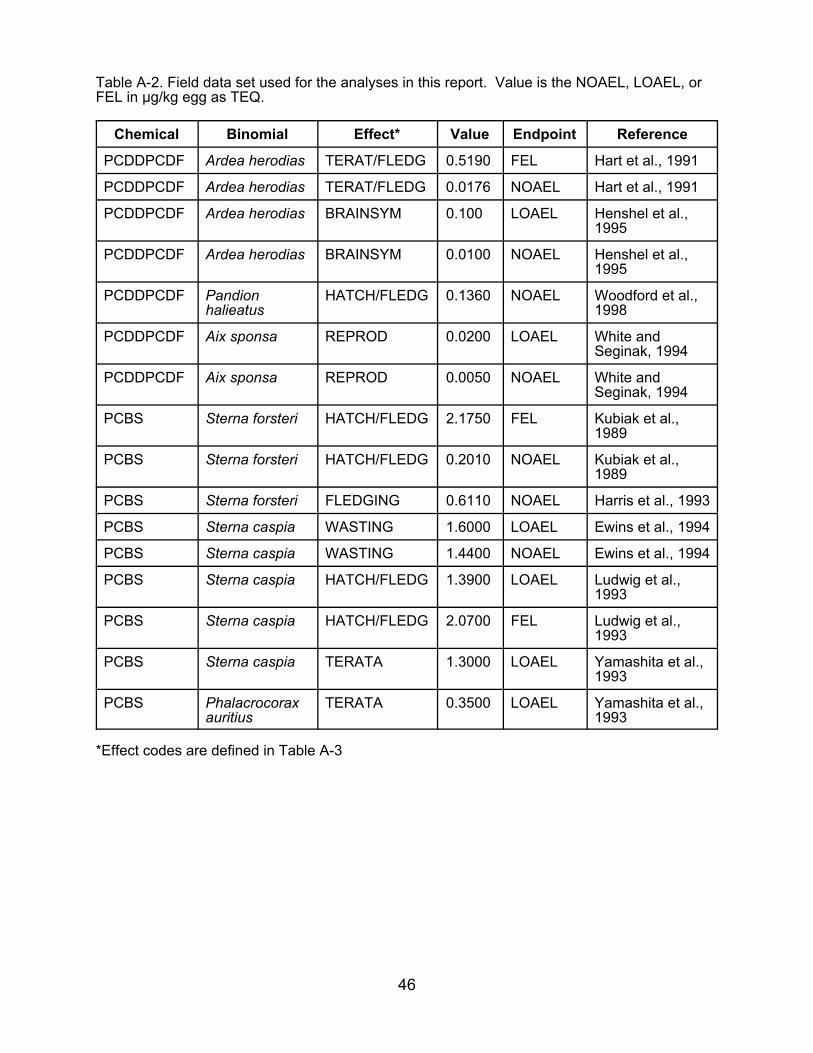
Table A-2. Field data set used for the analyses in this report. Value is the NOAEL, LOAEL, orFEL in :g/kg egg as TEQ.
Chemical Binomial Effect* Value Endpoint Reference
PCDDPCDF Ardea herodias TERAT/FLEDG 0.5190 FEL Hart et al., 1991
PCDDPCDF Ardea herodias TERAT/FLEDG 0.0176 NOAEL Hart et al., 1991
PCDDPCDF Ardea herodias BRAINSYM 0.100 LOAEL Henshel et al.,1995
PCDDPCDF Ardea herodias BRAINSYM 0.0100 NOAEL Henshel et al.,1995
PCDDPCDF Pandion halieatus
HATCH/FLEDG 0.1360 NOAEL Woodford et al.,1998
PCDDPCDF Aix sponsa REPROD 0.0200 LOAEL White and Seginak, 1994
PCDDPCDF Aix sponsa REPROD 0.0050 NOAEL White and Seginak, 1994
PCBS Sterna forsteri HATCH/FLEDG 2.1750 FEL Kubiak et al.,1989
PCBS Sterna forsteri HATCH/FLEDG 0.2010
PCBS Sterna forsteri FLEDGING 0.6110
PCBS Sterna caspia WASTING 1.6000
NOAEL Kubiak et al.,1989
NOAEL Harris et al., 1993
LOAEL Ewins et al., 1994
PCBS Sterna caspia WASTING 1.4400 NOAEL Ewins et al., 1994
PCBS Sterna caspia HATCH/FLEDG 1.3900 LOAEL Ludwig et al.,1993
PCBS Sterna caspia HATCH/FLEDG 2.0700 FEL Ludwig et al.,1993
PCBS Sterna caspia TERATA 1.3000 LOAEL Yamashita et al.,1993
PCBS Phalacrocorax auritius
TERATA 0.3500 LOAEL Yamashita et al.,1993
*Effect codes are defined in Table A-3
46
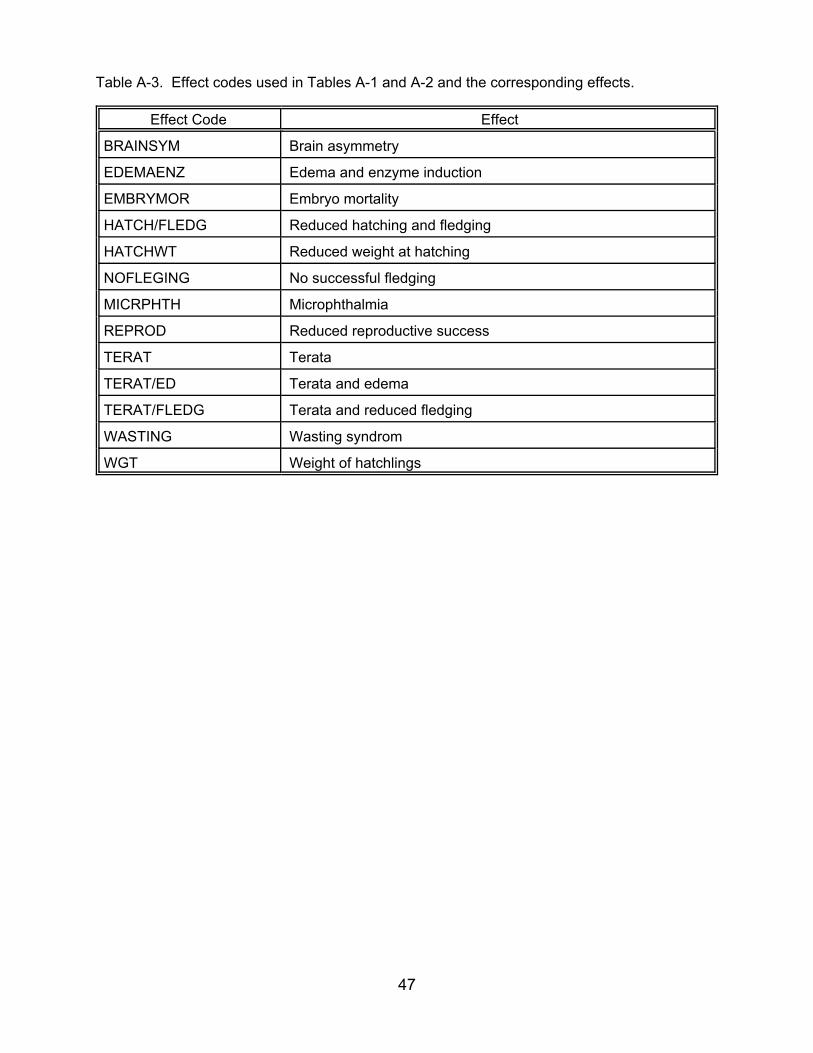
Table A-3. Effect codes used in Tables A-1 and A-2 and the corresponding effects.
Effect Code Effect
BRAINSYM Brain asymmetry
EDEMAENZ Edema and enzyme induction
EMBRYMOR Embryo mortality
HATCH/FLEDG Reduced hatching and fledging
HATCHWT Reduced weight at hatching
NOFLEGING No successful fledging
MICRPHTH Microphthalmia
REPROD Reduced reproductive success
TERAT Terata
TERAT/ED Terata and edema
TERAT/FLEDG Terata and reduced fledging
WASTING Wasting syndrom
WGT Weight of hatchlings
47
REFERENCES FOR APPENDIX A
Brunström B. 1988. Sensitivity of embryos from duck, goose, herring gull, and variouschicken breeds to 3,3',4,4'-tetrachlorobiphenyl. Poultry Sci. 67(1):52-57.
Brunström, B. 1989. Toxicity of coplanar polychlorinated biphenyls in avian embryos.Chemosphere. 19(1-6): 765-768.
Brunström, B. 1990. Mono-ortho-chlorinated chlorobiphenyls: Toxicity and induction of7-ethoxyresorufin-O-deethylase (EROD) activity in chick embryos. Arch. Toxicol. 64: 188-191.
Brunström, B. and L. Andersson. 1988. Toxicity and 7-ethoxyresorufin-O-deethylase-inducing potency of coplanar polychlorinated biphenyls (PCBs) in chick embryos. Arch. Toxicol. 62: 263-266.
Brunström, B. and P.O. Darnerude. 1983. Toxicity and distribution in chick embryos of3,3',4,4'-tetrachlorobiphenyl injected into the eggs. Toxicol. 27: 103-110.
Brunström, B., and J. Lund. 1988. Differences between chick and turkey embryos insensitivity to 3,3',4,4'-tetrachloro-biphenyl and in concentration/affinity of the hepaticreceptor for 2,3,7,8-tetrachlorodibenzo-p-dioxin. Comp. Biochem. Physiol. C. 91(2):507-512.
Brunström, B. and L. Reutergardh. 1986. Differences in sensitivity of some avianspecies to the embryotoxicity of a PCB, 3,3', 4,4'-tetrachlorobiphenyl, injected into the eggs. Environ. Pollut. (Series A) 42: 37-45.
Brunström, B., L. Anderson, E. Nikolaidis and L. Dencker. 1990. Non-ortho- and monoortho-chlorine-substituted polychlorinated biphenyls – embyrotoxicity and inhibition oflymphocyte development. Chemosphere. 20: 1125-1128.
Ewins, P.J., D.V. Weseloh, R.J. Norstrom, K. Legierse, H.J. Auman and J.P. Ludwig.1994. Caspian terns on the Great Lakes: Organochlorine contamination, reproduction,diet, and population changes 1972-91. Can. Wildl. Serv. Occas. Paper. 85: 1-34.
Harris, H.J., T.C. Erdman, G.T. Ankley and K.B. Lodge. 1993. Measures of reproductive success and polychlorinated biphenyl residues in eggs and chicks ofForster's terns on Green Bay, Lake Michigan, Wisconsin-1988. Arch. Environ. Contam. Toxicol. 25(3): 304-314.
Hart, L.E., K.M. Cheng, P.E. Whitehead et al. 1991. Dioxin contamination and growthand development in great blue heron embryos. J. Toxicol. Environ. Health. 32(3):331-344.
Henshel, D.S., J.W. Martin, R. Norstrom, P. Whitehead, J.D. Steeves and K.M. Cheng.1995. Morphometric abnormalities in brains of great blue heron hatchlings exposed inthe wild to PCDDs. Environ. Health Perspect. 103(Suppl 4): 61-66.
Henshel, D.S., B. Hehn, R. Wagey, M. Vo and J.D. Steeves. 1997a. The relative sensitivity of chicken embryos to yolk- or air-cell-injected 2,3,7,8-tetrachlorodibenzo-p-dioxin. Environ. Toxicol. Chem. 16: 725-732.
48
Henshel, D.S., J.W. Martin and J.C. Dewitt. 1997b. Brain asymmetry as a potentialbiomarker for developmental TCDD intoxication: A dose-response study. Environ. Health Perspect. 105: 718-725.
Hoffman, D.J., M.J. Melancon, P.N. Klein, J.D. Eisemann and J.W. Spann. 1998. Comparative developmental toxicity of planar polychlorinated biphenyl congeners inchickens, American kestrels, and common terns. Environ. Toxicol. Chem. 17: 747-757.
Kubiak, T.J., H.J. Harris, L.M. Smith et al. 1989. Microcontaminants and reproductiveimpairment of the Forster’s tern on Green Bay Lake Michigan–1983. Arch. Environ. Contam. Toxicol. 18: 706-727.
Lipsitz, L., D. Powell, S. Bursian and D. Tanaka, Jr. 1997. Assessment of cerebral hemispheric symmetry in hatchling chickens exposed in ovo to polychlorinated biphenyl congeners. Arch. Environ. Contam. Toxicol. 32: 399-406.
Ludwig, J.P., H.J. Auman, H. Kurita et al. 1993. Caspian tern reproduction in theSaginaw Bay ecosystem following a 100-year flood event. J. Great Lakes Res. 19: 96-108.
Nosek J.A., S.R. Craven, J.R. Sullivan, J.R. Olsen and R.E. Peterson. 1992. Toxicityand reproductive effects of 2,3,7,8-tetrachlorodibenzo-p-dioxin in ring-necked pheasanthens. J. Toxicol. Environ. Health. 35(3): 187-198.
Powell, D.C., R.J. Aulerich, J.C. Meadows et al. 1996a. Effects of 3,3',4,4',5-pentachlorobiphenyl (PCB 126) and 2,3,7,8-tetrachlorodibenzo-p-dioxin (TCDD) injected into the yolks of chicken (Gallus domesticus) eggs prior to incubation.Arch. Environ. Contam. Toxicol. 31: 404-409.
Powell, D.C., R.J. Aulerich, K.L. Stromborg and S.J. Bursian. 1996b. Effects of 3,3',4,4'-tetrachlorobiphenyl, 2,3,3',4,4'-pentachlorobiphenyl, and 3,3',4,4',5-pentacholorobiphenyl on the developing chicken embryo when injected prior toincubation. J. Toxicol. Environ. Health. 49: 319-338.
Powell, D.C., R.J. Aulerich, J.C. Meadows et al. 1997a. Effects of 3,3',4,4',5-pentachlorobiphenyl (PCB 126), 2,3,7,8-tetrachlorodibenzo-p-dioxin (TCDD), or anextract derived from field-collected cormorant eggs injected into double-crestedcormorant (Phalacrocorax auritus) eggs. Environ. Toxicol. Chem. 16: 1450-1455.
Powell, D.C., R.J. Aulerich, J.C. Meadows et al. 1997b. Organochlorine contaminantsin double-crested cormorants from Green Bay Wisconsin: II. Effects of an extract derived from cormorant eggs on the chicken embryo. Arch. Environ. Contam. Toxicol. 32: 316-322.
Powell, D.C., R.J. Aulerich, J.C. Meadows et al. 1998. Effects of 3,3',4,4',5-pentachlorobiphenyl and, 2,3,7,8-tetrachlorodibenzo-p-dioxin injected into the yolks ofdouble-crested cormorant (Phalacrocorax auritus) eggs prior to incubation. Environ. Toxicol. Chem. 17: 2035-2040.
U.S. EPA. 2001. Critical Review and Assessment of Published Research on Dioxins and Related Compounds in Avian Wildlife - Field Studies. External Review Draft. National Center for Environmental Assessment, Office of Research and Development,Cincinnati, OH.
49
U.S. EPA. 2002. Dose-Response Assessment from Published Research of the Toxicityof 2,3,7,8-Tetrachlorodibenzo-p-dioxin and Related Compounds to Aquatic Wildlife -Laboratory Studies. National Center for Environmental Assessment, Office of Researchand Development, Cincinnati, OH. EPA/600/R-02/095.
Walker, M.K., R.S. Pollenz and S.M. Smith. 1997. Expression of the aryl hydrocarbonreceptor (AhR) and AhR nuclear translocator during chick cardiogenesis is consistentwith 2,3,7,8-tetrachlorodibenzo-p-dioxin-induced heart defects. Toxicol. Appl.Pharmacol. 143: 407-419.
White, D.H. and J.T. Seginak. 1994. Dioxins and furans linked to reproductiveimpairment in wood ducks at Bayou Meto, Arkansas. J. Wildl. Manage. 58: 100-106.
Woodford, J. E., W.H. Karasov, M.W. Meyer and L. Chambers. 1998. Impact of2,3,7,8-TCDD exposure on survival, growth, and behavior of ospreys breeding inWisconsin, USA. Environ. Toxicol. Chem. 17(7): 1323-1331.
Yamashita, N., S. Tanabe, J.P. Ludwig, H. Kurita, M.E. Ludwig and R. Tatsukawa.1993. Embryonic abnormalities and organochlorine contamination in Double-crested Cormorants (Phalacrocorax auritus) and Caspian Terns (Hydropogne caspia) from theupper Great Lakes in 1988. Environ. Pollut. 79: 163-173.
Zhao, F., K. Mayura, N. Kocurek et al. 1997. Inhibition of 3,3',4,4',5-pentachlorobiphenyl-induced chicken embryotoxicity by 2,2',4,4',5,5'-hexachlorobiphenyl. Fund. Appl. Toxicol. 35: 1-8.