Hindustan Media Ventures (HMVL) Initial Investment Note 28 th September 2014 Caution: This report is written keeping in mind an investment horizon of 3-5 years. Current Price: `156 Market Cap: `1,142 Cr Our View: BUY
Transcript
Hindustan Media Ventures (HMVL)
Initial Investment Note
28th September 2014
Caution: This report is written keeping in mind an investment horizon of 3-5 years.
Current Price: `156 Market Cap: `1,142 Cr Our View: BUY
Investment Thesis & Company Overview
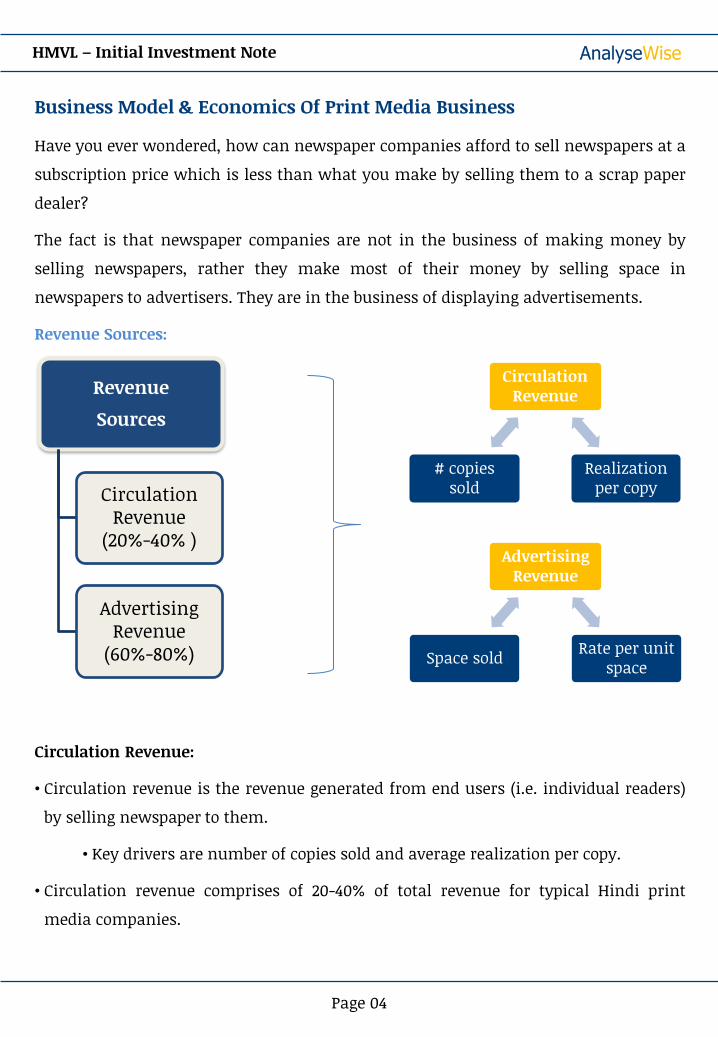
Business Model & Economics Of Print Media Business
Why Hindi Print Media Over English?
Why HMVL In Hindi Print Media?
Challenging Market Price Of HMVL
Summary Of Opportunity & Recommendation
Appendix: Detailed Financials & Shareholding
HMVL – Initial Investment Note 28th September 2014
HMVL – Initial Investment Note
Page 01
Investment Thesis:
Highly profitable business with presence of moat, high earnings growth potential, and a reasonable probability of re-rating.
Dear Clients,
In this period of euphoria, where numerous small and mid cap stocks have doubled /
tripled in the last 6 months and some have even risen 5-10 times, its very easy to fall
into the temptation and join the party.
While the dramatic rise in the prices of some stocks is supported by a great underlying
business with high earnings growth potential and a healthy balance sheet, there are
many stocks with mediocre businesses, poor management, and weak financial profile
who are enjoying a free ride.
Our experience shows that, it is this latter category of mediocre stocks, that do the
maximum damage to an investor’s wealth, when bought at unjustified prices during
general market euphoria such as the one prevailing now.
Thankfully, under such charged market conditions, we have found a business which is
not only sound fundamentally, but also available at attractive valuation.
The company is Hindustan Media Ventures Limited (HMVL), engaged in the business of
publishing Hindi newspaper “Hindustan” and Hindi magazines.
Company Overview:
Hindustan Media Ventures (HMVL) is a part of the HT Media Group (75% ownership in
HMVL). HT Media publishes the English daily “Hindustan Times”, Business daily “Mint”
and also runs the FM radio channel “Fever 104” and job portal “Shine.com”.
Smt. Shobana Bhartia, daughter of the renowned industrialist Mr. K.K Birla is the
promoter / chairman of the HT Media Group and Hindustan Media Ventures.
HMVL was de-merged from HT Media and got listed separately in Jul-10 when it raised
`270 crores by offering 16.27 million primary shares (22.2% stake) at an offer price of
`166, valuing the company at `1,218 crore (67.2x trailing PE).
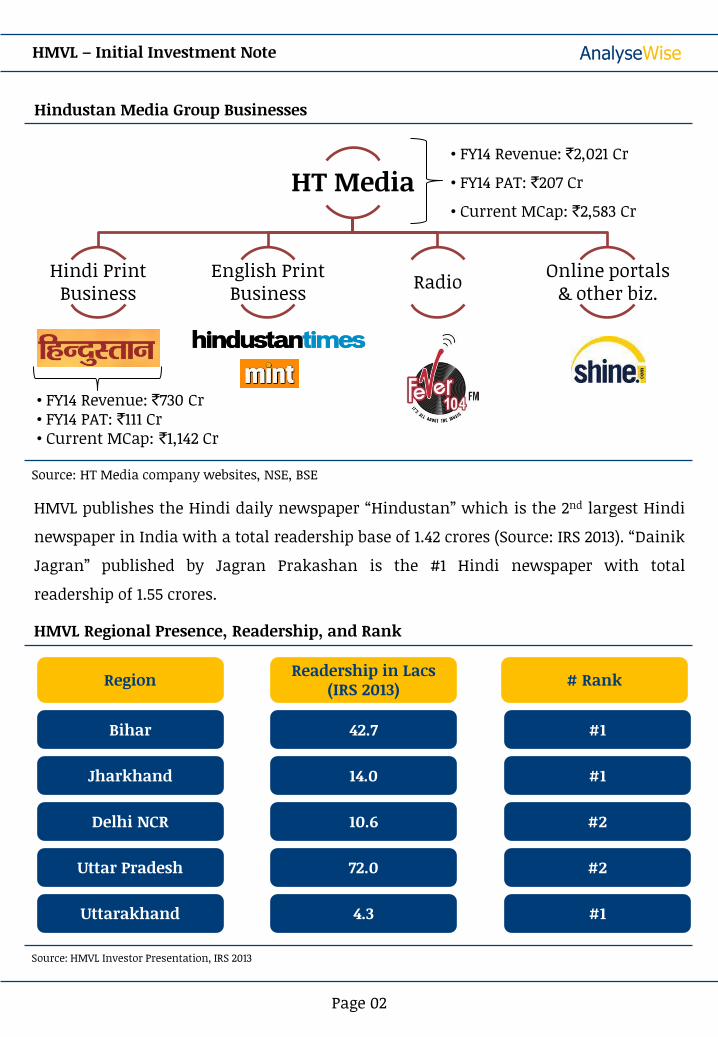
HT Media
Hindi Print Business
English Print Business Radio Online portals
& other biz.
Hindustan Media Group Businesses
Source: HT Media company websites, NSE, BSE
HMVL publishes the Hindi daily newspaper “Hindustan” which is the 2nd largest Hindi
newspaper in India with a total readership base of 1.42 crores (Source: IRS 2013). “Dainik
Jagran” published by Jagran Prakashan is the #1 Hindi newspaper with total
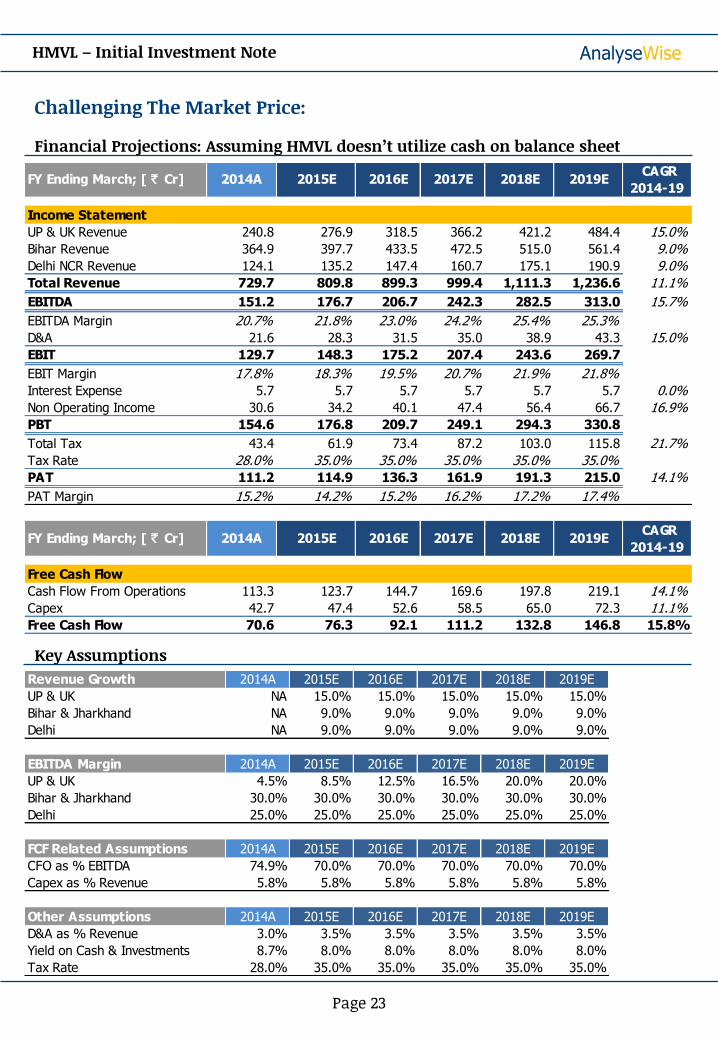
• UP & UK revenues expected to grow at 15% from FY14-19E driven by increase in
advertisement yield as HMVL benefits from latest IRS result. Current yields in UP are
~0.6x times that of former #2 Amar Ujala and ~0.4x times the leader Jagran.
• Bihar, Jharkhand & Delhi NCR being mature markets expected to grow at a
conservative rate of 9%.
• Implied consolidated revenue growth comes at ~11%, although company has indicated
growth closer to 15% for the next few years.
• HMVL has indicated UP & UK EBITDA margins of 10% in FY15 and 20% in FY16. We have
remained conservative and assumed 20% margins will be achieved in FY18. Although,
one may argue about the likeliness of HMVL achieving 20% margins? With the recent
margin expansion in the region and favorable IRS numbers, we believe occurrence is
likely but have assumed a longer timeline as compared to the company.
• EBITDA margins expected to remain stable at 30% in Bihar & Jharkhand and at 25% in
Delhi NCR.
• Yield on cash and investments assumed to be 8% as most of the investments are in
Fixed Maturity Plans and Debt funds. Yield assumed slightly less than historical to
account for potential rate cuts by RBI.
• Effective tax rate assumed at 35% compared to historical rate of 28%. This is because
historically interest income on investments in FMP’s and Debt funds was non-taxable
if yield was less than inflation. But post the recent budget, that criteria only applies if
the instruments are held for more than 3 years. Considering that HMVL is looking for
potential acquisition, it is unlikely that it will tie up the funds for 3 years.
• Cash flow from operations assumed at 70% of EBITDA in line with historical trend.
• Capex assumed in line with historical at 5.8% revenue. Entirely maintenance capex.
• Our projections assume HMVL carries its operations in existing regions and doesn’t
invest in new regions. We also assume that the company doesn’t utilize the cash on
the balance sheet and invests them in debt funds as done historically.
HMVL – Initial Investment Note
Page 24
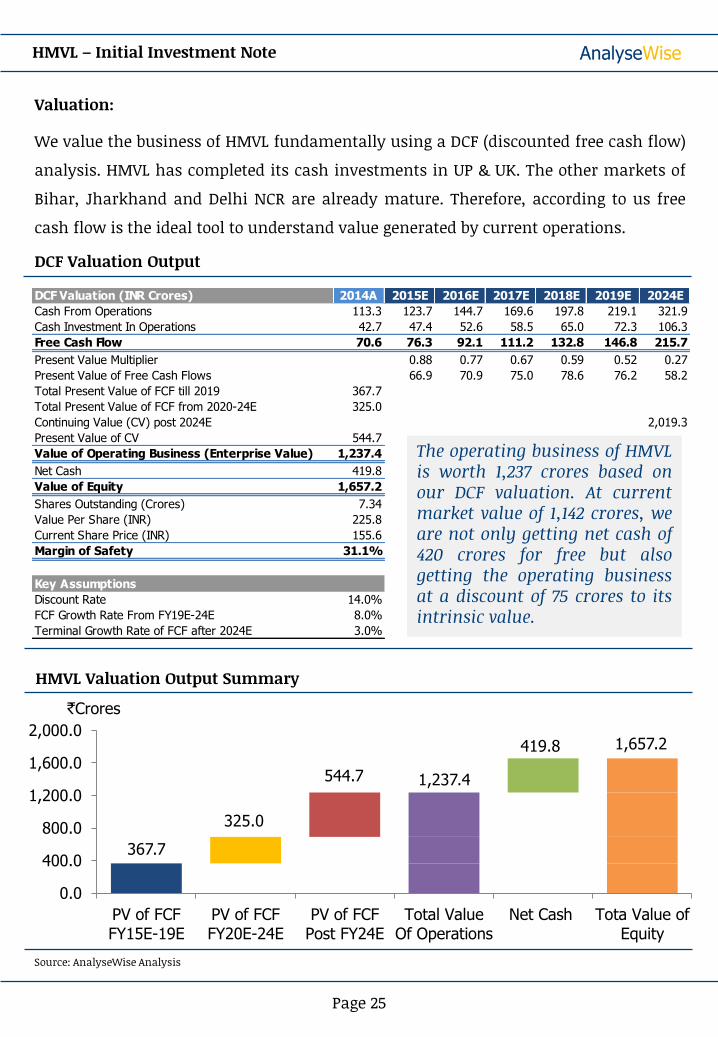
Valuation:
We value the business of HMVL fundamentally using a DCF (discounted free cash flow)
analysis. HMVL has completed its cash investments in UP & UK. The other markets of
Bihar, Jharkhand and Delhi NCR are already mature. Therefore, according to us free
cash flow is the ideal tool to understand value generated by current operations.
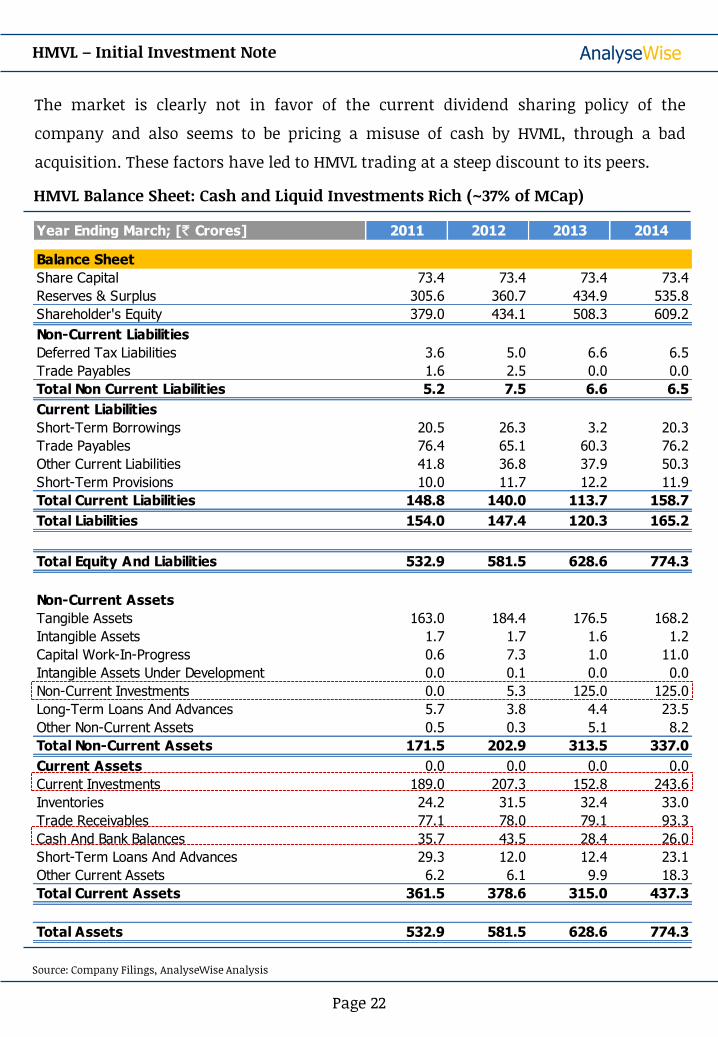
The operating business of HMVL is worth 1,237 crores based on our DCF valuation. At current market value of 1,142 crores, we are not only getting net cash of 420 crores for free but also getting the operating business at a discount of 75 crores to its intrinsic value.
Present Value Multiplier 0.88 0.77 0.67 0.59 0.52 0.27
Present Value of Free Cash Flows 66.9 70.9 75.0 78.6 76.2 58.2
Total Present Value of FCF till 2019 367.7
Total Present Value of FCF from 2020-24E 325.0
Continuing Value (CV) post 2024E 2,019.3
Present Value of CV 544.7
Value of Operating Business (Enterprise Value) 1,237.4
Net Cash 419.8
Value of Equity 1,657.2
Shares Outstanding (Crores) 7.34
Value Per Share (INR) 225.8
Current Share Price (INR) 155.6
Margin of Safety 31.1%
Key Assumptions
Discount Rate 14.0%
FCF Growth Rate From FY19E-24E 8.0%
Terminal Growth Rate of FCF after 2024E 3.0%
0.0
400.0
800.0
1,200.0
1,600.0
2,000.0
PV of FCFFY15E-19E
PV of FCFFY20E-24E
PV of FCFPost FY24E
Total ValueOf Operations
Net Cash Tota Value ofEquity
HMVL Valuation Output Summary
Source: AnalyseWise Analysis
`Crores
367.7
325.0
544.7 1,237.4
419.8 1,657.2
Note to Clients:
Margin of safety is not the same as the potential upside in the stock. In HMVL’s case
the margin of safety is 31.1% which means that even if the intrinsic value of the stock
falls by ~31% due to lower FCF than expected, we would not have overpaid for the stock.
So 31% is the cushion we have for unforeseen business slowdown or any other value
destroying factor.
Conversely it means that there is a potential upside of 45.1% as the current price
becomes equal to the intrinsic value of `225.8. Once the stock reaches the intrinsic
value , we can expect a return equal to the discount rate which we have used that is
14%.
So the total return will come from two sources: a. closing of gap between market price
and intrinsic value and b. increase in intrinsic value as the business grows in the
future which we assume to be 14% (discount rate which we have used).
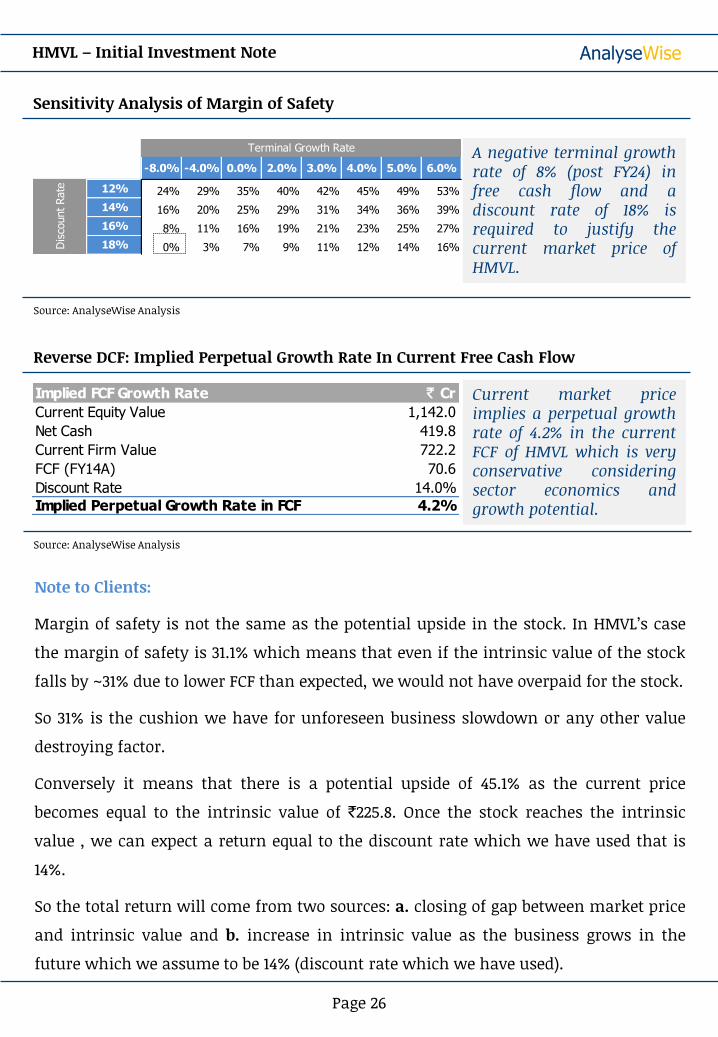
Sensitivity Analysis of Margin of Safety
A negative terminal growth rate of 8% (post FY24) in free cash flow and a discount rate of 18% is required to justify the current market price of HMVL.
HMVL – Initial Investment Note
Page 26
31.1% -8.0% -4.0% 0.0% 2.0% 3.0% 4.0% 5.0% 6.0%
12% 24% 29% 35% 40% 42% 45% 49% 53%
14% 16% 20% 25% 29% 31% 34% 36% 39%
16% 8% 11% 16% 19% 21% 23% 25% 27%
18% 0% 3% 7% 9% 11% 12% 14% 16%Dis
count Rate
Terminal Growth Rate
Source: AnalyseWise Analysis
Reverse DCF: Implied Perpetual Growth Rate In Current Free Cash Flow
Implied FCF Growth Rate ` Cr
Current Equity Value 1,142.0
Net Cash 419.8
Current Firm Value 722.2
FCF (FY14A) 70.6
Discount Rate 14.0%
Implied Perpetual Growth Rate in FCF 4.2%
Current market price implies a perpetual growth rate of 4.2% in the current FCF of HMVL which is very conservative considering sector economics and growth potential.
Source: AnalyseWise Analysis
0.0
200.0
400.0
600.0
Current SharePrice
DifferenceBetween Value
and Price
Intrinsic Value Increase InIntrinsic ValueDuring Next 5
Years
Intrinsic ValueAfter 5 Years
HMVL – Initial Investment Note
Page 27
Summary Of Expected Return
Price `
155.6 70.2 225.8
209.0 434.8
Expected return of 23% for a holding period of 5 years
Rate of increase in intrinsic value assumed equal to discount rate of 14%
Upside of 45% due to closing of gap between market price and intrinsic value
Summary of DCF Valuation and our thoughts on current price:
• We arrive at an intrinsic value of `226 per share compared to current price of `156 per
share. Current price is at a discount of 31% to intrinsic value.
• As a sanity check, our intrinsic value of `226 per share implies a PE of 14.9x based on
FY14A EPS compared to a PE of 18-20x for peers of HMVL.
• Core operating business of HMVL is worth `1,237 Crores.
• Therefore, at current market cap of `1,142 Crores, we are not only getting cash and
investments worth `420 Crores for free but also getting the operating business at a
discount of `88 Crores.
• Reverse DCF indicates that the market is incorporating a perpetual growth rate of
4.2% in FY14 FCF, which according to us is highly conservative.
• At the current price, market is discounting a worst case scenario in terms of cash
utilization. Any ways we are not paying anything for the cash held by HMVL.
Source: AnalyseWise Analysis
Key Risks:
• Inability to maintain margins in its leading markets: DB Corp has entered Bihar
through its Patna edition launched in Jan-14 which will increase competitive
intensity. According to HMVL, advertisement revenues in Bihar come primarily from
the state government for which a newspaper needs to have a pan state presence.
HMVL feels it will take a while for DB Corp to establish pan Bihar presence and
become a genuine threat. Meanwhile HMVL has cut its cover price in Patna to fend off
the competition. To the credit of HMVL, it has successfully tackled similar
competition from DB Corp and Jagran Prakashan in the past in Jharkhand.
• Slower traction in Uttar Pradesh: Inability to increase advertisement yields in UP
and UK leading to slower or no margin expansion.
• Emergence of geo-targeted advertising technology on television where the same
channel can broadcast different advertisements in different locations in which it is
being watched. For e.g. Zee Cinema in Maharashtra and Uttar Pradesh may air
different ads at the same time. We feel that newspapers offer a different proposition
to advertisers compared to television. Also, this technology is yet to gain traction and
if it does pose threat to the business of newspapers, it wont happen overnight. There
will be enough time to monitor the developments and take appropriate action (like
selling the stock) before a lot of damage if done.
• Grossly overpaying for an acquisition leading to destruction of value.
HMVL – Initial Investment Note
Page 28
HMVL – Initial Investment Note
Investment Thesis & Company Overview
Business Model & Economics Of Print Media Business
Why Hindi Print Media Over English?
Why HMVL In Hindi Print Media?
Challenging Market Price Of HMVL
Summary Of Opportunity & Recommendation
Appendix: Detailed Financials & Shareholding
28th September 2014
Summary of opportunity
• HMVL is a stable asset engaged in Hindi newspaper business available at an
attractive valuation due to lack of clarity on the use of huge pile of cash on its
balance sheet (cash and equivalents account for 37% of market cap)
• The company possesses moat characteristics and is expected to grow its earnings by
~14% in the next 5 years. Growth driven primarily from Uttar Pradesh and
Uttarakhand which are its newer markets.
• Trades at only 10x PE compared to 17-20x for peers.
• High probability of re-rating if it utilizes cash prudently through a smart acquisition
or distributes it to shareholders via dividends.
• The company can’t do a buyback as promoters ownership is at the maximum
permissible limit of 75%.
Recommendation:
• We recommend our clients to buy “Hindustan Media Ventures” at the current
market price of `156.
• Current market price offers a margin of safety of 31% based on our DCF valuation.
• Our clients can expect a return of ~23% excluding dividends over a period of 5 years.
• Possibility of further upside if company prudently uses cash which will lead to re-
rating of the stock by the market.
• More importantly, the downside risk at the current price is very limited.
HMVL – Initial Investment Note
Page 29
HMVL – Initial Investment Note
Investment Thesis & Company Overview
Business Model & Economics Of Print Media Business
Why Hindi Print Media Over English?
Why HMVL In Hindi Print Media?
Challenging Market Price Of HMVL
Summary Of Opportunity & Recommendation
Appendix: Detailed Financials & Shareholding
28th September 2014
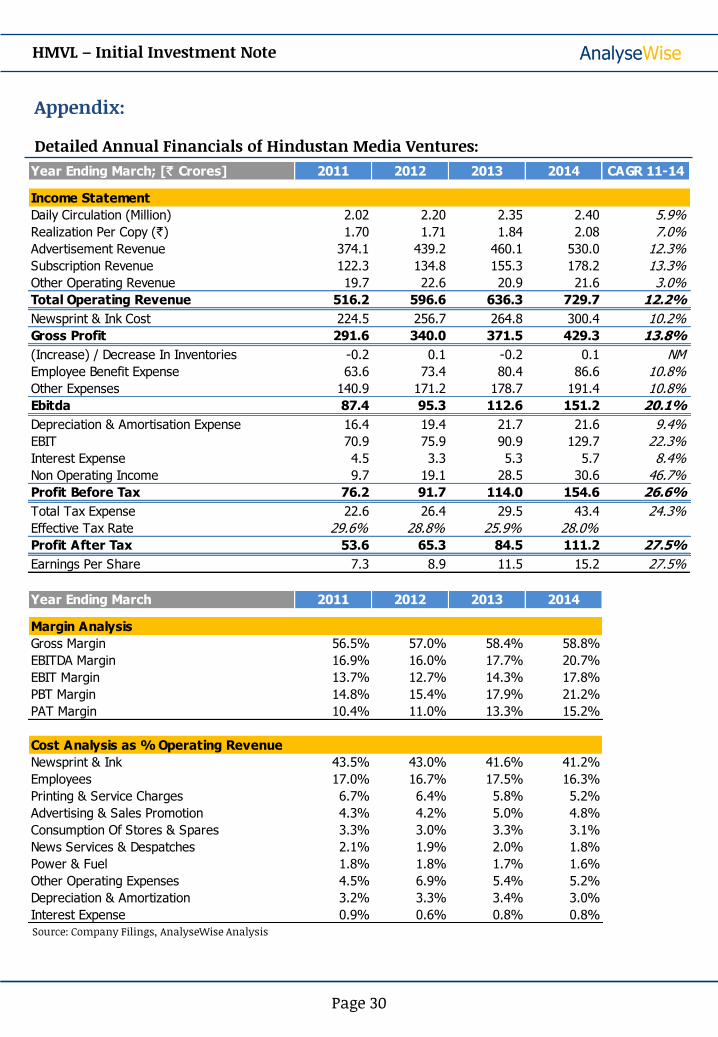
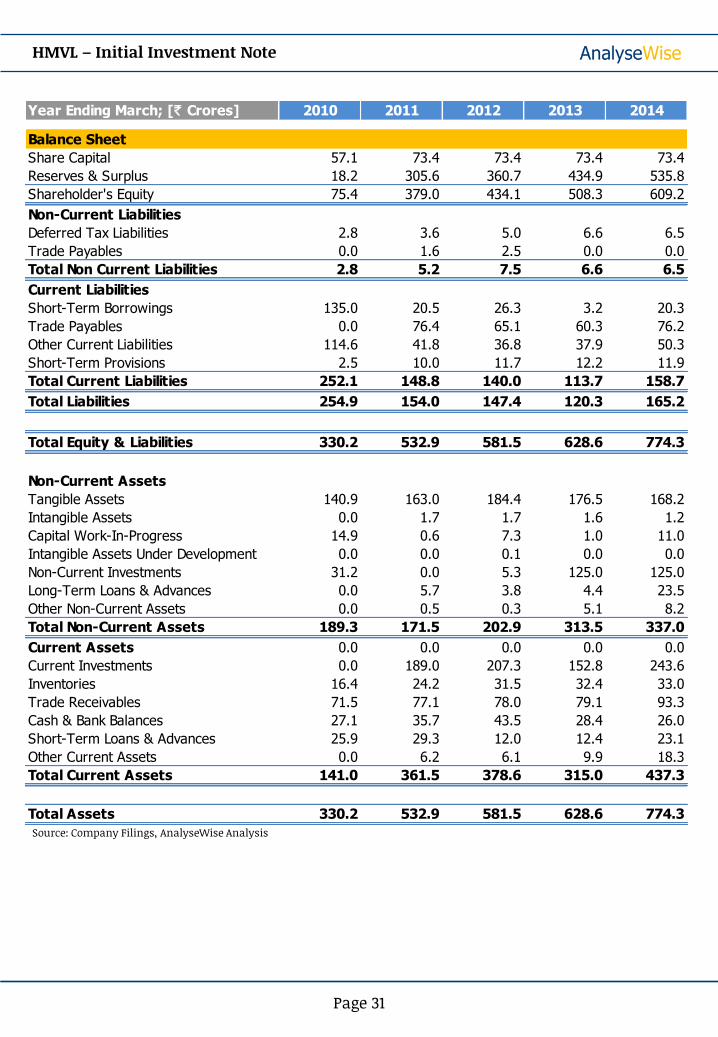
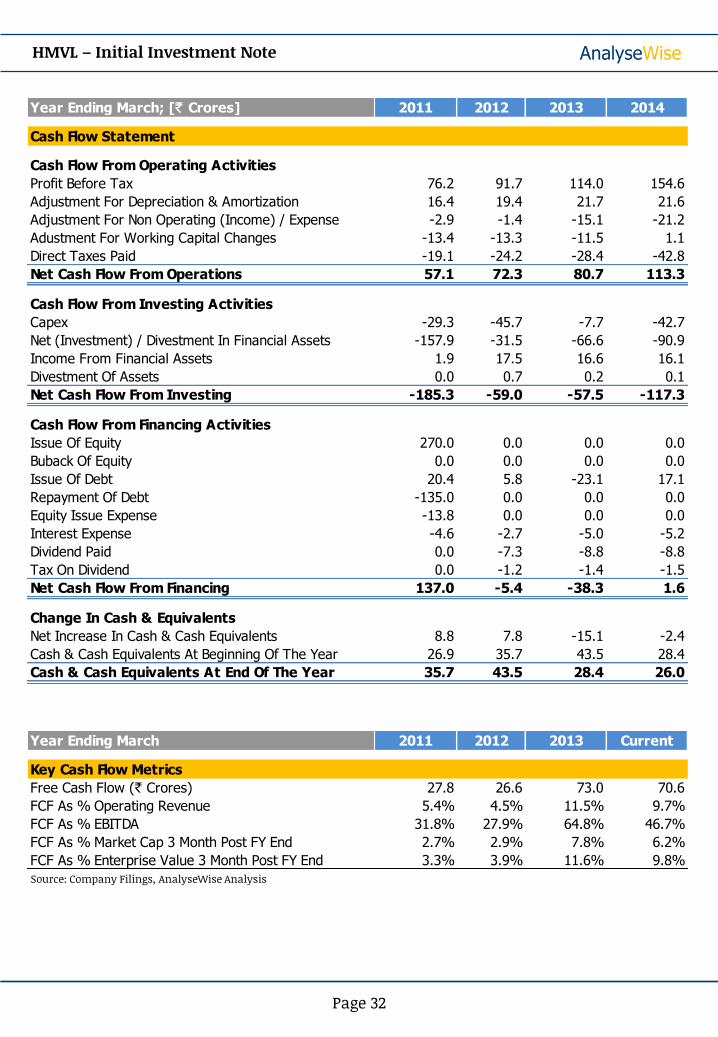
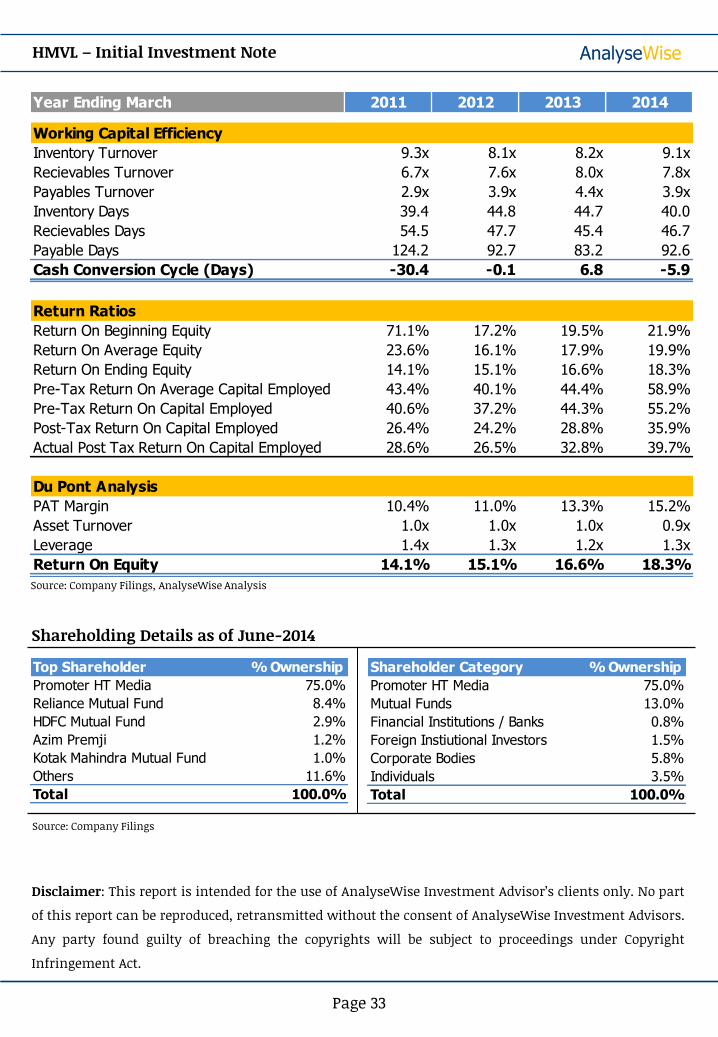
Appendix:
Detailed Annual Financials of Hindustan Media Ventures: