1
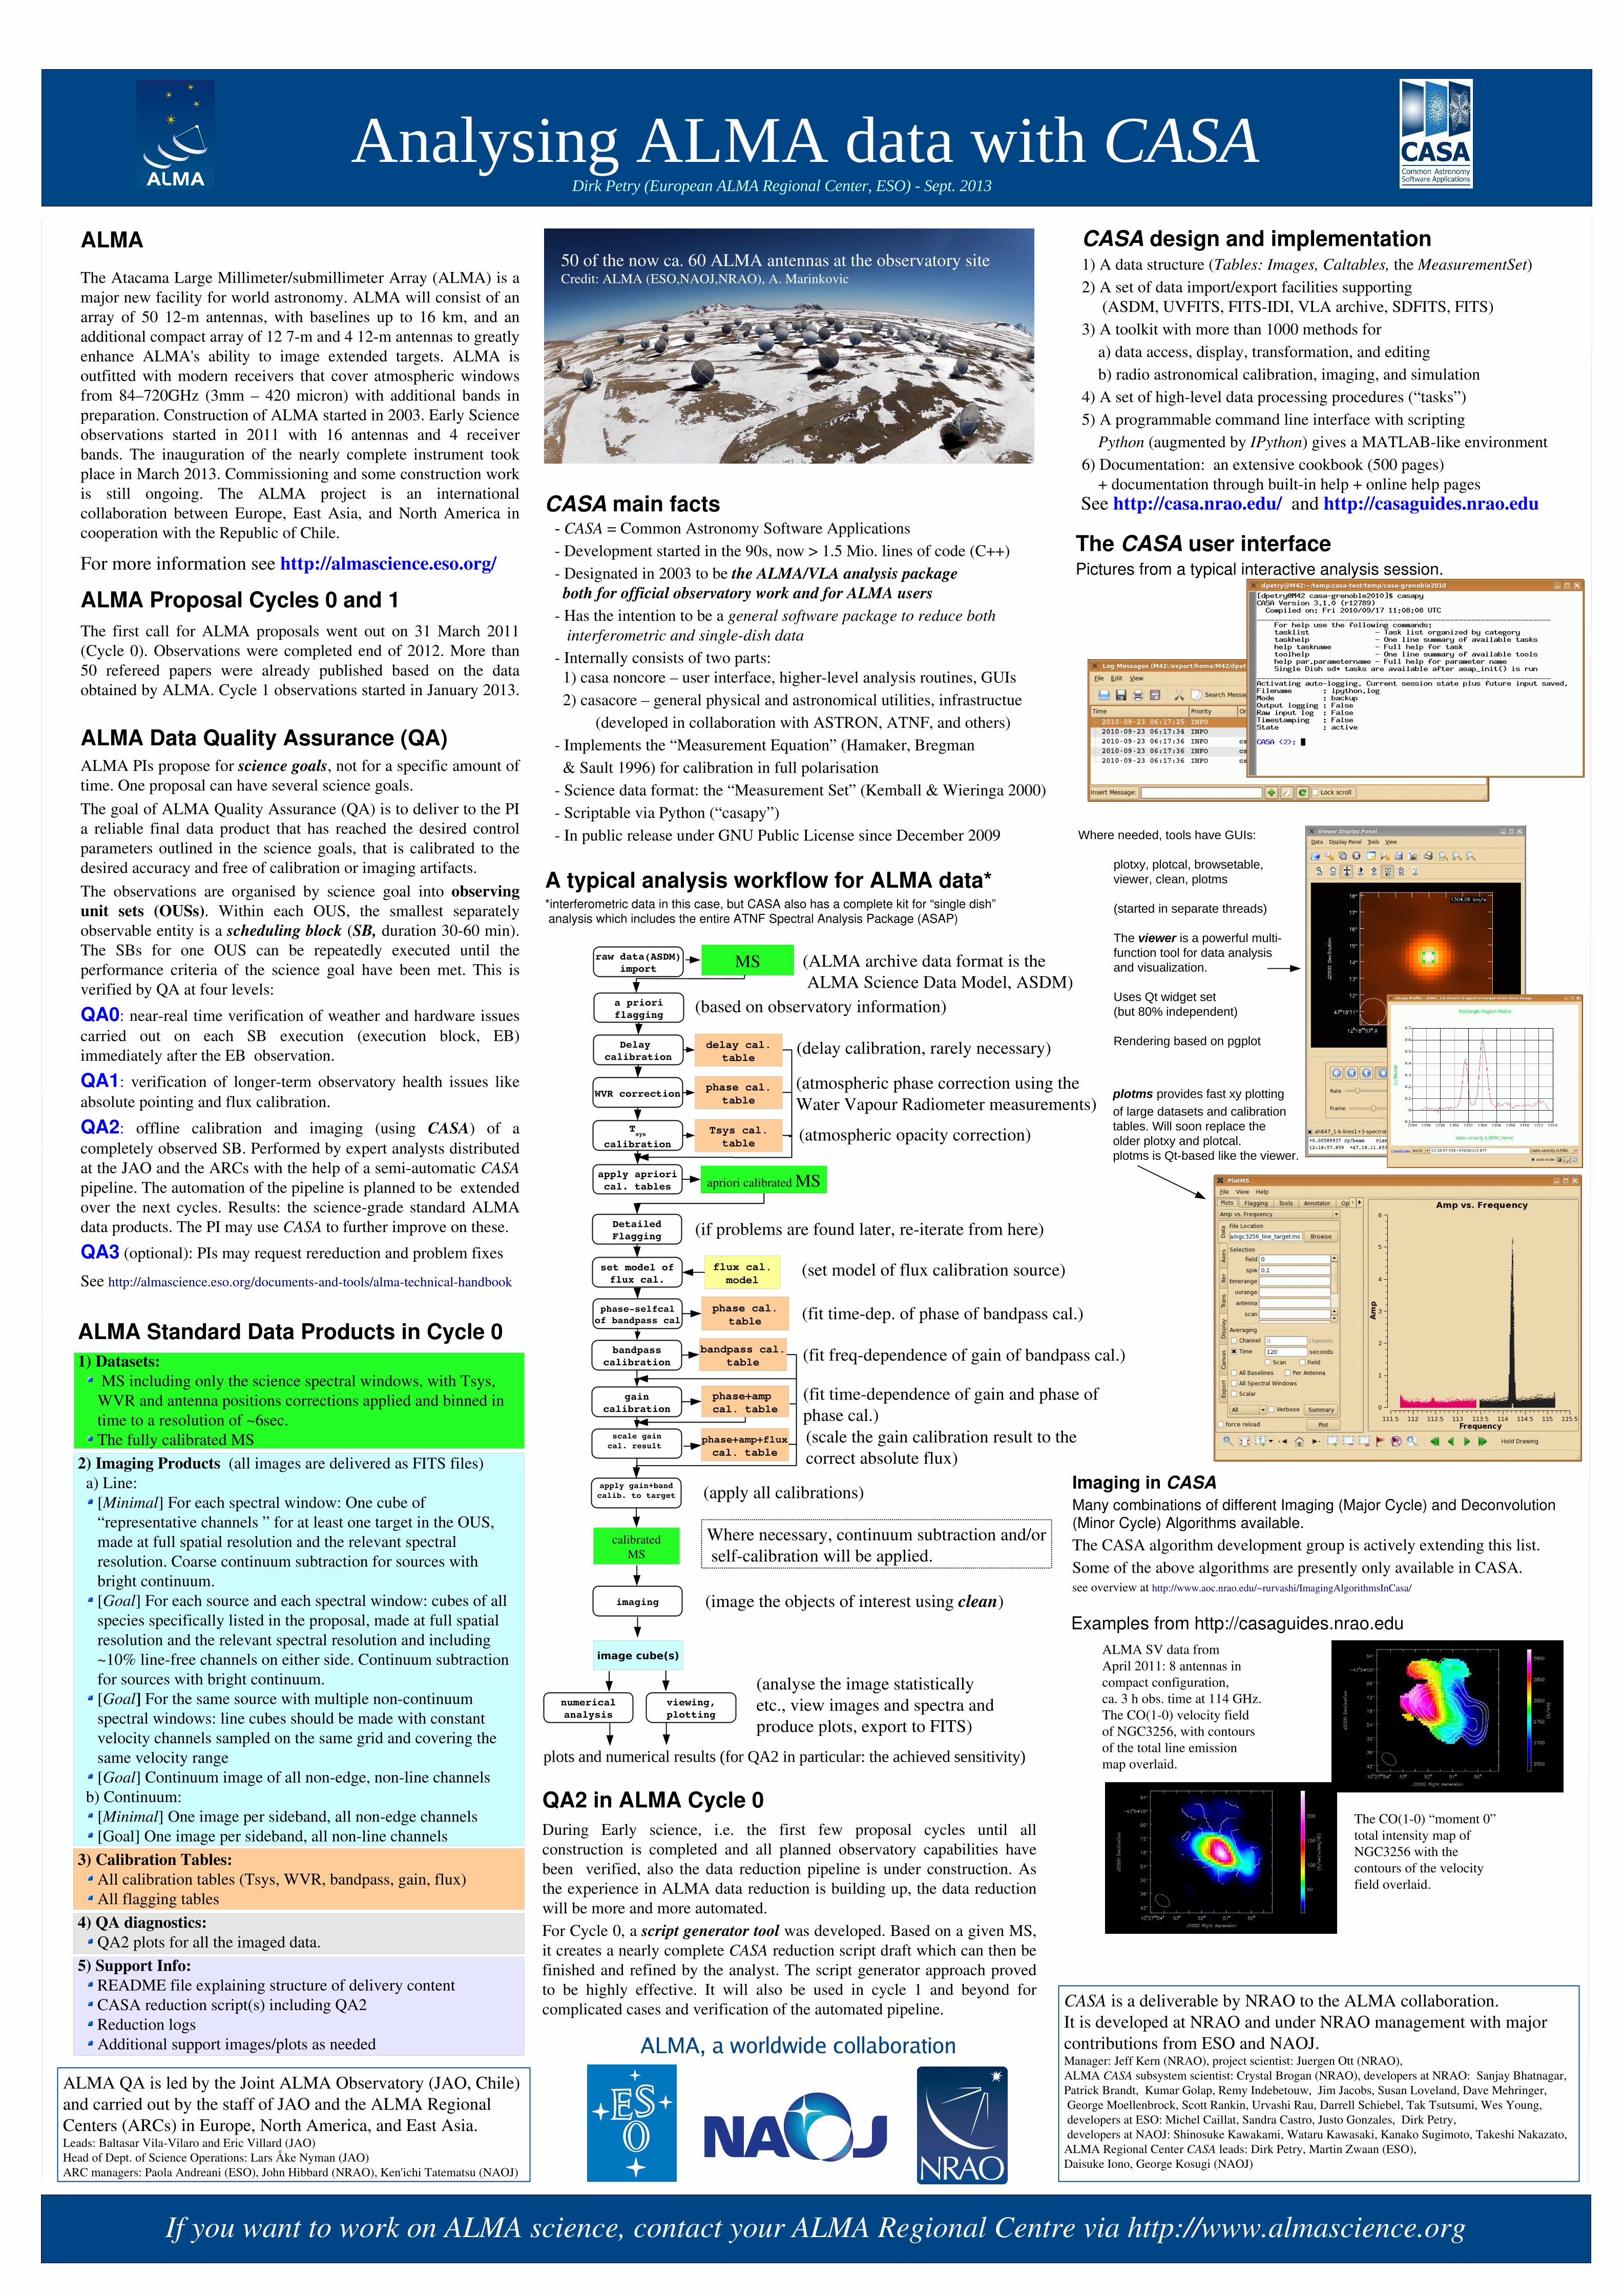
If you want to work on ALMA science, contact your ALMA Regional Centre via http://www.almascience.org Analysing ALMA data with CASA CASA main facts - CASA = Common Astronomy Software Applications - Development started in the 90s, now > 1.5 Mio. lines of code (C++) - Designated in 2003 to be the ALMA/VLA analysis package both for official observatory work and for ALMA users - Has the intention to be a general software package to reduce both interferometric and single-dish data - Internally consists of two parts: 1) casa noncore – user interface, higher-level analysis routines, GUIs 2) casacore – general physical and astronomical utilities, infrastructue (developed in collaboration with ASTRON, ATNF, and others) - Implements the “Measurement Equation” (Hamaker, Bregman & Sault 1996) for calibration in full polarisation - Science data format: the “Measurement Set” (Kemball & Wieringa 2000) - Scriptable via Python (“casapy”) - In public release under GNU Public License since December 2009 ALMA, a worldwide collaboration ALMA The Atacama Large Millimeter/submillimeter Array (ALMA) is a major new facility for world astronomy. ALMA will consist of an array of 50 12-m antennas, with baselines up to 16 km, and an additional compact array of 12 7-m and 4 12-m antennas to greatly enhance ALMA's ability to image extended targets. ALMA is outfitted with modern receivers that cover atmospheric windows from 84–720GHz (3mm – 420 micron) with additional bands in preparation. Construction of ALMA started in 2003. Early Science observations started in 2011 with 16 antennas and 4 receiver bands. The inauguration of the nearly complete instrument took place in March 2013. Commissioning and some construction work is still ongoing. The ALMA project is an international collaboration between Europe, East Asia, and North America in cooperation with the Republic of Chile. For more information see http://almascience.eso.org/ ALMA Proposal Cycles 0 and 1 The first call for ALMA proposals went out on 31 March 2011 (Cycle 0). Observations were completed end of 2012. More than 50 refereed papers were already published based on the data obtained by ALMA. Cycle 1 observations started in January 2013. CASA design and implementation 1) A data structure (Tables: Images, Caltables, the MeasurementSet) 2) A set of data import/export facilities supporting (ASDM, UVFITS, FITS-IDI, VLA archive, SDFITS, FITS) 3) A toolkit with more than 1000 methods for a) data access, display, transformation, and editing b) radio astronomical calibration, imaging, and simulation 4) A set of high-level data processing procedures (“tasks”) 5) A programmable command line interface with scripting Python (augmented by IPython) gives a MATLAB-like environment 6) Documentation: an extensive cookbook (500 pages) + documentation through built-in help + online help pages A typical analysis workflow for ALMA data* *interferometric data in this case, but CASA also has a complete kit for “single dish” analysis which includes the entire ATNF Spectral Analysis Package (ASAP) T sys calibration imaging image cube(s) viewing, plotting numerical analysis plots and numerical results (for QA2 in particular: the achieved sensitivity) 50 of the now ca. 60 ALMA antennas at the observatory site Credit: ALMA (ESO,NAOJ,NRAO), A. Marinkovic WVR correction Delay calibration MS raw data(ASDM) import a priori flagging (based on observatory information) Detailed Flagging phase-selfcal of bandpass cal bandpass calibration set model of flux cal. gain calibration flux cal. model delay cal. table bandpass cal. table phase+amp cal. table calibrated MS apply gain+band calib. to target scale gain cal. result phase+amp+flux cal. table (fit time-dep. of phase of bandpass cal.) (delay calibration, rarely necessary) (atmospheric phase correction using the Water Vapour Radiometer measurements) (atmospheric opacity correction) (if problems are found later, re-iterate from here) (set model of flux calibration source) (fit time-dependence of gain and phase of phase cal.) (scale the gain calibration result to the correct absolute flux) (apply all calibrations) (analyse the image statistically etc., view images and spectra and produce plots, export to FITS) (image the objects of interest using clean) (fit freq-dependence of gain of bandpass cal.) Where necessary, continuum subtraction and/or self-calibration will be applied. The CASA user interface Pictures from a typical interactive analysis session. Where needed, tools have GUIs: plotxy, plotcal, browsetable, viewer, clean, plotms (started in separate threads) The viewer is a powerful multi- function tool for data analysis and visualization. Uses Qt widget set (but 80% independent) Rendering based on pgplot plotms provides fast xy plotting of large datasets and calibration tables. Will soon replace the older plotxy and plotcal. plotms is Qt-based like the viewer. Examples from http://casaguides.nrao.edu ALMA SV data from April 2011: 8 antennas in compact configuration, ca. 3 h obs. time at 114 GHz. The CO(1-0) velocity field of NGC3256, with contours of the total line emission map overlaid. The CO(1-0) “moment 0” total intensity map of NGC3256 with the contours of the velocity field overlaid. Imaging in CASA Many combinations of different Imaging (Major Cycle) and Deconvolution (Minor Cycle) Algorithms available. The CASA algorithm development group is actively extending this list. Some of the above algorithms are presently only available in CASA. see overview at http://www.aoc.nrao.edu/~rurvashi/ImagingAlgorithmsInCasa/ CASA is a deliverable by NRAO to the ALMA collaboration. It is developed at NRAO and under NRAO management with major contributions from ESO and NAOJ. Manager: Jeff Kern (NRAO), project scientist: Juergen Ott (NRAO), ALMA CASA subsystem scientist: Crystal Brogan (NRAO), developers at NRAO: Sanjay Bhatnagar, Patrick Brandt, Kumar Golap, Remy Indebetouw, Jim Jacobs, Susan Loveland, Dave Mehringer, George Moellenbrock, Scott Rankin, Urvashi Rau, Darrell Schiebel, Tak Tsutsumi, Wes Young, developers at ESO: Michel Caillat, Sandra Castro, Justo Gonzales, Dirk Petry, developers at NAOJ: Shinosuke Kawakami, Wataru Kawasaki, Kanako Sugimoto, Takeshi Nakazato, ALMA Regional Center CASA leads: Dirk Petry, Martin Zwaan (ESO), Daisuke Iono, George Kosugi (NAOJ) See http://casa.nrao.edu/ and http://casaguides.nrao.edu ALMA Data Quality Assurance (QA) ALMA PIs propose for science goals, not for a specific amount of time. One proposal can have several science goals. The goal of ALMA Quality Assurance (QA) is to deliver to the PI a reliable final data product that has reached the desired control parameters outlined in the science goals, that is calibrated to the desired accuracy and free of calibration or imaging artifacts. The observations are organised by science goal into observing unit sets (OUSs). Within each OUS, the smallest separately observable entity is a scheduling block (SB, duration 30-60 min). The SBs for one OUS can be repeatedly executed until the performance criteria of the science goal have been met. This is verified by QA at four levels: QA0: near-real time verification of weather and hardware issues carried out on each SB execution (execution block, EB) immediately after the EB observation. QA1: verification of longer-term observatory health issues like absolute pointing and flux calibration. QA2: offline calibration and imaging (using CASA) of a completely observed SB. Performed by expert analysts distributed at the JAO and the ARCs with the help of a semi-automatic CASA pipeline. The automation of the pipeline is planned to be extended over the next cycles. Results: the science-grade standard ALMA data products. The PI may use CASA to further improve on these. QA3 (optional): PIs may request rereduction and problem fixes See http://almascience.eso.org/documents-and-tools/alma-technical-handbook Dirk Petry (European ALMA Regional Center, ESO) - Sept. 2013 QA2 in ALMA Cycle 0 During Early science, i.e. the first few proposal cycles until all construction is completed and all planned observatory capabilities have been verified, also the data reduction pipeline is under construction. As the experience in ALMA data reduction is building up, the data reduction will be more and more automated. For Cycle 0, a script generator tool was developed. Based on a given MS, it creates a nearly complete CASA reduction script draft which can then be finished and refined by the analyst. The script generator approach proved to be highly effective. It will also be used in cycle 1 and beyond for complicated cases and verification of the automated pipeline. ALMA QA is led by the Joint ALMA Observatory (JAO, Chile) and carried out by the staff of JAO and the ALMA Regional Centers (ARCs) in Europe, North America, and East Asia. Leads: Baltasar Vila-Vilaro and Eric Villard (JAO) Head of Dept. of Science Operations: Lars Åke Nyman (JAO) ARC managers: Paola Andreani (ESO), John Hibbard (NRAO), Ken'ichi Tatematsu (NAOJ) phase cal. table apriori calibrated MS apply apriori cal. tables Tsys cal. table phase cal. table (ALMA archive data format is the ALMA Science Data Model, ASDM) ALMA Standard Data Products in Cycle 0 1) Datasets: MS including only the science spectral windows, with Tsys, WVR and antenna positions corrections applied and binned in time to a resolution of ~6sec. The fully calibrated MS 2) Imaging Products (all images are delivered as FITS files) a) Line: [Minimal] For each spectral window: One cube of “representative channels ” for at least one target in the OUS, made at full spatial resolution and the relevant spectral resolution. Coarse continuum subtraction for sources with bright continuum. [Goal] For each source and each spectral window: cubes of all species specifically listed in the proposal, made at full spatial resolution and the relevant spectral resolution and including ~10% line-free channels on either side. Continuum subtraction for sources with bright continuum. [Goal] For the same source with multiple non-continuum spectral windows: line cubes should be made with constant velocity channels sampled on the same grid and covering the same velocity range [Goal] Continuum image of all non-edge, non-line channels b) Continuum: [Minimal] One image per sideband, all non-edge channels [Goal] One image per sideband, all non-line channels 3) Calibration Tables: All calibration tables (Tsys, WVR, bandpass, gain, flux) All flagging tables 4) QA diagnostics: QA2 plots for all the imaged data. 5) Support Info: README file explaining structure of delivery content CASA reduction script(s) including QA2 Reduction logs Additional support images/plots as needed