25
ukdataservice.ac.uk Analysing change over time: repeated cross sectional and longitudinal survey data
ukdataservice.ac.uk
Analysing change over time: repeated cross sectional and longitudinal survey data
Analysing


UK Data Service – Analysing change over time: repeated cross sectional and longitudinal survey data
2. UK Data Service data for analysing change over time
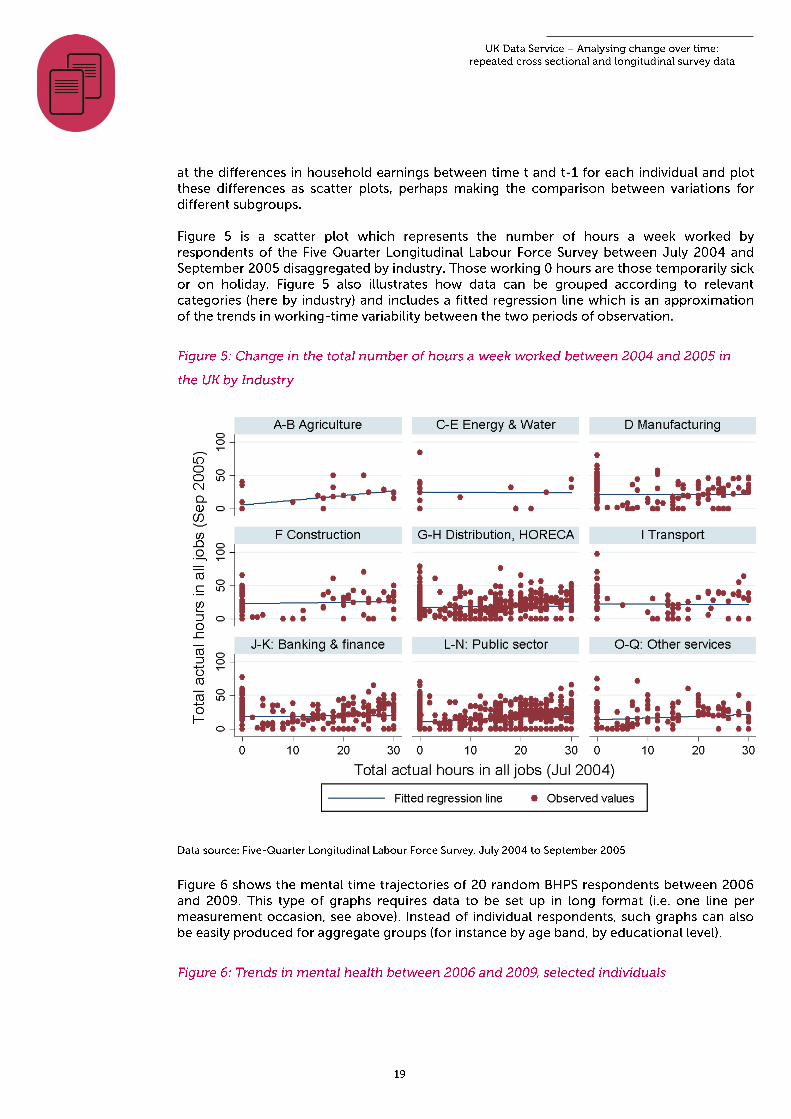
There are three main types of survey microdata available from the UK Data Service which can be used for analysing change over time1. Microdata are individual or household level data (as opposed to data aggregated by region or country). The three main types are: Repeated cross-sectional survey data: data in which the same (or similar) information is
asked to a different sample of individuals each time - the samples can then be compared over time
Longitudinal survey data: data in which the same information is asked of the same group
of individuals over time (with new respondents added to maintain numbers)
Retrospective survey data: data in which respondents are asked about their memory of
the past e.g. ‘What was your father’s job when you were 14 years old?’ The following sections outline the main features of these different kinds of data.
2.1 Repeated cross-sectional surveys
Cross-sectional survey data are data for a single point in time. Repeated cross-sectional data are created where a survey is administered to a new sample of interviewees at successive time points. For an annual survey, this means that respondents in one year will be different people to those in a prior year. Such data can either be analysed cross-sectionally, by looking at one survey year, or combined for analysis over time. See Section three for examples of analyses of repeated cross-sectional data. You can find the largest and most commonly used of these datasets in the Key Data section of the UK Data Service website under the UK Surveys tab. Alternatively, you can explore all repeated cross-sectional data in the UK Data Service Data Catalogue by selecting UK Surveys as the Data type.
Example: British Social Attitudes Survey
The British Social Attitudes Survey (BSA) is a repeated cross-sectional survey conducted in most years since 1983. It is designed to provide evidence about attitudes to a range of topics about Britain and the way the country is run. A new sample of respondents is selected every time the survey is run but many of the same questions are asked at each time-point. In this survey, one person in each selected household is interviewed. The individual level data are available to be downloaded from the UK Data Service into a statistics package like SPSS, R or Stata.
Because repeated cross-sectional data take a different sample of a population over time, they are used for analysing population or group changes over time (also known as aggregate 1 The UK Data Service also supplies macrodata which is data aggregated by country or region, and census data, both of which can also be used for examining change over time.

2
UK Data Service – Analysing change over time: repeated cross sectional and longitudinal survey data
change over time). They cannot be used to look at individual change2. By aggregate change, we refer to changes for population groups. If representative samples are present in consecutive years of a survey, we can compare changes in the behaviour or circumstances of different groups. For example, we can draw conclusions on how levels of smoking for men and women have changed over time. However, we cannot deduce how smoking behaviour for a given individual has changed over time, as different people form our sample in different years3.
2.2 Longitudinal survey data
Longitudinal studies involve information directly gathered in a survey of households or individuals. Surveys following individual persons over time can be of two types, panel data or cohort data. There are a number of studies of these kinds in the UK4.
2.2.1 Panel surveys
In panel surveys, the same individuals are interviewed at multiple time points, referred to as waves. Respondents interviewed at wave one of a survey are interviewed again at wave two, and wave 3, and so forth. Reflecting both the cross-sectional (between individuals) and time-series elements, panel data are also referred to as ‘cross-sectional time-series’ data. Household panel surveys rely on an initial random sample of households or individuals which is randomly selected and subsequently followed over time, with or without households being replaced as they drop out of the sample. You can find the largest and most commonly used of these datasets in the Key Data section of the UK Data Service website under the Longitudinal studies tab or explore all longitudinal data in the UK Data Service Data Catalogue by selecting ‘Cohort and longitudinal studies’ as the Data type.
2 Longitudinal studies are used to analyse change over time – see Section 2.2 for more details. 3 Many repeated cross-sectional surveys include some retrospective questions which give information on past experiences or characteristics – see Section 2.3. 4 See the website http://www.closer.ac.uk/ for an overview of the main longitudinal datasets in the UK

3
UK Data Service – Analysing change over time: repeated cross sectional and longitudinal survey data
Example: Understanding Society
Also known as the UK Household Longitudinal Survey, Understanding Society is the largest household panel survey in the world, with about 40,000 households and 50,994 individuals followed yearly since 2009. This size allows for detailed longitudinal analysis to be carried out on subgroup of the UK population. All adults aged 16 and more are interviewed, with a special questionnaire filled by children aged 10 to 15. The sample is made of a general population sample, a booster sample for ethnic minorities, as well as an innovation panel in which new questions and methods are experimented at each wave. It also incorporates respondents from the former British Household Panel Survey (BHPS) that has been running since 1991. Data from Understanding Society can be linked with the respondents’ administrative records in areas such as education, health or work and pensions or transport. Small area geographic identifiers can be used under special licence, thus enabling detailed spatial analysis using common political and administrative boundaries. Detailed Health data is directly collected by nurse for about one third of the sample received - 20000 respondents. More information is available on the UKDS website or directly at https://www.understandingsociety.ac.uk/about/
Panel data provide better opportunities to track individual level change than repeated cross-sectional data. You can use panel data to track individual changes in income, health, family composition etc. Panel data provide opportunities to capture the underlying dynamics of change. For example, whereas one might use repeated cross-sectional data to track changes in overall levels of income in the general population, panel data can be used to analyse changes in individual income over time, for example, to consider what factors influence the likelihood of entering or exiting poverty. Panel data allow a dynamic analysis to consider how past events or states influence current outcomes. They also help in controlling for the effects of unobserved characteristics and allow the researcher to distinguish between age and cohort effects on change (see 2.2.2 Cohort surveys for more about age, period and cohort effects).
2.2.2 Cohort surveys
In cohort surveys, respondents are followed from an identical point in their life onwards, often from birth. These surveys prove very useful to study child development over time, change in marital circumstances or health for instance among people belonging to the same generation.
You can find the largest and most commonly used of these datasets in the Key Data section of the UK Data Service website under the Longitudinal studies tab or explore all longitudinal data in the UK Data Service Data Catalogue and selecting ‘Cohort and longitudinal studies’ as the Data type.

4
UK Data Service – Analysing change over time: repeated cross sectional and longitudinal survey data
The Millennium Cohort Study
The MCS 2000 is a survey of about 19,517 children born in 2000/01, and is the fourth5 of its kind in the UK. It aims at being representative of all children born in 2000, hence its name and will follow them throughout their lives. The MCS includes data about among other parenting; childcare; cognitive development; health; parents’ employment and education; income and poverty; housing, ethnicity. Five waves (also called ‘sweeps’) of data have been collected so far, at age nine months, three, five, seven and eleven, the last one in 2012. In order to attain usable sample size, additional data, also known as booster samples have been collected for children living in disadvantaged areas, from minority ethnic background, and those living in Scotland, Wales and Northern Ireland. More information on the MCS can be found on its UK Data Service page or at the Centre for Longitudinal Studies.
The value of cohort studies is also that they allow the researcher to distinguish between age and cohort effects on change. Age effects are differences that happen as people age, and cohort effects are differences due to the different times at which cohorts were born for example. For example, there may be differences in health over the life course which remains the same for people born at different times. However, some differences are due to individuals being born into society at a different point in time, such as opinions about sex before marriage which people born earlier in the 20th century are likely to have different views about compared with cohorts born more recently. Differences between age groups can reflect both age related effects such as life-course position and maturation, but also cohort differences, differences in the historical, social, economic, cultural, and technological contexts in which different generations have grown up and lived through. Example of cohort surveys includes the National Child Development Study, the 1970 British Cohort Study, the Millennium Cohort Survey (MCS 2000) and the Longitudinal Survey of Young People in England (LSYPE).
2.3 Retrospective longitudinal survey data
Although less common, retrospective longitudinal data can also be collected by asking respondents in cross-sectional and longitudinal surveys about past events in their life. Most of the time these types of data are part of existing panel surveys. Retrospective data tend to be less reliable than data collected directly from respondent due to imprecision of recall, but they can provide useful insight and complement to information that is current at the time of interview. Examples include employment or partnership histories.
5 The earlier cohort studies are the 1946 Medical Research Council (MRC) National Survey of Health and Development (NSHD) (not held by UKDS), and the 1958 National Child Development Study, 1970 British Cohort Study, both available from the UK Data Service. For more about the 1946 study, see their website: http://www.nshd.mrc.ac.uk/default.aspx

5
UK Data Service – Analysing change over time: repeated cross sectional and longitudinal survey data
The BHPS Combined Work-Life History dataset
The British Household Panel Survey Work-Life History Data 1990-2005 is a consolidated dataset derived from the main BHPS, which gathers complete employment information about respondents. It combines information provided at each wave by respondents about their current employment and job statuses as well as changes that occurred between two waves, both having been checked for consistency errors between 1990 and 2005. It also includes retrospective labour market information which was gathered at wave 2 (employment history) and 3 (job history) of the survey. These gather all employment and job related events that occurred since respondents left full-time education. Data is presented both as episode or calendar based. Each episode (i.e. holding a particular job, or experiencing a spell of unemployment) is characterised by a start, an end date, duration and sequence number), whereas calendar data have monthly records of a number of key labour market variables (such as occupation or industry). The data currently covers the first 14 waves of the BHPS. The harmonised files can be merged with any other existing BHPS files. The data and its documentation can be accessed from the UK Data Service Data Catalogue.


0%
10%
20%
30%
40%
50%
60%
16 18 20 22 24 26 28 30 32 34 36 38 40 42 44 46 48 50 52 54 56 58 60 62 64 66 68 70 72 74 76 78 80
Age
unadjusted
adjusted
Percentage

0
10
20
30
40
50
60
70
16 18 20 22 24 26 28 30 32 34 36 38 40 42 44 46 48 50 52 54 56 58 60 62 64 66 68 70 72 74 76 78 80
Age
RQPONMLK
JIH
G
F
E
D
CB
A
Birth Cohorts
1981-1985 A
1976-1980 B
1971-1975 C
1966-1970 D
1961-1965 E
1956-1960 F
1951-1955 G
1946-1950 H
1941-1945 I
1936-1940 J
1931-1935 K
1926-1930 L
1921-1925 M
1916-1920 N
1911-1915 O
1906-1910 P
1901-1905 Q
1896-1900 R
Percentage


23 February 2015
T +44 (0) 1206 872143E [email protected] ukdataservice.ac.uk
The UK Data Service delivers quality social and economic data resources for researchers, teachers and policymakers.
© Copyright 2015 University of Essex and University of Manchester


