JOURNAL OF COMPOSITE MATERIALS Article Analysing process-induced deformation and stresses using a simulated manufacturing process for composite multispar flaps Christian Brauner 1 , Stefan Bauer 2 and Axel S Herrmann 1 Abstract Although composite materials have numerous advantages, some disadvantages, including high manufacturing costs, are relevant. In particular, if the material is applied to large structural components, such as the wings, flaps or fuselage of an airplane, efficient manufacturing processes are required to generate products that are both high quality and cost effective. Therefore, monolithic designs often become integral due to the lower overall part count and simplified designs (e.g. reducing the number of joints and fasteners significantly). For highly integrated monolithic structures, developing a robust manufacturing process to produce high quality structures is a major challenge. An integral structure must conform to the tolerance requirements because those requirements may change. Process-induced deformations may be an important risk factor for these types of structures in the context of the required tolerances, manufacturing costs and process time. Manufacturing process simulations are essential when predicting distortion and residual stresses. This study presents a simulation method for analysing process-induced deformations on the structure of a composite multispar flap. The warpage depends on the thermal expansion and shrinkage of the resin. In this study, a sequentially coupled thermo- mechanical analysis of the process will be used to analyse temperature distribution, curing evolution, distortion and residual stresses of 7.5 m long composite part. Keywords Composites, composite materials, manufacturing process simulation, thermo-elastic, finite element, process induced deformation / stress, viscoelastic, relaxation, curing, SAMCEF Introduction High-performance carbon fibre-reinforced composite materials are widely used in aerospace structures because they have many advantages: they are light- weight, have high stiffness and strength and are very durable. To attain the full potential of these materials, the disadvantage, including the relatively high material and manufacturing costs, must be weighed against the advantages. Monolithic designs often become integral to lower manufacturing costs and to realise a compo- site-based design, reducing the manufacturing costs with lower overall part counts and simplified designs (e.g. reducing the number of joints and fasteners). For highly integral monolithic structures, developing robust manufacturing processes that produce high quality structures remains a major challenge. The development of stable production processes for large integral composite parts, such as flaps, wings or fuselage sec- tions, is complex and fraught with risk. These risks are driven by the distinctive features of composite materials under the influence of the manufacturing process. Because matrix material epoxy resin is a thermoset poly- mer, it is frequently used. Due to the stringent require- ments of the aerospace industry, toughened, thermally stable resin systems are preferable. Typically, resin sys- tems with a high curing temperature (approximately 1 Faserinstitut Bremen e.V., Am Biologischen Garten 2, 28359 Bremen, Germany 2 Airbus, Bremen, Germany Corresponding author: Christian Brauner, Faserinstitut Bremen e.V., Am Biologischen Garten 2, 28359 Bremen, Germany. Email: [email protected]Journal of Composite Materials 2015, Vol. 49(4) 387–402 ! The Author(s) 2014 Reprints and permissions: sagepub.co.uk/journalsPermissions.nav DOI: 10.1177/0021998313519281 jcm.sagepub.com by guest on August 18, 2016 jcm.sagepub.com Downloaded from
Transcript
JOURNAL OFC O M P O S I T EM AT E R I A L SArticle
Analysing process-induced deformationand stresses using a simulatedmanufacturing process for compositemultispar flaps
Christian Brauner1, Stefan Bauer2 and Axel S Herrmann1
Abstract
Although composite materials have numerous advantages, some disadvantages, including high manufacturing costs, are
relevant. In particular, if the material is applied to large structural components, such as the wings, flaps or fuselage of an
airplane, efficient manufacturing processes are required to generate products that are both high quality and cost effective.
Therefore, monolithic designs often become integral due to the lower overall part count and simplified designs (e.g.
reducing the number of joints and fasteners significantly). For highly integrated monolithic structures, developing a robust
manufacturing process to produce high quality structures is a major challenge. An integral structure must conform to the
tolerance requirements because those requirements may change. Process-induced deformations may be an important
risk factor for these types of structures in the context of the required tolerances, manufacturing costs and process time.
Manufacturing process simulations are essential when predicting distortion and residual stresses. This study presents a
simulation method for analysing process-induced deformations on the structure of a composite multispar flap. The
warpage depends on the thermal expansion and shrinkage of the resin. In this study, a sequentially coupled thermo-
mechanical analysis of the process will be used to analyse temperature distribution, curing evolution, distortion and
residual stresses of 7.5 m long composite part.
Keywords
Composites, composite materials, manufacturing process simulation, thermo-elastic, finite element, process induced
High-performance carbon fibre-reinforced compositematerials are widely used in aerospace structuresbecause they have many advantages: they are light-weight, have high stiffness and strength and are verydurable. To attain the full potential of these materials,the disadvantage, including the relatively high materialand manufacturing costs, must be weighed against theadvantages. Monolithic designs often become integralto lower manufacturing costs and to realise a compo-site-based design, reducing the manufacturing costswith lower overall part counts and simplified designs(e.g. reducing the number of joints and fasteners). Forhighly integral monolithic structures, developing robustmanufacturing processes that produce high qualitystructures remains a major challenge. The developmentof stable production processes for large integral
composite parts, such as flaps, wings or fuselage sec-tions, is complex and fraught with risk. These risks aredriven by the distinctive features of composite materialsunder the influence of the manufacturing process.Because matrix material epoxy resin is a thermoset poly-mer, it is frequently used. Due to the stringent require-ments of the aerospace industry, toughened, thermallystable resin systems are preferable. Typically, resin sys-tems with a high curing temperature (approximately
1Faserinstitut Bremen e.V., Am Biologischen Garten 2, 28359 Bremen,
Germany2Airbus, Bremen, Germany
Corresponding author:
Christian Brauner, Faserinstitut Bremen e.V., Am Biologischen Garten 2,
180�C) are chosen to achieve glass transition tempera-tures above 160�C.While curing carbon fibre-reinforcedpolymer (CFRP) materials, the inhomogeneous mater-ial properties facilitate the development of process-induced deformations and stresses due to the chemicalmatrix shrinkage and thermal expansion. The propertiesof the resulting material will be influenced by the pro-cess-dependent deformations and stresses. In fact, theinternal stresses may become intense enough to causefibre matrix debonding, matrix failure or delamination.In general, defects on the micro scale, such as matrixfibre debonding or small matrix cracks, are barely meas-urable and only noticeable through the reduced stiffnessor strength properties. On the macro scale, creating thewrong dimensions in the resulting shape is one of themain risks. For large structures, redesigning a produc-tion facility with regard to the moulds, jigs and tools istime consuming and expensive.
Simulating manufacturing processes is essential whenevaluating the correct process parameters to predict thedistortion and residual stresses. In this paper, a
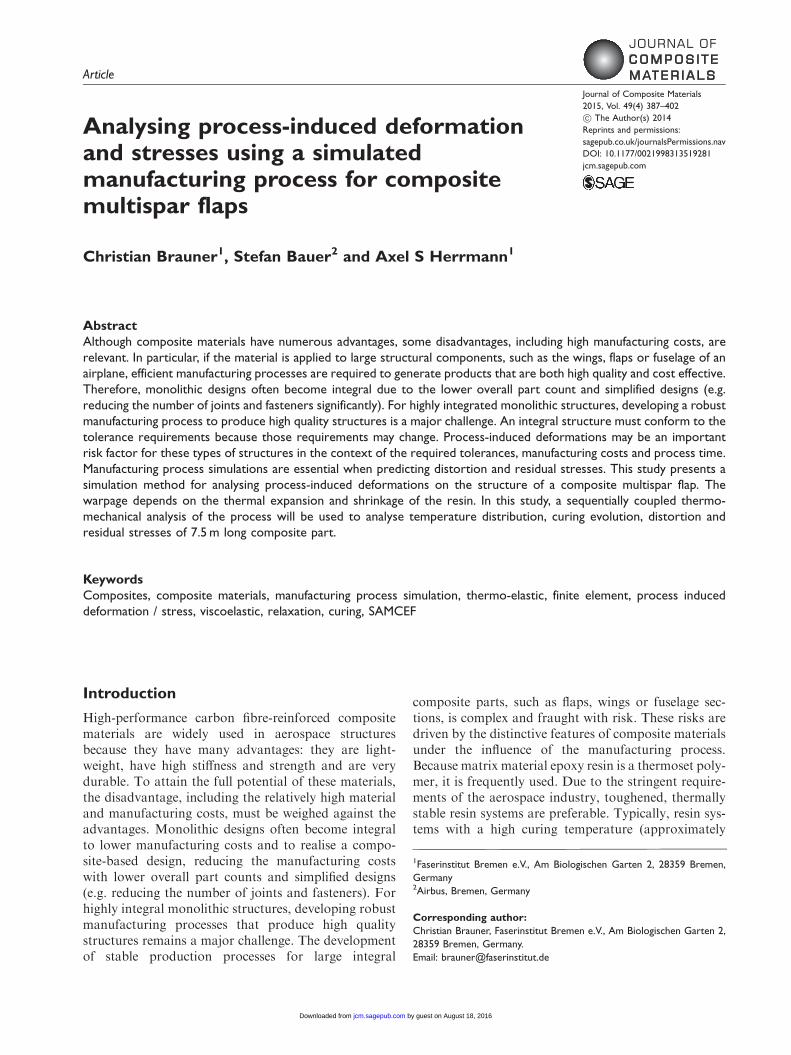
simulation strategy will be presented and compared tothe middle-sized production of an integral compositemultispar flap (CMF). The flap is 7.5m long and isdone using a one shot resin transfer moulding (RTM)process. Various different processes are available tomanufacture thermoset fibre-reinforced compositeparts. In general, a process that uses prepeg (premixedfibre and high viscosity matrix systems) is distinguish-able from a process using dry textiles impregnated viainfusion (vacuum driven) or injection (pressure driven).These processes are called liquid composite manufactur-ing (LCM) and can be classified as open mould tech-niques, such as the resin transfer injection (RTI), orclosed mould techniques, such as resin transfer moulding(RTM) (Figure 1). To reach high fibre volume contents,accelerate injection times and minimise the amount ofvoids, additional pressure is applied. The RTM processhas a heating system that can be applied with a heatingpress, consuming as little energy as an autoclave.
Therefore, RTM is suitable for mass producing highquality parts while minimising manufacturing costs. Inthe following work, the simulation methods will focuson RTM and the materials used during this process.
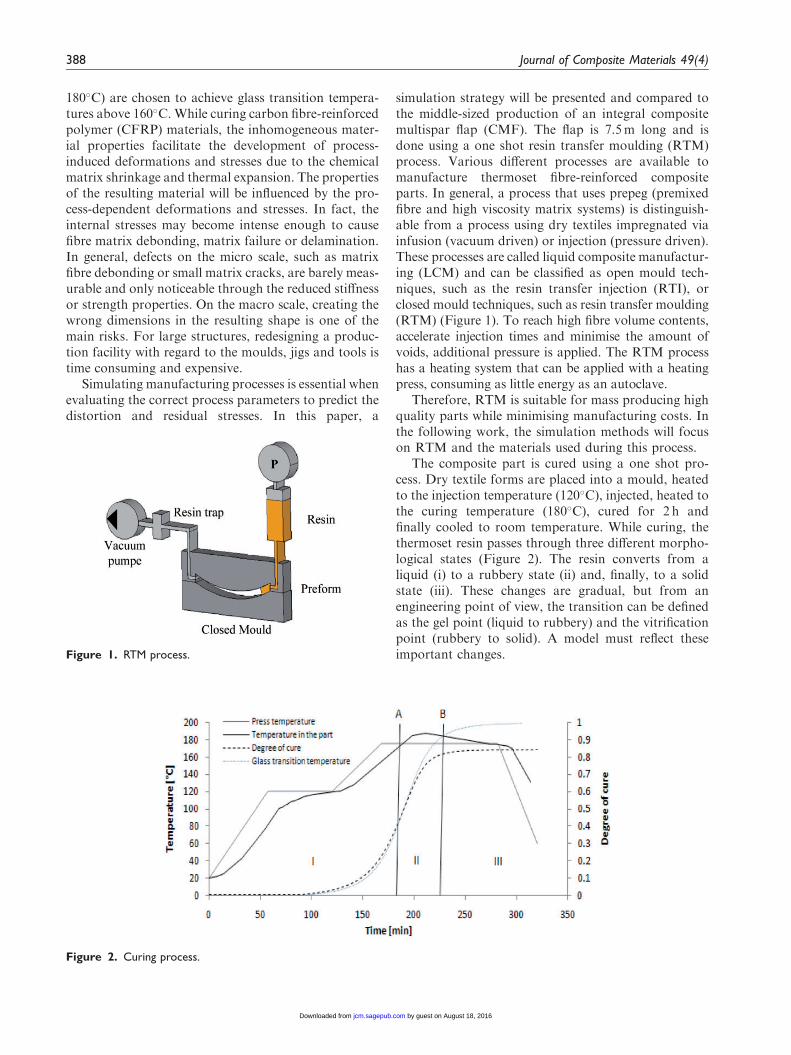
The composite part is cured using a one shot pro-cess. Dry textile forms are placed into a mould, heatedto the injection temperature (120�C), injected, heated tothe curing temperature (180�C), cured for 2 h andfinally cooled to room temperature. While curing, thethermoset resin passes through three different morpho-logical states (Figure 2). The resin converts from aliquid (i) to a rubbery state (ii) and, finally, to a solidstate (iii). These changes are gradual, but from anengineering point of view, the transition can be definedas the gel point (liquid to rubbery) and the vitrificationpoint (rubbery to solid). A model must reflect theseimportant changes.
Figure 2. Curing process.
Figure 1. RTM process.
388 Journal of Composite Materials 49(4)
by guest on August 18, 2016jcm.sagepub.comDownloaded from
In general, three types of analysis can be identified:elastic models, incrementally elastic models and visco-elastic models. Elastic models account for the aniso-tropic coefficients of thermal expansion whileneglecting the effects of the curing reaction, chemicalshrinkage, and viscoelastic material properties; thesemodels are fast, but not reliable. Incrementally elasticapproaches can be found in the literature; these methodsmodel the resin modulus development, depending on thedegree of cure, through either linear, incremental linear5
or nonlinear approaches.17–19 These models are morecomplete, but neglect the viscoelastic material behaviourand the effects of relaxation. To represent the true resi-dual stress state, a viscoelastic approach that depends onthe degree of cure, the temperature and the time is neces-sary; examples are reported by Svanberg et al.,4
Prasataya,22 Kim and White11 and Zoberiy.7
In this study, a manufacturing process simulation ispresented that begins with a thermodynamic analysisand ends with a sequentially coupled mechanical ana-lysis used to examine the warpage generated during aRTM process in a 7.5m composite part. The entirecuring process is simulated using a transient thermo-dynamic analysis to determine the temperature insidethe mould and the part. During this step, the degree ofcure is computed by implementing a user routine thatapplies an exothermic heat flux from the chemicalcuring reaction. Afterwards, the temperature resultsare applied to a transient mechanical analysis. Duringthe mechanical analysis, the material was treated as alinear viscoelastic material dependent on the degree ofcure, temperature and fibre volume content; this ana-lysis was implemented via a user subroutine into theimplicit Finite Element code, Samcef/Mecano.
Simulation strategy
The manufacturing process for composite parts is amulti-physical problem because it connects thethermodynamic discipline (thermal conduction in themoulds and parts), chemistry (resin curing) and mech-anical analysis (warpage). Additionally, this multi-physical problem is compounded with a multi-scaleproblem because single components, such as resin,fibre and fabric, are combined and used to buildlarge structures, including wing covers, fuselage sec-tions, etc. This analysis method should represent thecorrect physical behaviour on the part level whileusing the involved parameters to perform parameterstudies, sensitivity analyses and parameter variabilityanalyses to increase the part quality, decrease themanufacturing costs and design stable manufacturingprocesses. Therefore, a simulation strategy that gener-ates a detailed analysis with less computational effortis required.
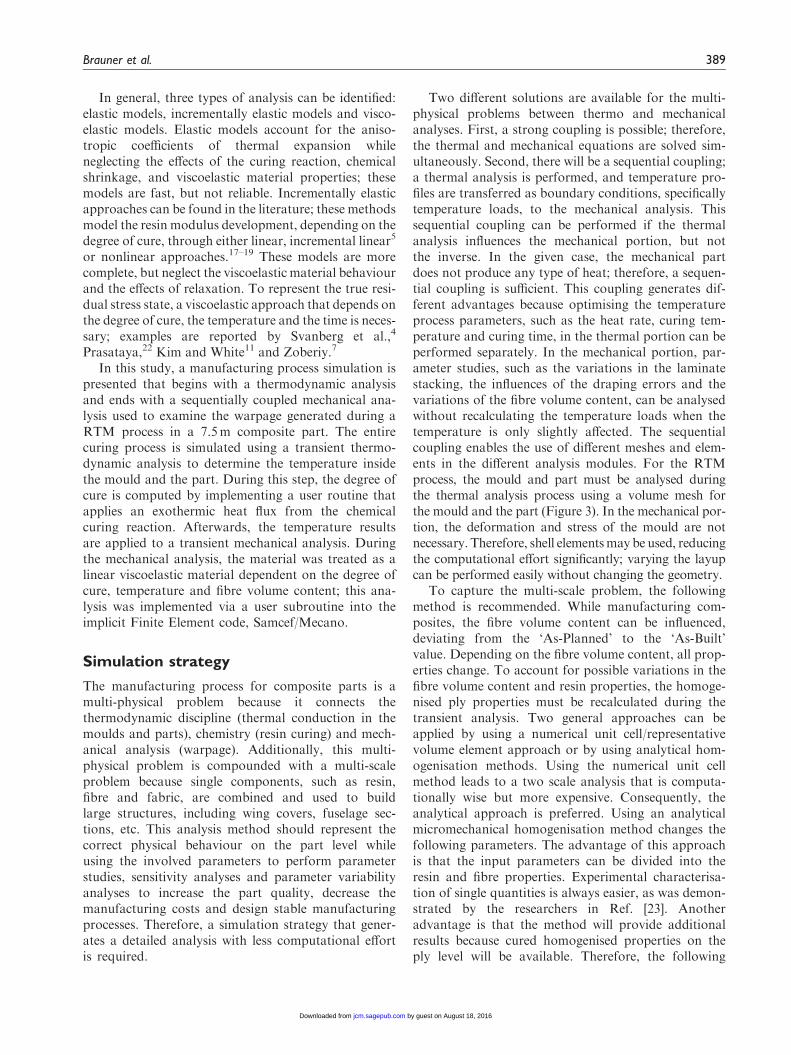
Two different solutions are available for the multi-physical problems between thermo and mechanicalanalyses. First, a strong coupling is possible; therefore,the thermal and mechanical equations are solved sim-ultaneously. Second, there will be a sequential coupling;a thermal analysis is performed, and temperature pro-files are transferred as boundary conditions, specificallytemperature loads, to the mechanical analysis. Thissequential coupling can be performed if the thermalanalysis influences the mechanical portion, but notthe inverse. In the given case, the mechanical partdoes not produce any type of heat; therefore, a sequen-tial coupling is sufficient. This coupling generates dif-ferent advantages because optimising the temperatureprocess parameters, such as the heat rate, curing tem-perature and curing time, in the thermal portion can beperformed separately. In the mechanical portion, par-ameter studies, such as the variations in the laminatestacking, the influences of the draping errors and thevariations of the fibre volume content, can be analysedwithout recalculating the temperature loads when thetemperature is only slightly affected. The sequentialcoupling enables the use of different meshes and elem-ents in the different analysis modules. For the RTMprocess, the mould and part must be analysed duringthe thermal analysis process using a volume mesh forthe mould and the part (Figure 3). In the mechanical por-tion, the deformation and stress of the mould are notnecessary. Therefore, shell elementsmay be used, reducingthe computational effort significantly; varying the layupcan be performed easily without changing the geometry.
To capture the multi-scale problem, the followingmethod is recommended. While manufacturing com-posites, the fibre volume content can be influenced,deviating from the ‘As-Planned’ to the ‘As-Built’value. Depending on the fibre volume content, all prop-erties change. To account for possible variations in thefibre volume content and resin properties, the homoge-nised ply properties must be recalculated during thetransient analysis. Two general approaches can beapplied by using a numerical unit cell/representativevolume element approach or by using analytical hom-ogenisation methods. Using the numerical unit cellmethod leads to a two scale analysis that is computa-tionally wise but more expensive. Consequently, theanalytical approach is preferred. Using an analyticalmicromechanical homogenisation method changes thefollowing parameters. The advantage of this approachis that the input parameters can be divided into theresin and fibre properties. Experimental characterisa-tion of single quantities is always easier, as was demon-strated by the researchers in Ref. [23]. Anotheradvantage is that the method will provide additionalresults because cured homogenised properties on theply level will be available. Therefore, the following
Brauner et al. 389
by guest on August 18, 2016jcm.sagepub.comDownloaded from
material properties are provided: Young’s moduli E1,E2 and E3, shear moduli G12, G23 and G13, Poisson’sratios v12, v13 and v23, thermal expansion coefficientsCTE1, CTE2 and CTE3, heat capacity cp, density � andthermal conductivities �1, �2 and �3.
Thermal analysis module
The necessity of performing a heat transfer analysis inthe composite part is related to two different factors.The first factor depends on the thickness of the lamin-ate. For thin laminates, assuming a uniform tempera-ture in direction of the thickness is valid becauseexothermic reaction heat can be neglected. Thesecond aspect is a temperature gradient within thepart itself. Due to the forced convection heating, thecuring process is much faster where the temperature ishigher. Using a rough rule-of-thumb, increasing thetemperature by 10�C doubles the speed of the curingreaction. To apply the exothermic heat flux from theresin cure reaction, a model developed by Bogetti andGillespie2 is used. The governing equation for heattransfer is the transient anisotropic heat conductionequation containing a heat flux generation term fromthe exothermic cure reaction
�c � cp,c@T
@t¼ r � kc � r � Tþ _q, ð1Þ
_q ¼ 1� Vf
� ��mð p,TÞ �Htot �
dp
dt: ð2Þ
Cure kinetics. Thermoset resins transform from a liquidstate to a solid state at elevated temperatures, and theircuring processes can be described using generalisedempirical rate equations or mechanistic models.Mechanistic models begin to describe the curing pro-cess on an atomistic scale via descriptions of the
growing macromolecules. The empirical rate approachderives a phenomenological mathematical descriptionof the curing process from experimental studies usingdifferential scanning calorimetry (DSC). With thismethod, the exothermic heat flow is measured andinterpreted while assuming that this heat flow is pro-portional to the degree of cure. The reaction kineticsare often used to describe a reaction of nth order; prepresents the conversion factor/degree of cure (varyingfrom 1 to 0) and describes its development. The tem-perature dependence is described using the Arrheniusrate constant ki
dp
dt¼ k1 � p
n, ki ¼ ai � eSiRT
� �, i ¼ 1 . . . 3: ð3Þ
The Arrhenius term is based on the material andprocess parameters with the thermal activation energyof the reaction Si, the universal gas constant R, and thetemperature T. The kinetic reaction models available inthe literature for different resin systems are diverse. Ingeneral, the model must accommodate different curingsituations, particularly the variation in isothermal anddynamic temperature conditions.
Kamal and Sourour developed a model that ismostly used for the given resin system (RTM6)3
dp
dt¼ k1 þ k2 � p
mð Þ � pmax � pð Þn: ð4Þ
Glass transition temperature. While curing epoxy resin,three different morphologic states will be passed. Theresin will be converting from liquid to rubbery and tosolid states. These changes are not defined as points,but from the engineering perspective, they will bedefined as points and connected to the glass transitiontemperature. The changes in the glass transition tem-perature depend on the degree of cure. These changes
Figure 3. Simulation strategy.
390 Journal of Composite Materials 49(4)
by guest on August 18, 2016jcm.sagepub.comDownloaded from
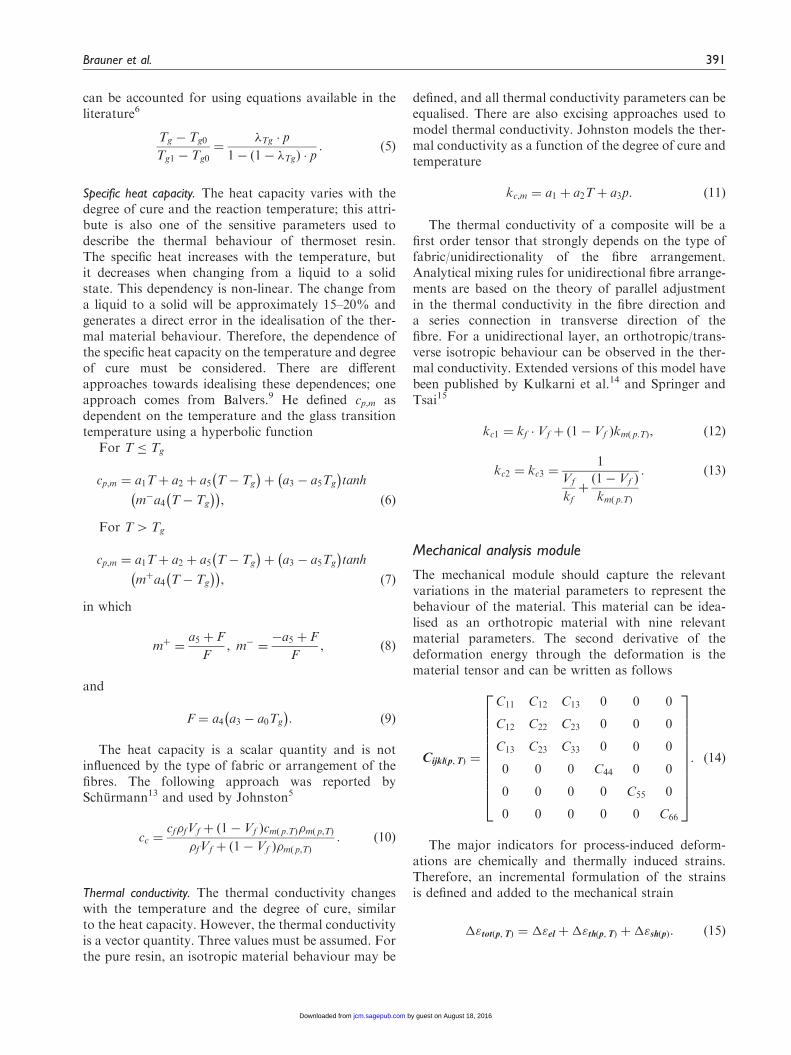
can be accounted for using equations available in theliterature6
Tg � Tg0
Tg1 � Tg0¼
�Tg � p
1� ð1� �TgÞ � p: ð5Þ
Specific heat capacity. The heat capacity varies with thedegree of cure and the reaction temperature; this attri-bute is also one of the sensitive parameters used todescribe the thermal behaviour of thermoset resin.The specific heat increases with the temperature, butit decreases when changing from a liquid to a solidstate. This dependency is non-linear. The change froma liquid to a solid will be approximately 15–20% andgenerates a direct error in the idealisation of the ther-mal material behaviour. Therefore, the dependence ofthe specific heat capacity on the temperature and degreeof cure must be considered. There are differentapproaches towards idealising these dependences; oneapproach comes from Balvers.9 He defined cp,m asdependent on the temperature and the glass transitiontemperature using a hyperbolic function
For T � Tg
cp,m ¼ a1Tþ a2 þ a5 T� Tg
� �þ a3 � a5Tg
� �tanh
m�a4 T� Tg
� �� �, ð6Þ
For T4Tg
cp,m ¼ a1Tþ a2 þ a5 T� Tg
� �þ a3 � a5Tg
� �tanh
mþa4 T� Tg
� �� �, ð7Þ
in which
mþ ¼a5 þ F
F, m� ¼
�a5 þ F
F, ð8Þ
and
F ¼ a4 a3 � a0Tg
� �: ð9Þ
The heat capacity is a scalar quantity and is notinfluenced by the type of fabric or arrangement of thefibres. The following approach was reported bySchurmann13 and used by Johnston5
cc ¼cf�fVf þ ð1� Vf Þcmð p:TÞ�mð p,TÞ
�fVf þ ð1� Vf Þ�mð p,TÞ: ð10Þ
Thermal conductivity. The thermal conductivity changeswith the temperature and the degree of cure, similarto the heat capacity. However, the thermal conductivityis a vector quantity. Three values must be assumed. Forthe pure resin, an isotropic material behaviour may be
defined, and all thermal conductivity parameters can beequalised. There are also excising approaches used tomodel thermal conductivity. Johnston models the ther-mal conductivity as a function of the degree of cure andtemperature
kc,m ¼ a1 þ a2Tþ a3p: ð11Þ
The thermal conductivity of a composite will be afirst order tensor that strongly depends on the type offabric/unidirectionality of the fibre arrangement.Analytical mixing rules for unidirectional fibre arrange-ments are based on the theory of parallel adjustmentin the thermal conductivity in the fibre direction anda series connection in transverse direction of thefibre. For a unidirectional layer, an orthotropic/trans-verse isotropic behaviour can be observed in the ther-mal conductivity. Extended versions of this model havebeen published by Kulkarni et al.14 and Springer andTsai15
kc1 ¼ kf � Vf þ ð1� Vf Þkmð p:TÞ, ð12Þ
kc2 ¼ kc3 ¼1
Vf
kfþð1� Vf Þ
kmð p:TÞ
: ð13Þ
Mechanical analysis module
The mechanical module should capture the relevantvariations in the material parameters to represent thebehaviour of the material. This material can be idea-lised as an orthotropic material with nine relevantmaterial parameters. The second derivative of thedeformation energy through the deformation is thematerial tensor and can be written as follows
Cijklðp,TÞ ¼
C11 C12 C13 0 0 0
C12 C22 C23 0 0 0
C13 C23 C33 0 0 0
0 0 0 C44 0 0
0 0 0 0 C55 0
0 0 0 0 0 C66
266666666664
377777777775: ð14Þ
The major indicators for process-induced deform-ations are chemically and thermally induced strains.Therefore, an incremental formulation of the strainsis defined and added to the mechanical strain
�"totðp,TÞ ¼ �"el þ�"thðp,TÞ þ�"shðpÞ: ð15Þ
Brauner et al. 391
by guest on August 18, 2016jcm.sagepub.comDownloaded from
The chemically induced strains are based on theincrements of the degree of cure. The total value ofthis vector quantity is the computed homogenisationapproach in equations (18)–(27)
�"shðpÞ ¼ ��p: ð16Þ
A similar approach is applied to the thermallyinduced strains and is based on the presented homogen-isation approach (equations (31)–(33))
�"th ¼ �n�T: ð17Þ
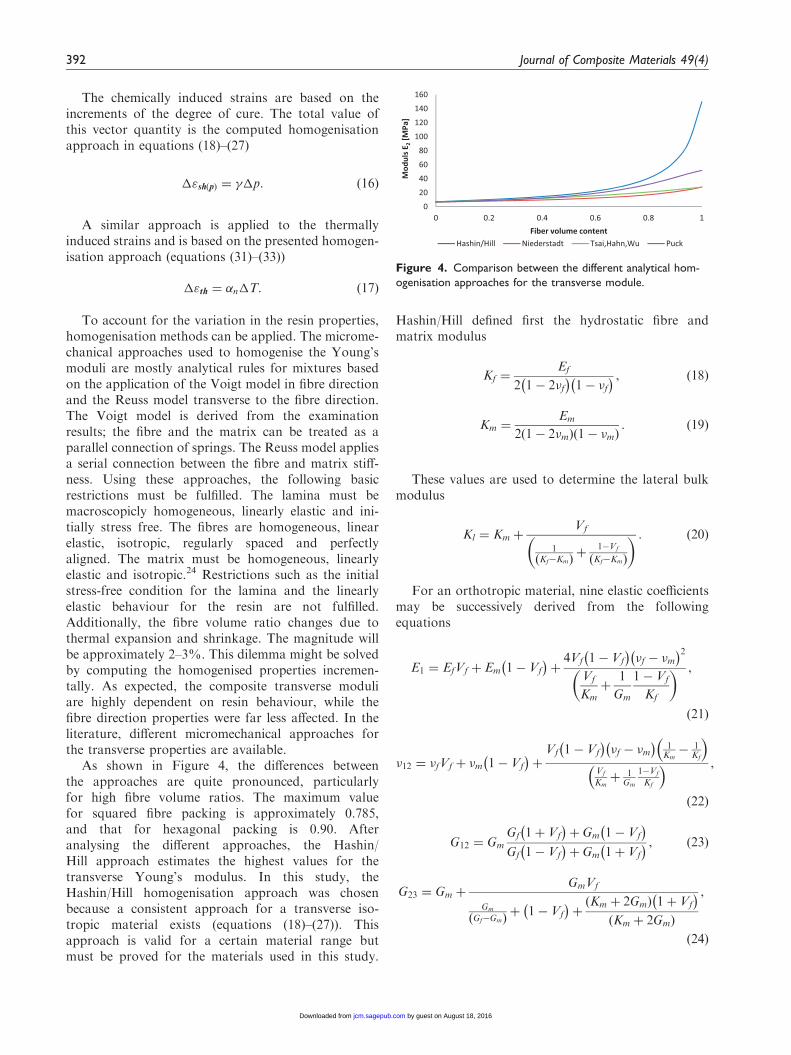
To account for the variation in the resin properties,homogenisation methods can be applied. The microme-chanical approaches used to homogenise the Young’smoduli are mostly analytical rules for mixtures basedon the application of the Voigt model in fibre directionand the Reuss model transverse to the fibre direction.The Voigt model is derived from the examinationresults; the fibre and the matrix can be treated as aparallel connection of springs. The Reuss model appliesa serial connection between the fibre and matrix stiff-ness. Using these approaches, the following basicrestrictions must be fulfilled. The lamina must bemacroscopicly homogeneous, linearly elastic and ini-tially stress free. The fibres are homogeneous, linearelastic, isotropic, regularly spaced and perfectlyaligned. The matrix must be homogeneous, linearlyelastic and isotropic.24 Restrictions such as the initialstress-free condition for the lamina and the linearlyelastic behaviour for the resin are not fulfilled.Additionally, the fibre volume ratio changes due tothermal expansion and shrinkage. The magnitude willbe approximately 2–3%. This dilemma might be solvedby computing the homogenised properties incremen-tally. As expected, the composite transverse moduliare highly dependent on resin behaviour, while thefibre direction properties were far less affected. In theliterature, different micromechanical approaches forthe transverse properties are available.
As shown in Figure 4, the differences betweenthe approaches are quite pronounced, particularlyfor high fibre volume ratios. The maximum valuefor squared fibre packing is approximately 0.785,and that for hexagonal packing is 0.90. Afteranalysing the different approaches, the Hashin/Hill approach estimates the highest values for thetransverse Young’s modulus. In this study, theHashin/Hill homogenisation approach was chosenbecause a consistent approach for a transverse iso-tropic material exists (equations (18)–(27)). Thisapproach is valid for a certain material range butmust be proved for the materials used in this study.
Hashin/Hill defined first the hydrostatic fibre andmatrix modulus
Kf ¼Ef
2 1� 2�f� �
1� �f� � , ð18Þ
Km ¼Em
2 1� 2�mð Þ 1� �mð Þ: ð19Þ
These values are used to determine the lateral bulkmodulus
Kl ¼ Km þVf
1Kf�Kmð Þ
þ1�Vf
Kf�Kmð Þ
� � : ð20Þ
For an orthotropic material, nine elastic coefficientsmay be successively derived from the followingequations
For transverse isotropy (which will be used in thisstudy), the following assumptions can be found
E3 ¼ E2, �13 ¼ �12, G13 ¼ G12: ð27Þ
Similar to the engineering constant, the thermalexpansion coefficients (CTE) (�i) of the homogenisedply can be defined in the following way. As a firstassumption, the thermal expansion of the matrix doesnot depend on the degree of cure. To prove thisassumption is very difficult because there is no meas-urement method available to obtain the thermal expan-sion changes other than shrinkage. In literaturereviews,4,5,7,16 the expansion coefficient was alwaysdefined as constant. Again, different approaches forthe longitudinal and transverse behaviours can befound in the literature. All approaches for the longitu-dinal direction begin from the requirement that thefibre and matrix have the same strain and are stress-free, while neglecting the influences of the transversecontraction. Again, some conditions are not orcannot be fulfilled. Similar to the engineering constants,the homogenised thermal expansion has also beendefined incrementally. For the engineering constants,the resin modulus must strongly influence the hom-ogenisation properties. For the CTE in the fibre direc-tion, the same is required. For the cured material, thestiff fibres deform the matrix in the fibre direction.During the process, the CTE will initially be negative.After passing the gel point, the coefficient will begin toincrease, depending on the degree of cure. This depend-ence can be introduced if the homogenisation proper-ties involve the resin modulus.
In the transverse direction, the thermal expansion ofthe compound is matrix dominated. The theoreticalfundament base is connected in series. Using theassumption that the CTE of the matrix is not cure-dependent, a micromechanical model can be definedin the simplest way. In the transverse and longitudinaldirections, the following approaches from Schurmann13
are chosen
�1 ¼�mEm 1� Vf
� �þ �fVfEf
Em 1� Vf
� �þ EfVf
, ð28Þ
�2 ¼ �m 1� Vf
� �þ �fVf, ð29Þ
�3 ¼ �2: ð30Þ
To determine the influence of chemical shrinkage, achemically induced shrinkage coefficient (CSC) �i canbe introduced. Micromechanical approaches are usefuland can be applied in a way similar to the CTE (�i) inthe constitutive equations. The CSC approach is relatedto the CTE; the CTE must be capable of applying onlythe chemically induced strain if the gel point is passed.The stiff fibres dominate the behaviour before reachingthe gel point. This behaviour can be obtained if theresin modulus is included in the micromechanicalmodel. The influence of the resin modulus cannot beneglected perpendicular to the fibre direction. Two dif-ferent approaches to homogenise the CSC from themicro- to ply level were found in the literature andwere published by Johnston and Wijskamp.5,16 Bothuse the same equation for the longitudinal direction
�1 ¼ð1� Vf ÞEm�m
VfEf1 þ ð1� Vf ÞEm, ð31Þ
�2 ¼ 1� Vf
� �1þ �mð Þ�m þ �12�1, ð32Þ
�3 ¼ �2:: ð33Þ
The viscoelastic relaxation effects must be used andcannot be neglected. A possible approach using theincrementally written differential form of the relax-ation, as discovered by Zocher et al.16 and Svanbergand Holmberg4, can be used. To account for thiseffect, an instantaneous viscous elastic approach isapplicable. Therefore, to define the stress at the actualtime, a relaxation term can be added using a formula-tion based on a Maxwell element
�ijðtþ"tÞ ¼ �ijðtÞ þ��ij, ð34Þ
��ijðtÞ ¼ �Rij þ�Cijklðp,TÞ ��"totðp,TÞ, ð35Þ
�Rij ¼ SijklðtÞ � 1� e���
�ijðp,TÞ
� �, ð36Þ
SijklðtÞ ¼ e���
�ijðp,TÞ � SijklðtÞ þ%ijðp,TÞ � Cijkl ��"total
��1� e
����ijðp,TÞ
� �:
ð37Þ
The parameters �ijðp,TÞ and %ijðp,TÞ are temperature-and degree of cure-dependent parameters, respectively,and are used to describe the relaxation behaviour. Theyare vector quantities; six values must be determined todescribe the relaxation behaviour under normal stressand shear stress load situations. The complex behav-iour can be simplified using the following assumption21:
. The global viscoelastic behaviour is based on thematrix component
. The fibres have a pure linear elastic behaviour
. Homogenisation methods can be used to relate thematrix relaxation behaviour to the compositebehaviour.
Brauner et al. 393
by guest on August 18, 2016jcm.sagepub.comDownloaded from
Therefore, the relaxation behaviour can be charac-terised as a pure resin that displays isotropic behaviour.This isotropic material can be described using the �ð p,TÞand %ð p,TÞ parameters. The complete characterisation ofthe resin behaviour was presented by Brauner et al.23
Using the Meder approach,21 the following homogen-isation can be performed
r1 ¼1
1þVf
ð1�Vf ÞEm
Ef1
, ð38Þ
r2 ¼1
1þVf
ð1�Vf ÞEf2
Em
: ð39Þ
Material characterisation
This chapter characterises the thermomechanicalbehaviour. Key aspects include the process-dependentchanges in resin properties. The resin behaviour wasobserved in detail by the author and can be found inRef. [23]. A unidirectional composite consisting of theC-Fibre TENAX HTA 5131 and the premixed epoxyresin HEXCEL RTM 6 was used as the material. Thecarbon fibre properties are based on Tenax Fibers,which are for the G0926 fabric examples. This type offibre is part of the high tenacity class. The following fibreproperties are taken from the literature (Table 1).13
The present study concentrates on a polyfunctionalepoxy resin (RTM 6) supplied by Hexcel Composites
(UK). The resin is used to manufacture aircraft compos-ite structures via the RTM process and is currentlyreceiving considerable attention from civil aircraftmanufacturers. The composition of the resin systemincludes two aromatic diamine hardeners. The expectedservice temperatures of final products range from �60�Cto 180�C. At room temperature, RTM 6 is a translucentpaste, but its viscosity drops very quickly after heating.The uncured resin has a density of 1.117 g/cm3, and thefully cured resin has a density of 1.141 g/cm3. The rec-ommended cure regime for this resin is 160�C for 75min,followed by a post-cure treatment at 180�C for 2 h, gen-erating the expected glass transition temperature(approximately 183�C) in the cured material. The recom-mended curing process (180�C for 120min) generates a196�C glass transition temperature and a final degree ofcure of approximately 96%. The following resin proper-ties are given for the cured material (table 1 and 2).
Application to a test case
Experimental test setup
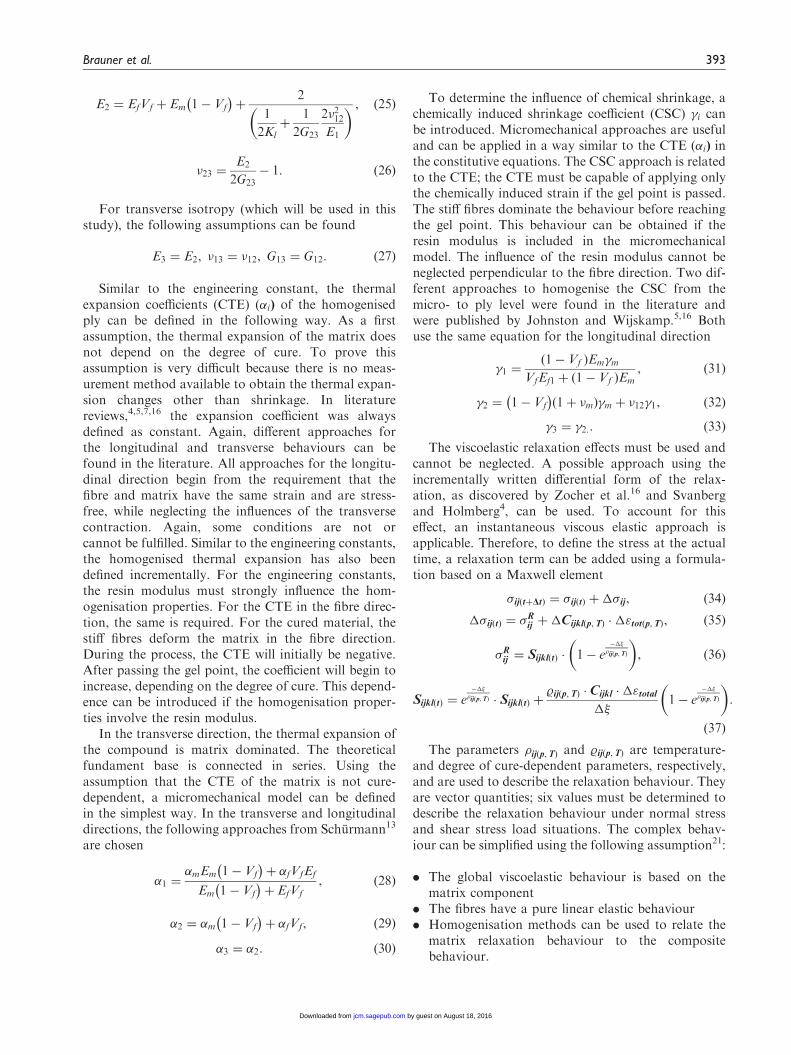
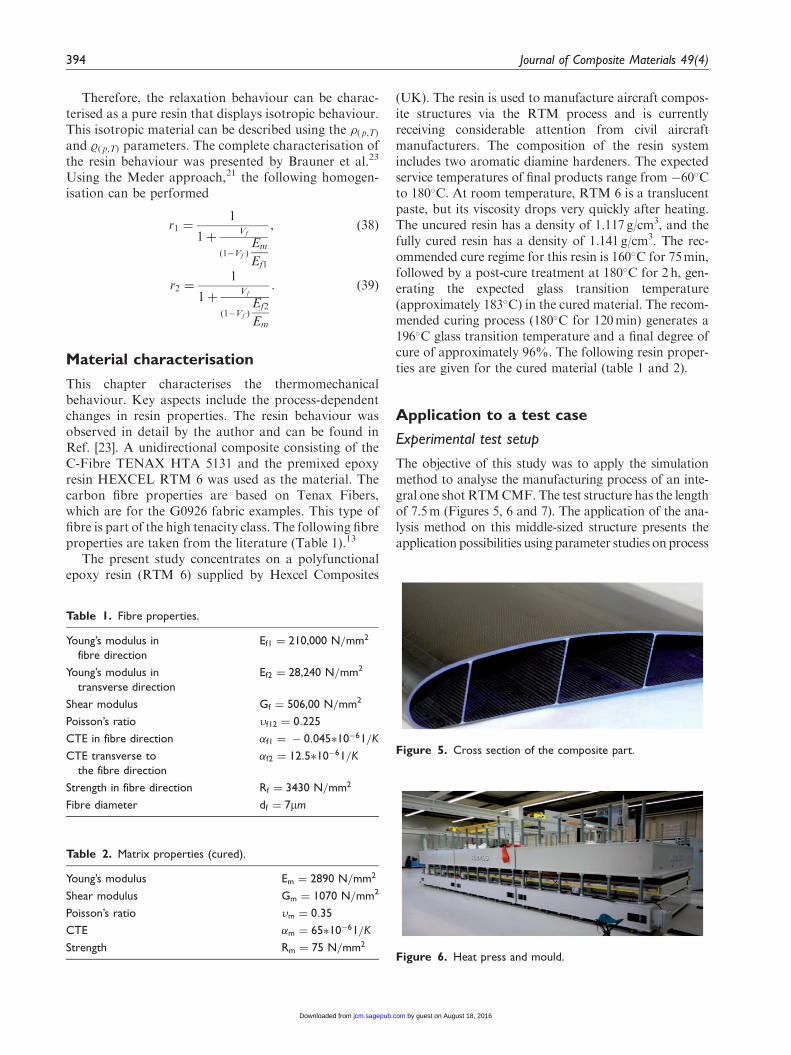
The objective of this study was to apply the simulationmethod to analyse the manufacturing process of an inte-gral one shotRTMCMF. The test structure has the lengthof 7.5m (Figures 5, 6 and 7). The application of the ana-lysis method on this middle-sized structure presents theapplication possibilities using parameter studies onprocess
Table 1. Fibre properties.
Young’s modulus in
fibre direction
Ef1 ¼ 210,000 N=mm2
Young’s modulus in
transverse direction
Ef2 ¼ 28,240 N=mm2
Shear modulus Gf ¼ 506,00 N=mm2
Poisson’s ratio f12 ¼ 0:225
CTE in fibre direction �f1 ¼ � 0:045�10�61=K
CTE transverse to
the fibre direction
�f2 ¼ 12:5�10�61=K
Strength in fibre direction Rf ¼ 3430 N=mm2
Fibre diameter df ¼ 7mm
Table 2. Matrix properties (cured).
Young’s modulus Em ¼ 2890 N=mm2
Shear modulus Gm ¼ 1070 N=mm2
Poisson’s ratio m ¼ 0:35
CTE �m ¼ 65�10�61=K
Strength Rm ¼ 75 N=mm2
Figure 6. Heat press and mould.
Figure 5. Cross section of the composite part.
394 Journal of Composite Materials 49(4)
by guest on August 18, 2016jcm.sagepub.comDownloaded from
parameters to reduce process time, to evaluate risk param-eters and their influence and to improve part quality.
Numerical analysis
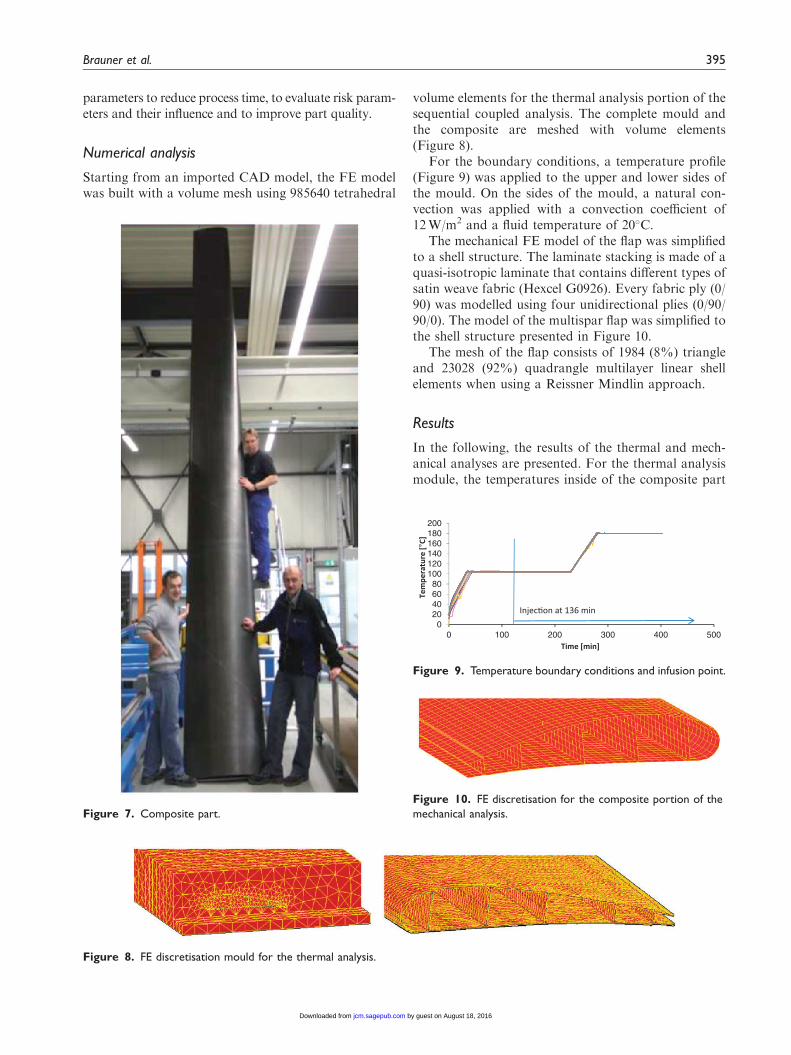
Starting from an imported CAD model, the FE modelwas built with a volume mesh using 985640 tetrahedral
volume elements for the thermal analysis portion of thesequential coupled analysis. The complete mould andthe composite are meshed with volume elements(Figure 8).
For the boundary conditions, a temperature profile(Figure 9) was applied to the upper and lower sides ofthe mould. On the sides of the mould, a natural con-vection was applied with a convection coefficient of12W/m2 and a fluid temperature of 20�C.
The mechanical FE model of the flap was simplifiedto a shell structure. The laminate stacking is made of aquasi-isotropic laminate that contains different types ofsatin weave fabric (Hexcel G0926). Every fabric ply (0/90) was modelled using four unidirectional plies (0/90/90/0). The model of the multispar flap was simplified tothe shell structure presented in Figure 10.
The mesh of the flap consists of 1984 (8%) triangleand 23028 (92%) quadrangle multilayer linear shellelements when using a Reissner Mindlin approach.
Results
In the following, the results of the thermal and mech-anical analyses are presented. For the thermal analysismodule, the temperatures inside of the composite part
Figure 8. FE discretisation mould for the thermal analysis.
020406080
100120140160180200
0 100 200 300 400 500
Tem
pera
ture
[°C]
Time [min]
Injec�on at 136 min
Figure 9. Temperature boundary conditions and infusion point.
Figure 10. FE discretisation for the composite portion of the
mechanical analysis.Figure 7. Composite part.
Brauner et al. 395
by guest on August 18, 2016jcm.sagepub.comDownloaded from
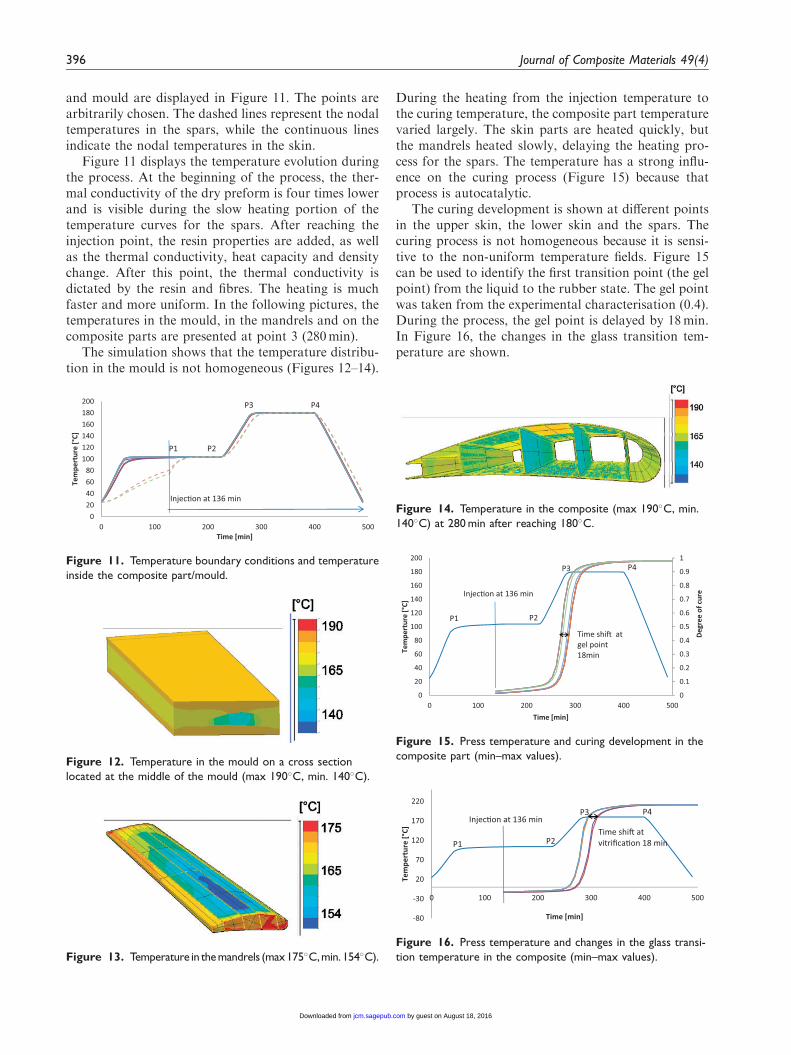
and mould are displayed in Figure 11. The points arearbitrarily chosen. The dashed lines represent the nodaltemperatures in the spars, while the continuous linesindicate the nodal temperatures in the skin.
Figure 11 displays the temperature evolution duringthe process. At the beginning of the process, the ther-mal conductivity of the dry preform is four times lowerand is visible during the slow heating portion of thetemperature curves for the spars. After reaching theinjection point, the resin properties are added, as wellas the thermal conductivity, heat capacity and densitychange. After this point, the thermal conductivity isdictated by the resin and fibres. The heating is muchfaster and more uniform. In the following pictures, thetemperatures in the mould, in the mandrels and on thecomposite parts are presented at point 3 (280min).
The simulation shows that the temperature distribu-tion in the mould is not homogeneous (Figures 12–14).
During the heating from the injection temperature tothe curing temperature, the composite part temperaturevaried largely. The skin parts are heated quickly, butthe mandrels heated slowly, delaying the heating pro-cess for the spars. The temperature has a strong influ-ence on the curing process (Figure 15) because thatprocess is autocatalytic.
The curing development is shown at different pointsin the upper skin, the lower skin and the spars. Thecuring process is not homogeneous because it is sensi-tive to the non-uniform temperature fields. Figure 15can be used to identify the first transition point (the gelpoint) from the liquid to the rubber state. The gel pointwas taken from the experimental characterisation (0.4).During the process, the gel point is delayed by 18min.In Figure 16, the changes in the glass transition tem-perature are shown.
0
0.1
0.2
0.3
0.4
0.5
0.6
0.7
0.8
0.9
1
0
20
40
60
80
100
120
140
160
180
200
0 100 200 300 400 500
Tem
pert
ure
[°C]
Time [min]
P2P1
P3 P4
Injec�on at 136 min
Degr
ee o
f cur
e
Time shi� at gel point 18min
Figure 15. Press temperature and curing development in the
composite part (min–max values).
020406080
100120140160180200
0 100 200 300 400 500
Tem
pert
ure
[°C]
Time [min]
P2P1
P4
Injec�on at 136 min
P3
Figure 11. Temperature boundary conditions and temperature
inside the composite part/mould.
Figure 12. Temperature in the mould on a cross section
located at the middle of the mould (max 190�C, min. 140�C).
Figure 13. Temperature in themandrels (max175�C,min. 154�C).
-80
-30
20
70
120
170
220
0 100 200 300 400 500
Tem
pert
ure
[°C]
Time [min]
P2P1
P3 P4
Time shi� at vitrifica�on 18 min
Injec�on at 136 min
Figure 16. Press temperature and changes in the glass transi-
tion temperature in the composite (min–max values).
Figure 14. Temperature in the composite (max 190�C, min.
140�C) at 280 min after reaching 180�C.
396 Journal of Composite Materials 49(4)
by guest on August 18, 2016jcm.sagepub.comDownloaded from
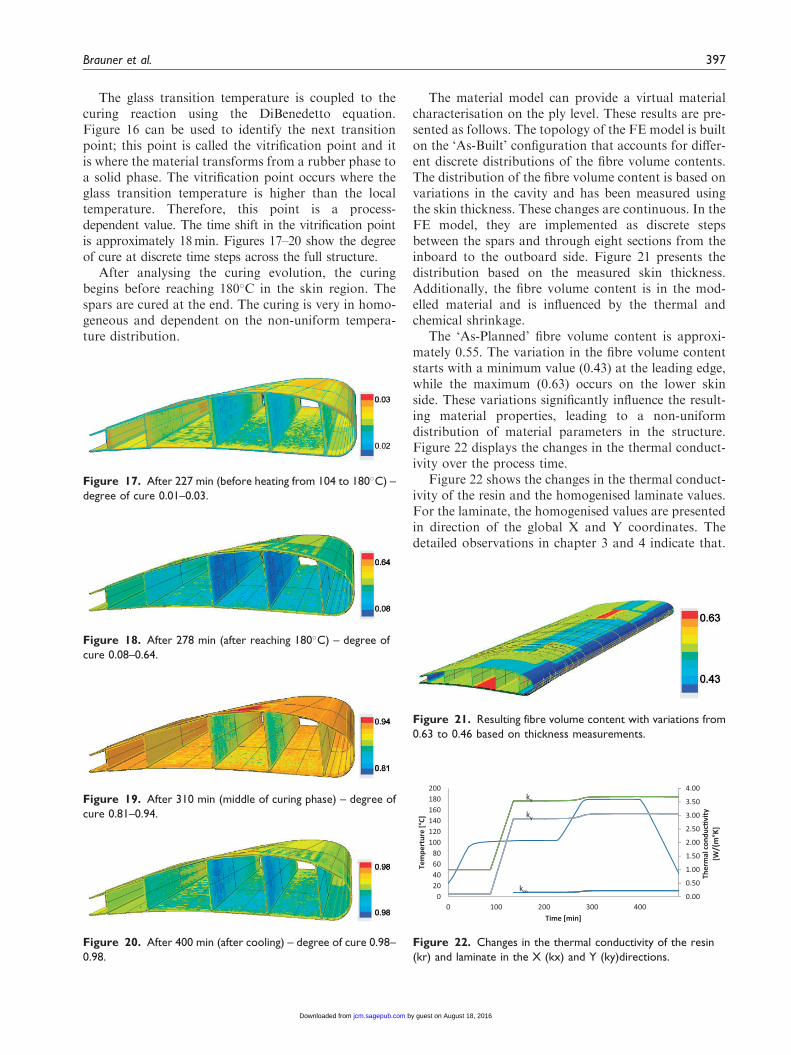
The glass transition temperature is coupled to thecuring reaction using the DiBenedetto equation.Figure 16 can be used to identify the next transitionpoint; this point is called the vitrification point and itis where the material transforms from a rubber phase toa solid phase. The vitrification point occurs where theglass transition temperature is higher than the localtemperature. Therefore, this point is a process-dependent value. The time shift in the vitrification pointis approximately 18min. Figures 17–20 show the degreeof cure at discrete time steps across the full structure.
After analysing the curing evolution, the curingbegins before reaching 180�C in the skin region. Thespars are cured at the end. The curing is very in homo-geneous and dependent on the non-uniform tempera-ture distribution.
The material model can provide a virtual materialcharacterisation on the ply level. These results are pre-sented as follows. The topology of the FE model is builton the ‘As-Built’ configuration that accounts for differ-ent discrete distributions of the fibre volume contents.The distribution of the fibre volume content is based onvariations in the cavity and has been measured usingthe skin thickness. These changes are continuous. In theFE model, they are implemented as discrete stepsbetween the spars and through eight sections from theinboard to the outboard side. Figure 21 presents thedistribution based on the measured skin thickness.Additionally, the fibre volume content is in the mod-elled material and is influenced by the thermal andchemical shrinkage.
The ‘As-Planned’ fibre volume content is approxi-mately 0.55. The variation in the fibre volume contentstarts with a minimum value (0.43) at the leading edge,while the maximum (0.63) occurs on the lower skinside. These variations significantly influence the result-ing material properties, leading to a non-uniformdistribution of material parameters in the structure.Figure 22 displays the changes in the thermal conduct-ivity over the process time.
Figure 22 shows the changes in the thermal conduct-ivity of the resin and the homogenised laminate values.For the laminate, the homogenised values are presentedin direction of the global X and Y coordinates. Thedetailed observations in chapter 3 and 4 indicate that.
0.00
0.50
1.00
1.50
2.00
2.50
3.00
3.50
4.00
020406080
100120140160180200
0 100 200 300 400
Tem
pert
ure
[°C]
Time [min]
Ther
mal
con
duc�
vity
[W
/(m
°K]
km
kx
ky
Figure 22. Changes in the thermal conductivity of the resin
(kr) and laminate in the X (kx) and Y (ky)directions.
Figure 21. Resulting fibre volume content with variations from
0.63 to 0.46 based on thickness measurements.
Figure 18. After 278 min (after reaching 180�C) – degree of
cure 0.08–0.64.
Figure 17. After 227 min (before heating from 104 to 180�C) –
degree of cure 0.01–0.03.
Figure 19. After 310 min (middle of curing phase) – degree of
cure 0.81–0.94.
Figure 20. After 400 min (after cooling) – degree of cure 0.98–
0.98.
Brauner et al. 397
by guest on August 18, 2016jcm.sagepub.comDownloaded from
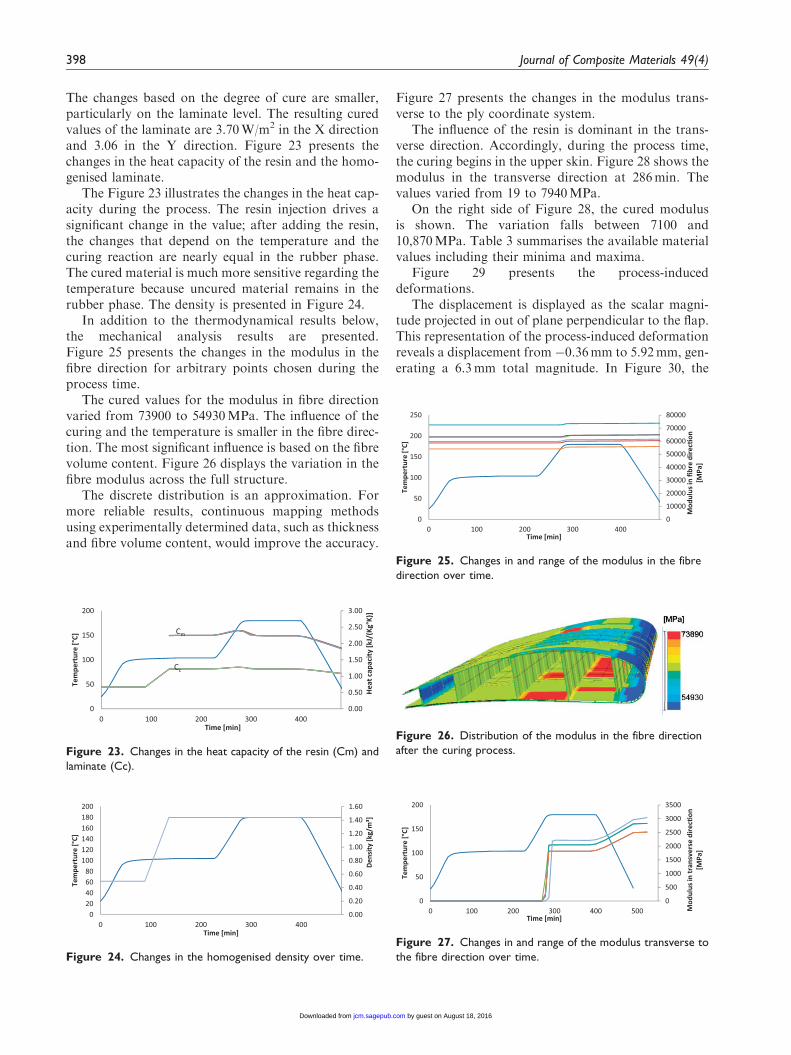
The changes based on the degree of cure are smaller,particularly on the laminate level. The resulting curedvalues of the laminate are 3.70W/m2 in the X directionand 3.06 in the Y direction. Figure 23 presents thechanges in the heat capacity of the resin and the homo-genised laminate.
The Figure 23 illustrates the changes in the heat cap-acity during the process. The resin injection drives asignificant change in the value; after adding the resin,the changes that depend on the temperature and thecuring reaction are nearly equal in the rubber phase.The cured material is much more sensitive regarding thetemperature because uncured material remains in therubber phase. The density is presented in Figure 24.
In addition to the thermodynamical results below,the mechanical analysis results are presented.Figure 25 presents the changes in the modulus in thefibre direction for arbitrary points chosen during theprocess time.
The cured values for the modulus in fibre directionvaried from 73900 to 54930MPa. The influence of thecuring and the temperature is smaller in the fibre direc-tion. The most significant influence is based on the fibrevolume content. Figure 26 displays the variation in thefibre modulus across the full structure.
The discrete distribution is an approximation. Formore reliable results, continuous mapping methodsusing experimentally determined data, such as thicknessand fibre volume content, would improve the accuracy.
Figure 27 presents the changes in the modulus trans-verse to the ply coordinate system.
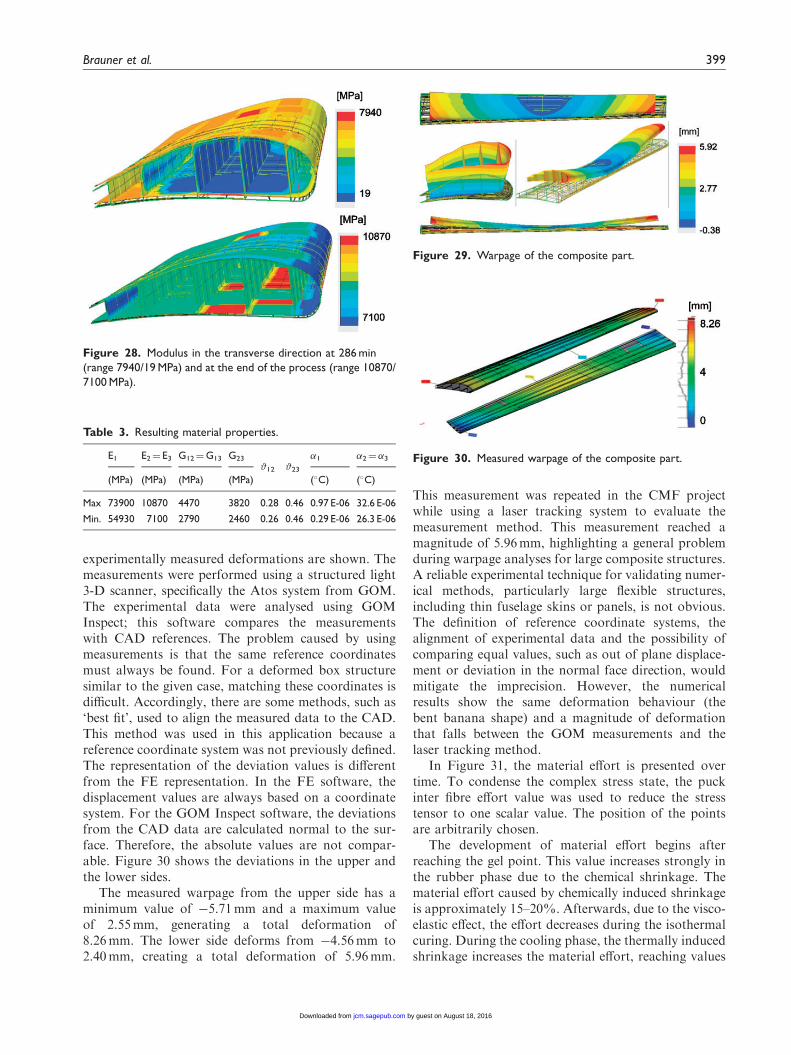
The influence of the resin is dominant in the trans-verse direction. Accordingly, during the process time,the curing begins in the upper skin. Figure 28 shows themodulus in the transverse direction at 286min. Thevalues varied from 19 to 7940MPa.
On the right side of Figure 28, the cured modulusis shown. The variation falls between 7100 and10,870MPa. Table 3 summarises the available materialvalues including their minima and maxima.
Figure 29 presents the process-induceddeformations.
The displacement is displayed as the scalar magni-tude projected in out of plane perpendicular to the flap.This representation of the process-induced deformationreveals a displacement from �0.36mm to 5.92mm, gen-erating a 6.3mm total magnitude. In Figure 30, the
0
10000
20000
30000
40000
50000
60000
70000
80000
0
50
100
150
200
250
0 100 200 300 400
Tem
pert
ure
[°C]
Time [min]
Mod
ulus
in fi
bre
dire
c�on
[M
Pa]
Figure 25. Changes in and range of the modulus in the fibre
direction over time.
0.00
0.50
1.00
1.50
2.00
2.50
3.00
0
50
100
150
200
0 100 200 300 400
Tem
pert
ure
[°C]
Time [min]
Heat
cap
acity
[kJ/
(Kg°
K)]
Cc
Cm
Figure 23. Changes in the heat capacity of the resin (Cm) and
laminate (Cc).
0
500
1000
1500
2000
2500
3000
3500
0
50
100
150
200
0 100 200 300 400 500
Tem
pert
ure
[°C]
Time [min]
Mod
ulus
in tr
ansv
erse
dire
c�on
[M
Pa]
Figure 27. Changes in and range of the modulus transverse to
the fibre direction over time.
0.00
0.20
0.40
0.60
0.80
1.00
1.20
1.40
1.60
020406080
100120140160180200
0 100 200 300 400
Tem
pert
ure
[°C]
Time [min]
Dens
ity [k
g/m
³]
Figure 24. Changes in the homogenised density over time.
Figure 26. Distribution of the modulus in the fibre direction
after the curing process.
398 Journal of Composite Materials 49(4)
by guest on August 18, 2016jcm.sagepub.comDownloaded from
experimentally measured deformations are shown. Themeasurements were performed using a structured light3-D scanner, specifically the Atos system from GOM.The experimental data were analysed using GOMInspect; this software compares the measurementswith CAD references. The problem caused by usingmeasurements is that the same reference coordinatesmust always be found. For a deformed box structuresimilar to the given case, matching these coordinates isdifficult. Accordingly, there are some methods, such as‘best fit’, used to align the measured data to the CAD.This method was used in this application because areference coordinate system was not previously defined.The representation of the deviation values is differentfrom the FE representation. In the FE software, thedisplacement values are always based on a coordinatesystem. For the GOM Inspect software, the deviationsfrom the CAD data are calculated normal to the sur-face. Therefore, the absolute values are not compar-able. Figure 30 shows the deviations in the upper andthe lower sides.
The measured warpage from the upper side has aminimum value of �5.71mm and a maximum valueof 2.55mm, generating a total deformation of8.26mm. The lower side deforms from �4.56mm to2.40mm, creating a total deformation of 5.96mm.
This measurement was repeated in the CMF projectwhile using a laser tracking system to evaluate themeasurement method. This measurement reached amagnitude of 5.96mm, highlighting a general problemduring warpage analyses for large composite structures.A reliable experimental technique for validating numer-ical methods, particularly large flexible structures,including thin fuselage skins or panels, is not obvious.The definition of reference coordinate systems, thealignment of experimental data and the possibility ofcomparing equal values, such as out of plane displace-ment or deviation in the normal face direction, wouldmitigate the imprecision. However, the numericalresults show the same deformation behaviour (thebent banana shape) and a magnitude of deformationthat falls between the GOM measurements and thelaser tracking method.
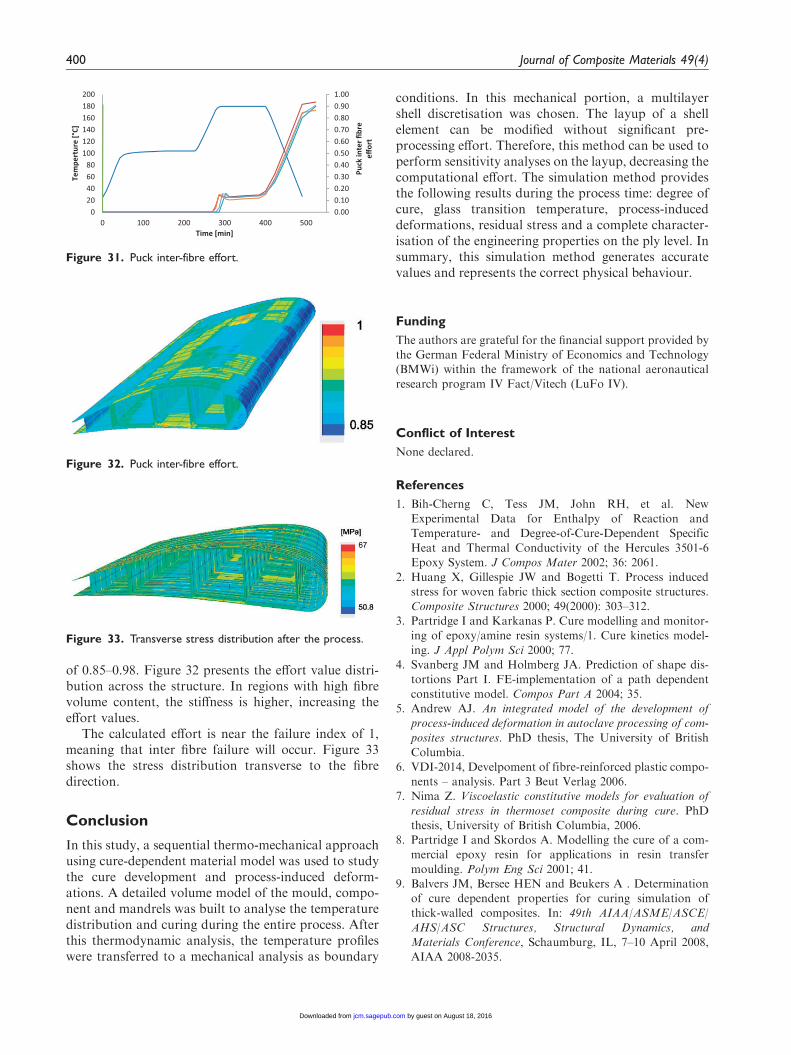
In Figure 31, the material effort is presented overtime. To condense the complex stress state, the puckinter fibre effort value was used to reduce the stresstensor to one scalar value. The position of the pointsare arbitrarily chosen.
The development of material effort begins afterreaching the gel point. This value increases strongly inthe rubber phase due to the chemical shrinkage. Thematerial effort caused by chemically induced shrinkageis approximately 15–20%. Afterwards, due to the visco-elastic effect, the effort decreases during the isothermalcuring. During the cooling phase, the thermally inducedshrinkage increases the material effort, reaching values
Figure 28. Modulus in the transverse direction at 286 min
(range 7940/19 MPa) and at the end of the process (range 10870/
7100 MPa).
Figure 29. Warpage of the composite part.
Figure 30. Measured warpage of the composite part.
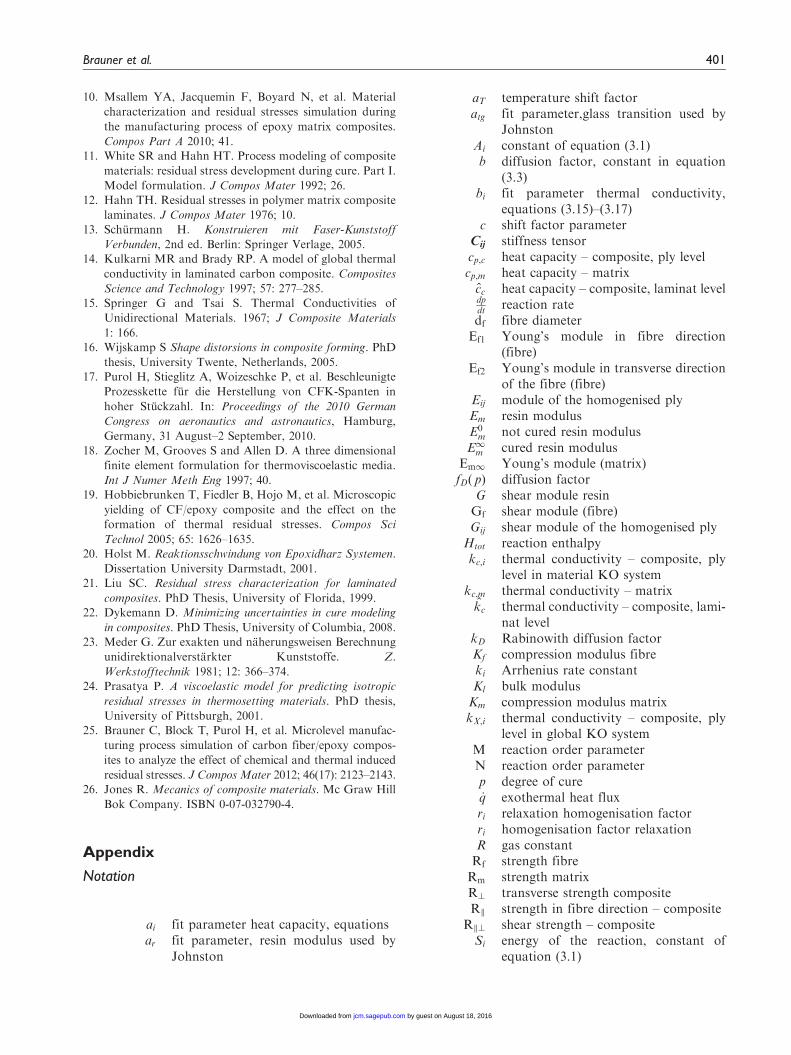
of 0.85–0.98. Figure 32 presents the effort value distri-bution across the structure. In regions with high fibrevolume content, the stiffness is higher, increasing theeffort values.
The calculated effort is near the failure index of 1,meaning that inter fibre failure will occur. Figure 33shows the stress distribution transverse to the fibredirection.
Conclusion
In this study, a sequential thermo-mechanical approachusing cure-dependent material model was used to studythe cure development and process-induced deform-ations. A detailed volume model of the mould, compo-nent and mandrels was built to analyse the temperaturedistribution and curing during the entire process. Afterthis thermodynamic analysis, the temperature profileswere transferred to a mechanical analysis as boundary
conditions. In this mechanical portion, a multilayershell discretisation was chosen. The layup of a shellelement can be modified without significant pre-processing effort. Therefore, this method can be used toperform sensitivity analyses on the layup, decreasing thecomputational effort. The simulation method providesthe following results during the process time: degree ofcure, glass transition temperature, process-induceddeformations, residual stress and a complete character-isation of the engineering properties on the ply level. Insummary, this simulation method generates accuratevalues and represents the correct physical behaviour.
Funding
The authors are grateful for the financial support provided bythe German Federal Ministry of Economics and Technology(BMWi) within the framework of the national aeronautical
research program IV Fact/Vitech (LuFo IV).
Conflict of Interest
None declared.
References
1. Bih-Cherng C, Tess JM, John RH, et al. New
Experimental Data for Enthalpy of Reaction and
Temperature- and Degree-of-Cure-Dependent Specific
Heat and Thermal Conductivity of the Hercules 3501-6Epoxy System. J Compos Mater 2002; 36: 2061.
2. Huang X, Gillespie JW and Bogetti T. Process induced
level in global KO systemM reaction order parameterN reaction order parameterp degree of cure_q exothermal heat fluxri relaxation homogenisation factorri homogenisation factor relaxationR gas constantRf strength fibreRm strength matrixR? transverse strength compositeRk strength in fibre direction – composite
Rk? shear strength – compositeSi energy of the reaction, constant of
equation (3.1)
Brauner et al. 401
by guest on August 18, 2016jcm.sagepub.comDownloaded from
T temperatureTend final glass transition temperatureTg glass transition temperatureTg1 maximum glass transition temperatureTg0 lower glass transition temperature
Tgel ðTÞ glass transition temperature at the gelpoint
T�C1 fit parameter, glass transition used byJohnston
T�Ca1 fit parameter, glass transition used byJohnston
T�Cb1 fit parameter, glass transition used byJohnston
T�C2 fit parameter, glass transition used byJohnston
T� modified glass transition temperatureused by Johnston
T�� modified glass transition temperature�ij Poission’s ratio of the homogenised plyVf fibre volume ratio�i chemical-induced shrinkage coefficients