Page 1
International Journal of Research in Science and Technology http://www.ijrst.com
(IJRST) 2017, Vol. No. 7, Issue No. II, Apr-Jun e-ISSN: 2249-0604, p-ISSN: 2454-180X
29
INTERNATIONAL JOURNAL OF RESEARCH IN SCIENCE AND TECHNOLOGY
ANALYSING THE PHYSICO CHEMICAL
CHARACTERISTICS OF TEXTILE EFFLUENT USING
VARIOUS AGRO ADSORBENTS
**M. Angeline Mary, *Rubini P S, *Soundarya M R,*Yuvashree S
** Assistant Professor, *UG Students
Department of Civil Engineering,
K.L.N.College of Information Technology,
Sivagangai- 630612.
ABSTRACT
Inthis present paper, low cost Environmental friendly agro adsorbents are used for the treatment of textile
effluent. Current methods involve the application of various chemicals thus escalating the cost of treatment.
Utilization of agricultural waste as low cost adsorbent has great significance in India where more than 200
million tons of agricultural residues are generated annually. Adsorption is the process which is inexpensive.
A number of non-conventional low cost agro adsorbents such as neem leaves, banana peel, orange peel,
garlic peel, jack fruit peel, prosopisjuliflora, calotropis gigantea latex, coconut coir, root of water hyacinth
and banana pith juice are used in our project. Properly treated agricultural residues are used as adsorbents
in our Project. Our Project main objective is to identify the low cost and adsorbent used for treating the
textile effluent. By varying the adsorbent dosage and its contact time the optimal usage of the corresponding
adsorbent were identified. The influent and the effluent were tested to identify the variation and changes in
their physical as well as chemical properties. This paper will help the textile industry to treat their effluent
more economical by using the low cost available adsorbents.
Keywords—neem leaves, banana peel, orange peel, garlic peel, jack fruit peel, prosopisjuliflora,
calotropisgigantea latex, banana pith juice, coconut coir, root of water hyacinth.
INTRODUCTION
Most of the developing countries face severe water scarcity due to ground water pollution. This
pollution mainly caused by the discharge of untreated effluent. The Indian textile industry is one the
largest sectors in the country. The textile industry consumes large quantities of water and produces
large volumes of wastewater through various steps in dyeing and finishing processes. The discharge
of toxic effluents from various industries adversely affects water resources, soil fertility, aquatic
organisms and ecosystem integrity. Wastewater from dyeing and printing units is often rich in color,
residues containing of chemicals and reactive dyes. The characteristics of textile industrial
Page 2
International Journal of Research in Science and Technology http://www.ijrst.com
(IJRST) 2017, Vol. No. 7, Issue No. II, Apr-Jun e-ISSN: 2249-0604, p-ISSN: 2454-180X
30
INTERNATIONAL JOURNAL OF RESEARCH IN SCIENCE AND TECHNOLOGY
wastewater are high biological oxygen need, high chemical oxygen need, high pH, and high
temperature. The textile waste water is rated as the most polluting among all in the industrial sectors.
The textile waste water is a complex and variable mixture of polluting substances. The pollutants
released from these processes are very dangerous and it is very necessary to treat the textile effluent.
The waste water treatment is mostly by primary and secondary processes. The textile wastewater
containing dye substances is not only toxic to the biological world, its dark color blocks sunlight that
leads to severe problems to the ecosystem. However, these conventionalmethods of treatment are not
very efficient in removal of pollutants such as dissolved solids, color, trace metals etc. The advance
treatment methods, while reducing these pollutants also give scope for recovery and recycling. The
usual treatment processes like physical and chemicalmethods such as coagulation, flocculation,
adsorption, membrane filtration and irradiation. (Robinson et al., 2001) achieve gooddecolorizing
efficiency but they have two main constraints high cost and the production of the significant amount
of sludge material that requires final disposal again. Among all the methods adsorption is one of the
most effective methods of removing dyes from waste sewage (Deans and Dixon, 1992; Nigam et al.,
2000). The process of adsorption has an advantage over the other methods due to its sludge free
operation and complete removal of dyes even from dilute solutions. Activated carbons have been
extensively utilized in various industrial adsorption and separation processes because of its efficient
adsorption of the organic compound. However there are a number of drawbacks in utilization for
decolourisationlike higher cost and operational losses such as combustion athigh temperature, pore
blocking and hygroscopicity. Recently, a considerable amount of research has been undertaken to
findcheapersubstitutions to activated carbon.
Developmentsof new strategies of making use of low cost, easily availablebiological and
agricultural waste materials for theadsorption process is gaining much importance to replace
activatedcarbon.Due to high energy consumption or application of variety of chemicals, this would
decrease the efficiency and increase cost of process. The adsorption is the process which seems to be
the better alternative to other processes. A wide range of adsorbent are used to treat large quantity of
textile effluent as a cost effective technique. It has potential advantages over the conventional
methods as adsorption technique is low cost, high efficiency on heavy metal removal and
discoloration, less use of chemicals, regeneration characteristics, minimum waste and recycling of
water. In our studies we designed to exploit the abundantly available agricultural wastes for the
treatment of textile effluents to remove color, pH, turbidity, suspended solids, TDS, COD, BOD,
sulphide, phosphate.
MATERIALS AND METHODS
TEXTILE WASTEWATER
Our raw textile wastewater sample was collected from Tirupur industry. Samples were
collected in sampling bottles and preserved at 4℃ for analysis. The physicochemical parameters such
as pH, turbidity, chemical oxygen demand (COD), biological oxygen demand (BOD) and Total
suspended solids (TSS) were estimated before and after the treatment of water samples.
Page 3
International Journal of Research in Science and Technology http://www.ijrst.com
(IJRST) 2017, Vol. No. 7, Issue No. II, Apr-Jun e-ISSN: 2249-0604, p-ISSN: 2454-180X
31
INTERNATIONAL JOURNAL OF RESEARCH IN SCIENCE AND TECHNOLOGY
PREPARATION OF ADSORBENTS
Different agro adsorbents (neem leaves, banana peel, orange peel, garlic peel,
prosopisjuliflora, calotropisgigantea latex, root of water hyacinth,jack fruit peel,banana pith juice and
coconut coir) werecollected andrinsed several times with distilled water. The cleaned adsorbents were
dried under sun and then it was oven dried.The dried adsorbents were ground to powder and then
sieved to get fine particles.Each particle were sieved accordingly to their particle sizes using sieve set
and stored in air tight container.
BATCH STUDIES
Batch studies were carried out at room temperature to study the effects of important
parameters such as effect of adsorbent dosage, shaking speed and contact time..A fixed amount of
prepared adsorbent was placed in 250ml conical flask with known adsorbent dosage. Then the flask
was agitated using orbital shaker and jar test apparatus. The supernatant solution thus obtained was
filtered using filter paper and the physical and chemical parameters were examined. All the
experiments were performed in triplicate and reported values are mean±SD. The concentration of dye
solution is determined by using UV Spectrometer.
The %age of dye removal was calculated by using the following relationship:
%Removal = 𝐼𝑛𝑖𝑡𝑖𝑎𝑙 𝐴𝑏𝑠−𝐹𝐼𝑛𝑎𝑙 𝐴𝑏𝑠
𝐼𝑛𝑖𝑡𝑖𝑎𝑙 𝐴𝑏𝑠 x 100
EFFECT OF ADSORBENT DOSAGE
Adsorbent dosage is an important parameter in order to determine the adsorbent’s capacity
for a given amount of the adsorbate at the operating conditions. Effect of adsorbent dosage was
investigated by using different adsorbent doses (0.05, 0.1, 0.15 and 0.2g) 50mL-1
.The effect of
adsorbent dosage on the adsorption process can be carried out by preparing adsorbent–adsorbate
solution with different amount of adsorbents and shaken together until equilibrium time. Generally,
the percentage of removal increases with increasing adsorbent dosage. Initially the rate of increase in
the percent removal has been found to be rapid which slowed down as the dose increased. This
phenomenon can be explained based on the fact that, at lower adsorbent dosage the adsorbate is
more easily accessible.
With rise in adsorbent dose, there is less commensurate increase in adsorption, resulting from
many sites remaining unsaturated during the adsorption. But after a certain dosage the removal
efficiency is insignificant with respect to increase in dose. This is due to the fact that, at higher
adsorbent dosage there is a very fast superficial adsorption onto theadsorbent surface that produces a
minimum solute concentration in the solution than when adsorbent dosage is lower.
EFFECT OF CONTACT TIME
The effect of contact time on adsorption can be carried out by preparing adsorbent–adsorbate
solution with fixed adsorbent dose for different time intervals and shaken until equilibrium.
Generally the rate of removal increases with an increase in contact time to a certain limit. Further
increase in contact time does not increase the uptake due to deposition of effluent on the available
Page 4
International Journal of Research in Science and Technology http://www.ijrst.com
(IJRST) 2017, Vol. No. 7, Issue No. II, Apr-Jun e-ISSN: 2249-0604, p-ISSN: 2454-180X
32
INTERNATIONAL JOURNAL OF RESEARCH IN SCIENCE AND TECHNOLOGY
adsorption site on adsorbent material. The time required to attain this state of equilibrium is termed
the equilibrium time and it reflects the maximum adsorption capacity of the adsorbent under those
operating conditions.
Table 1
Influent Characteristics
PARAMETER UNITS BIS VALUE TESTED EFFLUENT
VALUE
pH - 6.5 – 8.5 9.5
Turbidity NTU 10 81.5
Suspended Solids mg/L 100 1800
BOD5 mg/l 30 502
COD mg/l 250 990
Sulphide mg/l 2.0 .46
Total Dissolved
Solids (TDS)
ppm 2100 6780
Iron mg/l 3.0 0.16
Phosphate mg/l 5.0 19
RESULT AND DISCUSSION
PHYSICO CHEMICAL CHARACTERIZATION OF TEXTILE EFFLUENT
The Influent characteristics of the samples were identified and the values are given in Table 1.After
using the adsorbents there was a change noticed in the Effluent characteristic before and after adsorption
trials for pH, Turbidity, COD, BOD, TDS and TSS and the values of these parameters are given in Table
2.Using the natural agro adsorbents plays a vital role in the removal of the organic pollutants present in
the wastewater samples i.e the textile effluent.
Page 5
International Journal of Research in Science and Technology http://www.ijrst.com
(IJRST) 2017, Vol. No. 7, Issue No. II, Apr-Jun e-ISSN: 2249-0604, p-ISSN: 2454-180X
33
INTERNATIONAL JOURNAL OF RESEARCH IN SCIENCE AND TECHNOLOGY
Table 2: Effluent Characteristics
EFFECT OF pH
pH is an important physical parameter to measure the quality of water. A general recommendation is
that the water having pH below 6.5 and above 8.5 is not reasonable for public consumption. TDS refers to
any minerals, salts, metals cation, or anion dissolved in water. The result indicate a decrease in COD,
TDS, TSS and other physico-chemical parameters after the treatment of textile effluents through
adsorption(using agro adsorbents) which shows that adsorption process is effective for the treatment of
textile effluents.The response of each adsorbents with the variation of pH is shown in Fig 1 to Fig 10.
Fig 1:Dosage Vs pH value using Neam leaf Fig 2:Dosage Vs pH value using Orange peel
0
2
4
6
8
10
1 2 3 4 5 6 7
9.4 9.1 8.7 8.2 7.8 7.8 7.9
pH
ADSORBENT DOSAGE (g/50ml)
NEEM LEAF
9.35
9.4
9.45
9.5
1 2 3 4 5
9.5
9.47
9.43
9.4 9.4
pH
ADSORBENT DOSAGE (g/50ml)
ORANGE PEEL
PARAMETER pH Turbidity TSS BOD5
COD
NEEM LEAF 7.5 20.5 400 120 300
ORANGE PEEL 8.1 25.6 406 135 240
BANANA PEEL 8.5 30.3 500 420 200
GARLIC PEEL 7.9 40.5 1000 450 193.5
WATER HYACINTH 9.2 25.3 155 99.8 922.8
BANANA PITH JUICE 7.6 78.3 200 455.6 901.1
JACKFRUIT PEEL 8.9 80.1 1490 500 450
PROSOPIS JULIFLORA 8.8 79.8 1500 355.8 560.3
CALOTROPIS GIGANTEA 9.5 77.3 300 502 921.6
COCONUT COIR DUST
7.2 17.6 1700 467.8 777.8
Page 6
International Journal of Research in Science and Technology http://www.ijrst.com
(IJRST) 2017, Vol. No. 7, Issue No. II, Apr-Jun e-ISSN: 2249-0604, p-ISSN: 2454-180X
34
INTERNATIONAL JOURNAL OF RESEARCH IN SCIENCE AND TECHNOLOGY
Fig 3:Dosage Vs pH value using Water Hyacinth RootFig 4: Dosage Vs pH value using Prosopis juliflora
Fig 5: Dosage Vs pH value using Garlic peel Fig 6: Dosage Vs pH value using Banana peel
Fig 7 :Dosage Vs pH value using Banana pith juice
Fig 8:Dosage Vs pH value using Calotropisgigantea
9
9.2
9.4
9.6
1 2 3 4 5
9.5
9.3 9.299.2 9.2
pH
ADSORBENT DOSAGE (g/50ml)
WATER HYACINTH ROOT
8.5
9
9.5
1 2 3 4 5
9.4 9.349.18
8.98.8
pH
ADSORBENT DOSAGE (g/50ml)
PROSOPIS JULIFLORA
0
5
10
1 2 3 4 5
9.5 9.5 9.5 9.5 9.5
pH
ADSORBENT DOSAGE (g/50ml)
GARLIC PEEL
8.8
9
9.2
9.4
1 2 3 4 5
9.4
9.29.1 9.1 9.1
pH
ADSORBENT DOSAGE (g/50ml)
BANANA PEEL
5
7
9
11
1 2 3 4 5
9.5 9.18.5 8.1
7.6
pH
ADSORBENT DOSAGE (ml/50ml)
BANANA PITH JUICE
5
10
1 2 3 4 5 6
9.5 9.5 9.5 9.5 9.5 9.5
pH
ADSORBENT DOSAGE (g/50ml)
CALOTROPIS GIGANTEA
Page 7
International Journal of Research in Science and Technology http://www.ijrst.com
(IJRST) 2017, Vol. No. 7, Issue No. II, Apr-Jun e-ISSN: 2249-0604, p-ISSN: 2454-180X
35
INTERNATIONAL JOURNAL OF RESEARCH IN SCIENCE AND TECHNOLOGY
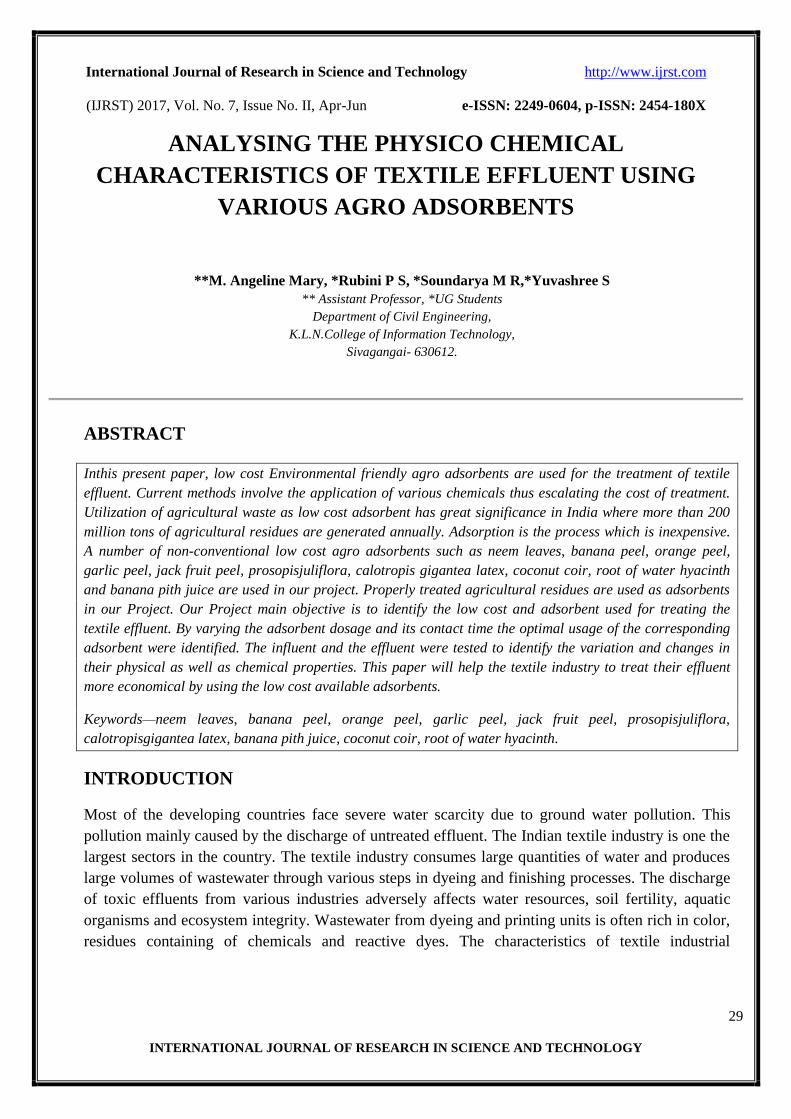
Fig 9 :Dosage Vs pH value using Jackfruit peel
Fig 10 :Dosage Vs pH value using Coconut Coir
From the above graph, we know that by varying the dosage as 1gm, 2gm, 3 gm…..the
removal deficiency of the adsorbent varies correspondingly. An increase in the dose due to the
increase in removal efficiency. Among the ten adsorbents coconut coir has a good efficient to
remove pH by the optimum dosage of 5gm.
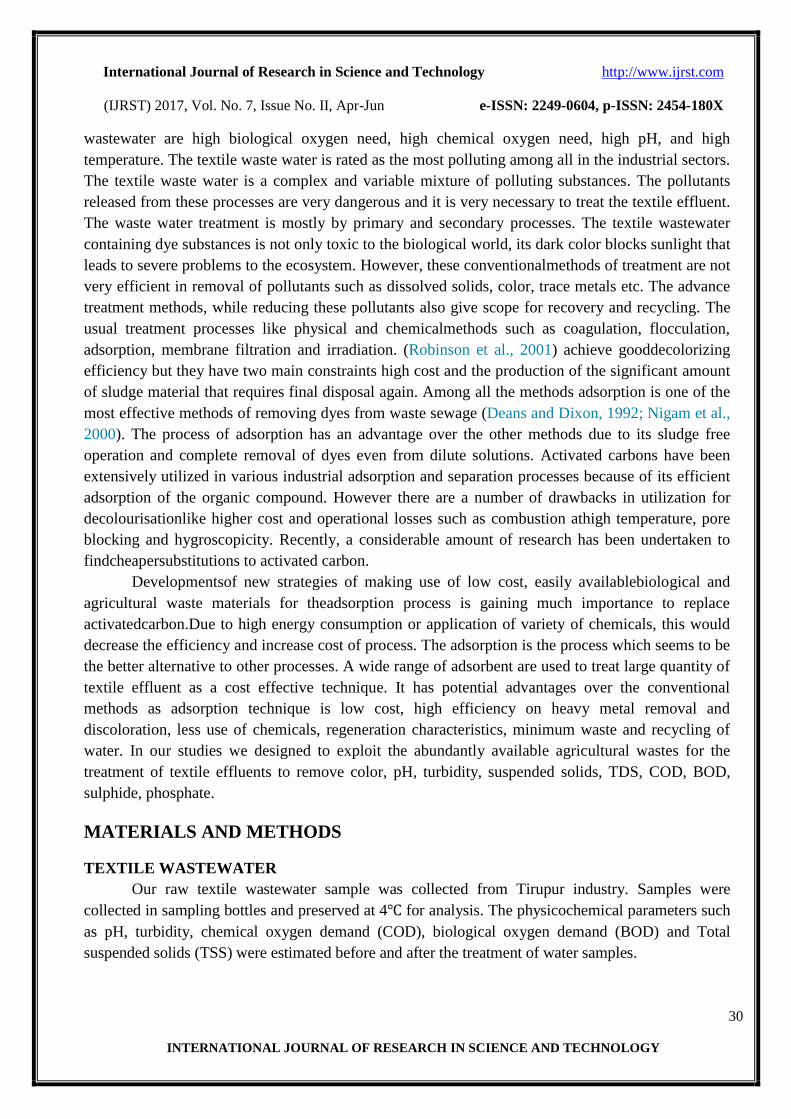
EFFECT OF TURBIDITY
Turbidity is the major pollutant parameter found in the textile effluent due to the presence
of suspended solids. The variation of Turbidity with the adsorbent dosage is given in the below graph.
Fig 11: Dosage Vs Turbidity value using Neem leafFig 12 :Dosage Vs Turbidity value using Orange peel
Fig 13 :Dosage Vs Turbidity value using banana Peel Fig 14 :Dosage Vs Turbidity value using Waterhyacinth root
8.6
8.8
9
9.2
9.4
1 2 3 4 5
9.359.27
9.09
8.9 8.9
pH
ADSORBENT DOSAGE (g/50ml)
JACK FRUIT PEEL
5
7
9
1 2 3 4 5 6
8.78.1
7.47 7.2 7.2 7.2
pH
ADSORBENT DOSAGE (g/50ml)
COCONUT COIR
0 20 40 60 801
3
5
7
71.2
59.4
41
32
27
25.5
25.5
TURBIDITY (NTU)
AD
SO
RB
EN
T
DO
SA
GE
(g
/50
ml)
NEEM LEAF
72 74 76 78 80 82
1
2
3
4
5
80.1
78
76.4
75.5
75.5
TURBIDITY (NTU)
AD
SO
RB
EN
T
DO
SA
GE
(g
/50
ml)
ORANGE PEEL
79.5 80 80.5 81 81.5
1
2
3
4
5
81.1
80.9
80.7
80.2
80.2
TURBIDITY (NTU)
AD
SO
RB
EN
T
DO
SA
GE
(g/5
0m
l)
BANANA PEEL
9 9.1 9.2 9.3 9.4 9.5
1
2
3
4
5
9.5
9.3
9.29
9.2
9.2
TURBIDITY (NTU)
AD
SO
RB
EN
T
DO
SA
GE
(g
/50
ml)
WATER HYACINTH ROOT
Page 8
International Journal of Research in Science and Technology http://www.ijrst.com
(IJRST) 2017, Vol. No. 7, Issue No. II, Apr-Jun e-ISSN: 2249-0604, p-ISSN: 2454-180X
36
INTERNATIONAL JOURNAL OF RESEARCH IN SCIENCE AND TECHNOLOGY
Fig 15 :Dosage Vs Turbidity value using ProsopisjulifloraFig 16 :Dosage Vs Turbidity value using Garlic peel
Fig 17 :Dosage Vs Turbidity value using BananaPith juice Fig 18 :Dosage Vs Turbidity value using Jackfruit peel
Fig 19 :Dosage Vs Turbidity value using Calotropis gigantean Fig 20 :Dosage Vs Turbidity value using Coconut Coir
From the result obtained we have plotted the graph. Coconut coir has the good ability to
remove turbidity form the textile effluent with the optimum dosage of 6gm for the 50 ml effluent.
EFFECT OF SUSPENDED SOLIDS
Suspended solids are those solids which remain floating in textile effluent. It is
calculated by varying the adsorbent dosage and its contact time with the effluent.
79 79.5 80 80.5 81
1
2
3
4
5
81
80.6
79.8
79.8
79.8
TURBIDITY (NTU)
AD
SO
RB
EN
T
DO
SA
GE
(g
/50
ml)
PROSOPIS JULIFLORA
79.5 80 80.5 81 81.5
1
2
3
4
5
81.3
81.1
80.2
80.2
80.2
TURBIDITY (NTU)
AD
SO
RB
EN
T
DO
SA
GE
(g
/50
ml)
GARLIC PEEL
76 77 78 79 80 81 82
1
2
3
4
5
81.5
81.3
80
78.3
78.3
TURBIDITY (NTU)
AD
SO
RB
EN
T
DO
SA
GE
(g
/50
ml)
BANANA PITH JUICE
78 80 82 84
1
2
3
4
5
6
81
80.1
80.1
80.1
80.1
84
TURBIDITY (NTU)
AD
SO
RB
EN
T
DO
SA
GE
(g
/50
ml)
JACK FRUIT PEEL
74 76 78 80 82
1
2
3
4
5
6
80.9
79
77.3
77.3
77.3
77.3
TURBIDITY (NTU)
AD
SO
RB
EN
T
DO
SA
GE
(g
/50
ml)
CALOTROPIS GIGANTEA
0 20 40 60 80
1
2
3
4
5
6
70
55
36.7
23.4
17.8
17.6
TURBIDITY (NTU)
AD
SO
RB
EN
T
DO
SA
GE
(g
/50
ml)
COCONUT COIR
Page 9
International Journal of Research in Science and Technology http://www.ijrst.com
(IJRST) 2017, Vol. No. 7, Issue No. II, Apr-Jun e-ISSN: 2249-0604, p-ISSN: 2454-180X
37
INTERNATIONAL JOURNAL OF RESEARCH IN SCIENCE AND TECHNOLOGY
Fig 21 :Dosage Vs TSS value using Neem leaf Fig 22 :Dosage Vs TSS value using Orange peel
Fig 23 :Dosage Vs TSS value using Banana peel Fig 24 :Dosage Vs TSS value using waterhyacinth root
Fig 25 :Dosage Vs TSS value using Prosopis JulifloraFig 26 :Dosage Vs TSS value using Garlic peel
Fig 27 :Dosage Vs TSS value using Banana pith juiceFig 28 :Dosage Vs TSS value using Jackfruit peel
0 500 1000 1500
1
3
5
7
14091020
912409
321201
115
TSS (mg/l)
AD
SO
RB
EN
T
DO
SA
GE
(g
/50
ml)
NEEM LEAF
0 500 1000 1500 2000
1
2
3
4
5
1797
1501
1379
1156
1000
TSS (mg/l)
AD
SO
RB
EN
T
DO
SA
GE
(g
/50
ml)
ORANGE PEEL
0 500 1000 1500 2000
1
2
3
4
5
1701
1625
1520
1390
1197
TSS(mg/l)
AD
SO
RB
EN
T
DO
SA
GE
(g
/50
ml)
BANANA PEEL
0 500 1000 1500 2000
1
2
3
4
5
1550
925
734
346
155
TSS (mg/l)
AD
SO
RB
EN
T
DO
SA
GE
(g
/50
ml)
WATER HYACINTH ROOT
1300 1400 1500 1600 1700 1800
1
2
3
4
5
1750
1699
1623
1591
1500
TSS (mg/l)
AD
SO
RB
EN
T
DO
SA
GE
(g
/50
ml)
PROSOPIS JULIFLORA
0 500 1000 1500 2000
1
2
3
4
5
1609
1473
1294
1009
895
TSS (mg/l)
AD
SO
RB
EN
T
DO
SA
GE
(g
/50
ml)
GARLIC PEEL
0 500 1000 1500 2000
1
2
3
4
5
1800
1510
770
420
200
TSS (mg/l)
AD
SO
RB
EN
T
DO
SA
GE
(m
l/5
0m
l)
BANANA PITH JUICE
1300 1400 1500 1600 1700 1800
1
2
3
4
5
6
1709
1643
1593
1501
1490
1490
TSS (mg/l)
AD
SO
RB
EN
T
DO
SA
GE
(g
/50
ml)
JACK FRUIT PEEL
Page 10
International Journal of Research in Science and Technology http://www.ijrst.com
(IJRST) 2017, Vol. No. 7, Issue No. II, Apr-Jun e-ISSN: 2249-0604, p-ISSN: 2454-180X
38
INTERNATIONAL JOURNAL OF RESEARCH IN SCIENCE AND TECHNOLOGY
Fig 29 :Dosage Vs TSS value using Calotropis gigantean Fig 30:Dosage Vs TSS value using CoconutCoir
From the experimental study, we know that the suspended solids are removed
efficiently by neem leaf powder.
EFFECT OF BOD
Fig 31 :Dosage Vs BOD value using NeemFig 32 :Dosage Vs BOD value using Orange peel
Fig 33 :Dosage Vs BOD value using Banana peelFig 34 :Dosage Vs BOD value using Water hyacinth root
1650 1700 1750 1800
1
2
3
4
5
6
1787
1760
1749
1721
1700
1700
TSS (mg/l)
AD
SO
RB
EN
T
DO
SA
GE
(g
/50
ml)
COCONUT COIR DUST
0
100
200
300
400
500
1 2 3 4 5
447
304269
151100.3
AD
SO
RB
EN
T
DO
SA
GE
(g
/50
ml)
BOD (mg/l)
ORANGE PEEL
0 100 200 300 400
1
2
3
4
5
397
221
109
99.8
99.8
BOD (mg/l)
AD
SO
RB
EN
T D
OS
AG
E
(g/5
0m
l))
WATER HYACINTH ROOT
0 500 1000 1500 2000
1
2
3
4
5
6
1554
1104
873
625
412
300
TSS (mg/l)
AD
SO
RB
EN
T
DO
SA
GE
(g
/50
ml)
CALOTROPIS GIGANTEA
0
100
200
300
400
500
1 2 3 4 5 6 7
403
321258
209
11545.8 45.8
AD
SO
RB
EN
T
DO
SA
GE
(g
/50
ml)
BOD (mg/l)
NEEM LEAF
499 500 501 502
1
2
3
4
5
502
501
500.9
500.1
500.1
BOD (mg/l)
AD
SO
RB
EN
T D
OS
AG
E
(g/5
0m
l)
BANANA PEEL
Page 11
International Journal of Research in Science and Technology http://www.ijrst.com
(IJRST) 2017, Vol. No. 7, Issue No. II, Apr-Jun e-ISSN: 2249-0604, p-ISSN: 2454-180X
39
INTERNATIONAL JOURNAL OF RESEARCH IN SCIENCE AND TECHNOLOGY
Fig 35 :Dosage Vs BOD value using Prosopis Juliflora Fig 36:Dosage Vs BOD value using Bananapith juice
Fig 37 :Dosage Vs BOD value using Garlic peelFig 38 :Dosage Vs BOD value using Jackfruit
Fig 39 :Dosage Vs BOD value using Calotropis giganteanFig 40 :Dosage Vs BOD value usingCoconutCoir
If sufficient oxygen is available in textile effluent, the useful aerobic bacteria will
flourish and cause the aerobic biological decomposition of textile effluent. Which will continue
until oxidation is completed. The amount of oxygen consumed in this process is the BOD. By
varying the adsorbent dosage the results obtained in plotted in the above graph. From the result we
know that neem leaf powder is the best adsorbent to remove BOD.
420 440 460 480 500 520
1
2
3
4
5
502
500.5
496.7
455.6
455.6
BOD(mg/l)
AD
SO
RB
EN
T
DO
SA
GE
(g
50
ml)
BANANA PITH JUICE
499 500 501 502
1
2
3
4
5
6
502
501.7
501.1
500
500
500
BOD (mg/l)
AD
SO
RB
EN
T
DO
SA
GE
(g
50
ml)
JACK FRUIT PEEL
450 460 470 480 490 500
1
2
3
4
5
6
493
486.4
475.8
469.3
468
467.8
BOD (mg/l)
AD
SO
RB
EN
T D
OS
AG
E
(g5
0m
l)
COCONUT COIR
0 100 200 300 400 500
1
2
3
4
5
491
463
401
355
355
BOD (mg/l)
AD
SO
RB
EN
T D
OS
AG
E
(g/5
0m
l)
PROSOPIS JULIFLORA
496 498 500 502
1
2
3
4
5
501.7
499.4
499
498.3
498.3
BOD (mg/l)
AD
SO
RB
EN
T
DO
SA
GE
(g
/50
ml)
GARLIC PEEL
480 490 500 510 520 530 540
1
2
3
4
5
6
502
502
510
519
523
531
BOD (mg/l)
AD
SO
RB
EN
T D
OS
AG
E
(g5
0m
l)
CALOTROPIS GIGANTEA
Page 12
International Journal of Research in Science and Technology http://www.ijrst.com
(IJRST) 2017, Vol. No. 7, Issue No. II, Apr-Jun e-ISSN: 2249-0604, p-ISSN: 2454-180X
40
INTERNATIONAL JOURNAL OF RESEARCH IN SCIENCE AND TECHNOLOGY
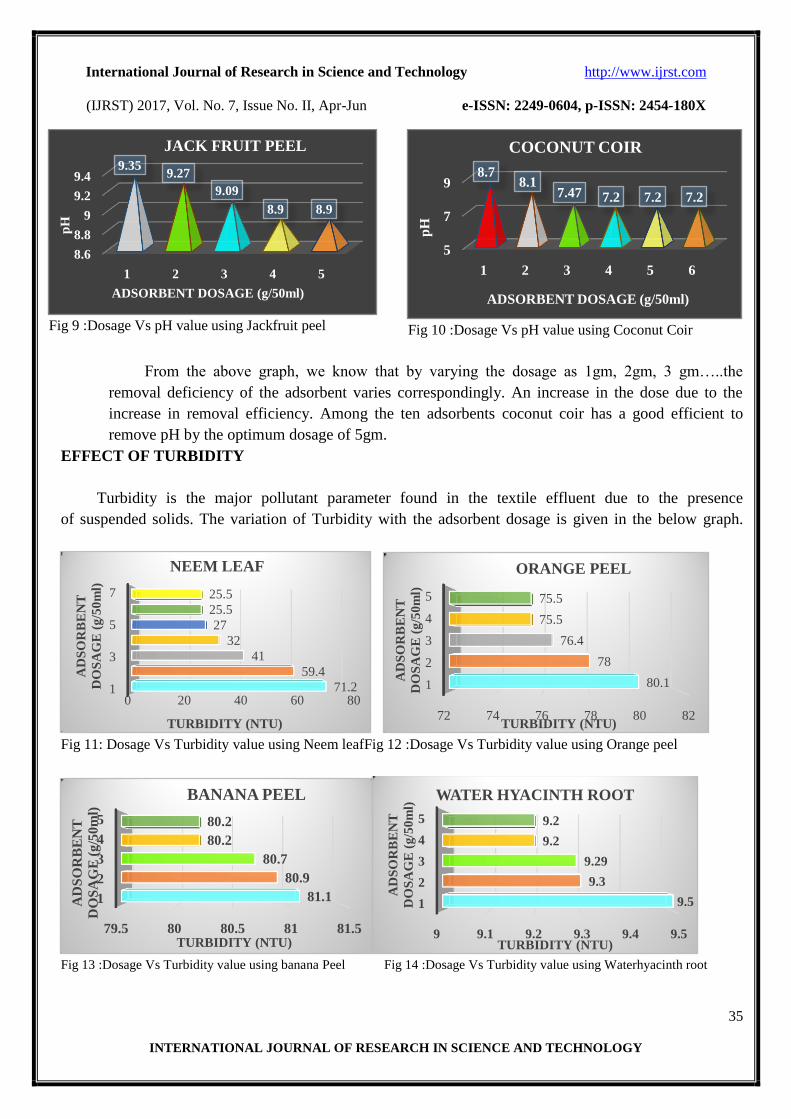
EFFECT OF COD
Organic matter is most often assessed in terms of oxygen required to completely
oxidise the organic matter to CO2,H2O and other oxidized species. The COD of textile effluent is
computed and plotted below in Fig :41 toFig: 50. From the graph we can use jack fruit peel for the
removal of COD.
Fig 41 :Dosage Vs COD value using Neem leaf Fig 42 :Dosage Vs COD value using Orange peel
Fig 43 :Dosage Vs COD value using Banana peelFig 44 :Dosage Vs COD value using Water hyacinth
Fig 45 :Dosage Vs COD value using Prosopis julifloraFig 46 :Dosage Vs COD value using Garlic peel
850 900 950 1000
1
2
3
4
5
974
949
933
900
900
COD (mg/l)A
DS
OR
BE
NT
DO
SA
GE
(g/5
0m
l)
ORANGE PEEL
880 900 920 940 960 980 1000
1
2
3
4
5
981
963
944
922.8
922.8
COD (mg/l)
AD
SO
RB
EN
T D
OS
AG
E
(g/5
0m
l)
WATER HYACINTH ROOT
970 975 980 985 990
1
2
3
4
5
989
989
983
977.2
977.2
COD(mg/l)
AD
SO
RB
EN
T D
OS
AG
E
(g/5
0m
l)
GARLIC PEEL
975 980 985 990
1
2
3
4
5
6
7
989.3
988.6
983.5
981
980
980
980
COD (mg/l)
AD
SO
RB
EN
T D
OS
AG
E
(g/5
0m
l)
NEEM LEAF
850 900 950 1000
1
2
3
4
5
981
961
943
903
899.1
COD (mg/l)
AD
SO
RB
EN
T D
OS
AG
E
(g/5
0m
l)
BANANA PEEL
0 200 400 600 800 1000
1
2
3
4
5
977
951
803
631
560.3
COD (mg/l)
AD
SO
RB
EN
T D
OS
AG
E
(g/5
0m
l)
PROSOPIS JULIFLORA
Page 13
International Journal of Research in Science and Technology http://www.ijrst.com
(IJRST) 2017, Vol. No. 7, Issue No. II, Apr-Jun e-ISSN: 2249-0604, p-ISSN: 2454-180X
41
INTERNATIONAL JOURNAL OF RESEARCH IN SCIENCE AND TECHNOLOGY
Fig 47 :Dosage Vs COD value using Banana pith
Fig 48 :Dosage Vs COD value using Jackfruit peel
Fig 49 :Dosage Vs COD value using CalotropisGiganteaFig 50 :Dosage Vs COD value using Coconut Coir
REMOVAL EFICIENCY
In order to identify which is the apt adsorbent for the treatment of textile effluent. All
the parameters are compared with the removal efficiency of the adsorbents. The comparsion chart
is plotted below.
Fig 51 :% of pH removal Vs adsorbents
0 200 400 600 800 1000
1
2
3
4
5
6
978
899
623
559
482
450
COD (mg/l)
AD
SO
RB
EN
T D
OS
AG
E
(g/5
0m
l)
JACK FRUIT PEEL
0 200 400 600 800 1000
1
2
3
4
5
6
970.6
899
865
828
789.7
777.8
COD (mg/l)
AD
SO
RB
EN
T D
OS
AG
E
(g/5
0m
l)
COCONUT COIR
0%
5%
10%
15%
20%
25%
17.89
1.05
4.21
0
3.16
20
6.317.36
0
24.21
% O
F p
H R
EM
OV
AL
ADSORBENTS
850 900 950 1000
1
2
3
4
5
990
973
942.3
911
901.1
COD (mg/l)
AD
SO
RB
EN
T D
OS
AG
E
(g/5
0m
l)
BANANA PITH JUICE
880 900 920 940 960 980 1000
1
2
3
4
5
6
987
981
973
955.7
935
921.6
COD (mg/l)
AD
SO
RB
EN
T D
OS
AG
E
(g/5
0m
l)
CALOTROPIS GIGANTEA
Page 14
International Journal of Research in Science and Technology http://www.ijrst.com
(IJRST) 2017, Vol. No. 7, Issue No. II, Apr-Jun e-ISSN: 2249-0604, p-ISSN: 2454-180X
42
INTERNATIONAL JOURNAL OF RESEARCH IN SCIENCE AND TECHNOLOGY
Fig 52 :% of COD removal Vs adsorbents
Fig 53 :% of TURBIDITY removal Vs adsorbents
Fig 54 :% of TSS removal Vs adsorbents
0%
10%
20%
30%
40%
50%
60%
211 10.3
2.38.2 9.7
53.241.2
8.1
18.2
% O
F C
OD
RE
MO
VA
L
ADSORBENTS
0%
10%
20%
30%
40%
50%
60%
70%
80% 68.71
7.361.22
1.59
6.89
3.92 1.712.09
5.15
78.4
% O
F T
UR
BID
ITY
RE
MO
VA
L
ADSORBENTS
0%
20%
40%
60%
80%
100% 93.61
44.44
38.06
50.28
91.39 88.89
17.22 16.67
83.33
5.55
% O
F T
SS
RE
MO
VA
L
ADSORBENTS
Page 15
International Journal of Research in Science and Technology http://www.ijrst.com
(IJRST) 2017, Vol. No. 7, Issue No. II, Apr-Jun e-ISSN: 2249-0604, p-ISSN: 2454-180X
43
INTERNATIONAL JOURNAL OF RESEARCH IN SCIENCE AND TECHNOLOGY
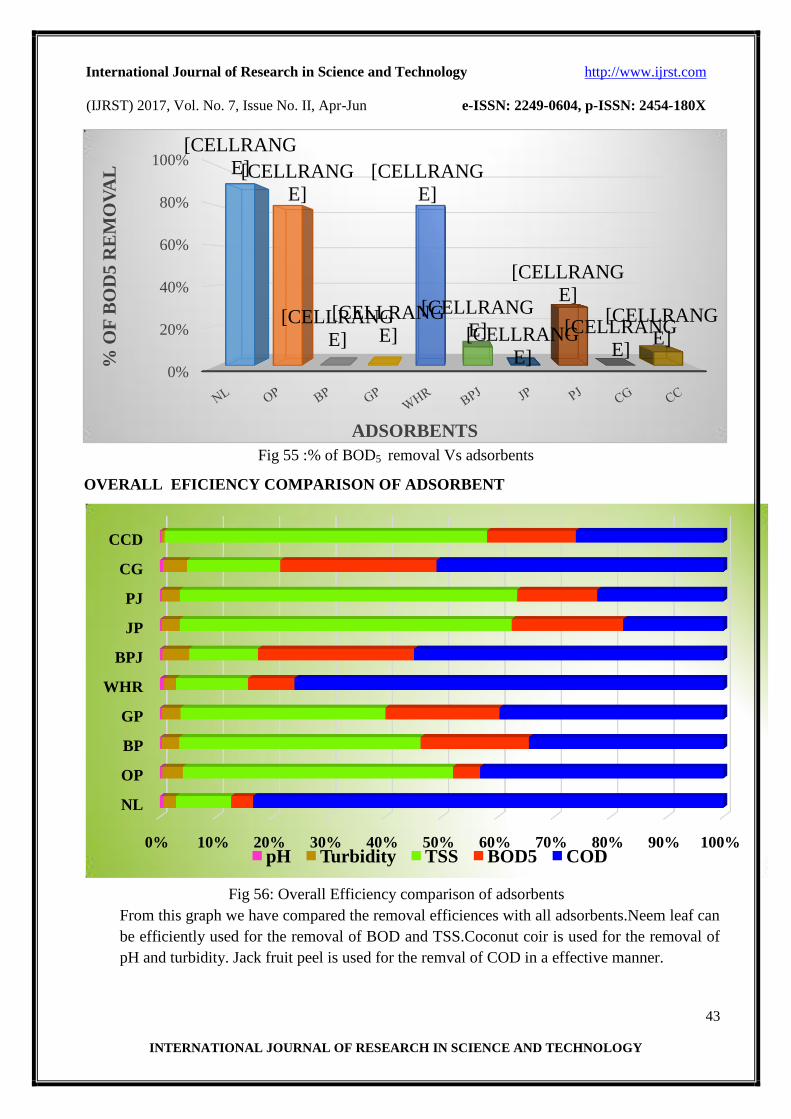
Fig 55 :% of BOD5 removal Vs adsorbents
OVERALL EFICIENCY COMPARISON OF ADSORBENT
Fig 56: Overall Efficiency comparison of adsorbents
From this graph we have compared the removal efficiences with all adsorbents.Neem leaf can
be efficiently used for the removal of BOD and TSS.Coconut coir is used for the removal of
pH and turbidity. Jack fruit peel is used for the remval of COD in a effective manner.
0%
20%
40%
60%
80%
100%[CELLRANG
E][CELLRANG
E]
[CELLRANG
E]
[CELLRANG
E]
[CELLRANG
E]
[CELLRANG
E][CELLRANG
E]
[CELLRANG
E]
[CELLRANG
E]
[CELLRANG
E]
% O
F B
OD
5 R
EM
OV
AL
ADSORBENTS
0% 10% 20% 30% 40% 50% 60% 70% 80% 90% 100%
NL
OP
BP
GP
WHR
BPJ
JP
PJ
CG
CCD
pH Turbidity TSS BOD5 COD
Page 16
International Journal of Research in Science and Technology http://www.ijrst.com
(IJRST) 2017, Vol. No. 7, Issue No. II, Apr-Jun e-ISSN: 2249-0604, p-ISSN: 2454-180X
44
INTERNATIONAL JOURNAL OF RESEARCH IN SCIENCE AND TECHNOLOGY
CONCLUSION
The use of these low cost eco-friendly adsorbents is recommended since they are relatively cheap or
of no cost, easily available, renewable and show highly affinity for dyes. The process of adsorption
requires further investigation in the direction of modeling, regeneration of adsorbent and immobilization
of the waste material for enhanced efficiency and recovery. Neem, orange peel, banana peel, garlic peel,
juliflora and water hyacinth showed maximum efficiency for treatment of textile wastewater. Different
parameters were optimized during the study and best removal was obtained with several adsorbent.
Hence our project focuses to identify the adsorbents suitable for the maximum parameter removal and
thus by making a membrane with all the apt adsorbent. Hence this project will give a way to choose the
adsorbent that will give maximum removal efficiency of various parameters in the textile effluent.
ACKNOWLEDGEMENT
First of all we would like to thank our almighty Lord for making us to complete the project.Second
our sincere thanks to our Faculty Ms.M.Angeline Mary for his valuable guidance and support in
completing the project.Our sincere thanks to our family and friends in collection of the samples and
adsorbents.
REFERENCES
1. S. Abinaya, D. Shanthini, and S. Grija, “Colour removal from textile effluent using agro
adsorbents,” – A Review.Internatinal journal of Civil Engineering and Technology, 7(6),
November – December 2016, pp.278-281.
2. Shubhra Bhattacharjee, “Adsorptive removal of methylene blue using azadiracha indica (Neem)
leaf,” in International Research Journal of Environment Sciences, Vol.5(1), 21-24, January
(2016).
3. Asfaram, M.R. Fathi,S. Khodadoust and M. Naraki “Removalof Direct Red 12B by garlic peel
as a cheap adsorbent,” in Spectrochimica Acta Part A: Molecular and Biomolecular
Spectroscopy 127 (2014) 415-421.
4. Meena Soni, Ashok K. Sharma, Jitendra K. Srivastava and Jageet S. Yadav , “Adsorptive
removal of methylene blue dye from an aqueous solution using water hyacinth root powder as a
low cost adsorbent,”in International Journal of Chemical Sciences and Applications, Vol. 3,
Issue 3, 2012, pp. 338-345.
5. R.S. Mane and V.N. Bhusari, “Removal of colour from textile effluent by adsorption using
orange and banana peel,”in International Journal of Engineering Research and Applications,
Vol.2, Issue 3, May-Jun 2012, pp.1997-2004.
6. G.L.Gopika and K. Mophin kani, “Accessing the suitability of using banana pith juice as a
natural coagulant for textile wastewater treatment,” in International Journal of Scientific and
Engineering Research, Vol. 7, Issue 4, April 2016.
Page 17
International Journal of Research in Science and Technology http://www.ijrst.com
(IJRST) 2017, Vol. No. 7, Issue No. II, Apr-Jun e-ISSN: 2249-0604, p-ISSN: 2454-180X
45
INTERNATIONAL JOURNAL OF RESEARCH IN SCIENCE AND TECHNOLOGY
7. M. Jayarajan, K. Arunachalam and G. Annadurai, “Agricultural wastes of jackfruit peel nano-
porous adsorbent for removal of rhodamine dye,” in Asian Journal of Applied Sciences4(3):263-
270,2011.
8. U.J. Etim, S.A. Umoren and U.M. Eduok, “Coconut coir dust as a low cost adsorbent for the
removal of cationic dye from aqueous solution,” in Journal of Saudi Chemistry Society (2016)
20, S67-S76.
9. P. Balaji, B. Vignesh, M. Sowmiya, M. Meena and L. Lokesh “Removal of colour from textile
effluent using natural adsorbent (Calotrpis Gingantea),” in International Journal of Innovation in
Engineering and Technology, Vol.5, Issue 4, August 2015.
10. N. Gopal and M. Asaithambi “Adsorption of acid blue- 40 (A Textile Dye) using prosopis
juliflora activated carbon embedded in polyaniline matrix,” in Rasiyan J.Chem, Vol.8, No. 3,
July-September 2015.
11. Monika Kharub “Use of various technologies, methods and adsorbents for the removal of dye,”
in Journal of Environmental Research and Development, Vol.6, No. 3A, Jan-March 2012.