Page 1
1
Thesis Report On
ANALYSIS AND IMPROVEMENT OF JACKING SYSTEMS FOR JACK-UP RIG
Submitted by
NG JUN JIE U048851X
Department of Mechanical Engineering
In partial fulfillment of the requirements for the Degree of
Bachelor of Engineering National University of Singapore
Session 2007/2008
Page 2
i
SUMMARY
As the need for energy increases globally, explorers have went out deeper
and deeper into the ocean for oil and gas which forms the world’s main
energy source. Jack-up rigs, which is one of the offshore structures that is
used in today’s extraction of oil from the seabed, is being analyzed.
This paper attempts to provide an insight to improving the fatigue life of the
lifting mechanism which comprises of the rack and pinion of a jack-up rig
by reducing the mean stress.
A practical model of a rack and pinion in a jack-up rig is modeled using
CAD and simulations are run on the model using finite element method
programs. The strength of the structure would be evaluated according to the
analysis results.
A study of the optimum fillet radius for the contact stress between the rack
and pinion is proposed which helps in reducing the fatigue failures by cyclic
loading of jack-ups.
Page 3
ii
Acknowledgement
The author wishes to express his sincere gratitude to his guide, A/P Mr. H.P Lee, for his
valuable guidance, proper advice and constant encouragement during the course or his
work on this project.
The author also feel very much obliged to his co-supervisor, Dr. X.M Tan, Research
Scientist at Institute of High Performance Computing for his encouragement and
inspiration for execution of the project work.
The author is deeply indebted to his parents for their inspiration and ever encouraging
moral support, which enabled him to pursue his studies.
The author is also very thankful to the entire faculty and staff members of Mechanical
Engineering Department for their direct–indirect help and cooperation.
Page 4
iii
TABLE OF CO"TE"TS
Title Page "umber
Summary ................................................................................ i
Acknowledgement ................................................................. ii
Table of Contents ................................................................. iii
List of Figures ........................................................................ v
List of Tables ...................................................................... viii
1. Introduction ....................................................................... 1
1.1 Thesis Outline ........................................................... 2
2. Literature Review .............................................................. 2
2.1 Jack-up Rigs ............................................................. 2
2.2 Types of Jack-up Units ............................................. 3
2.3 Types of Leggings..................................................... 4
2.4 Modes of Operations in a Jack-up ............................. 5
2.4.1 Afloat Transit Mode ..................................... 6
2.4.2 Preload Mode ............................................... 7
2.4.3 Elevated Mode ............................................. 8
2.5 Lifting Mechanism – Rack and Pinion ...................... 8
2.6 Failures of Jack-up Rigs ............................................ 9
2.6.1 Failure of Jack-up Rigs by Fatigue ............. 10
Page 5
iv
2.6.2 Stress Reduction by Use of Fillets ............... 12
3. Problem Definition .......................................................... 13
3.1 Implementation ....................................................... 14
4. Numerical Investigation ................................................... 14
4.1Mesh sensitivity ....................................................... 14
4.1.1 Results ........................................................ 15
4.2 FEM model ............................................................. 16
4.3 Boundary Conditions .............................................. 21
4.3.1 Displacement .............................................. 22
4.3.2 Pressure ....................................................... 23
4.3.3 Contact ........................................................ 24
4.4 Material .................................................................. 25
5. Results ............................................................................. 26
5.1 Stress against Fillet Radius ..................................... 26
5.2 Plastic Strain against Fillet Radius ........................... 32
5.3 Displacement against Fillet Radius .......................... 38
6. Conclusion ....................................................................... 44
7. Recommendations ........................................................... 45
8. References ....................................................................... 46
Page 6
v
List of Figures
1. Different working depths of offshore units.
2. Photograph of an offshore Jack-up in operation.
3. Top plane diagrams of (a) 4-legged jack-ups (b) 3-legged jack-ups.
4. Photographs of (a) cylindrical legs (b) truss legs.
5. Photograph of (a) Jack-up with legs retracted. (b) Jack-up under tow
(c) Jack-up on a loading vessel, accompanied by supporting towboats.
6. Photograph of a Jack-up Rig under preload conditions.
7. Diagram of a Jack-up Rig under transition.
8. Photograph of a Rack and Pinion system.
9. Case Histories classified according to causes of failures.
10. Causes of Jack-up Rigs During period of 1979 to 1988.
11. Schematic diagram of contact of pinion and rack with varying fillet radius.
12. Diagram of the changes in mesh sensitivity (a) Mesh = 0.015 (b) Mesh
=0.075 (c) Mesh =0.025 (d) Mesh =0.00125.
13. Table and Graph of Stress against Mesh Size.
14. Different views of rack model.
15. Different views of pinion model.
16. Different views of Rack and Pinion Configuration.
17. Comparison of Model with and without Fillets.
18. The pinion is constrained in all the three directions.
Page 7
vi
19. The rack’s top and bottom is constrained in the x and y directions.
20. The rack’s side is constrained in the x direction.
21. Bottom elements are given pressure.
22. (a) Slave nodes of the rack (b) Master nodes of the pinion.
23. Overview of contact surface of the model.
24. Stress Variation in Rack and Pinion when fillet radius, r = 0mm.
25. Stress Variation in Rack and Pinion when fillet radius, r = 2.5mm.
26. Stress Variation in Rack and Pinion when fillet radius, r = 5mm.
27. Stress Variation in Rack and Pinion when fillet radius, r = 6.25mm.
28. Stress Variation in Rack and Pinion when fillet radius, r = 6.875mm.
29. Stress Variation in Rack and Pinion when fillet radius, r = 7.2mm.
30. Stress Variation in Rack and Pinion when fillet radius, r = 7.5mm.
31. Stress Variation in Rack and Pinion when fillet radius, r = 8.125mm.
32. Stress Variation in Rack and Pinion when fillet radius, r = 8.75mm.
33. Stress Variation in Rack and Pinion when fillet radius, r = 10mm.
34. Graph of Stress Against Fillet Radius.
35. Plastic Strain Variation in Rack and Pinion when fillet radius, r = 0mm.
36. Plastic Strain Variation in Rack and Pinion when fillet radius, r = 2.5mm.
37. Plastic Strain Variation in Rack and Pinion when fillet radius, r = 5mm.
38. Plastic Strain Variation in Rack and Pinion when fillet radius, r = 6.25mm.
39. Plastic Strain Variation in Rack and Pinion when fillet radius, r =
6.875mm.
Page 8
vii
40. Plastic Strain Variation in Rack and Pinion when fillet radius, r = 7.2mm.
41. Plastic Strain Variation in Rack and Pinion when fillet radius, r = 7.5mm.
42. Plastic Strain Variation in Rack and Pinion when fillet radius, r =
8.125mm.
43. Plastic Strain Variation in Rack and Pinion when fillet radius, r = 8.75mm.
44. Plastic Strain Variation in Rack and Pinion when fillet radius, r = 10mm.
45. Graph of Plastic Strain against Fillet Radius.
46. Displacement Variation when fillet radius, r= 0mm.
47. Displacement Variation when fillet radius, r= 2.5mm.
48. Displacement Variation when fillet radius, r= 5mm.
49. Displacement Variation when fillet radius, r= 6.25mm.
50. Displacement Variation when fillet radius, r= 6.875mm.
51. Displacement Variation when fillet radius, r= 7.2mm.
52. Displacement Variation when fillet radius, r= 7.5mm.
53. Displacement Variation when fillet radius, r= 8.125mm.
54. Displacement Variation when fillet radius, r= 8.75mm.
55. Displacement Variation when fillet radius, r= 10mm.
56. Graph of Displacement Against Fillet Radius.
Page 9
viii
List of Tables
1. Results of mesh element size and corresponding highest stress.
2. Table of property of steel
3. Table of Results of Fillet radius and Stress
4. Table of Results of Fillet radius and Strain
5. Table of Results of Fillet radius and Displacement
Page 10
1
1. Introduction The continuously rising oil price has been driving oil companies to put increasingly more
efforts in exploring and producing oil from the sea. The demand for oil has pushed
explorers to venture deeper and deeper into the ocean. There are now a lot of facilities
used for the extraction of oil from the seabed. They vary from Jack-ups to drill ships.
They are used in different environments and they are used for different sea depths. Figure
1 illustrates further on the different working depths of the mobile offshore units.
Fig 1: Different working depths of offshore units
Jack-up rigs are capable of working in sea depths up to 400ft (121m). For
semisubmersible rigs, they usually work up to a depth of 3280ft (1000m) [9]. Lastly,
drillships are usually used in very deep waters to extract oil from the seabed.
Jack-up rigs are mobile and they would be towed from one place to another after the
original oil site has either low production and cannot meet the demand or it is no longer
commercially profiteering to produce from that well. The legs of the jack-up would
Page 11
2
retract and extended during the transition. The upwards and downwards linear motion of
the lifting mechanism- the rack and pinion, would be experiencing stress repeatedly. It is
then proposed through the chamfering of the rack edges, to reduce the maximum contact
stress and thus increasing its fatigue life.
The purpose of this project is to conduct a parametric study of the relationship between
highest contact stress and the fillet radius of the rack edge.
1.1. Thesis Outline
Chapter 2 provides an introduction to the jack-up rig and some of the causes of failures
that offshore mobile units undergo. The chapter also goes through some of the past
statistics of jack-up rigs failures and its causes. Chapter 3 presents the problem of the
prevailing jack-up rigs and the numerical approach to solve for the optimum solution.
Chapter 4 shows the lifting mechanism which the rack and pinion is being developed into
a CAD model. It also presents the boundary conditions used in the simulation of real
environmental loads as well as the material properties. Chapter 5 presents the findings of
the simulations. Chapter 6 gives the conclusion of the study done. Lists of
recommendations are made in Chapter 7.
2. Literature Review
2.1 Jack-ups Rigs
Jack-up rigs are used in the exploration of oil since the 1950’s. They have been used for
exploration drilling, tender assisted drilling, production, accommodation, and work or
maintenance platforms. [1]
Page 12
3
A Jack-up rig is an offshore structure composed of a hull, legs and a lifting system that
allows it to be towed to a site, lower its legs into the seabed and elevate its hull to provide
a stable work deck capable of withstanding the environmental loads.
Jack-up rigs are used because they can be towed to another oil well after the well
production no longer can produce the required demand. A fixed platform would be
similar to a jack-up rig just that it is only built at that particular worksite and cannot be
moved. Jack-up rigs are thus more expensive to build than a fixed platform.
Fig 2: Photograph of an offshore Jack-up in operation
2.2 Types of Jack-up Units
There are typically 3-legged and 4-legged jack-ups in the world today. However the
majority of the jack-ups that are produced are 3 legged. [1]
The advantages of 4-legged jack-ups are that they have more work space as they require
no preload tankage and they are usually stiffer in the elevated mode because of the extra
leg. It is also because of the extra leg that the jack-up would experience additional wind,
(a) (b)
Page 13
4
current and wave conditions. In the afloat transit mode, the jack-up would also have a
greater draught due to the weight of the additional leg.
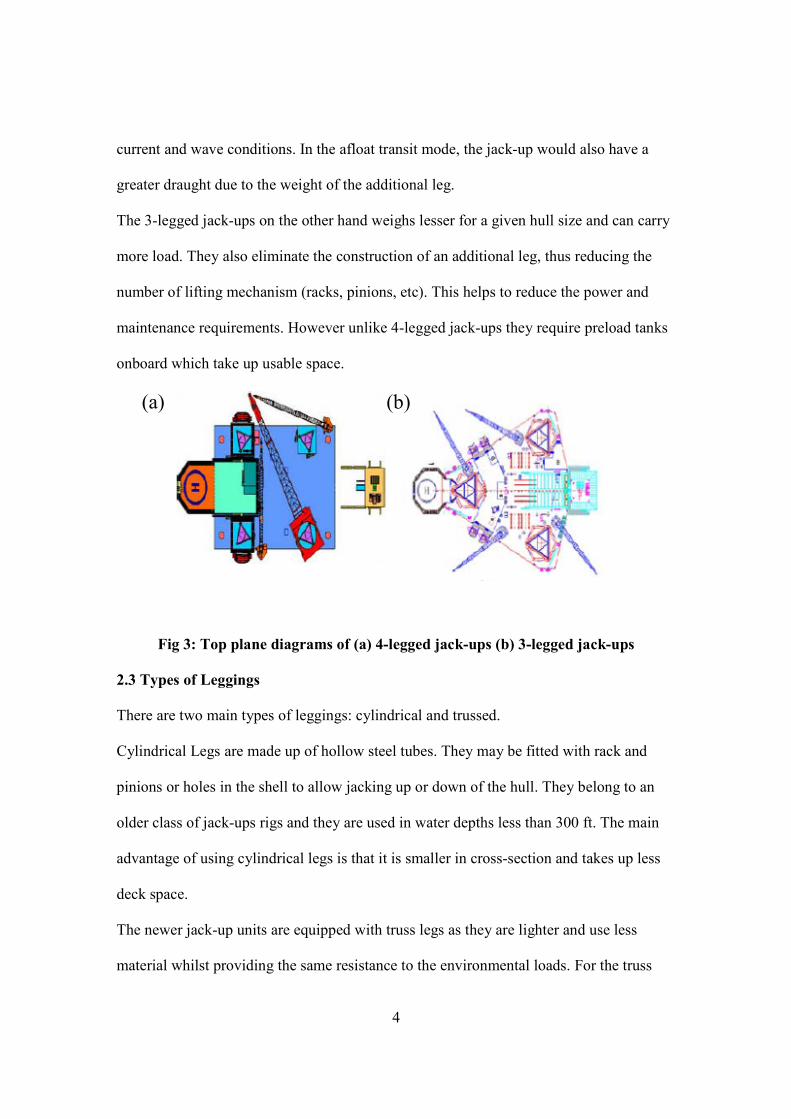
The 3-legged jack-ups on the other hand weighs lesser for a given hull size and can carry
more load. They also eliminate the construction of an additional leg, thus reducing the
number of lifting mechanism (racks, pinions, etc). This helps to reduce the power and
maintenance requirements. However unlike 4-legged jack-ups they require preload tanks
onboard which take up usable space.
Fig 3: Top plane diagrams of (a) 4-legged jack-ups (b) 3-legged jack-ups
2.3 Types of Leggings
There are two main types of leggings: cylindrical and trussed.
Cylindrical Legs are made up of hollow steel tubes. They may be fitted with rack and
pinions or holes in the shell to allow jacking up or down of the hull. They belong to an
older class of jack-ups rigs and they are used in water depths less than 300 ft. The main
advantage of using cylindrical legs is that it is smaller in cross-section and takes up less
deck space.
The newer jack-up units are equipped with truss legs as they are lighter and use less
material whilst providing the same resistance to the environmental loads. For the truss
(a) (b)
Page 14
5
legs to be able to match the strength of the cylindrical legs, one must carefully consider
its flexural and axial strength of the trusses’ chords and braces.
Fig 4: Photographs of (a) cylindrical legs (b) truss legs
2.4 Modes of Operations of a Jack-up
There are basically 3 types of modes a jack-up would experience when transiting from an
work site to another. They are the afloat transit mode, preload mode and the elevated
mode.
2.4.1 Afloat Transit Mode
When the hull of a jack-up is lowered from its elevated mode, the legs are retracted and
they leave the seabed. It is not necessary to full retract the legs as long as they have
enough clearance from the seabed. This would increase stability of the jack-up and
reduces the risk of wind overturning. The jack-up floats on the sea on its own hull and it
(a) (b)
Page 15
6
is towed by several towboats to the location. In some other cases, the jack-up unit is
brought up onto the deck of another vessel. In this case, the legs of the jack-up unit must
be retracted to the maximum before loading onto the loading vessel.
Fig 5: Photograph of (a) Jack-up with legs retracted. (b) Jack-up under tow
(c) Jack-up on a loading vessel, accompanied by supporting towboats.
2.4.2 Preload Mode
The jack-up unit has to be preloaded to simulate operating conditions. In this mode, the
hull is jacked up slowly to a height no more than 5 feet above the sea level. By pumping
in seawater from the surroundings to the onboard preload tanks, the hull carries extra
weight apart from its own weight. In this mode, there are chances that a leg shift or soil
failure might occur. If that happens, the jack-up would lose its balance, dropping its hull
(c)
(b) (a)
Page 16
7
into the water. The consequences are kept to a minimal as the hull is near the water, thus
reducing the wave impact.
For the 4-legged jack-up rigs, there is little or no preload water. It is usually done by
preloading 2 of its diagonally opposite legs by the weight of the hull itself. After settling
occurs, the 2 legs are lifted slightly to bring the other 2 legs to its preload period. After
the 4 legs are settled, the hull is then brought up to its operating height.
Fig 6: Photograph of a Jack-up Rig under preload conditions
2.4.3 Elevated Mode
Once the hull is in the operating height, the brakes are set and its weight lies fully on the
strength of the legs. The jack-up rig is ready to begin operations. Figure 7 illustrates the
various modes of operation from arriving at the oil site to operational mode.
Page 17
8
Fig 7: Diagram of a Jack-up Rig under transition
2.5 Lifting Mechanism – Rack and Pinion
All Jack-ups have mechanisms for lifting and lowering the hull. Majority of Jack-ups are
equipped with a Rack and Pinion system for continuous jacking operations. The power
sources used for jacking include both electric and hydraulic. Figure 8 shows a typical
rack and pinion system found on a jack-up rig.
Page 18
9
Fig 8: Photograph of a Rack and Pinion system
One point to take note is that the cross-sectional thickness of the pinion is usually larger
than the thickness of the rack. This is to prevent slipping of the rack off the pinion.
2.6 Failure of Jack-up Rigs
According to a report by MSL Engineering Ltd prepared for Health and Safety Executive
in 2004, 53% of the failures that jack-up rigs experiences is due to punch through of the
legs. Other causes include uneven seabed, volcanic activities, unexpected penetration of
the legs, sliding of mat foundation and mudslide.
Page 19
10
Fig 9: Case Histories classified according to causes of failures
2.6.1 Failure of Jack-up Rigs by Fatigue
In high cycle fatigue situations, materials performance is normally characterized by the
S-N curve. The graph depicts of a cyclical stress(S) against cycles to failures (N). Failure
due to repeated loading is called fatigue.
Fatigue failures are often caused by the degradation of metal surface. A rough surface
finish, a scratch or oxidation will provide an initial crack. Cracks will propagate after
cyclical loading and eventually lead to fatigue failure.
Page 20
11
The factor that determines fatigue failure is mean stress. As the mean stress decreases, the
fatigue life increases. The defects on the contact surface will cause a decrease in the life
of a material. As such, sharp corners which stresses concentrate on will probably be the
first where cracks will occur and propagate.
In another paper by B. P. M. Sharpies, W. T. Bennett, Jr and J. C. Trickey, it spoke of the
failures that jack-up rigs experience due to a certain factor during the period 1979 to 1988.
Fatigue was one of the factors with 13 accidents out of the 226 accidents that occurred
during this period.
Page 21
12
Fig 10: Causes of Jack-up Rigs During period of 1979 to 1988
2.6.2 Stress Reduction by Use of Fillets
Gears develop high stress concentration at the gear tooth root stress and the contact point.
It is usually at these areas where there is a higher chance of fatigue failure. In normal
operations the contact point shifts along the profile of the tooth and a surface fatigue
failure is likely. In the normal jack up operation, the rack and pinion is held in place after
the hull is at its operational height. In this case, the contact point between the rack and
pinion will stay in one place for an extended period of time. This is when the relief
features are needed to reduce the highest stress at the contact point. Fatigue life will be
increased if fillets are introduced at the contact point.
Vasilios [21] introduces another method to find the minimum fillet stress using BEM and
further verification has been done using 2D photoelasticity. Math [20] proposes an
approach to determine the geometry of the spur gear tooth fillet. Equations have been set
up for the tangency of the involute curve and root fillet.
Page 22
13
3. Problem Definition
The hull is supported by the Jack-up’s lifting mechanism; the consequences would be
catastrophic if the rack and pinion were to fail by fatigue. In recurring instances of
jacking up and down the legs due to its mobile nature, the rack and pinion experiences
repeated contact stress at sharp corners, especially at the edges of the rack. The cyclic
nature of loading and unloading the hull causes the rack to fail possibly by fatigue.
Therefore, it is paramount that the rack and pinion has relief features in areas where the
highest stress occurs. Presently there are no studies on this aspect of study. This is a new
area of study to look into. It could have possible tremendous positive impacts if this were
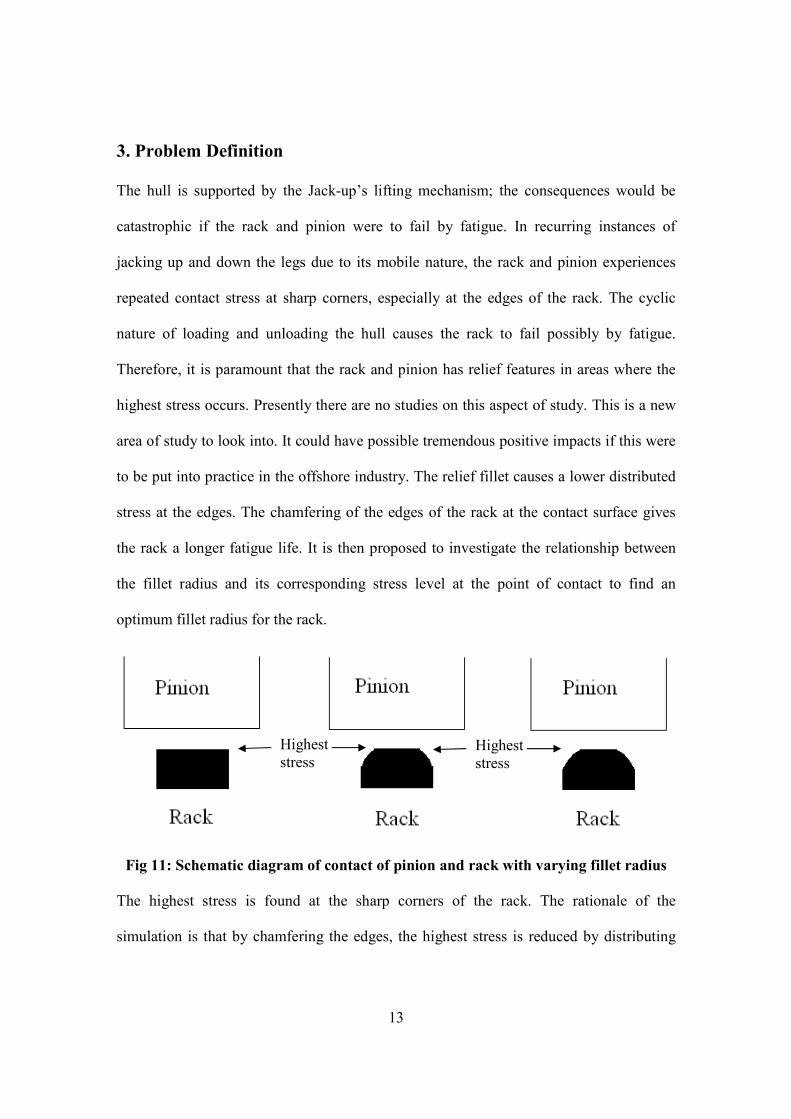
to be put into practice in the offshore industry. The relief fillet causes a lower distributed
stress at the edges. The chamfering of the edges of the rack at the contact surface gives
the rack a longer fatigue life. It is then proposed to investigate the relationship between
the fillet radius and its corresponding stress level at the point of contact to find an
optimum fillet radius for the rack.
Fig 11: Schematic diagram of contact of pinion and rack with varying fillet radius
The highest stress is found at the sharp corners of the rack. The rationale of the
simulation is that by chamfering the edges, the highest stress is reduced by distributing
Highest
stress Highest
stress
Page 23
14
the stress around the fillet radius. However with larger fillet radius, the area of contact of
the rack with the pinion is reduced. There is a point where the highest stress will start to
increase with larger fillet radius. The aim of this simulation is to find out the optimum
fillet radius.
3.1. Implementation
Software used: -
Modeling using Solidworks 2005, transferring of coordinates to MSC Patran 2005r3 and
analysis is done using Abaqus Version 6.41.
4. "umerical Investigation
4.1 Mesh Sensitivity
A study of varying element size on the rack surface has been done for convergence
purposes. This study is done on the purpose that the computational result does not deviate
too much from the actual stress. The convergence test is done on a single model.
Table 1: Results of mesh element size and corresponding highest stress
Mesh size (mm) HighestStress (Pa)
0.00125 7.55E+08
0.0025 7.53E+08
0.0075 7.36E+08
0.015 7.10E+08
Page 24
15
\
Fig 12: Diagram of the changes in mesh sensitivity (a) Mesh = 0.015 (b) Mesh =0.075
(c) Mesh =0.025 (d) Mesh =0.00125
4.1.1 Results
The results of convergence are shown in the form of a table and graph shown below.
(a) (b)
(c) (d)
Page 25
16
Graph of Stress against Mesh Size
5.00E+08
5.50E+08
6.00E+08
6.50E+08
7.00E+08
7.50E+08
8.00E+08
0 0.002 0.004 0.006 0.008 0.01 0.012 0.014 0.016
Mesh Size (mm)
Str
ess,
σ (
Pa))
Fig 13: Table and Graph of Stress against Mesh Size
The graph above shows the variation of element size and its corresponding stress. It
shows that even after the element size has been halved to 0.00125, the stress deviate from
the previous stress by less than 1%. Thus it would be more computationally expensive to
use element size of 0.00125 and below. It would be fairly accurate to use element size of
0.0025 in area of analysis.
4.2 FEM model
The model is based on a practical Rack and Pinion that is in a commercial Jack-up. The
original Rack and Pinion has been cut into half since it is symmetrical about its central
plane.
The rack is modeled and meshed as shown in Figure 15. Similarly the pinion can be
found in Figure 16. The final rack and pinion configuration is shown in Figure 17.
Finally, a contrast is shown between a rack with and without fillets in Figure 18.
Page 26
17
The FEM model is made up of all solid tetrahedral elements.
Page 27
18
Fig 14: Different views of rack model
Page 28
19
Fig 15: Different views of pinion model
Page 30
21
Fig 16: Different views of Rack and Pinion Configuration
Fig 17: Comparison of Model with and without Fillets
4.3 Boundary Conditions
The model has boundary conditions like displacement, pressure and contact.
Page 31
22
4.3.1 Displacement
Firstly the pinion is given the boundary condition that the inner bore is constrained in all
the 3 directions. Figure 19 shows the boundary condition given to the pinion.
Fig 18: The pinion is constrained in all the three directions
Page 32
23
Fig 19: The rack’s top and bottom is constrained in the x and y directions
Fig 20: The rack’s side is constrained in the x direction
4.3.2 Pressure
The rack is given an upwards pressure of 1 kipf/sq in (6.89 MPa) and is applied at the
bottom surfaces of bottom elements.
Page 33
24
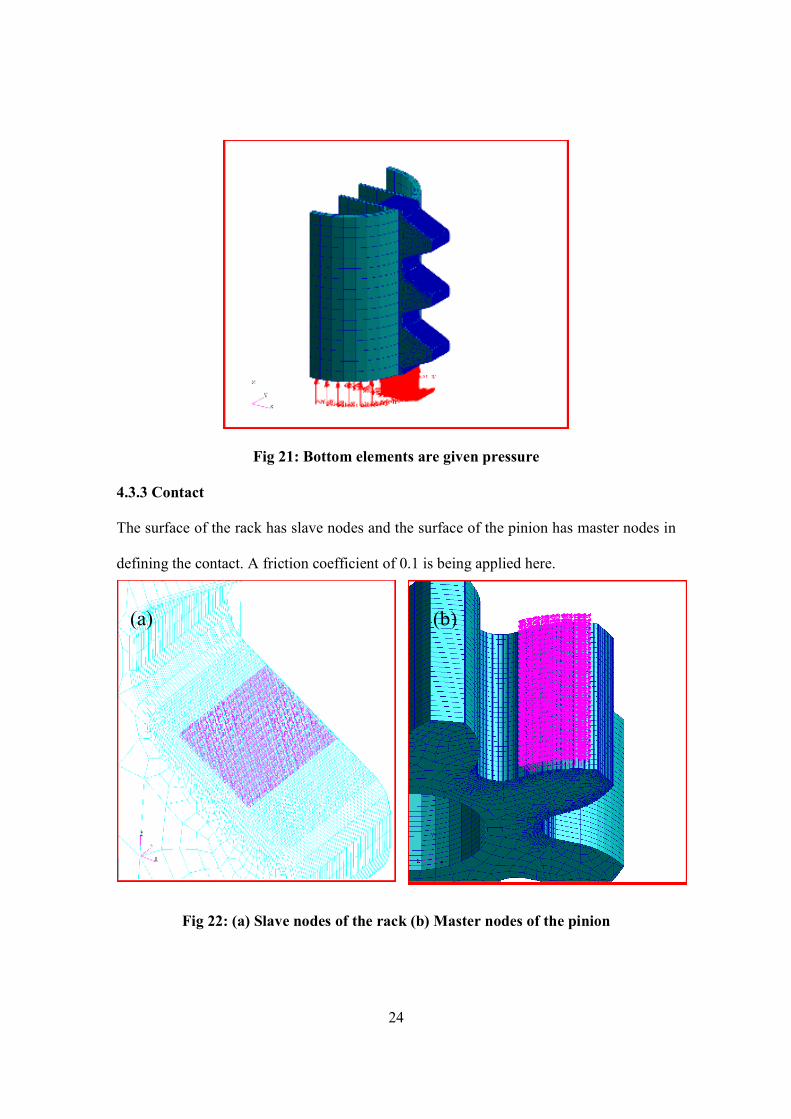
Fig 21: Bottom elements are given pressure
4.3.3 Contact
The surface of the rack has slave nodes and the surface of the pinion has master nodes in
defining the contact. A friction coefficient of 0.1 is being applied here.
Fig 22: (a) Slave nodes of the rack (b) Master nodes of the pinion
(a) (b)
Page 34
25
Fig 23: Overview of contact surface of the model
4.4 Material
All the models are given the property of steel. The properties of steel are presented in a
form of graph below.
Table 2: Table of property of steel
Properties of Steel
Elastic Modulus 2e11 Pa
Poisson Ratio 0.3
Density 7850 kg/m3
Yield Stress 7.24e8 Pa
Page 35
26
5. Results
The results of the simulations can be summarized into the following: Stress variation
against fillet radius, plastic strain against fillet radius and displacement against fillet
radius.
5.1 Stress Variation against Fillet radius
The following results are presented in the form of pictures shown below.
Fig 24: Stress Variation in Rack and Pinion when fillet radius, r = 0mm
Page 36
27
Fig 25: Stress Variation in Rack and Pinion when fillet radius, r = 2.5mm
Fig 26: Stress Variation in Rack and Pinion when fillet radius, r = 5mm
Page 37
28
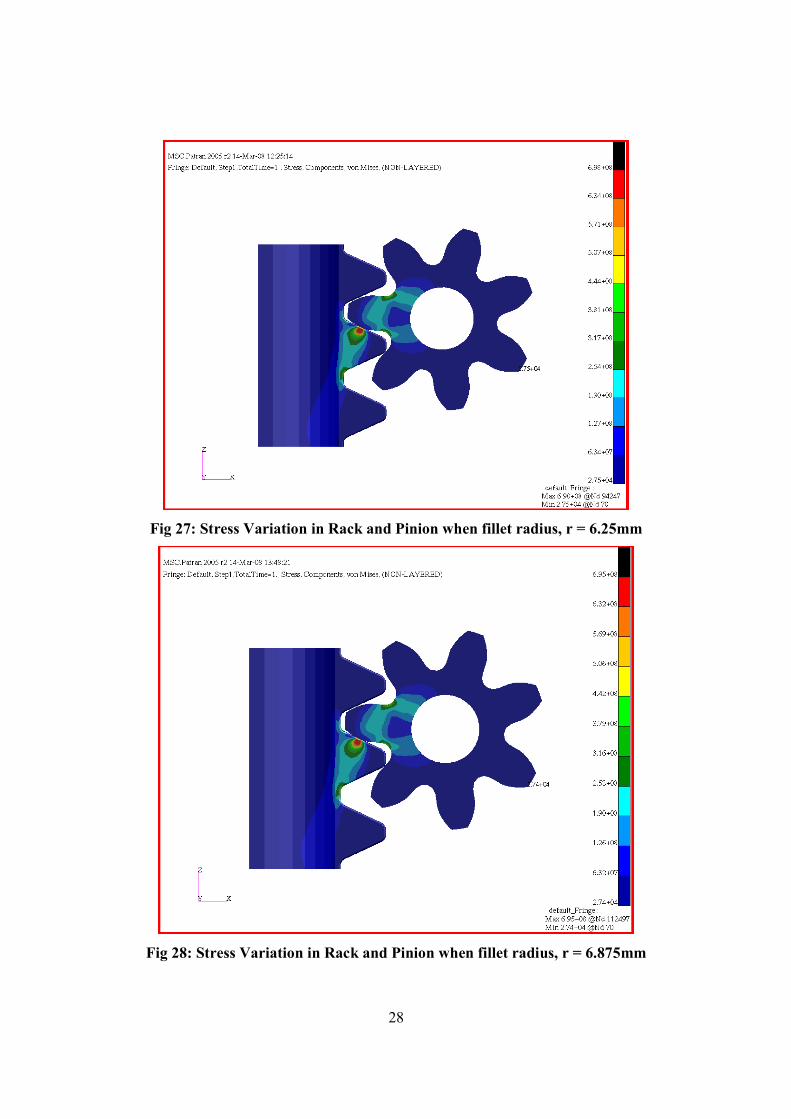
Fig 27: Stress Variation in Rack and Pinion when fillet radius, r = 6.25mm
Fig 28: Stress Variation in Rack and Pinion when fillet radius, r = 6.875mm
Page 38
29
Fig 29: Stress Variation in Rack and Pinion when fillet radius, r = 7.2mm
Fig 30: Stress Variation in Rack and Pinion when fillet radius, r = 7.5mm
Page 39
30
Fig 31: Stress Variation in Rack and Pinion when fillet radius, r = 8.125mm
Fig 32: Stress Variation in Rack and Pinion when fillet radius, r = 8.75mm
Page 40
31
Fig 33: Stress Variation in Rack and Pinion when fillet radius, r = 10mm
Fillet radius r, mm Stress x108 , Pa
0.000 7.53
2.500 7.20
5.000 7.10
6.250 6.98
6.875 6.95
7.200 6.99
7.500 7.01
8.125 7.06
8.750 7.11
10.000 7.19
Table 3: Table of Results of Fillet radius and Stress
The highest stress from the diagrams is presented in a form of graph shown below.
Page 41
32
Stress Against Fillet Radius
6.9
7
7.1
7.2
7.3
7.4
7.5
7.6
0 2 4 6 8 10 12
Fillet Radius, r (mm)
Str
ess, σ
(P
a) x10
8
Fig 34: Graph of Stress Against Fillet Radius
5.2 Plastic Strain against Fillet Radius
The following pictures depict the plastic strains that are found by the edges of the rack.
Fig 35: Plastic Strain Variation in Rack and Pinion when fillet radius, r = 0mm
Page 42
33
Fig 36: Plastic Strain Variation in Rack and Pinion when fillet radius, r = 2.5mm
Fig 37: Plastic Strain Variation in Rack and Pinion when fillet radius, r = 5mm
Page 43
34
Fig 38: Plastic Strain Variation in Rack and Pinion when fillet radius, r = 6.25mm
Fig 39: Plastic Strain Variation in Rack and Pinion when fillet radius, r = 6.875mm
Page 44
35
Fig 40: Plastic Strain Variation in Rack and Pinion when fillet radius, r = 7.2mm
Fig 41: Plastic Strain Variation in Rack and Pinion when fillet radius, r = 7.5mm
Page 45
36
Fig 42: Plastic Strain Variation in Rack and Pinion when fillet radius, r = 8.125mm
Fig 43: Plastic Strain Variation in Rack and Pinion when fillet radius, r = 8.75mm
Page 46
37
Fig 44: Plastic Strain Variation in Rack and Pinion when fillet radius, r = 10mm
Table 4: Table of Results of Fillet radius and Strain
Fillet radius r, mm Plastic Strain x10-2
0.000 6.92
2.500 5.00
5.000 4.66
6.250 4.21
6.875 4.13
7.200 4.17
7.500 4.23
8.125 4.43
8.750 4.68
10.000 4.98
Page 47
38
Plastic Strain Against Fillet Radius
0
1
2
3
4
5
6
7
8
0 2 4 6 8 10 12
Fillet Radius, r (mm)
Pla
sti
c S
train
x10
-2
Fig 45: Graph of Plastic Strain against Fillet Radius
5.3 Displacement against Fillet Radius
This simulation serves as a preliminary study of displacement. The following shows the
results of varying fillet radius against displacement. Figure 54 shows the graph of the
displacement and fillet radius.
Page 48
39
Fig 46: Displacement Variation when fillet radius, r= 0mm
Fig 47: Displacement Variation when fillet radius, r= 2.5mm
Page 49
40
Fig 48: Displacement Variation when fillet radius, r= 5mm
Fig 49: Displacement Variation when fillet radius, r= 6.25mm
Page 50
41
Fig 50: Displacement Variation when fillet radius, r= 6.875mm
Fig 51: Displacement Variation when fillet radius, r= 7.2mm
Page 51
42
Fig 52: Displacement Variation when fillet radius, r= 7.5mm
Fig 53: Displacement Variation when fillet radius, r= 8.125mm
Page 52
43
Fig 54: Displacement Variation when fillet radius, r= 8.75mm
Fig 55: Displacement Variation when fillet radius, r= 10mm
Page 53
44
Fillet radius r, mm Displacement x10-3 , mm
0.000 1.89
2.500 1.71
5.000 1.69
6.250 1.55
6.875 1.55
7.200 1.56
7.500 1.58
8.125 1.59
8.750 1.60
10.000 2.00
Table 5: Table of Results of Fillet radius and Displacement
Displacement Against Fillet Radius
0
0.5
1
1.5
2
2.5
0 2 4 6 8 10 12
Fillet Radius, r (mm)
Dis
pla
cem
ent (m
m) x10
-3
Fig 56: Graph of Displacement Against Fillet Radius
6. Conclusion
From this study, we have found out an optimum fillet for the edges of the rack. It can be
concluded from the studies that a fillet radius of 6.875mm is the optimum radius. It
shows that with fillet radius of 6.875mm would yield the lowest stress of 6.95e8 Pa. It
means there is a reduction of about 7.7% in contact stress compared with the rack that is
Page 54
45
without the fillets. The plastic strains are also the lowest when the fillet radius is
6.875mm. The maximum displacements are near the applied pressure and they are found
at the places where there is the least deformation. At fillet radius of 6.875mm and
6.25mm, the rack and pinion exhibits the least displacement.
All of the results that are exhibited are static stresses produced from constant loads. In
actual operation, the rack and pinion experiences dynamic loads variations. However the
dynamic loads will be small as the rotational speed of the pinion will be slow when
elevating the hull. For actual determination of the stresses, programs that are able to
calculate dynamic loads are suggested, for instance LS-DYNA.
7. Recommendations
In practical offshore industry, there is no record of filleting the edges of the rack.
However from this study, it shows that by chamfering the edges of the rack, one is able to
reduce the maximum contact stress, thus reducing mean stress. From there, the chances of
fatigue failure can be reduced too.
One recommendation is that instead of chamfering special fillet radius of 6.875mm which
requires precise machining, one can opt for common fillet radius like 6mm or even an
odd number 7mm which is close to the optimum fillet radius to reduce chances of fatigue
failure.
Another recommendation is that designers of jack-up rigs can indicate that in the
manufacture of the rack; to save cost, chamfer only the operational range. That is to say
only chamfer the range where the hull is in elevated mode. There is no need to chamfer
the whole rack as at full operational height of the hull would experience more cycles to
failure with real environment loads in times of storms.
Page 55
46
8. References
1) Bennett and Associates, L.L.C and Offshore Technology Development Inc (July
1, 2005). “Jack up units: A technical primer for the offshore industry
professional.” Retrieved 23 Sep 2007, from
http://www.bbengr.com/jack_up_primer.pdf
2) B. P. M. Sharpies, W. T. Bennett, Jr and J. C. Trickey (1989), “Risk analysis of
Jackup Rigs.” Marine Structures, Vol. 2, pp. 281-303.
3) Chien-Hsing Li, Hong-Shun Chiou, Chinghua Hung, Yun-Yuan Chang and
Cheng-Chung Yen (2002), “Integration of Finite Element Analysis and Optimum
Design on Gear Systems”, Finite Elements in Analysis and Design, Vol. 38, pp.
179-192.
4) D.P. Stewart and I.M.S. Finnie (2001), “Spudcan-Footprint Interaction During
Jack-Up Workovers.”, Proceedings of the Eleventh International Offshore and
Polar Engineering Conference.
5) Dudley, D.W (1954), “Practical Gear Design”, McGraw-Hill, New York.
6) Fredette L. and Brown M. (1997), “Gear Stress Reduction Using Internal Stress
Relief Features”, Journal of Mechanical Design, Vol. 119, pp. 518-521.
7) Fumitaka Higuchi, Shuuichi Gofuku (2007), “Approximation of involute curves
for CAD-system processing.” Engineering with Computers, Vol 23, pp.207-214.
8) John J. Coy Dennis P. Townsend and Erwin V. Zaretsky (1985). “Gearing.”
NASA reference publication.
9) Keppel Fels (2008) Retrieved 23 Feb 2008, from
http://www.keppelfels.com.sg/products
Page 56
47
10) Litvin, F.L (1996), “Application of Finite Element Analysis for Determination of
Load Share, Real Contact Ratio, Precision of Motion, and Stress Analysis,”
Journal of Mechanical Design, Transactions of the American Society of
Mechanical Engineers, Vol. 118, No. 4, pp. 561–567.
11) Litvin, F.L. (1994), Gear Geometry and Applied Theory, Prentice Hall,
Englewood Cliffs, NJ.
12) Litvin, F.L., and Hsiao, C.-L. (1993), “Computerized Simulation of Meshing and
Contact of Enveloping Gear Tooth Surfaces,” Computer Methods in Applied
Mechanics and Engineering, Vol. 102, pp. 337–366.
13) Moriwaki, I., Fukuda, T., Watabe, Y., Saito, K (1993), “Global Local Finite
Element Method (GLFEM) in Gear Tooth Stress Analysis”, Journal of
Mechanical Design, Vol. 115, pp. 1008-1012.
14) MSL Engineering Ltd (2004). “Guidelines for jack-up rigs with particular
reference to foundation integrity.” Retrieved 1 Feb 2008, from
www.hse.gov.uk/research/rrhtm/rr289.htm
15) P. J. Mills, A. T. Dixon, H. Smallman & D. Smith (1997). “Some Aspects of the
Safety of Jack-ups on Location and During Transit.” Marine Structures, Volume
10, Number 2, pp. 243-262.
16) R. Gobithasan, R. Rofizah & M. A. Jamaludin (2005), “Straight line and circular
arc methods for developing G1 and G2 involute curves.” Journal Teknologi, Vol.
43, pp. 55-66.
17) S.Barone (2001), “Gear Geometric Design by B-Spline Curve Fitting and Sweep
Surface Modelling.” Engineering with Computers, Vol 17, pp. 64-77.
Page 57
48
18) Shuyan Ji, Daizhong Su and Jiansheng Li (2006), “Gear Design Optimisation
with a variable penalty function.” Proceedings of International Conference on
Advanced Design and Manufacture.
19) Tian Yong-tao, Li Cong-xin, Tong Wei and Wu Chang-hua (2003), “A finite-
element-based study of the load distribution of a heavily loaded spur gear system
with effects of transmission shafts and blanks.” Journal of Mechanical Design,
Vol. 125, pp. 625-631.
20) V.B Math and Satish Chand (2004), “An approach to the Determination of Spur
Gear Tooth Root Fillet.” Journal of Mechanical Design, Vol. 136, pp. 336-340.
21) Vasilios A. Spitas, Theodore N. Costopoulos and Christos A. Spitas (2006).
“Optimum Gear Tooth Geometry For Minimum Fillet Stress Using BEM and
Experimental Verification With Photoelasticity.” Journal of Mechanical Design,
Vol. 128. pp. 1159-1164.
22) Vijayarangan S. and Ganesan N. (1993), “Stress Analysis of Composite Spur
Gear Using the Finite Element Approach”, Computers and Structures, Vol. 46,
No. 5, pp. 869-875.
23) Wikipedia- The free encyclopedia (2008). “Jack-up Barge.” Retrieved 1 Feb
2008, from http://en.wikipedia.org/wiki/Jack-up_barge
24) Wildhaber, E., 1946c, “Tooth Contact,” American Machinist, Vol. 90, No. 12, pp.
110–114.