Page 1
Australasian Transport Research Forum 2013 Proceedings
2 - 4 October 2013, Brisbane, Australia
Publication website: http://www.patrec.org/atrf.aspx
1
Analysis and planning of bicycle parking for transport
interchanges
David Arbis, Dr. Taha Rashidi, Dr. Vinayak V Dixit, Dr. Upali Vandebona
School of Civil and Environmental Engineering
University of New South Wales
Sydney, NSW 2052
Email for correspondence: [email protected]
Abstract
Guidelines for providing bicycle parking at transport interchanges in Australia remain
inadequate to ensure patronage. The inadequacy stems from the generic as opposed to
definitive guidance on the location of bicycle parking spaces and selection between bicycle
parking devices. This generic guidance is incapable of addressing the local needs of
individual stations. Therefore what is proposed is a segmentation study of observed bicycle
parking behaviour, where subgroups of parked bicycles are used to explain parking
preferences in a more specific manner useful for heterogeneously implementing bicycle
parking at different stations. The study finds that significant parking behaviour differences
exist between bicycles parked at different sized stations and also between bicycles parked at
different classes of parking devices. This has implications on the placement and selection of
bicycle parking infrastructure at transport interchanges.
Data was collected through counts of parked bicycles at thirteen of Sydney’s (Australia)
West and Inner-West railway stations, varying in size from small to major transport hubs.
Parking distances to station entrances were recorded along with streetscape features
surrounding parking locations. Further, patronage data of the NSW Government’s secure
bicycle locker devices was collected to allow comparison of parking patterns between
bicycles parked in secure infrastructure to those parked outside in the open-air.
1. Introduction
Integrating bicycles and transit through bicycle parking brings among all, economic,
environmental and social benefits to communities. This is achieved through expediting a shift
from car use to bicycles and transit. Bicycle-transit is a time competitive alternative to
unimodal car travel directly to destinations (Martens, 2007) as well as car travel to transit
interchanges (Martin, 2010). Standing evidence of this time-competitiveness lies in the
significant proportion of bicycle parkers replacing their car trips with bicycle-transit in
Australia (Martin & den Hollander, 2009; Parker, 2002; Third Wave Cycling Group Inc. et al.,
2010) and the international context (Martens, 2007) after provision of bicycle parking spaces.
Bicycle parking is also a more space-efficient, cheaper alternative to car parking for
attracting transit patronage (Martin, 2010).
However, when bicycle parking facilities are provided at transit interchanges, especially in
the Australian context, they are not necessarily utilised. For example, open-air bicycle
parking facilities provided in Sydney (Australia) public transport interchanges are found with
scattered occupancy levels, without an alignment with predictors such as parking distance
and estimated bicycle security (Lehman et al., 2009). Also, secure enclosed bicycle locker
Page 2
Australasian Transport Research Forum 2013 Proceedings
2 - 4 October 2013, Brisbane, Australia
Publication website: http://www.patrec.org/atrf.aspx
2
facilities provided by the New South Wales Government hold a mean lease rate of 42% with
a standard deviation of 34% (NSW Government, 2013). Bicycle parking enclosures called
“Bike Stations” implemented in the San Francisco Bay Area likewise experience widely
dissimilar utilisation, ranging from 11% to 100% (Pucher & Buehler, 2009).
There have been several efforts to predict latent demand for bicycle parking facilities so that
when facilities are provided, they are utilised. These are the studies of Bachand-Marleau et
al. (2011), Chen et al. (2012), Keijer & Reitveld (1999), Lehman et al. (2009), Martens
(2004), Martin & den Hollander (2009) and Reitveld (2000), which have examined seminal
traveller and urban form attributes. However despite these efforts, there still stands
significant barriers to realising bicycle parking usage and hence the benefits arising from
usage. For one, private bicycles left at an interchange face the possibility of theft and
vandalism, which has been a significant deterrent to bicycle parking (Austroads, 2008;
Martin & den Hollander, 2010; Parker, 2002; Parker, 1992; Pucher & Buehler 2009). It has
also been shown that excessive walking access distances from parking spots to interchange
entrances encourage uptake of station access modes other than cycling (Chen et al., 2012).
Therefore a study is necessary to counter these barriers, and it is considered fitting by the
authors to address them through investigating suitable siting of bicycle parking spaces and
selection between appropriate bicycle parking devices for interchanges. With suitable siting
of spaces and selection between appropriate bicycle parking devices, a reduction in bicycle
theft, walking access distances and ultimately a realisation of latent demand for bicycle
parking may be achieved. This is what this study investigates: a method to provide insight for
suitable siting of bicycle parking spaces and selection between bicycle parking devices.
Available literature provides coarse qualitative and empirical advice for siting of bicycle
parking spaces and selecting between classes of bicycle parking devices for transport
interchanges. Such advice has a ‘bulk-of-evidence’ nature, which is unable to cater for the
requirements of all interchanges.
Generic suggestions for siting bicycle parking spaces at interchanges are provided by
Austroads (2008). Among all, Austroads suggests bicycle parking devices be placed in
public view and as close as possible to destinations, within 100m distance. Similarly Martin &
den Hollander (2010; p. 13), present a set of rules employed for siting Melbourne’s
‘Parkiteer’ bicycle parking cages which includes: “Cages should be located close to the
entry/exit of the station. This provides quick arrival and departure by cyclists and also good
passive surveillance against vandalism and theft”. It is evident available siting principles lack
a level of precision to definitively guide infrastructure implementation.
In terms of selecting between classes of bicycle parking devices to implement at
interchanges, Austroads (2008) suggests taking into account an interchange’s level of
surveillance against bicycle theft and vandalism. This surveillance refers to passive
surveillance from passing pedestrians and active surveillance from station staff. Secure
bicycle lockers are recommended when there is low surveillance and where there is
significant surveillance, open-air bicycle racks are regarded suitable. Hence there is some
guidance to select between bicycle parking devices based on bicycle surveillance. What the
advice lacks however is it does not make clear what constitutes a level of bicycle
surveillance. It would be useful if there was a significant proxy variable(s) determined useful
Page 3
Australasian Transport Research Forum 2013 Proceedings
2 - 4 October 2013, Brisbane, Australia
Publication website: http://www.patrec.org/atrf.aspx
3
to delineate between different levels of bicycle surveillance. The study presented in this
paper investigates this.
The study methodology is set out as follows. The ‘Field Surveys’ section gives details on the
surveys that were performed and data collected for this study. The ‘Analysis’ section
segregates collected data into various interchange and parking device populations to show
differences in bicycle parking siting preferences between populations. A predictive analysis
is included to investigate the bearing of specific streetscape features indicative to where
cyclists site their bicycles in the open-air. The ‘Analysis’ section also includes a diurnal study
of open-air bicycle parking at interchanges. Literature currently presents only two such intra-
day studies at interchanges performed in Nanjing, China (Chen et al., 2012). A diurnal study
is performed as part of this research to investigate diurnal patterns of demand and support
previous findings.
The final section of the research work provides concluding remarks regarding the
methodology followed and possible implications for bicycle parking provision.
2. Field surveys
Observations of were made of current bicycle parking behaviour (revealed preference). Data
of current behaviour was used in the research because it does not control for bicycle theft,
vandalism and walking access distance constraints. Considering aims of the paper being the
investigation of suitable placement of bicycle parking facilities and choosing between types
of bicycle parking device to combat these constraints, revealed preference data was deemed
fitting.
2.1 Open-air bicycle parking
Attributes of sites where cyclists prefer to park their bicycles were observed. These sites
encompassed all open-air bicycle parking, comprising bicycles at provided bicycle racks and
at street furniture such as fences and street poles. Bicycle parking sites were observed at
thirteen differently sized train stations (according to passenger volumes, of which train
service frequency was used a surrogate measure) running along the Sydney suburban
railway network.
These surveys started at Blacktown train station in Sydney’s West and continued along
Western Line stations to Strathfield train station in the Inner-West. A total of five surveys
were conducted on five separate weekdays, with each station visited once during each
survey day by travelling from station to station in sequence.
About half-an-hour was allowed for inspection of bicycle parking near one station and to
travel to the next station. Each survey day thusly took a total of 6 hours. The first survey day
started at 09:30 and two subsequent surveys started at 10:30 and 11:30 respectively
(staggered by one hour) to counter to an extent the effect of diurnal bicycle parking patterns.
One survey commenced at 09:30 and was conducted in the reverse direction to further
counter diurnal patterns.
The sites where bicycles were parked within 150m walking distance to station entrances
were included in the survey. Each site was defined by its parking distance rounded to the
Page 4
Australasian Transport Research Forum 2013 Proceedings
2 - 4 October 2013, Brisbane, Australia
Publication website: http://www.patrec.org/atrf.aspx
4
nearest 5m and the streetscape parking amenity features surrounding the site. For every
observed site, the parking distance to the nearest station entrance was recorded in-situ,
rounded to the nearest 5 metres. Sites where bicycles were found parked within station
walkways and concourses were allocated a distance value of 0m. Streetscape parking
amenity features surrounding parking sites were also recorded. These amenity features
recorded in the surveys were predetermined in a list and included among all, shelter, CCTV
(Closed Circuit Television) cameras, appropriate lighting, bus stops and shops. This list of
amenity features has previously been used in a bicycle parking study (Lehman et al., 2009).
A comprehensive list of the features is listed as part of Table 3 in the analysis section of the
paper.
Some observed bicycle parking sites were eliminated from the collected sample under
suspicion they did not represent bicycles involved in bicycle-transit trips. Parking distance
was used as a factor to objectively guide elimination from the sample. Parking sites at a
distance with a z-score greater than three was used as a guide, corresponding
approximately to bicycles parked at further than 100m from station entrances. Hence all sites
with bicycles parked further than 100m were eliminated from the sample (n=14 bicycles,
2.7% of the sample bicycles), under the notion bicycles at these sites were not parked for
bicycle-transit. This is coincidentally concurrent with Austroads’ (2008) recommendation that
bicycle parking facilities should be located within 100m from stations.
After removal of outliers, on average there were 104.8 bicycles counted in a survey day (a
total of 524 bicycles over the five days), with 42% observed parked formally at provided
parking spaces. The other 58% were observed generally attached to street furniture. As for
bicycle parking sites, over the five survey days there were 62 bicycle sites observed with an
average and standard deviation of 1.7 and 2.5 bicycles per site. These apparently low
bicycle numbers per site are partially due to some sites being irregularly active.
2.2 Secure bicycle parking
Patronage and parking distance data of secure bicycle parking devices was collected to
show parking patterns for this subset of bicycle parking and make comparisons with the
patterns of open-air bicycle parking.
Lease rates of secure bicycle locker assemblages provided at NSW transit interchanges by
the NSW Government were determined through the official bicycle locker website (NSW
Government, 2013). Also using this website, all 130 bicycle locker assemblages at train
stations were geographically located and parking distances to station entrances were
measured. On May 26th 2011, 1066 bicycle lockers were provided at train interchanges with
506 lockers reported leased.
2.3 Intra-day variations
Diurnal observations of open-air bicycle parking were made at a train station with a relatively
high volume of bicycle parking (Lidcombe train station, situated in Sydney’s Inner-West). The
observations were made to infer trip purposes for open-air bicycle parking and diurnal
patterns of demand. Commuter car parking at the train station was observed at the same
Page 5
Australasian Transport Research Forum 2013 Proceedings
2 - 4 October 2013, Brisbane, Australia
Publication website: http://www.patrec.org/atrf.aspx
5
time to compare the two vehicle groups and infer if trip purposes for open-air bicycle parking
were aligned with commuter car parking.
Both bicycle and car parking were observed at Lidcombe train station on 2nd August 2011 for
a period of twelve hours from 07:00 to 19:00. An inventory count of parking spots at bicycle
racks and the station commuter car park showed a capacity of 19 provided bicycle spaces
and 153 car spaces.
Hourly photographs were taken of all bicycles parked within 150m walking distance of station
entrances from 07:00 to 19:00. The arrival and departure times of parked bicycles were
approximated by inspection of photographs, coinciding with a photography method
discussed by Moskovitz & Wheeler (2011). At the same time, the patronage of the nearby
commuter car park was simultaneously documented by manual count.
A total of 44 parked bicycles were observed in the survey time period.
3. Analysis
The analysis section presents results in three parts. The first part shows results of intra-day
patterns of bicycle parking. The second part details where bicycle parkers prefer to site their
bicycles defined by parking distance, and how different interchanges and parking devices
are characteristic of different parking distances. The last part further expands upon the
bicycle siting findings by identifying important predictors for siting open-air bicycle parking
through regression and data mining approaches.
3.1 Intra-day variations
In this part, results are presented of the diurnal pattern of bicycle parking and a comparison
of bicycle parking against car parking. These were observed through the intra-day survey.
Graphical plots and descriptive statistics are used in the analysis.
A total sample of 44 parked bicycles was observed in the survey time period. At the
beginning of the survey (07:00), there were already 20 bicycles found at the interchange and
at the end of the survey (19:00) 15 bicycles remained. Of the 15 bicycles remaining parked
after the survey, 7 had been parked for over 12 hours, 4 had been parked for 10-12 hours
and 4 for less than 10 hours. Within the latter 4, 2 had been parked for less than an hour due
to late arrival between 18:00 and 19:00.
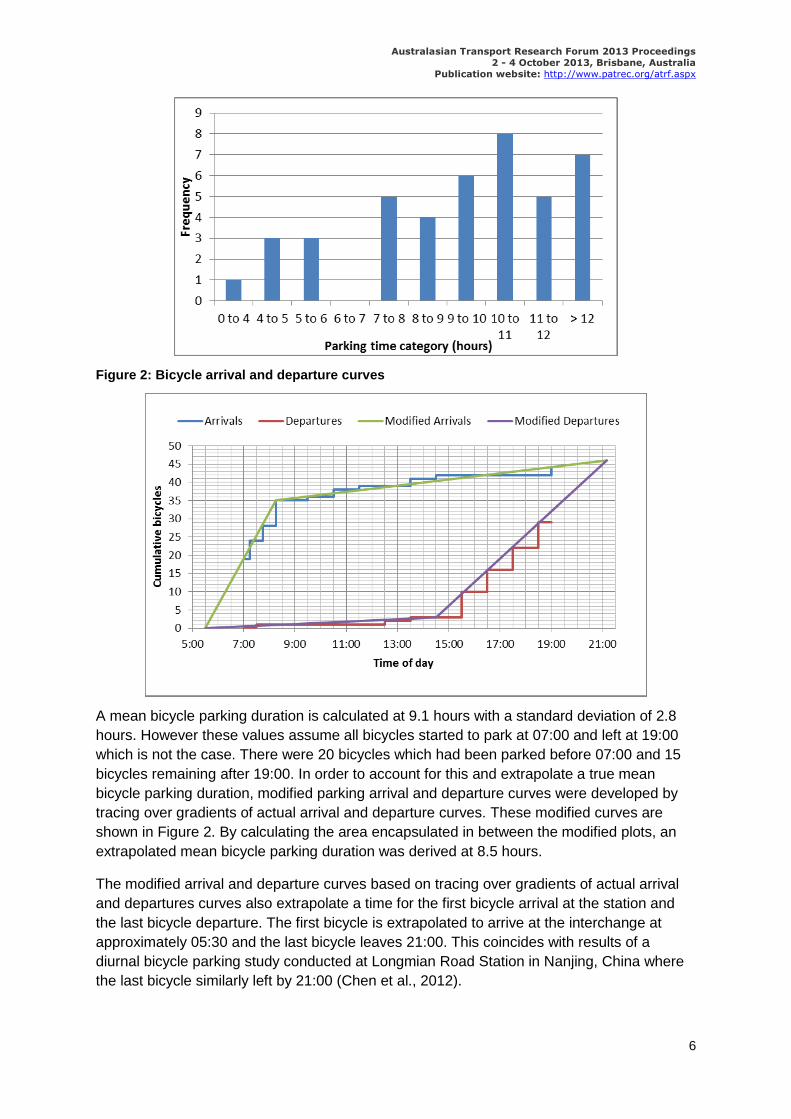
A parking duration frequency plot was formed to show a distribution of bicycle parking
durations. The plot was formed from parking duration data obtained from 42 of the 44
sample bicycles, where the two bicycle arrivals between 18:00 and 19:00 were rejected. It is
evident from this plot (Figure 1) there is a skew for parking durations to exceed 8 hours.
Almost 70% of bicycles were parked for longer than 8 hours.
Figure 1: Distribution of bicycle parking durations
Page 6
Australasian Transport Research Forum 2013 Proceedings
2 - 4 October 2013, Brisbane, Australia
Publication website: http://www.patrec.org/atrf.aspx
6
Figure 2: Bicycle arrival and departure curves
A mean bicycle parking duration is calculated at 9.1 hours with a standard deviation of 2.8
hours. However these values assume all bicycles started to park at 07:00 and left at 19:00
which is not the case. There were 20 bicycles which had been parked before 07:00 and 15
bicycles remaining after 19:00. In order to account for this and extrapolate a true mean
bicycle parking duration, modified parking arrival and departure curves were developed by
tracing over gradients of actual arrival and departure curves. These modified curves are
shown in Figure 2. By calculating the area encapsulated in between the modified plots, an
extrapolated mean bicycle parking duration was derived at 8.5 hours.
The modified arrival and departure curves based on tracing over gradients of actual arrival
and departures curves also extrapolate a time for the first bicycle arrival at the station and
the last bicycle departure. The first bicycle is extrapolated to arrive at the interchange at
approximately 05:30 and the last bicycle leaves 21:00. This coincides with results of a
diurnal bicycle parking study conducted at Longmian Road Station in Nanjing, China where
the last bicycle similarly left by 21:00 (Chen et al., 2012).
Page 7
Australasian Transport Research Forum 2013 Proceedings
2 - 4 October 2013, Brisbane, Australia
Publication website: http://www.patrec.org/atrf.aspx
7
Graphical comparison of bicycle parking against car parking during the survey day (shown in
Figure 3) indicates the intra-day patronage pattern of the two vehicle groups coincide,
especially the departure portions after 15:00. The arrival portions have less accord because
of the capacity-limited nature of car parking as opposed to the non-capacity limited nature of
bicycle parking at street furniture. Overall, the significant intra-day accord of bicycle parking
and commuter car parking illustrated in Figure 3 supports through observed behaviour that
trip purposes for bicycle parking and commuting car parking are the same.
The graphical comparison of Figure 3 also illustrates the uptake of provided bicycle parking
spaces. All the bicycle parking spaces are placed within 25m proximity to station entrances,
collectively operating at almost full capacity from 10:00 to 15:00. Despite being closely
located to the station entrances, it is evident there are still bicycle parkers who prefer not to
use them and to park at street furniture (such as fences and sign poles) even when there are
spaces available before 10:00. This agrees with a previous study where it is also indicated
some bicycle parkers find formally provided bicycle parking spaces to be undesirable in
comparison to street furniture (Lehman et al., 2009).
Figure 3: Daily fluctuation of bicycles and cars parked at Lidcombe train station
3.2 Bicycle parking distances
To show differences in bicycle parking distances across interchanges and across classes of
bicycle parking devices, subgroups of bicycles were formed from the collected data based
on train service frequency of interchanges and class of parking device. Data on train service
frequency of interchanges was collected through the NSW Rail Corporation (2013). Four
bicycle parking subgroups were formed – open-air bicycles at stations with hourly services <
15 in the a.m. peak, open-air bicycles at stations with hourly services >30 in the a.m. peak,
open-air bicycles at all surveyed stations and bicycles parked in secure bicycle lockers.
Cumulative percentile plots, descriptive statistics and two-group mean t-tests were used in
the analysis to make parking distance comparisons between these formed subgroups.
Page 8
Australasian Transport Research Forum 2013 Proceedings
2 - 4 October 2013, Brisbane, Australia
Publication website: http://www.patrec.org/atrf.aspx
8
Cumulative percentile plots were drawn to find any threshold distances from station
entrances where bicycle parking levels started to decline. Amongst bicycles parked in the
open-air, a threshold distance where bicycle parking declined occurred at seemingly close
distance to station entrances, within 30m. The subgroup of open-air bicycles at stations with
hourly services <15 in the a.m. peak were found with a smaller threshold parking distance
than open-air bicycles at stations with hourly services >30 in the a.m. peak. The threshold
distance values were 13.3m and 26m respectively. This could indicate bicycle parkers at
less-busy stations prefer to park close to station entrances so that their bicycles can be seen
by passing station passengers and station staff, whereas those at busier interchanges need
not park so close to be seen. This idea is further supported with 20% of open-air bicycles at
stations with hourly services <15 in the a.m. peak found parked within station walkways and
for stations with hourly services >30 in the a.m. peak this value lies at 6%. The cumulative
percentile plots are shown in Figures 4 and 5.
The above paragraph thusly provides some information about preferences to site bicycles,
and also indicates the suitability of interchange service frequency to be a proxy variable for
surveillance against bicycle theft and vandalism. A greater service frequency could mean
greater people traffic, and hence greater bicycle surveillance. Interchange service frequency
could thus be a delineator decision makers can use to decide whether it is necessary to
implement secure parking devices such as bicycle lockers or not.
Open-air bicycle parking occurs at a much closer proximity to station entrances than parking
in secure bicycle lockers as shown in the cumulative percentile plots in Figure 5. The initial
gradient of the curve representing bicycle locker patronage is less steep than the initial
gradient of the curve representing open-air bicycles, indicating open-air bicycle parking
decreases relatively rapidly with distance. This difference could mean there is a relationship
between bicycle security of bicycle parking devices and bicycle parking distance. This is
whereby open-air bicycles, in order to be seen by passing pedestrians must be parked in
proximity to station approaches whereas bicycle lockers, inherently providing bicycle security
against theft and vandalism, do not. The difference in parking patterns between these two
groups also indicates that secure bicycle parking devices can be placed away from
congested interchange pathways and still encourage bicycle parking patronage, unlike open-
air bicycle parking.
Figure 4: Cumulative percentile distribution of parked bicycles by bicycle parking subgroups
Page 9
Australasian Transport Research Forum 2013 Proceedings
2 - 4 October 2013, Brisbane, Australia
Publication website: http://www.patrec.org/atrf.aspx
9
Figure 5: Cumulative percentile distribution of parked bicycles by bicycle parking subgroups
Table 1: Bicycle parking distance characteristics for different bicycle parking subgroups
Note: The sample bicycles column shows the total number of bicycles encountered during the five
interchange surveys minus the outliers. The bottom row in the column shows the total number of
NSW lockers observed leased on May 26th 2011.
Subgroup Mean, m
[Std. dev.]
Threshold
distance, m
[percentile
bicycles]
Sample
bicycles
Sample
stations
Bicycles parked in the Open Air
Bicycles parked at all stations 16.59[15.31] 23.2[94] 533 13
Bicycles parked at stations with hourly
services <15 in the AM peak
10[14.35] 13.3[95] 34 5
Bicycles parked at stations with hourly
services >30 in the AM peak
19.11[15.61] 26.2[93] 304 3
Bicycles parked at secure bicycle lockers 70.27[51.22] - 506 83
Statistical Difference using t-test [p-value]
Bicycles parked at stations with hourly services
<15 in the AM peak vs bicycles parked at all
other stations
-7.03[0.01]
Bicycles parked at stations with hourly services
>30 in the AM peak vs bicycles parked at all
other stations
5.89[0.00]
Open air bicycles parked vs bicycles parked at
secure bicycle lockers*
-53.68[0.00]
Two group mean t-tests were performed to verify the statistical significance of differences in
parking distance amongst bicycle subgroups. The two group mean t-tests make evident to a
99% significance level that interchange service frequency and class of bicycle parking
device are factors that indicate where bicycle parkers choose to distance, thus site, their
bicycles. These two group t-tests are tabulated as part of Table 1.
Figure 6: Parking distance against occupancy of secure bicycle lockers
Page 10
Australasian Transport Research Forum 2013 Proceedings
2 - 4 October 2013, Brisbane, Australia
Publication website: http://www.patrec.org/atrf.aspx
10
A plot of bicycle parking distance against occupancy of secure bicycle locker assemblages
was formed. The occupancy of bicycle locker assemblages is found to only slightly decrease
with parking distance. This provides further evidence to the cumulative plots that parking
distance is not a very critical parameter for secure bicycle parking, in comparison to open-air
bicycle parking. It can be interpreted the slight decreasing trend in occupancy with greater
parking distance is caused by increasingly undesirable walking access distances to station
entrances. Figure 6 shows this plot of parking distance against occupancy values of locker
assemblages.
3.3 Predictive analysis
Ordinary Least Squares (OLS) Regression was used to determine the influence of
streetscape amenity features upon where cyclists were observed to site their bicycles in the
open-air. Interchange-specific and zonal characteristics of the zones of the surveyed
interchanges were also included as predictors in the regression. Census data (Australian
Bureau of Statistics, 2011) was used to include the zonal characteristics. 25 predictors were
used in the full model, described in Table 3.
The dependent variable in the regression analysis was the count of bicycles found parked at
each location, which is a value averaged over the five survey days. An average value was
used to better reflect repeated behaviour. A total of 62 bicycle parking locations were
observed, with an average and standard deviation of 1.7 and 2.5 bicycles parked at each
location.
Table 2: Model summaries of the OLS regression and neural network models
OLS Reduced Model Statistic Value
Sum of Squares Error 301.97
Adjusted R Squared value 0.1205
Neural network
Sum of Squares Error for rescaled
values of the dependent variable 3.571
Relative Error for rescaled values of
the dependent variable 0.121
Stopping Rule Used Maximum number of epochs(100) exceeded
Number of Hidden Layers 1
Number of Units in Hidden Layer 1* 3
* Excluding the bias unit
Training
Hidden Layer(s)
Page 11
Australasian Transport Research Forum 2013 Proceedings
2 - 4 October 2013, Brisbane, Australia
Publication website: http://www.patrec.org/atrf.aspx
11
Table 3: Predictors used in the OLS regression and neural networks models
Predictor Definition Mean Std. Dev.
Dummy location features
lighting 1, if present at the location; 0, otherwise 0.968 0.177
shelter 1, if present at the location; 0, otherwise 0.397 0.493
cctv 1, if present at the location; 0, otherwise 0.103 0.272
ashop 1, if present at the location; 0, otherwise 0.508 0.504
ticketwindow 1, if present at the location; 0, otherwise 0.016 0.126
taxirank 1, if present at the location; 0, otherwise 0.286 0.455
busstop 1, if present at the location; 0, otherwise 0.365 0.485
footpath 1, if present at the location; 0, otherwise 0.952 0.215
housesapartments 1, if present at the location; 0, otherwise 0.016 0.126
street 1, if present at the location; 0, otherwise 0.762 0.429
offices 1, if present at the location; 0, otherwise 0.048 0.215
carpark 1, if present at the location; 0, otherwise 0.365 0.458
Continuous location
characteristic
distance Parking distance to nearest station entrance (m) 22.46 26.087
Continuous interchange
characteristics
servicefrequency Hourly train service frequency in the 7-9am peak 36.968 27.034
distancetocentral
Distance of interchange to Central Station (km), a
station in the Central Business District 21.613 6.682
Land use variable
pdensity Population density per square km (thousands) 3.429 1.333
Demographic variables
motor Average motor vehicles per household member 0.453 0.05
income Median personal weekly income (AUD$, thousands) 0.493 0.086
edensity Employed persons per square km (thousands) 1.538 0.624
age2539 Percentage of residents aged 25-39 29.333 7.485
age4059 Percentage of residents aged 40-59 21.552 2.839
age2559 Percentage of residents aged 25-59 50.886 5.002
Bikeway supply variables
offroad
Length of offroad cycle paths within 1km radius of
the interchange (km) 1.89 1.64
onroad
Length of onroad cycle paths within 1km radius of
the interchange (km) 4.745 2.677
totalbikeway
Total length of cycle paths within 1km radius of the
interchange (km) 6.636 3.901
Page 12
Australasian Transport Research Forum 2013 Proceedings
2 - 4 October 2013, Brisbane, Australia
Publication website: http://www.patrec.org/atrf.aspx
12
Table 4: Parameter estimation for the OLS regression and neural network models
Output Layer
Independent
variable
importance
Predictor H(1:1) H(1:2) H(1:3)
No. of
Bicycles
Normalised
importance (% )
lighting 0.431 -0.291 0.278 84.6
shelter 0.937[0.129] -0.478 -0.291 -0.079 14
cctv 2.225[0.048] 0.022 -0.326 -0.144 23.2
ashop 1.038[0.083] 0.518 -0.025 0.041 19.9
ticketwindow 0.154 -0.406 0.413 74
taxirank -0.103 -0.124 -0.842 7.5
busstop 1.172[0.065] -0.953 -1.271 -0.077 31.8
footpath 0.317 0.658 0.124 36.9
housesapartments -0.272 -0.515 0.02 40
street 0.223 0.253 -0.685 14.5
offices 0.904 0.511 -0.037 42.6
carpark -0.606 -0.386 0.81 16.3
distance 0.923 2.797 0.307 72.4
service frequency 0.339 -1.106 0.807 75.5
distance to central 0.935 -0.708 0.173 92.5
pdensity 0.26 1.454 0.681 70.5
motor -1.332 -1.581 0.047 64.3
income -1.112 -1.361 -0.712 58.8
edensity -0.533 0.757 1.043 100
age2539 -0.241 -0.461 0.231 24.6
age4059 0.028 0.185 -0.134 14.1
age2559 0.213 -1.236 0.446 61.3
offroad -0.772 -1.344 -0.712 44.1
onroad 0.164 0.222 -0.547 17.5
totalbikeway -0.487 -0.872 -0.591 34.8
constant 0.142[0.795]
(Bias) 0.889 0.618 -0.407
(Bias) -0.139
H(1:1) 1.945
H(1:2) -2.259
H(1:3) 0.388
OLS reduced
model [p-value]
Neural Network
Hidden layer 1
The agenda was to select a subset of the full set of predictors, which would meet multiple
criteria. Ensuring the correlation between predictors as stipulated in a correlation matrix was
less than 0.5, the constant value was minimised, all predictors were statistically significant
and the adjusted r-squared value was maximised, a reduced model comprising of the
independent variables ‘shelter’, ‘cctv’, ‘ashop’ and ‘busstop’ was selected. The adjusted r-
squared value was 0.12 which is relatively small. The results of this reduced OLS model are
shown in Tables 2 and 4.
Page 13
Australasian Transport Research Forum 2013 Proceedings
2 - 4 October 2013, Brisbane, Australia
Publication website: http://www.patrec.org/atrf.aspx
13
Despite this low adjusted r-squared value, there is still some merit to the reduced OLS
model. The remaining predictors in the reduced model were four dummy predictors
representing the presence of bus stops, shops, CCTV cameras and shelter at bicycle
parking locations. This suggests these location amenity features provide surveillance to
assure cyclists their bicycles are left in a secure environment whereas shelter provides
protection against the elements.
The low predictive ability of the reduced OLS model prompted a further predictive analysis. A
neural networks prediction was performed to find a better fit between the available set of
predictors against the dependent variable.
Under a Multilayer Perceptron procedure, ten trials of neural network prediction were
performed. The results of a select trial characteristic of the lowest sum of squares error are
shown in Table 4. It is evident there is a strong correlation between observed and predicted
values of the dependent variable as shown visually in Figure 7.
Figure 7: Observed against neural network predicted values for the dependent variable
A different subset of predictors was indicated important by the neural network prediction,
according to normalised importance values of predictors. The continuous predictors
representing bicycle parking distance, service frequency of train stations, distance of the
interchange to Central Station (Central Business District), population density and
employment density are indicated important predictors to the number of bicycles found at
locations. The normalised importance values are displayed in the rightmost column of Table
4. The importance of the variable representing distance of the interchange to Central Station
coincides with findings indicating the location of interchanges in the urban fabric influencing
the number of cycle-transit users (Keijer & Rietveld, 2009; Martens, 2004). The importance
of population density agrees with previous mention of a relationship between bicycle use and
population density (Hegger, 2007). Employment density being important in the model
coincides with the recognition of commuting as significant in bicycle-transit trips (Chen et al.
2012; Lehman et al., 2009; Martens, 2004; Rietveld, 2000). The importance of train service
Page 14
Australasian Transport Research Forum 2013 Proceedings
2 - 4 October 2013, Brisbane, Australia
Publication website: http://www.patrec.org/atrf.aspx
14
frequency is in-line with the idea that larger passenger volumes provide greater pedestrian
surveillance for encouraging bicycle parking at a train station.
4. Discussion
The study adopted a methodology to find useful information for siting of bicycle parking
spaces and selecting between bicycle parking devices. The information can be used for
suitable siting of bicycle parking and selection of parking devices so that bicycle parking
patronage can be improved. Key findings include:
The results of the intra-day study provide support that open-air bicycle parking at train
interchanges (and accordingly bicycle parking in general) in Australia is a long-stay activity.
Thusly bicycle parking requires long-stay security against bicycle theft. At the studied station
(Lidcombe station, Inner-West Sydney) it can be asserted this security is provided by the
significant pedestrian traffic arising from its high train service frequency.
Siting of open-air bicycle parking is found to be dependent upon train service frequency of
interchanges. Bicycle parking at less-busy train interchanges is found to be closer to station
entrances than parking at busier interchanges. This may occur because bicycles at less-
busy interchanges need to be parked closer in order to be seen by accessing and egressing
passengers.
There is a significant difference in parking distance between bicycles in secure bicycle
lockers and bicycles parked in the open-air. On an aggregate level, the results indicate
secure bicycle parking facilities can be located at further distances to station entrances
without significant deterioration in patronage. For a decision maker looking to implement
bicycle parking spaces, this could mean secure bicycle lockers can be placed away from
congested pedestrian approaches to maintain pedestrian safety whilst at the same time
encouraging bicycle parking patronage.
The presence of shelter, CCTV cameras, shops and bus stops may be useful proxies to site
open-air bicycle parking. This makes sense given shelter provides protection against the
elements and the latter three indicate surveillance against bicycle theft. For example, shops
attract pedestrian traffic and are occupied by shop staff.
Some demographic and urban form characteristics are indicated important predictors for
bicycle parking levels. These were population density, employment density and location of
interchanges in the urban fabric. This agrees with results of various literature discussing
bicycle-transit demand (Chen et al., 2012; Hegger, 2007; Keijer & Rietveld, 1999; Lehman
et al. 2009; Martens, 2004; Rietveld, 2000).
As a penultimate remark, the efficacy of interchange service frequency towards
heterogeneously indicating suitable siting of bicycle parking spaces and selection between
bicycle parking devices at interchanges is worthy of consideration. It is a continuous,
objective and easily attainable characteristic for decision makers. This study adopted a
methodology that was able to find bicycle parkers prefer to locate their bicycles differently
according to different levels of interchange service frequency. It also indicated that service
Page 15
Australasian Transport Research Forum 2013 Proceedings
2 - 4 October 2013, Brisbane, Australia
Publication website: http://www.patrec.org/atrf.aspx
15
frequency may be a delineating factor to select between secure and non-secure parking
devices at interchanges, given it is a proxy for bicycle surveillance against theft and
vandalism. The implication is that less-busy train interchanges are in greater need for secure
bicycle parking devices more than busier interchanges. This agrees with practice in the
Netherlands where secure bicycle lockers are for the most part reserved for smaller stations
(Hegger, 2007; Martens, 2007).
Of interest especially is the percentage of bicycles found parked within station walkways.
10% of all open-air bicycles are parked within station entrances and for bicycles parked at
stations with hourly services <15 in the a.m. peak the percentage is 20%. This is evident
with reference to Figures 4 and 5. This indicates the possible success of implementing
bicycle parking facilities within station walkways and concourses, especially at less busy
interchanges. Such is the widespread practice in Chicago with 83 CTA stations offering
bicycle parking indoors (Pucher & Buehler, 2009).
References
Australian Bureau of Statistics 2011, Basic Community Profile Based on Usual Place of
Residence, Cat. no. 2001, Australian Bureau of Statistics, Canberra, viewed 14 June 2013,
http://www.abs.gov.au/websitedbs/censushome.nsf/home/communityprofiles?opendocument
&navpos=230
Austroads 2008, Guide to traffic management: Part 11: Parking, report AGTM11/08,
Austroads, Sydney, NSW
Bachand-Marleau, J, Larsen, J, El-Geneidy AM 2011, 'Much Anticipated Marriage of Cycling
and Transit: How Will It Work?’, Transportation Research Record: Journal of the
Transportation Research Board, n 2247, pp. 109-117.
Chen, L, Pel, AJ, Chen, X, Sparing, D, Hansen, IA 2012, 'Determinants of Bicycle Transfer
Demand at Metro Stations', Transportation Research Record: Journal of the Transportation
Research Board, n 2276, pp. 131-137.
Hegger, R 2007, 'Public transport and cycling: Living apart or together?', Public Transport
International, v 56, n 2, pp. 38-41.
Keijer, MJN, Rietveld, P 1999,'How do people get to the railway station? The Dutch
experience', Transportation Planning and Technology, v 23, n 3, pp. 215-235.
Lehman, R, Zhong, J, Cheng, C 2009, ‘The provision and use of bicycle parking at Sydney
region public transport interchanges’, Results of facilities audit and cyclist questionnaire.
Prepared for the New South Wales Premier's Council for Active Living.
Martens, K 2004, 'The bicycle as a feedering mode: Experiences from three European
countries', Transportation Research Part D: Transport and Environment, v 9, n 4, pp. 281-
294.
Page 16
Australasian Transport Research Forum 2013 Proceedings
2 - 4 October 2013, Brisbane, Australia
Publication website: http://www.patrec.org/atrf.aspx
16
Martens, K 2007, 'Promoting bike-and-ride: The Dutch experience', Transportation Research
Part A: Policy and Practice, v 41, n 4, pp. 326-338.
Martin, S 2010, Parkiteer – Secure bicycle parking at PT nodes, The Faculty of Architecture,
Building and Planning: The University of Melbourne, viewed on 20 October 2011,
http://www.abp.unimelb.edu.au/files/miabp/11Martin.pdf
Martin, S, den Hollander, J 2009, ‘Parkiteer - Secure Bicycle Parking at Public Transport
Nodes in Melbourne', 32nd Australasian Transport Research Forum
Moskovitz, DA & Wheeler, N 2011, 'Bicycle Parking Analysis with Time Series Photography',
Transportation Research Record, n 2247, pp. 64-71.
NSW Government 2013, NSW Government, viewed 14 June 2013,
https://appln.transport.nsw.gov.au/bikelockers/faces/jsp/public/home.xhtml
NSW RAIL CORPORATION 2013, NSW RAIL CORPORATION, viewed 14 June 2013,
http://www.cityrail.info/
Parker, AA 1992, 'Beating bicycle theft - a modern-day plague which discourages cycling',
Australian Cyclist, v 16, n 4, pp. 23-25
Pucher, J, Buehler, R 2009, 'Integrating Bicycling and Public Transport in North America',
Journal of Public Transportation, v 12, n 3, pp.79-104.
Rietveld, P 2000, 'The accessibility of railway stations: the role of the bicycle in The
Netherlands', Transportation Research Part D: Transport and Environment, v 5, n 1, pp.71-
75
Third Wave Cycling Group Inc., Via Architecture, Halcrow Consulting 2010, Cycle Support
Services Study - Pilot Bicycle Enclosures study , viewed on 20 October 2011,
http://www.translink.ca/~/media/Documents/cycling/regional_cycling_strategy/Cycle%20Sup
port%20Services%20Pilot%20Bicycle%20Enclosures%20Study.ashx