+ All Categories
Home > Documents > Analysis and Refinement of the TRC-QSPR Method for Vapor Pressure ... · PDF fileAnalysis and...

Analysis and Refinement of the TRC-QSPR Method for Vapor Pressure ... · PDF fileAnalysis and...

Date post: 10-Mar-2018
Category:
Upload: votu
View: 215 times
Download: 1 times
Share this document with a friend
11
The Open Thermodynamics Journal, 2011, 5, (Suppl 1-M3) 29-39 29 1874-396X/11 2011 Bentham Open Open Access Analysis and Refinement of the TRC-QSPR Method for Vapor Pressure Prediction I. Paster 1 , N. Brauner 2 and M. Shacham 1, * 1 Department of Chemical Engineering, Ben-Gurion University of the Negev, Beer-Sheva 84105, Israel 2 School of Engineering, Tel-Aviv University, Tel-Aviv 69978, Israel Abstract: Various aspects associated with the use of the TRC-QSPR method (Shacham et al., Ind. Eng. Chem. Res. 49, 900-912, 2010, Ref. [1]) for the prediction of vapor pressure are investigated using a test set of 12 compounds from the n- alkane series. This test set is used to check the consistency of the parameter values of the Wagner and Riedel equations and the resulting vapor pressure values in the full range between the triple point and critical point. Inconsistency has been detected in the parameters of the commonly used version of the Riedel equation as well as the calculated vapor pressure values near the critical point, T R >0.9. Vapor pressures prediction studies are carried out for the cases of interpolation, short and long range extrapolation and using either the acentric factor ( ), or number of C atoms (n C ), or the VEA1 descriptor in the TRC-QSPR equation. It is concluded that the prediction error is the lowest and within the experimental error limits over the entire temperature range, using the Wagner's equation and within the TRC-QSPR framework. Replacing by n C or by the descriptor VEA1 increases the prediction error, however good prediction accuracy is retained in the regions where experimental data are available for the predictive compounds. It is demonstrated that reliable vapor pressure predictions can be obtained using only n C for characterization of the target compound. Keywords: Vapor-pressure prediction, pure component, TRC-QSPR, Wagner equation, Riedel equation. INTRODUCTION Pure component vapor pressure data are essential for phase equilibrium computation, process and product design, in assessing the environmental impact of a chemical compound and in modeling some types of toxicity (Dearden [2]). At present, vapor pressure data are available only for a small fraction of the compounds of interest to the chemical industry. Even if the data are available they may not cover the full temperature range of interest. In product design vapor pressure values may be required for substances that have not been synthesized yet. Thus, prediction of saturated vapor pressure data is often essential. Current methods used to predict temperature-dependent properties can be classified into "group contribution" methods, methods based on the "corresponding-states principle" (for reviews of these methods see, for example, Poling et al., [3], Godavarty et al., [4] and Velasco et al., [5]) and "asymptotic behavior" correlations (see, for example, Marano and Holder [6]). These methods rely on several other property values, such as normal boiling temperature (T b ), critical temperature (T C ), critical pressure (P C ), and acentric factor ( ). However, such data for properties may not be available for a target compound, for which the vapor pressure has to be predicted. Moreover, these methods Address correspondence to this author at the Department of Chemical Engineering, Ben Gurion University of the Negev, Israel; Tel: +972-8-64-61481; Fax: +972-8-64-72916; E-mail: [email protected] contain adjustable parameters that were fitted to a training set, which may not represent well enough the target compound. A detailed discussion of these issues can be found, for example in Ref. [7]. In recent years, there has been increasing interest in using molecular descriptors integrated into Quantitative Structure Property Relationships (QSPR) for prediction of vapor pressure. However, the great majority of the currently available QSPR models are limited to prediction at a single temperature of 298 K. The exceptions are the methods of Godavarthy [4], which combine their scaled variable reduced coordinates (SVRC) model with neural-network-based QSPRs for representing the nonlinear relations between the SVRC model parameters and molecular descriptors for 1221 molecules. Neural-network QSPR for representing the vapor pressure-temperature behavior of 274 hydrocarbons was used also by Yaffe and Cohen [8]. We are aiming at developing methods for accurate prediction of the vapor pressure-temperature relation for a target compound (the compound for which the property has to be predicted), which are based on minimal data for a few compounds of high level of similarity with the target compound. Such a method (TRC-QSPR method) was suggested by Shacham et al., [1]. In the present work various options for using this method are evaluated and compared and the necessary conditions for obtaining reliable and accurate predictions are discussed. The analysis is carried out for the n-alkane homologous series. This series is considered
Transcript

The Open Thermodynamics Journal, 2011, 5, (Suppl 1-M3) 29-39 29

1874-396X/11 2011 Bentham Open

Open Access

Analysis and Refinement of the TRC-QSPR Method for Vapor Pressure Prediction

I. Paster1, N. Brauner

2 and M. Shacham

1,*

1Department of Chemical Engineering, Ben-Gurion University of the Negev, Beer-Sheva 84105, Israel

2School of Engineering, Tel-Aviv University, Tel-Aviv 69978, Israel

Abstract: Various aspects associated with the use of the TRC-QSPR method (Shacham et al., Ind. Eng. Chem. Res. 49,

900-912, 2010, Ref. [1]) for the prediction of vapor pressure are investigated using a test set of 12 compounds from the n-

alkane series. This test set is used to check the consistency of the parameter values of the Wagner and Riedel equations

and the resulting vapor pressure values in the full range between the triple point and critical point. Inconsistency has been

detected in the parameters of the commonly used version of the Riedel equation as well as the calculated vapor pressure

values near the critical point, TR >0.9.

Vapor pressures prediction studies are carried out for the cases of interpolation, short and long range extrapolation and

using either the acentric factor ( ), or number of C atoms (nC ), or the VEA1 descriptor in the TRC-QSPR equation. It is

concluded that the prediction error is the lowest and within the experimental error limits over the entire temperature range,

using the Wagner's equation and within the TRC-QSPR framework. Replacing by nC or by the descriptor VEA1

increases the prediction error, however good prediction accuracy is retained in the regions where experimental data are

available for the predictive compounds. It is demonstrated that reliable vapor pressure predictions can be obtained using

only nC for characterization of the target compound.

Keywords: Vapor-pressure prediction, pure component, TRC-QSPR, Wagner equation, Riedel equation.

INTRODUCTION

Pure component vapor pressure data are essential for phase equilibrium computation, process and product design, in assessing the environmental impact of a chemical compound and in modeling some types of toxicity (Dearden [2]). At present, vapor pressure data are available only for a small fraction of the compounds of interest to the chemical industry. Even if the data are available they may not cover the full temperature range of interest. In product design vapor pressure values may be required for substances that have not been synthesized yet. Thus, prediction of saturated vapor pressure data is often essential.

Current methods used to predict temperature-dependent properties can be classified into "group contribution" methods, methods based on the "corresponding-states principle" (for reviews of these methods see, for example, Poling et al., [3], Godavarty et al., [4] and Velasco et al., [5]) and "asymptotic behavior" correlations (see, for example, Marano and Holder [6]). These methods rely on several other property values, such as normal boiling temperature (Tb), critical temperature (TC), critical pressure (PC), and acentric factor ( ). However, such data for properties may not be available for a target compound, for which the vapor pressure has to be predicted. Moreover, these methods

Address correspondence to this author at the Department of Chemical

Engineering, Ben Gurion University of the Negev, Israel;

Tel: +972-8-64-61481; Fax: +972-8-64-72916;

E-mail: [email protected]

contain adjustable parameters that were fitted to a training set, which may not represent well enough the target compound. A detailed discussion of these issues can be found, for example in Ref. [7].

In recent years, there has been increasing interest in using molecular descriptors integrated into Quantitative Structure Property Relationships (QSPR) for prediction of vapor pressure. However, the great majority of the currently available QSPR models are limited to prediction at a single temperature of 298 K. The exceptions are the methods of Godavarthy [4], which combine their scaled variable reduced coordinates (SVRC) model with neural-network-based QSPRs for representing the nonlinear relations between the SVRC model parameters and molecular descriptors for 1221 molecules. Neural-network QSPR for representing the vapor pressure-temperature behavior of 274 hydrocarbons was used also by Yaffe and Cohen [8].

We are aiming at developing methods for accurate

prediction of the vapor pressure-temperature relation for a

target compound (the compound for which the property has

to be predicted), which are based on minimal data for a few

compounds of high level of similarity with the target

compound. Such a method (TRC-QSPR method) was

suggested by Shacham et al., [1]. In the present work various

options for using this method are evaluated and compared

and the necessary conditions for obtaining reliable and

accurate predictions are discussed. The analysis is carried out

for the n-alkane homologous series. This series is considered

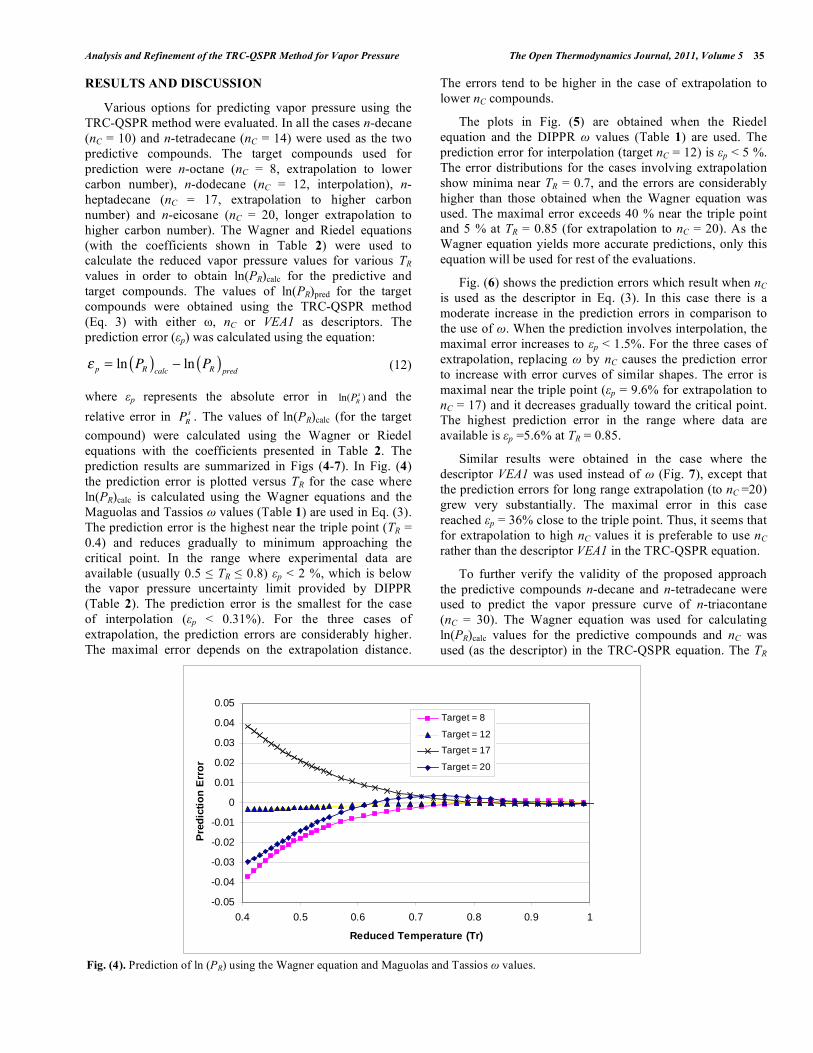
30 The Open Thermodynamics Journal, 2011, Volume 5 Paster et al.

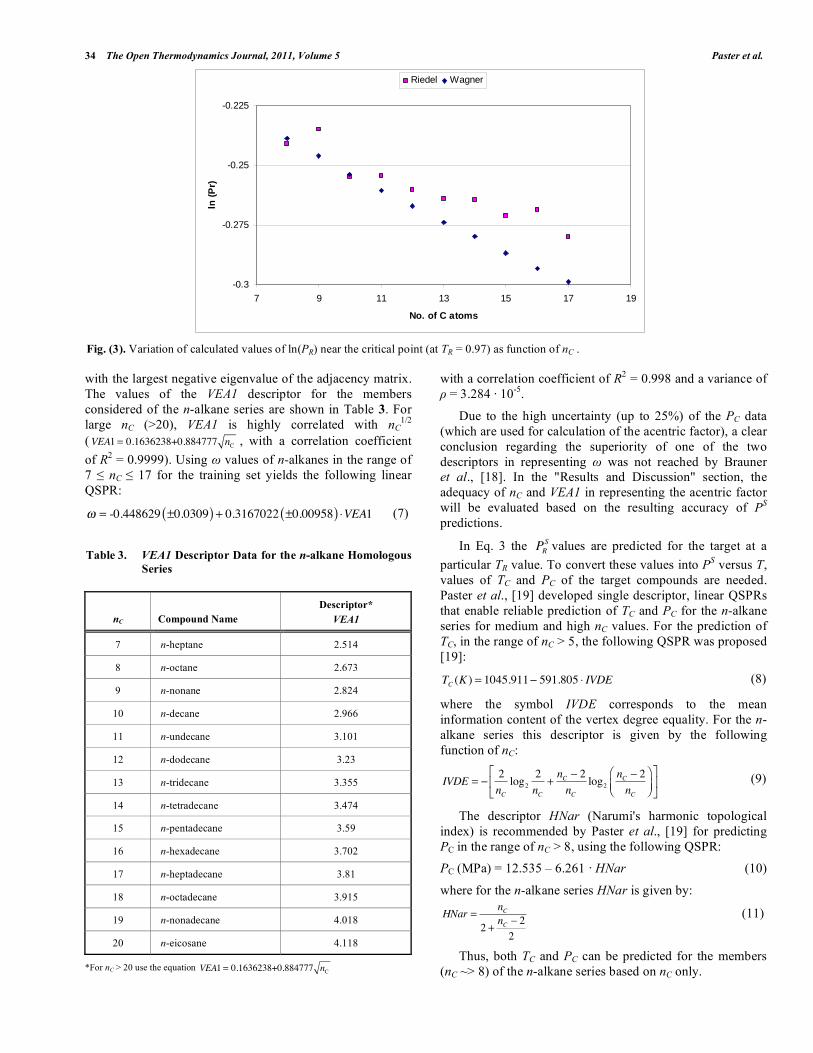
a basic reference group of similar compounds for property

prediction studies due to the large amount of property data

available. Reliable prediction of the properties of high

carbon number compounds for the n-alkane series can serve

as a basis for extending the prediction to other homologous

series more complex compounds (see, for example, Willman

and Teja, [9]).

METHODOLOGY

The Two Reference Compound Quantitative Structure

Property Relationship (TRC-QSPR) approach has been

described in detail and applied successfully for prediction of

numerous properties of pure components (Shacham et al.,

[10], Brauner et al., [11], Shacham et al., [1]). It will be

briefly reviewed hereunder.

The TRC-QSPR method is used for predicting

temperature (or pressure) dependent properties of a pure

target compound, using known property values of two

predictive compounds, which are similar to the target.

Compounds belonging to the same homologous series of the

target compound can be considered "similar". If the identity

of similar compounds is not obvious, the Targeted QSPR

method Brauner et al., [12] can be used for detecting

compounds similar to the target. In the present work the

discussion is limited to the case where the target and the

predictive compounds belong to the same homologous

series.

Application of the TRC-QSPR method requires

identification of a molecular descriptor

j , which is

collinear with the property to be predicted, y

p for the group

of compounds similar to the target. The identification of such

descriptors is discussed in detail by Brauner et al., [12].

Once such a descriptor has been identified, the temperature

or pressure dependent property of a target compound ytp can

be predicted (at a particular temperature or pressure) using

the following property–property relationship:

yt

p=

2

j

t

j

2

j

1

jy

1

p+

t

j

1

j

2

j

1

jy

2

p (1)

where y1p

and y2p

are the property values (at the same

reference temperature, or pressure) of two predictive

compounds which are similar to the target compound, 1j,

2j and

t

j are the selected descriptor values for predictive

compounds 1 and 2 and the target compound, and ytp

is the

predicted property value of the target compound.

Shacham et al., [1] proposed two methods for predicting

vapor pressure. The first one involves prediction of the

saturation temperature (Ts) at a specified vapor pressure. In

this case descriptors collinear with the normal boiling

temperature (Ts at atmospheric pressure) are used in the

property–property relationship. For this case Eq. 1 is

rewritten:

Tts=

2j

tj

2j

1j T1

s + tj

1j

2j

1j T2

s (2)

Another option is to predict the logarithm of the reduced

vapor pressure, ln(PRs ) of the target compound at a specified

reduced temperature value. Substituting ln(PRs ) as the

predicted property into Eq. 1 yields

ln(PR,ts ) = 2

jtj

2j

1j ln(PR,1

s ) + tj

1j

2j

1j ln(PR,2

s ) (3)

where PR,1s

and PR,2s

are the reduced saturation pressures (at

a particular reduced temperature of the predictive

compounds and PR,ts

is the (predicted) reduced saturation

pressure of the target compound at TR0. The descriptor j

used in this case must be collinear with ln(PRs ) at the

particular TR0 value. For example, at TR = 0.7 a descriptor

collinear with the acentric factor, = log(PRs )TR=0.7 1 , can

be used. It is assumed the same descriptor is collinear with

ln(PRs ) at other TR values as well. The acentric factor is

available for a large number of compounds. It is worth

noting that upon using as the descriptor in Eq. 3, the TRC-

QSPR method reduces to a refined version the traditional

“two reference fluid” method, which is discussed in some

detail, for example, by Poling et al., [3].

Compared to Eq. 2, Eq. 3 requires more information

for predicting the vapor pressure of the target compound

(i.e., Pc, Tc). However, the application of Eq. (2) requires that

the saturation temperatures of the predictive and target

compounds correspond to a common range of validity for

vapor pressure data [1]. Consequently, difficulties may be

encountered in predicting vapor pressure near the critical

point or near the triple point. Therefore, in this paper only

the TRC-QSPR of Eq. 3 will be considered.

In principle, the TRC-QSPR method can be applied by

using experimental vapor pressure values for the predictive

compounds. Yet, to obtain vapor pressure values for the

predictive compounds at the same specified (reduced)

temperature, equations representing the vapor pressure data

vs. temperature of the predictive compounds (at least at the

vicinity of the specified TR ) are needed. For this aim we use

in this work the Riedel equation:

ln(P

i

s ) = Ai+

Bi

T+ C

ilnT + D

iT

2 (4)

and the Wagner equation (as presented by Magoulas and

Tassios [13]):

ln(PRi

s ) =1

TR

a1i

q + a2i

q1.5+ a

3iq

2.5+ a

4iq

5( ); q = 1 TR

(5)

There are several variants of the Riedel and Wagner

equations. The original equation proposed by Riedel [14]

uses TR and PR as variables and the exponent on the last term

is 6 (instead of the 2 in Eq. 4). Equation 4 was used here as

Analysis and Refinement of the TRC-QSPR Method for Vapor Pressure The Open Thermodynamics Journal, 2011, Volume 5 31

the coefficients for a large number of compounds are

available for this form (e.g., DIPPR database [15]) and

consequently it is more extensively used. In the original

Wagner equation [16], the exponents on the last two terms

are 3 and 6, respectively (instead of 2.5 and 5). The form of

Eq. 5 is used here as the associated coefficients for the

compounds of interest were obtained by Ambrose (as cited

by Magoulas and Tassios [13]). For evaluation of the

accuracy of the TRC-QSPR method, the vapor pressure

calculated by either the above vapor pressure models are

considered as “true” experimental data.

Equation 3 is used for point-by-point prediction of PR,ts

for the target compound at various TR values over the entire

liquid phase range. If desired, the predicted vapor pressure

values can then be used to fit a vapor pressure model by

regression.

Some of the data used in this study are shown in Tables 1

and 2. The compounds used are 12 members of the n-alkane

homologous series containing between 8 to 30 carbon atoms

(nC). Two compounds: n-decane (nC = 10) and n-tetradecane

(nC = 14) are used as predictive compounds, and the rest

of the compounds as target compounds. The critical

temperature (TC), critical pressure (PC) and the acentric

factor ( ) for all these compounds are listed in Table 1. Two

sets of data are included: one from the DIPPR database [15]

and the other from Magoulas and Tassios [13]. Observe

that there are some differences between the values provided

by the different sources. These are however lower than

the uncertainties provided in the DIPPR database: the

uncertainty on most TC values is <0.2 %, for n-eicosane it is

< 1.0% and for n-triacontane < 3.0 %. The uncertainty on the

PC values of the low nC compounds is < 3 % and it increases

up to < 25% for the high nC compounds.

The Riedel (Eq. 4) constants from the DIPPR database

and the Wagner (Eq. 5) coefficients from Magoulas and

Tassios [13] are shown in Table 2. For the Riedel equation

uncertainty on the calculated vapor pressure values

are available. These values are < 1% or < 3% for most

compounds, < 5% for n-eicosane and < 10% for n – triacontane.

The validity range for the Riedel equation indicated

by DIPPR for all the compounds is between the triple

point temperature (TR ~ 0.4) and the critical temperature.

Comparing the validity range of the Riedel equation with the

range of the available experimental data in the DIPPR

database (typically in the range 0.5 TR 0.8) shows

that the use of the vapor pressure equations involves

extrapolation in the vicinity of the triple and critical points.

To apply the TRC-QSPR method to a target compound

with unknown properties, molecular descriptors need to be

used to predict TC, PC and . To carry out the studies

described in this paper, a molecular descriptor database for

the n-alkane series was prepared. Molecular structures of the

various compounds for up to nC = 330 were drawn using

the HyperChem package (Version 7.01, Hyperchem is

copyrighted by Hypercube Inc). The Dragon program

(version 5.5, DRAGON is copyrighted by TALETE srl,

http://www.talete.mi.it, [24]) was used to calculate the

descriptors. The limit for molecular size in Dragon 5.5 is

1000 atoms per molecule. This limit dictated the maximal nC

(= 330) for the molecules used in the study. As 3-D

Table 1. TC,PC and Acentric Factor ( ) Data from Two Sources, for the Compounds Included in the Study

TC (K)* PC (MPa)

*

* TC (K)

+ PC

+

No. Compound nC Value Uncertainty PC (MPa) Uncertainty (bar)+

1 n-octane 8 568.7 < 0.2% 2.49 < 3% 0.39955 568.95 24.9 0.397

2 n-nonane 9 594.6 < 0.2% 2.29 < 3% 0.44346 594.9 22.9 0.443

3 n-decane 10 617.7 < 0.2% 2.11 < 3% 0.49233 617.65 21.05 0.49

4 n-undecane 11 639 < 0.2% 1.95 < 5% 0.53032 638.85 19.55 0.533

5 n-dodecane 12 658 < 0.2% 1.82 < 10% 0.57639 658.65 18.3 0.573

6 n-tridecane 13 675 < 0.2% 1.68 < 10% 0.6174 676 17.1 0.618

7 n-tetradecane 14 693 < 0.2% 1.57 < 25% 0.64302 693 16.1 0.654

8 n-pentadecane 15 708 < 0.2% 1.48 < 25% 0.68632 708 15.15 0.696

9 n-hexadecane 16 723 < 0.2% 1.4 < 25% 0.7174 722 14.35 0.737

10 n-heptadecane 17 736 < 0.2% 1.34 < 25% 0.76969 735 13.7 0.772

11 n-eicosane 20 768 < 1.0% 1.16 < 25% 0.906878 769 11.6 0.891

12 n-triacontane 30 844 < 3.0% 0.8 < 25% 1.30718 - - -

*Source: DIPPR database [15] +Source: [13]

32 The Open Thermodynamics Journal, 2011, Volume 5 Paster et al.

geometry optimization of the structures was not carried out,

3-D descriptors were excluded from the data base.

ANALYSIS OF THE CONSISTENCY OF THE

RIEDEL AND WAGNER EQUATIONS

Usually, vapor pressure equations are evaluated by

analyzing their ability to represent the vapor pressure data in

the entire range between the triple point and TC. The

parameters of the vapor pressure equations are obtained by

fitting the model to experimental data. However, the set of

parameters which adequately represent the data may not be

unique, since the various temperature terms in the model are

correlated, and consequently their corresponding parameter

values are correlated, as well. A more careful evaluation of

the vapor pressure model requires the analysis of the

consistency of the variation of the equation parameters and

the resulting vapor pressure values within the family of

similar compounds.

In homologous series, the reduced vapor pressure at a

specified reduced temperature varies smoothly with the

change of the carbon number, nC. Consequently, it can be

expected that the change of the equation parameters will also

exhibit a smooth variation with nC. In Fig. (1) the Wagner

equation coefficients (normalized by dividing them by the

respective coefficient of the largest absolute value) are

plotted versus nC. Observe that all coefficients vary

monotonically with nC, except a4, for which there are some

small deviations. In fact, the variation of the coefficient

values can be represented by low order polynomial of nC. On

the other hand, the plot of the normalized Riedel equation

coefficients (Fig. 2) reveals inconsistent variation due to

deviating points (nC = 15, for example) for all the coefficients,

with essentially random behavior of the coefficient D. Based

on our previous study on this subject (Brauner and Shacham

[17]) we believe that the high level inconsistency of the

Riedel equation parameters is caused by numerical ill-

conditioning, as there are several orders of magnitude

difference between the various terms included in Eq. 4. For

n-pentadecane, for example, TC = 708 K and the highest

temperature for which vapor pressure value is available is T

=577 K. Thus, in Eq. 4 (1/T) = 1.76 10-3

, while T

2 =

3.33 105 (i.e., 8 orders of magnitude difference between the

smallest and the largest terms). Such a large difference

between the terms results in an ill-conditioned regression

problem, which may lead to statistically insignificant

parameter values, which exhibit inconsistent variation within

a group of similar compounds. In comparison, in the case of

the Wagner equation, TR = 0.815; q = 0.185 and q5 = 0.034,

thus the largest difference between the various terms is less

than two orders of magnitude. In order to avoid ill-

conditioning it is important to rescale the terms included in

the model. It can be expected, for example, that the Riedel

equation which is formulated in terms of reduced vapor

pressure vs. the reduced temperature, would exhibit a

consistent behavior. However, the investigation of this

option is outside the scope of the present paper.

The high level of inconsistency of the Riedel equation

coefficient values completely rules out the option of

developing of a reliable QSPR for predicting directly its

coefficients (instead of the point by point prediction of

the vapor pressure values). For the Wagner equation,

the small inconsistency of the a4 values implies that the

point-by-point prediction would also result is better

prediction accuracy.

Table 2. Riedel (Eq. 4) and Wagner (Eq. 5) Coefficients from Two Sources, for the Compounds Included in the Study

Riedel Equation* Wagner Equation

+

No. Compound A B C D Uncert. a1 a2 a3 a4

1 n-octane 96.084 -7900.2 -11.003 7.1802E-06 < 3% -8.04937 2.03865 -3.312 -3.648

2 n-nonane 109.35 -9030.4 -12.882 7.8544E-06 < 3% -8.32886 2.25707 -3.8257 -3.732

3 n-decane 112.73 -9749.6 -13.245 7.1266E-06 < 1% -8.60643 2.44659 -4.2925 -3.908

4 n-undecane 131 -11143 -15.855 8.1871E-06 < 3% -8.85079 2.60205 -4.7305 -4.081

5 n-dodecane 137.47 -11976 -16.698 8.0906E-06 < 1% -9.08593 2.77846 -5.1985 -4.176

6 n-tridecane 137.45 -12549 -16.543 7.1275E-06 < 3% -9.32959 2.89925 -5.555 -4.47

7 n-tetradecane 140.47 -13231 -16.859 6.5877E-06 < 3% -9.5447 3.06637 -6.007 -4.53

8 n-pentadecane 135.57 -13478 -16.022 5.6136E-06 < 3% -9.80239 3.29217 -6.5317 -4.584

9 n-hexadecane 156.06 -15015 -18.941 6.8172E-06 < 3% -10.03664 3.41426 -6.8627 -4.863

10 n-heptadecane 156.95 -15557 -18.966 6.4559E-06 < 3% -10.236 3.54177 -7.1898 -5

11 n-eicosane 203.66 -19441 -25.525 8.8382E-06 < 5% -10.97958 4.25588 -8.9573 -5.043

12 n-triacontane 386.27 -34581 -50.953 1.6324E-05 < 10% - - - -

*Source: DIPPR database [15] +Source: [13].

Analysis and Refinement of the TRC-QSPR Method for Vapor Pressure The Open Thermodynamics Journal, 2011, Volume 5 33

To test the consistency of the calculated vapor pressure

values (PS) in the full range between the triple point and TC,

the ln(PR) values were plotted versus nC for various TR values

in this range. One such plot for TR = 0.97 is shown in Fig.

(3). Observe that when the Wagner equation is used for the

calculations, ln(PR) decreases monotonically from -0.24 at

nC = 8 to -0.3 at nC = 17. On the other hand, when the Riedel

equation is used, the behavior of ln(PR) is inconsistent: it

starts with the value of -0.24 at nC = 8, increases to -0.235 at

nC = 9, decreases to -0.25 at nC = 10, and reaches finally the

value of -0.28 at nC = 17.

Examining the variation of ln(PR) versus nC over the

entire range of interest shows that the Wagner equation

yields consistent ln(PR) values from close to the triple point

up to the critical point, while with the Riedel equation

inconsistent ln(PR) values are obtained for TR > 0.9.

SELECTION OF THE DESCRIPTORS FOR REP-

RESENTING THE ACENTRIC FACTOR, TC AND PC

Descriptors that are collinear with the acentric factor

for members of the n-alkane series in the region where

data are available (and do not converge to a constant value

for nC ) were considered by Brauner et al., [18]. Two

potential candidates were identified: the descriptor nC and

the descriptor VEA1. Using values of n-alkanes in the

range of 7 nC 17 the following linear relationship

between nC and was obtained:

= 0.0761729 ±0.0226( ) + 0.040814 ±0.00182( ) nC (6)

with a correlation coefficient of R2 = 0.9965 and variance of

= 7.129 · 10-5

.

The descriptor VEA1 is a 2-D eigenvalue-based index and

it is defined by the coefficients of the eigenvector associated

Fig. (1). Plot of normalized Wagner equation coefficients versus nC

Fig. (2). Plot of normalized Riedel equation coefficients versus nC.

0.3

0.4

0.5

0.6

0.7

0.8

0.9

1

5 8 11 14 17 20

No. of C-atoms

No

rmal

ized

Wag

ner

Co

effs

.

a1n

a2n

a3n

a4n

0.4

0.5

0.6

0.7

0.8

0.9

1

5 8 11 14 17 20

No. of C atoms

No

rmal

ized

Rie

del

Co

effs

.

An

Bn

Cn

Dn

34 The Open Thermodynamics Journal, 2011, Volume 5 Paster et al.

with the largest negative eigenvalue of the adjacency matrix.

The values of the VEA1 descriptor for the members

considered of the n-alkane series are shown in Table 3. For

large nC (>20), VEA1 is highly correlated with nC1/2

(VEA1 = 0.1636238+0.884777 nC , with a correlation coefficient

of R2 = 0.9999). Using values of n-alkanes in the range of

7 nC 17 for the training set yields the following linear

QSPR:

= -0.448629 ±0.0309( ) + 0.3167022 ±0.00958( ) VEA1 (7)

with a correlation coefficient of R2 = 0.998 and a variance of

= 3.284 · 10-5

.

Due to the high uncertainty (up to 25%) of the PC data

(which are used for calculation of the acentric factor), a clear

conclusion regarding the superiority of one of the two

descriptors in representing was not reached by Brauner

et al., [18]. In the "Results and Discussion" section, the

adequacy of nC and VEA1 in representing the acentric factor

will be evaluated based on the resulting accuracy of PS

predictions.

In Eq. 3 the PRS

values are predicted for the target at a

particular TR value. To convert these values into PS versus T,

values of TC and PC of the target compounds are needed.

Paster et al., [19] developed single descriptor, linear QSPRs

that enable reliable prediction of TC and PC for the n-alkane

series for medium and high nC values. For the prediction of

TC, in the range of nC > 5, the following QSPR was proposed

[19]:

TC (K ) = 1045.911 591.805 IVDE (8)

where the symbol IVDE corresponds to the mean

information content of the vertex degree equality. For the n-

alkane series this descriptor is given by the following

function of nC:

IVDE =2

nClog2

2

nC+nC 2

nClog2

nC 2

nC (9)

The descriptor HNar (Narumi's harmonic topological

index) is recommended by Paster et al., [19] for predicting

PC in the range of nC > 8, using the following QSPR:

PC (MPa) = 12.535 – 6.261 · HNar (10)

where for the n-alkane series HNar is given by:

HNar =nC

2 +nC 2

2

(11)

Thus, both TC and PC can be predicted for the members

(nC ~> 8) of the n-alkane series based on nC only.

Fig. (3). Variation of calculated values of ln(PR) near the critical point (at TR = 0.97) as function of nC .

Table 3. VEA1 Descriptor Data for the n-alkane Homologous

Series

nC Compound Name

Descriptor*

VEA1

7 n-heptane 2.514

8 n-octane 2.673

9 n-nonane 2.824

10 n-decane 2.966

11 n-undecane 3.101

12 n-dodecane 3.23

13 n-tridecane 3.355

14 n-tetradecane 3.474

15 n-pentadecane 3.59

16 n-hexadecane 3.702

17 n-heptadecane 3.81

18 n-octadecane 3.915

19 n-nonadecane 4.018

20 n-eicosane 4.118

*For nC > 20 use the equation VEA1 = 0.1636238+0.884777 nC

-0.3

-0.275

-0.25

-0.225

7 9 11 13 15 17 19

No. of C atoms

ln (

Pr)

Riedel Wagner

Analysis and Refinement of the TRC-QSPR Method for Vapor Pressure The Open Thermodynamics Journal, 2011, Volume 5 35

RESULTS AND DISCUSSION

Various options for predicting vapor pressure using the

TRC-QSPR method were evaluated. In all the cases n-decane

(nC = 10) and n-tetradecane (nC = 14) were used as the two

predictive compounds. The target compounds used for

prediction were n-octane (nC = 8, extrapolation to lower

carbon number), n-dodecane (nC = 12, interpolation), n-

heptadecane (nC = 17, extrapolation to higher carbon

number) and n-eicosane (nC = 20, longer extrapolation to

higher carbon number). The Wagner and Riedel equations

(with the coefficients shown in Table 2) were used to

calculate the reduced vapor pressure values for various TR

values in order to obtain ln(PR)calc for the predictive and

target compounds. The values of ln(PR)pred for the target

compounds were obtained using the TRC-QSPR method

(Eq. 3) with either , nC or VEA1 as descriptors. The

prediction error ( p) was calculated using the equation:

p = ln PR( )calc

ln PR( )pred

(12)

where p represents the absolute error in ln(PRs ) and the

relative error in PRs. The values of ln(PR)calc (for the target

compound) were calculated using the Wagner or Riedel

equations with the coefficients presented in Table 2. The

prediction results are summarized in Figs (4-7). In Fig. (4)

the prediction error is plotted versus TR for the case where

ln(PR)calc is calculated using the Wagner equations and the

Maguolas and Tassios values (Table 1) are used in Eq. (3).

The prediction error is the highest near the triple point (TR =

0.4) and reduces gradually to minimum approaching the

critical point. In the range where experimental data are

available (usually 0.5 TR 0.8) p < 2 %, which is below

the vapor pressure uncertainty limit provided by DIPPR

(Table 2). The prediction error is the smallest for the case

of interpolation ( p < 0.31%). For the three cases of

extrapolation, the prediction errors are considerably higher.

The maximal error depends on the extrapolation distance.

The errors tend to be higher in the case of extrapolation to

lower nC compounds.

The plots in Fig. (5) are obtained when the Riedel

equation and the DIPPR values (Table 1) are used. The

prediction error for interpolation (target nC = 12) is p < 5 %.

The error distributions for the cases involving extrapolation

show minima near TR = 0.7, and the errors are considerably

higher than those obtained when the Wagner equation was

used. The maximal error exceeds 40 % near the triple point

and 5 % at TR = 0.85 (for extrapolation to nC = 20). As the

Wagner equation yields more accurate predictions, only this

equation will be used for rest of the evaluations.

Fig. (6) shows the prediction errors which result when nC

is used as the descriptor in Eq. (3). In this case there is a

moderate increase in the prediction errors in comparison to

the use of . When the prediction involves interpolation, the

maximal error increases to p < 1.5%. For the three cases of

extrapolation, replacing by nC causes the prediction error

to increase with error curves of similar shapes. The error is

maximal near the triple point ( p = 9.6% for extrapolation to

nC = 17) and it decreases gradually toward the critical point.

The highest prediction error in the range where data are

available is p =5.6% at TR = 0.85.

Similar results were obtained in the case where the

descriptor VEA1 was used instead of (Fig. 7), except that

the prediction errors for long range extrapolation (to nC =20)

grew very substantially. The maximal error in this case

reached p = 36% close to the triple point. Thus, it seems that

for extrapolation to high nC values it is preferable to use nC

rather than the descriptor VEA1 in the TRC-QSPR equation.

To further verify the validity of the proposed approach

the predictive compounds n-decane and n-tetradecane were

used to predict the vapor pressure curve of n-triacontane

(nC = 30). The Wagner equation was used for calculating

ln(PR)calc values for the predictive compounds and nC was

used (as the descriptor) in the TRC-QSPR equation. The TR

Fig. (4). Prediction of ln (PR) using the Wagner equation and Maguolas and Tassios values.

-0.05

-0.04

-0.03

-0.02

-0.01

0

0.01

0.02

0.03

0.04

0.05

0.4 0.5 0.6 0.7 0.8 0.9 1

Reduced Temperature (Tr)

Pre

dic

tio

n E

rro

r

Target = 8

Target = 12

Target = 17

Target = 20

36 The Open Thermodynamics Journal, 2011, Volume 5 Paster et al.

Fig. (5). Prediction of ln (PR) using the Riedel equation and the DIPPR values.

Fig. (6). Prediction of ln (PR) using Wagner equation and nC as a predictor.

Fig. (7). Prediction of ln (PR) using Wagner equation and the VEA1 descriptor.

-0.2

-0.1

0

0.1

0.2

0.3

0.4

0.5

0.4 0.5 0.6 0.7 0.8 0.9 1

Reduced Temperature (Tr)

Pre

dic

tio

n E

rro

r

Target = 8

Target = 12

Target = 17

Target = 20

-0.02

0

0.02

0.04

0.06

0.08

0.1

0.4 0.6 0.8 1

Reduced Temperature (Tr)

Pre

dic

tio

n E

rro

r

Target = 8

Target = 12

Target = 17

Target = 20

-0.4

-0.35

-0.3

-0.25

-0.2

-0.15

-0.1

-0.05

0

0.05

0.4 0.6 0.8 1

Reduced Temperature (Tr)

Pre

dic

tio

n E

rro

r

Target = 8

Target = 12

Target =17

Target = 20

Analysis and Refinement of the TRC-QSPR Method for Vapor Pressure The Open Thermodynamics Journal, 2011, Volume 5 37

and predicted PR values were converted to T and P

S using the

critical property data of Table 1. Fig. (8) shows that the

predicted PS vs 1/T curve compares favorably with the

DIPPR database "recommended" data.

The point-by-point predicted values of PR of n-

triacontane can be used to find the coefficients of the

Wagner equation (Eq. 5) by multiple linear regression.

The parameter values obtained are a1 = -13.29777; a2 =

5.545463; a3 = -12.86494 and a4 = -7.018145. These

coefficients are consistent with the Wagner equation

coefficients that were provided by Magoulas and Tassios

[13] for lower nC n-alkanes (Fig. 1).

The substantial increase of the prediction error towards

the triple point deserves further explanation. To this aim,

observe the plot of ln(PR) vs. TR for the predictive (nC = 10,

14) and the target (nC = 20) compounds (Fig. 9). The

"distance" between the ln(PR) values of the predictive and

the target compounds increases monotonically when moving

away from the critical point and reaches maximal value

toward the triple point. The same behavior can be observed

with regard to the prediction error, as shown, for example,

in Fig. (6). Thus the larger prediction error is the result of

larger extrapolation distances (in cases where the prediction

involves extrapolation).

CONCLUSIONS

A data set of 12 members of the n-alkane homologous

series containing between 8 to 30 carbon atoms was used to

Fig. (8). Predicted vapor pressure curve and reported values for n-triacontane. The sources of the experimental data are references [20-23].

Fig. (9). Variation of ln(PR) vs TR for the predictive compounds (nC = 10, 14) and the target compound (nC = 20).

1.00E-04

1.00E-02

1.00E+00

1.00E+02

1.00E+04

1.00E+06

1.00E-03 1.50E-03 2.00E-03 2.50E-03 3.00E-03

1/T (1/K)

Pre

ss

ure

(P

a)

Predicted

Ref. [20]

Ref. [21]

Ref. [22]

Ref. [23]

-20

-18

-16

-14

-12

-10

-8

-6

-4

-2

0

0.4 0.6 0.8 1

Reduced Temperature (Tr)

ln(P

r) nC = 20

nC = 10

nC = 14

38 The Open Thermodynamics Journal, 2011, Volume 5 Paster et al.

investigate various aspects of the TRC-QSPR method for

predicting vapor pressure variation with temperature. The

analysis was based on the hypothesis that the parameters of

the vapor pressure models of the predictive compounds

(reference fluids) should be consistent within the family of

similar compounds, in addition to the models ability to

represent the vapor pressure data in the entire range between

the triple point and TC. Thus, the test for consistency is

another dimension for evaluating the adequacy of different

vapor pressure models and for identifying the modifications

required for improving the model if necessary.

Analysis of the consistency of the Riedel equation

parameters (from the DIPPR database [15]) and the Wagner

equation parameters (from [13]) have shown that the Wagner

equation coefficients exhibit a consistent variation with nC,

except for a minor inconsistency in a4. On the other hand, the

Riedel equation parameters exhibit an inconsistent behavior,

with the highest level of inconsistency for the parameter

D. The analysis of the consistency of the calculated

ln(PR) values revealed that the Wagner equation yields

consistent variation with nC for the entire range between

the triple and critical points, while the Riedel equation

may yield inconsistent values for TR>0.9. The high level

of inconsistency of the Riedel equation coefficient values

rules out the option of developing reliable QSPRs for

predicting directly its coefficients, while the same option

may be viable with regard to the coefficient of the Wagner

equation.

Using the TRC-QSPR method for the prediction of ln(PR)

for 4 target compounds (one involving interpolation and

three involving extrapolation) has shown that generally, the

prediction accuracy significantly deteriorates when the

Riedel equation is employed instead of Wagner's equation.

With Wagner's equation, the prediction error is the lowest

(<0.35%) for the case of interpolation and the use of acentric

factor ( ) in the TRC-QSPR equation. Extrapolation, under

the same conditions, increases the prediction error, however,

still yields ln(PR) within experimental error limits except

near the triple point. This is a result of the larger

extrapolation distances (in terms of ln(PR)) near the triple

point.

Replacing by nC or by the descriptor VEA1 increases

the prediction error considerably, however for interpolation

the prediction error still remains below the experimental

limit and for extrapolations the predictions are of acceptable

accuracy in the region where experimental data are usually

available.

Work is currently underway to extend the application of

the method to additional homologous series and other groups

of similar compounds.

CONFLICT OF INTEREST

None Declared.

ACKNOWLEDGEMENT

None Declared.

REFERENCES

[1] M. Shacham, G. St. Cholakov, R. P. Stateva and N. Brauner,

"Quantitative Structure Property Relationships for Prediction of

Phase Equilibrium Related Properties", Ind. Eng. Chem. Res., vol.

49, pp. 900-912, 2010.

[2] J. C. Dearden, “Quantitative Structure–Property Relationships for

Prediction of Boiling Point, Vapor Pressure, and Melting Point”,

Environmental Toxicology and Chemistry, vol. 22, no. 8, pp. 1696–

1709, 2003.

[3] B. E. Poling, J. M.Prausnitz and J. P. O’Connel, Properties of

Gases and Liquids, 5th Ed., McGraw-Hill: New York, 2001.

[4] S. S. Godavarthy, R. L. Robinson and K. A. M. Gasem, "SVRC-

QSPR model for predicting saturated vapor pressures of pure

fluids", Fluid Phase Equilibria, vol. 246, pp. 39-51, 2006.

[5] S. Velasco, F. L. Román, J. A. White and A. Mulero, "A predictive

vapor-pressure equation", J. Chem. Thermodynamics, vol. 40, pp.

789–797, 2008.

[6] J. J. Marano, G. D. Holder, "General Equations for Correlating the

Thermo-physical Properties of n-Paraffins, n-Olefins and other

Homologous Series. 2. Asymptotic Behavior Correlations for PVT

Properties", Ind. Eng. Chem. Res., vol. 36, pp. 1887-1894, 1997.

[7] A. Vetere, "Again the Riedel Equation", Fluid Phase Equilibria,

vol. 240, pp. 155-160, 2006.

[8] D. Yaffe and Y. Cohen, "Neural network based temperature-

dependent quantitative structure property relations (QSPRs) for

predicting vapor pressure of hydrocarbons", J. Chem. Info. Comp.

Sci., vol. 41, pp. 463-477, 2001.

[9] B. Willman, A. S. Teja, "Method for the prediction of pure

component vapor pressures in the range 1 kPa to the critical

pressure", Ind. Eng. Chem. Process Des. Dev., vol. 24, pp. 1033–

1036, 1985.

[10] M. Shacham, N. Brauner, H. Shore and D. Benson-Karhi,

"Predicting Temperature-Dependent Properties by Correlations

Based on Similarity of Molecular Structures – Application to

Liquid Density", Ind. Eng. Chem. Res., vol. 47, pp. 4496-4504,

2008.

[11] N. Brauner, M. Shacham, R. P. Stateva and G. St. Cholakov, "

Prediction of Phase Equilibrium Related Properties by Correlations

Based on Similarity of Molecular Structures", In: J. Jezowski and

J. Thullie (Eds), 19th European Symposium on Computer Aided

Process Engineering – ESCAPE 19, Krakow, Poland, June 13 – 17,

2009, pp. 69 – 74.

[12] N. Brauner, R. P. Stateva, G. St. Cholakov and M. Shacham,

"Structurally “Targeted” QSPR Method for Property Prediction",

Ind. Eng. Chem. Res, vol. 45, pp. 8430–8437, 2006.

[13] K. Magoulas and D. Tassios, "Thermophysical properties of n-

alkanes from C1 to C20 and their prediction for higher ones", Fluid

Phase Equilibria, vol. 56, pp. 119-699, 1990.

[14] L. Riedel, "Neue Dampfdruckformel", Chem. Ing. Tech., vol. 26,

pp. 83-89, 1954.

[15] E. L. Rowley, W. V. Wilding, J. L. Oscarson, Y. Yang and N.

Zundel, DIPPR Data Compilation of Pure Chemical Properties

Design Institute for Physical Properties; Brigham Young University

Provo Utah, 2006. http://www.aiche.org/dippr/ (accessed Sept.

2011).

[16] W. Wagner, "New vapor pressure measurements for argon and

nitrogen, and a new method for establishing rational vapor pressure

equation", Cryogenics, vol. 13, p. 470, 1973.

[17] N. Brauner and M. Shacham, “Role of Range and Precision of the

Independent Variable in Regression of Data”, AIChE J., vol. 44,

no.3, pp. 603-611, 1998.

[18] N. Brauner, I. Paster and M. Shacham, "Linear QSPRs for the

Prediction of Acentric Factor and Critical Volume of Long-Chain

Substances", paper 672e, Presented at the 10AIChE Annual

Meeting, Salt Lake City, UT, Nov. 7-12, 2010.

[19] I. Paster, M. Shacham and N. Brauner, " Adjustable QSPRs for

Prediction of Properties of Long-chain Substances", AIChE J., vol.

57, no.2, pp. 423–433, 2011.

[20] Selected Values of Properties of Hydrocarbons and Related

Compounds, American Petroleum Institute Research Project 44;

Analysis and Refinement of the TRC-QSPR Method for Vapor Pressure The Open Thermodynamics Journal, 2011, Volume 5 39

Thermodynamic Research Center, Texas A&M University, College

Station, Texas, 1980-extant. loose-leaf data sheets.

[21] N. E. Wood and F. Francis, "The Boiling Points of Some

Higher Aliphatic n-Hydrocarbons"; J. Chem. Soc., vol. 129,

p. 1420, 1926.

[22] Catalog Handbook of Fine Chemicals, Aldrich, Milwaukee, WI,

1990.

[23] E. von Sydow, E. Stenhagen, "On the Phase Transitions in Normal

Chain Carboxylic Acids with 12 Up To and Including 29 Carbon

Atoms Between 30 C and the Melting Point"; Ark. Kemi., vol. 6,

pp. 309, 1954.

[24] Todeschini R, Consonni V, Mauri A, Pavan M. DRAGON User's Manual. Milano, Italy: Talete srl, 2006., http://www.talete.mi.it

(accessed Sept. 2011)

Received: April 07, 2011 Revised: July 20, 2011 Accepted: August 30, 2011

© Paster et al.; Licensee Bentham Open.

This is an open access article licensed under the terms of the Creative Commons Attribution Non-Commercial License

(http://creativecommons.org/licenses/by-nc/3.0/) which permits unrestricted, non-commercial use, distribution and reproduction in any medium, provided the work is properly cited.


Recommended