This paper features an assessment the capabilities of several advanced analysis tools for addressing key aerodynamic design issues faced by several prominent classes of VTOL vehicles currently under study. The assessment summarizes the strengths and limitations of a suite of modeling tools – a comprehensive rotorcraft model, a Cartesian grid Euler model, and an unstructured URANS analysis – in matching available data involving ducted propeller and proprotor/wing interactions representative of those faced by candidate compound, tiltrotor/tiltwing, and tailsitter configurations. The intent is to provide insight into the analysis challenges for vehicles involving such design features, the potential of these classes of tools for addressing them, and to motivate possible method upgrades. While the primary application for these methods likely will be for advanced vehicles of the type sought by the U.S. Army Future Vertical Lift program and/or the DARPA V/STOL X-Plane and TERN programs, they could be applicable to a wide range of current and future advanced VTOL vehicles, including unmanned aircraft systems.
NOTATION
Aduct duct area, ft2 c chord, ft CL lift coefficient, L/qAduct CL,T lift coefficient including thrust component,
(L + T sin)/qS CD drag coefficient, D/qAduct CM pitch moment coefficient, M/qcAduct CT rotor thrust coefficient, T/R2R)2
CT,fs thrust coefficient based on free stream velocity CX horizontal force coefficient, (T cos ‒ D)/qS D drag, lbf De effective drag, D + (P/V), lbf L lift, lbf M pitching moment about rotor hub, ft-lbf P rotor power, ft-lbf/sec q free stream dynamic pressure, lbf/ft2 R blade radius, ft S wing planform area, ft2 T thrust, lbf T/HP power loading, lbf/HP T/A disk loading, lbf/ft2
Vfs free stream speed, ft/sec angle of attack, deg air density, slugs/ft3 advance ratio, Vfs/R rotor rotation frequency, rad/sec
Historically, attempts to develop VTOL aircraft with high speed capability (≥250kts) have repeatedly encountered difficulty in meeting speed, range and payload targets, owing to excessive power and/or fuel requirements, high weight-empty fraction, or poor cruise efficiency. Ongoing technology developments (e.g.,[1, 2]) are supporting efforts to overcome these problems and develop advanced vertical takeoff aircraft with high speed capability by using a wide range of lift and propulsion concepts, moving beyond conventional helicopter designs to various forms of compound rotorcraft or other VTOL variants.
Ducted propellers and fans have been among the design features used in VTOL aircraft seeking to attain high speed, and these elements are being considered in several current concept studies, either for propulsion or for a mixed lift/propulsion role (see Figure 1). Low to moderate solidity ducted propellers have also been featured in several recent design studies, as well as in past experimental aircraft such as the Bell X-22 and the Piasecki X-49. It is well known that high-solidity ducted fans can offer both lift and propulsion capability, though typically with relatively poor efficiency in hover. Use of one or more low-to-moderate solidity rotors or ducted propellers would in principle allow hover efficiency higher than prior “fan-in-wing” concepts, though they would exhibit significant drag levels in high speed forward flight unless the lifting rotors are stopped and the duct cavity faired over (e.g., the Ryan XV-5), or a tilting propulsion system is used (as with Bell X-22 or the more recent AgustaWestland Concept Zero aircraft). Whatever variant on this approach is used, however, the ability to analyze the behavior of such ducted systems is essential to support conceptual and preliminary design studies and to properly assess the potential benefits of such vehicles.
2
Another candidate solution enabling high speed VTOL involves tilting open rotor configurations, featuring lifting proprotors for hover, converting to forward flight propulsion. Tiltrotors are clearly the most well developed example of this class of vehicles (Figure 2), but tiltwing and tailsitter concepts can provide many comparable capabilities and are being revisited in recent studies and tests (Figure 3), particularly given that the growing role for unmanned VTOL systems removes prior objections to consideration of these options.
The work described here was undertaken as an offshoot of recent activity involving application of computational design analyses to systems of the types noted above. This activity has indicated the desirability of having appropriately high fidelity models applied as early as possible in the conceptual and preliminary design process; it has also made clear some of the trades involved in the fidelity, generality, ease of use, and design analysis cycle time for their employment. A principal theme of the balance of this paper is using representative validation studies as illustrations of both the capabilities and limitations of available analysis tools for use in these applications; this work is presented to share lessons learned that could be applied to the study of other candidate advanced VTOL designs.
Figure 1: Advanced V/STOL vehicles with ducted rotors or fans currently under study – upper left, AVX Coaxial Compound Helicopter (propulsion); upper right - Boeing Phantom Swift (lift and propulsion); below left – a notional DARPA “flying wing” vehicle with lifting rotors embedded in the airframe; below right – an Aurora Flight Sciences high speed VTOL.
Figure 2: XV-15 tiltrotor demonstrator (left) and the V-22 Osprey (right).
Figure 3: Advanced tailsitter or tilting rotor/wing concepts currently under study – upper left, Northrop Grumman TERN aircraft; upper right – Sikorsky blown wing tailsitter; lower left – NASA tiltwing UAV; below right - NASA Large Civil Tilt Rotor (LCTR) concept.
The details of the results of these validation studies and the resulting assessment will be presented following an outline of background information on prior developments on relevant VTOL systems.
TECHNICAL BACKGROUND
Ducted Prop and Embedded Rotor/Fan Configurations
Wind tunnel and flight tests in the 1950s, 60s and 70s demonstrated that fan-in-wing aircraft can combine hover capability with high maximum flight speeds; however, major challenges were encountered with these designs in simultaneously achieving efficient hover with adequate lift to drag ratio in cruise and sufficient control power to provide acceptable flying qualities during transition between VTOL and forward flight.
The technical literature includes several threads of technical documentation of relevant vehicle developments. One such thread was reviewed by Hickey and Kirk [3] and began with simple isolated fan-in-wing experiments in 1956 [4] (Figure 4, left) but evolved into a series of wind tunnel studies of embedded high solidity fans integrated into increasingly complex airframes [5-7], ranging up a notional subsonic jet V/STOL transport with multiple optional fan installations (Figure 4, right and Figure 5).
Figure 4: Generic fan-in-wing model (left); early wind tunnel demonstrator model (right)
3
These studies provided a wide range of information on installed fan performance in complex airframes, and resources include tests of both subscale and full scale versions of the XV-5A (e.g. [8, 9]) and related concepts (Figure 5). In addition, the reports by Lindenbaum [10] and Fluk [11] reviewing general V/STOL technology offer a wide array of information on prior designs and modeling developments. Also, more recent investigators (e.g. [12, 13]) have been revisiting lift fan designs as well as studying the capability for modern computational methods to capture key flow physics phenomena important to the their operation. Finally, the assembly of information on theory and modeling (e.g., the comprehensive, though now dated, summary of Wooler [14]) further documented work on a wide range of prediction methods and validation databases for embedded rotor/fan (ERF) configurations.
The bulk of lift-fan systems (e.g., Figure 5 and Figure 6) have been tailored for high speed capability (approximately 500 kts) but tended to relatively poor hover efficiency owing the high disk loading of the fans. Larger diameter, reduced-solidity rotor/propellers were used in several past systems (Figure 7) and more recent experimental aircraft (Figure 8) have adopted this design. These aircraft have realistically targeted maximum flight speeds in the 200-250kt range.
Figure 9 illustrates a critical feature of VTOL performance that tends to strongly drive the design choices for ducted rotor/fan systems, given the fundamental need to provide hover capability. The particular trend lines here show installed, full aircraft power loading (T/HP) for both open rotors and ducted/embedded rotor/fan systems as a function of disk loading (T/A), while the gray zones are the approximate “spread” of known designs. For reference, the red line shown is that for an isolated ideal single rotor computed from momentum theory, while the blue line is the analogous ideal theoretical result for a constant-area ducted rotor.
Figure 5: Wind tunnel test of XV-5A configuration (left) and subsonic V/STOL transport wind tunnel test (right)
This figure illustrates the "jump" in historically-observed power loading above T/A=~100 psf and reflects the use of ducted fans at these disk loading levels (departing from the trends observed at lower disk loadings for open rotors). It should be noted that the high end of this T/HP range reflects the use of ducts with relatively low diameter/length ratio (e.g., the X-22 aircraft) vs. the high ratios characteristic of rotor/fans embedded in notional vehicles shown in Figures 1, 7, and 8. A key design and analysis challenge faced by vehicles using ERF designs is
retaining the relatively high T/HP values offered by rotors of low to moderate solidity and moderate disk loading while producing acceptable performance in edgewise flight. Clearly, while adoption of tilting fans (as in Figures 7 and 8) greatly facilitates this possibility, it involves considerable additional mechanical complexity. Equally clearly, assessing the relevant performance penalties strongly motivates the development of valid models for these flow conditions.
Figure 6: Overview of a notional embedded fan V/STOL aircraft for maritime patrol missions based on the XV-5A lift fan concept[12].
Figure 7: Four past lifting fan V/STOL systems – the Doak VZ-4 tilt-duct (left), the Bell X-22 tilt-duct (center left) and the Vanguard Omniplane (center right); and the Piasecki X-49 (below).
Figure 8: Agusta-Westland Concept Zero tilt duct demonstrator aircraft (left) and close-up of the Concept Zero tilting ducted rotor (right).
4
Figure 9: Trends in power loading vs. disk loading for multiple V/STOL concepts (from [10]).
Tilting Rotor Configurations
As noted above, tiltrotor configurations have been the most successful and widely applied high speed VTOL air vehicle design. After being shown to be technically feasible with the McDonnell XV-3 and the Bell XV-15[15], the tiltrotor concept has now seen many thousands of hours of successful operation following the introduction of the V-22 into service in 2007. Pending further prototype flight testing, the AgustaWestland 609 is projected to extend these capabilities into the civil field starting in 2018.
While tiltrotor configurations have enjoyed considerable success, tiltwing designs have also been strongly advocated for manned missions. The design challenges for tiltwing vehicles have many similarities to tiltrotors, though they also pose distinct challenges – particularly in terms of strong interactions between the propeller slipstream and the lifting wing and the sensitivity of these effects to forward speed and propeller thrust. Such issues have long been known, and became evident during the development of the XC-142 aircraft during the 1960s[16, 17]. Many of the same design challenges apply to tailsitter aircraft, which have been studied for a variety of missions in recent years (e.g., [18]; see also Figure 3).
Design analysis methods that could capture both the aerodynamics of open rotors typically used on these aircraft as well as the characteristic interactions of the rotor and wing would be highly desirable; they could address the many pressing questions facing groups tasked with conceptual and preliminary design of tailsitter and tiltwing concepts, and weighing their capabilities against the better known challenges of tiltrotor designs.
OVERVIEW OF METHODS APPLIED
Narrative Description
The analysis of advanced VTOL concepts using the major design features noted above can be addressed using several different levels of modeling tools, including: potential flow/comprehensive analyses; “mid-level” CFD tools; and advanced moving-body URANS CFD methods. The suitability of each depends on the analysis goals, the setup/CPU time available, the range and type of cases to be studied, and the level of departure of the configuration in question from past design practice.
The particular software tools employed here for validation and assessment studies were: CHARM – a comprehensive rotorcraft code featuring a lifting surface/free vortex wake model of the lifting rotors and an inviscid panel model of the airframe and duct; CGE – a cut-cell Cartesian grid Euler CFD model with an actuator disk representation of lifting rotors; and FUN3D – an unstructured URANS model with an option for direct overset blade modeling.
Regarding the CHARM comprehensive model, analysis and design work with this widely-used analysis package has verified its accuracy for conventional ducted rotor and propeller configurations in hover and axial flight [19-21], and the fast panel fuselage model in CHARM [22] can be used to account for duct and airframe effects on performance predictions. The overall strengths of CHARM include: fast panel/fast vortex methods that make first order “full vehicle” calculations (similar to Figure 10) relatively quick and routine; surface meshing requirements that are more straightforward than for viscous CFD applications, though roughly the same as for the CGE Cartesian grid CFD models; and a knowledge base on both open rotor and ducted propeller modeling in hover and axial flight. Limitations of this model include: its assumption of inviscid flow and the consequent limitation to cases with known separation lines; limited applicability in high angle of attack and sidewash conditions; and a reliance on airfoil data, wall effect corrections and, other semi-empirical models.
The Cartesian Grid Euler (CGE) analysis [23-25] was developed at CDI and is a steady/unsteady cut-cell Euler solver that features automatic grid generation and the ability to handle non-watertight non-singular geometries. It is similar in general terms to other Cartesian grid models [26, 27], but includes features that make it well suited to rotorcraft applications, e.g., an actuator disk model for analysis of lifting rotors. It is applicable to complex configurations (see Figure 11) and allows efficient studies of rotor/propeller effects on airframes and wings [28]. It also allows studies of downwash and download, bluff body drag, and operation of the lifting airframe in ground effect. CGE requires more CPU time than CHARM and a roughly equivalent level of setup time, but much less in each area than URANS models, and so qualifies as a “mid-range” CFD tool.
5
Figure 10: CHARM models of the V-22 (left) and the AVX Aircraft Coaxial Compound Helicopter (CCH).
Figure 11: Rotorcraft modeled with CGE and its embedded actuator disk rotor model – right: vorticity field around a generic tiltrotor aircraft; left- downwash field near a notional coaxial helicopter.
The final tool applied was the NASA FUN3D code, a massively parallel URANS analysis that provides flow solutions on unstructured grids for both fixed and rotating bodies. As is well documented [29, 30], FUN3D is a full-featured flow solver with a range of capabilities and applications. Like other methods of this class, however, its setup and execution costs are substantial, though of the tools applied here it provides the best solution for complex configurations with separated flow.
Target Validation Studies
Prior validation studies for general fixed and rotary wing applications for these CHARM and CGE are described in [19-24, 28, 29]. Here we focus on particular cases that are relevant to recent advance VTOL systems.
Tilt Rotor Analysis
A fundamental challenge in the aerodynamic analysis of open proprotor configurations is performance of individual rotor systems in the critical hover and axial flight conditions. The CHARM comprehensive model is well suited for this challenge. Figure 12 shows the computational model of the JVX rotor system, a 2/3 scale V-22 configuration tested at NASA/Ames in the 1980s. Figure 13 shows both the measured hover performance at the NASA/Ames Outdoor Aerodynamic Rotor Facility (OARF)[31]. Additional testing of the JVX rotor was conducted in axial flight at the NASA/Ames 40x80-ft wind tunnel[32]. Figure 14 shows the generally good accuracy available with CHARM for this data set.
One key feature of tilting rotor performance is its behavior in flight conditions other than axial flight. Comparisons of CHARM to a range of data at a constant onset speed of 100 kts but at variable shaft angle of attack were also undertaken for the XV-15 full scale proprotor (compared with data from [33]). Figure 15 shows the CHARM rotor/wake model for these calculations, while
Figure 16 shows the measured and predicted rotor performance.
Figure 12: Axial flight model of the JVX rotor.
Figure 13: Measurement and prediction of JVX (a .658 scale V-22) rotor hover performance using CHARM.
Figure 14: Prediction of the JVX rotor performance in axial flight as predicted by CHARM; power vs. thrust for a range of tip speeds and onset flow speeds shown.
6
s
Figure 15: CHARM model of the XV-15 proprotor in forward flight at an angle of attack of s.
As is evident from these comparisons (and others available in the literature), CHARM provides a generally very capable model in terms of predicting rotor performance for rotor systems typical of those used on tilting rotor systems. Alternate models can be applied to analyze isolated rotor performance, though a recent study[34] has provided a discussion of the application of CHARM compared to alternative full CFD models such as FUN3D, indicating the trades in computer time and accuracy for the respective models.
CT/
0.00 0.02 0.04 0.06 0.08 0.10
CP/
0.000
0.004
0.008
0.012
0.016
0.020
0.02415 deg30 deg60 deg75 deg
Figure 16: Predicted and measured performance for the XV-15 rotor[33]: open symbols = measurement; filled symbols = CHARM.
While very important to the assessment of tiltrotor configurations, rotor aerodynamics are only one of the important mechanisms involved in full vehicle aerodynamics. Tiltrotors such as the V-22 (Figure 17) feature strong wake/airframe interactions, which can lead to significant airframe download and other strong interactions. The CHARM model can in principle address a wide range of cases for such configurations, though cases involving large scale flow separation should be addressed with models such as CGE or FUN3D which have a demonstrated capability for analyzing such cases (e.g., the FUN3D calculation of flow separation over a 2D wing in Figure 18, which mimics one of the important mechanisms in download on tiltrotor wings).
Figure 17: V-22 rotor/wake/airframe as modeled by CHARM in low speed forward flight.
Figure 18: FUN3D model of a 2D wing in uniform onset flow, simulating downwash on an infinite span wing.
Tilt Wing and Tailsitter Analysis
In general, tilt wing and tailsitter configurations can include a wide range of propeller/wing. The available literature includes several experimental studies that provide insight into such issues interactions (Figure 19). For present purposes it was of interest to compare the predictions of the CHARM model of a general research wing/propeller configuration (Figure 20) to a representative subset of available data points for this configuration, to identify the range of applicability of the model. The studies by Grunwald [35] and Traybar [36] include a wide range of speed and angle of attack cases for comparison.
These references contain a significant volume of useful data on this generic configuration, which was tested first at the NASA 30x60 ft wind tunnel at Langley Research Center and then on a moving carriage at the Princeton Dynamic Model Test Track. Not only did results obtained within the latter allow for assessments of repeatbility of the wind tunnel data but also permitted very low speed conditions to be tested with no concerns regarding wall flow separation or recirculation effects at low speed.
The model consisted of an untwisted, constant chord wing 4.2 ft. in span and 1.5 ft in chord that used a NACA 0015 airfoil section. The model also included two three-bladed, 2.0-ft diameter propellers, and a wide variety of operating conditions were studied. Predictions using the CHARM model were compared to measured lift coefficients using including thrust component (CL,T) and horizontal force
7
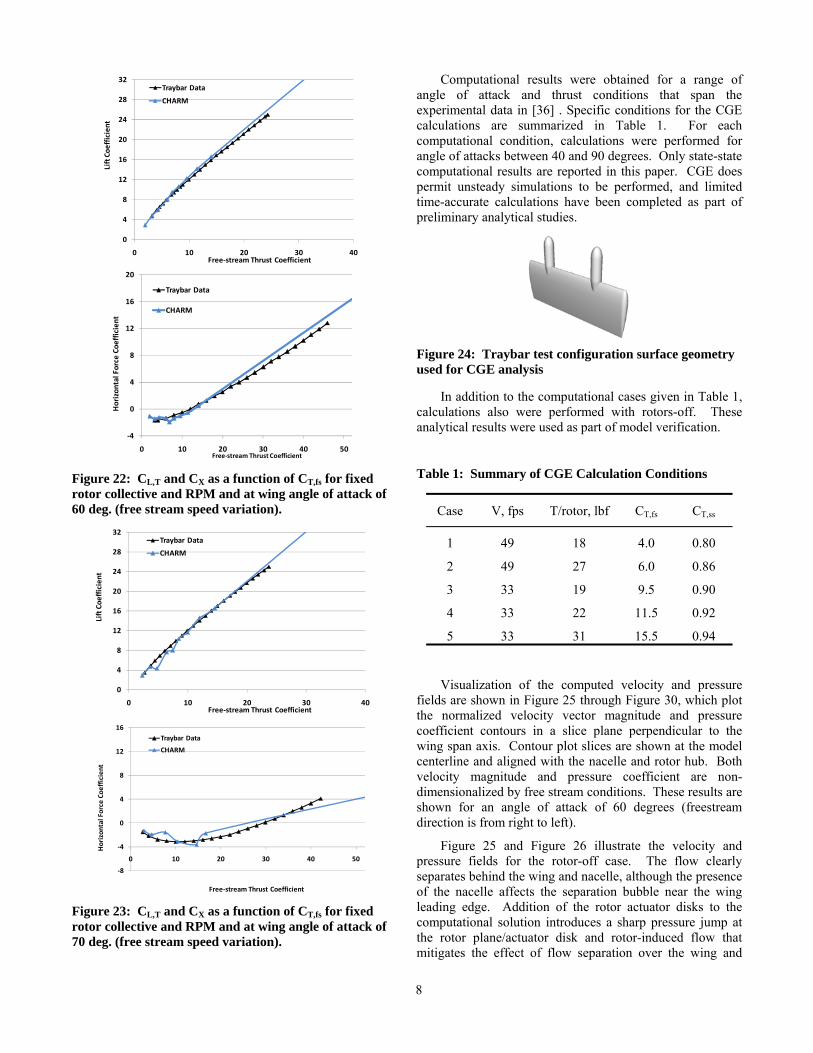
coefficient (CX), and results are shown in Figure 21 through Figure 23 for three different values of wing angle of attack. Here, the blade pitch is held constant with constant RPM while carriage speed is varied to produce a variation in thrust coefficient. It is seen that for angle of attack of 40 and 60 deg., generally good accuracy is achieved. At 70 deg., however, correlation begins to degrade; comparisons at higher angle of attack encounter further inaccuracies, particularly in CX, owing to large scale separation off the wing. Since at high angles of attack CHARM’s fidelity becomes largely dependent on lookup table data for wing drag, it was of interest to see if improved accuracy could be achieved with the CGE analysis.
Figure 19: Wind tunnel (above) and test track (below) experiments on wing/rotor interaction model used for the study of tiltwing and tailsitter aerodynamics.
Figure 20: Initial CHARM model of the wing/propeller combination shown in Figure 19; wing and propellers above, propellers with wing and wake interactions below.
0
4
8
12
16
20
24
28
32
36
0 10 20 30 40
Lift Coefficient
Free‐stream Thrust Coefficient
Traybar Data
CHARM
0
4
8
12
16
20
24
28
32
36
0 10 20 30 40 50
Horizontal Force Coefficient
Free‐stream Thrust Coefficient
Traybar Data
CHARM
Figure 21: CL,T and CX as a function of CT,fs for fixed rotor collective and RPM and at wing angle of attack of 40 deg. (free stream speed variation)
The CGE model was applied to the Traybar experimental configuration to permit these comparisons with data and CHARM analytical results. The surface geometry for CGE (Figure 24) was developed based on dimensions/drawings provided in [36]. Precise dimensions of the nacelles were not available, and approximations were made for these components and fairing with the wing geometry. It is not anticipated that these model approximations will affect significantly the predicted aerodynamic characteristics.
Numerical sensitivity studies including mesh resolution were performed as part of the analytical investigation. For the CGE analysis, this numerical study involved specification of the minimum Cartesian cell size near the surface and rate at which the mesh is coarsened moving away from the surface. The rotors are modeled as actuator disks that were located relative to the surface mesh based on reported dimensions for the experimental configuration. The actuator disk model is implemented by specifying the blade geometry and desired thrust for each rotor. During the CGE solution procedure, the rotor speeds are adjusted to trim the thrust, which is analogous to the experimental procedure used. It was found that the computed trim rotor speeds were consistent with the range of the experimental test program, providing verification that the model was represented of the experimental conditions.
8
0
4
8
12
16
20
24
28
32
0 10 20 30 40
Lift Coefficient
Free‐stream Thrust Coefficient
Traybar Data
CHARM
‐4
0
4
8
12
16
20
0 10 20 30 40 50
Horizontal Force Coefficient
Free‐stream Thrust Coefficient
Traybar Data
CHARM
Figure 22: CL,T and CX as a function of CT,fs for fixed rotor collective and RPM and at wing angle of attack of 60 deg. (free stream speed variation).
0
4
8
12
16
20
24
28
32
0 10 20 30 40
Lift Coefficient
Free‐stream Thrust Coefficient
Traybar Data
CHARM
‐8
‐4
0
4
8
12
16
0 10 20 30 40 50
Horizontal Force Coefficient
Free‐stream Thrust Coefficient
Traybar Data
CHARM
Figure 23: CL,T and CX as a function of CT,fs for fixed rotor collective and RPM and at wing angle of attack of 70 deg. (free stream speed variation).
Computational results were obtained for a range of angle of attack and thrust conditions that span the experimental data in [36] . Specific conditions for the CGE calculations are summarized in Table 1. For each computational condition, calculations were performed for angle of attacks between 40 and 90 degrees. Only state-state computational results are reported in this paper. CGE does permit unsteady simulations to be performed, and limited time-accurate calculations have been completed as part of preliminary analytical studies.
Figure 24: Traybar test configuration surface geometry used for CGE analysis
In addition to the computational cases given in Table 1, calculations also were performed with rotors-off. These analytical results were used as part of model verification.
Table 1: Summary of CGE Calculation Conditions
Case V, fps T/rotor, lbf CT,fs CT,ss
1 49 18 4.0 0.80
2 49 27 6.0 0.86
3 33 19 9.5 0.90
4 33 22 11.5 0.92
5 33 31 15.5 0.94
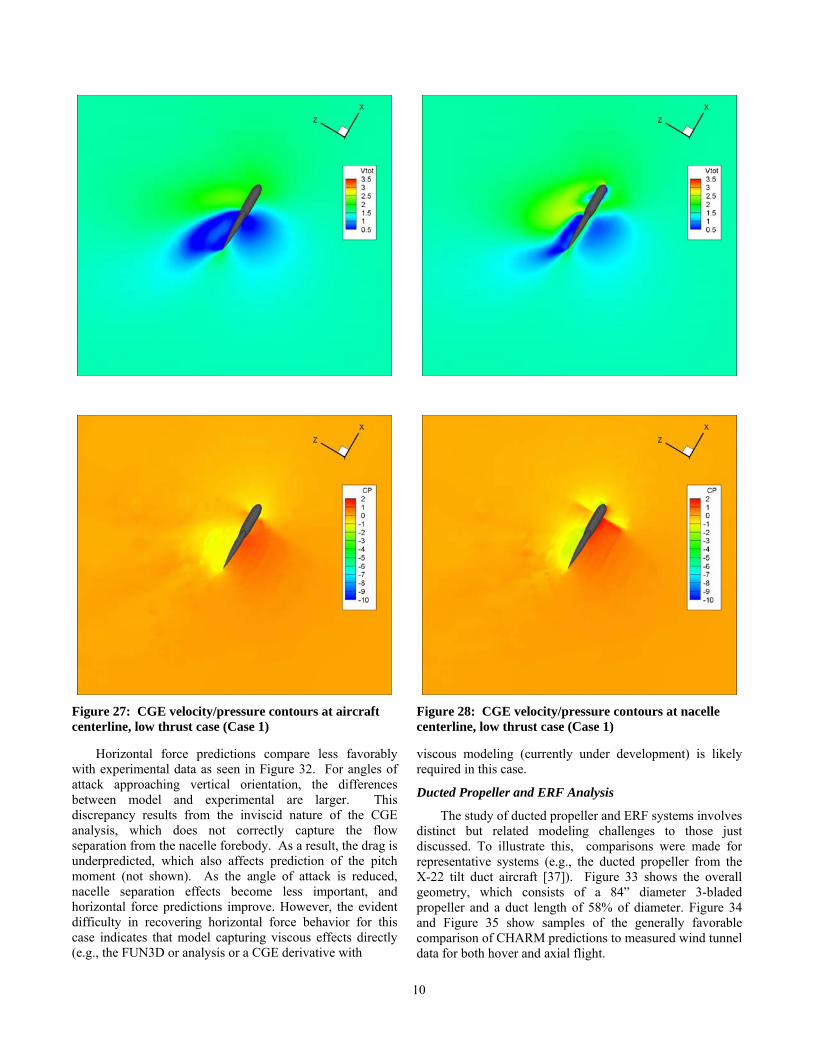
Visualization of the computed velocity and pressure fields are shown in Figure 25 through Figure 30, which plot the normalized velocity vector magnitude and pressure coefficient contours in a slice plane perpendicular to the wing span axis. Contour plot slices are shown at the model centerline and aligned with the nacelle and rotor hub. Both velocity magnitude and pressure coefficient are non-dimensionalized by free stream conditions. These results are shown for an angle of attack of 60 degrees (freestream direction is from right to left).
Figure 25 and Figure 26 illustrate the velocity and pressure fields for the rotor-off case. The flow clearly separates behind the wing and nacelle, although the presence of the nacelle affects the separation bubble near the wing leading edge. Addition of the rotor actuator disks to the computational solution introduces a sharp pressure jump at the rotor plane/actuator disk and rotor-induced flow that mitigates the effect of flow separation over the wing and
9
nacelles. For low thrust cases (Figure 27, Figure 28), the flow appears to remain separated although the pressure difference between upper and lower wind surfaces is larger than for the rotor-off case resulting is some lift augmentation. As the thrust is increased (Figure 29, Figure 30), fully-attached flow can be seen within the rotor slipstream, which provides additional augmentation of the aerodynamic forces over the entire wing inboard span.
Computational results from CGE analysis are compared with measured aerodynamic forces from [36]. Data are plotted as total aircraft lift and horizontal force including thrust components and non-dimensionalized by free stream dynamic pressure and wing area (CL,T, CX). Numerical results and experimental data are compared as a function of angle of attack for different thrust levels. Comparison plots for three increasing thrust cases are shown in Figure 31 and Figure 32. Also plotted is the thrust component to lift and
horizontal force so that the contribution of the wing including power augmentation effects can be identified.
Figure 31 illustrates the thrust effect on lift coefficient as a function of angle of attack. The wing lift component, which can be seen as the difference between predicted and measured data and the rotor contribution reference line, peaks between 50 and 60-deg angles, which corresponds to the largest power-on lift augmentation. The CGE analysis captures the general characteristics seen in the experimental data but tends to underpredict the lift augmentation at lower thrust levels. As the thrust increases, the aerodynamics are more strongly influenced by rotor slipstream, which is captured by the CGE model. Clearly, this flow is highly three dimensional and the mixed mechanisms at work involving the coupled propwash/surface interaction play a strong role.
Figure 25: CGE velocity/pressure contours at aircraft centerline, rotor-off case
Figure 26: CGE velocity/pressure contours at nacelle centerline, rotor-off case
10
Figure 27: CGE velocity/pressure contours at aircraft centerline, low thrust case (Case 1)
Horizontal force predictions compare less favorably with experimental data as seen in Figure 32. For angles of attack approaching vertical orientation, the differences between model and experimental are larger. This discrepancy results from the inviscid nature of the CGE analysis, which does not correctly capture the flow separation from the nacelle forebody. As a result, the drag is underpredicted, which also affects prediction of the pitch moment (not shown). As the angle of attack is reduced, nacelle separation effects become less important, and horizontal force predictions improve. However, the evident difficulty in recovering horizontal force behavior for this case indicates that model capturing viscous effects directly (e.g., the FUN3D or analysis or a CGE derivative with
Figure 28: CGE velocity/pressure contours at nacelle centerline, low thrust case (Case 1)
viscous modeling (currently under development) is likely required in this case.
Ducted Propeller and ERF Analysis
The study of ducted propeller and ERF systems involves distinct but related modeling challenges to those just discussed. To illustrate this, comparisons were made for representative systems (e.g., the ducted propeller from the X-22 tilt duct aircraft [37]). Figure 33 shows the overall geometry, which consists of a 84” diameter 3-bladed propeller and a duct length of 58% of diameter. Figure 34 and Figure 35 show samples of the generally favorable comparison of CHARM predictions to measured wind tunnel data for both hover and axial flight.
11
Figure 29: CGE velocity/pressure contours at aircraft centerline, high thrust case (Case 5)
Figure 30: CGE velocity/pressure contours at nacelle centerline, high thrust case (Case 5)
12
(a) CT,fs = 6.0
(b) CT,fs = 9.5
(c) CT,fs = 11.5
Figure 31: Comparison of CGE lift predictions with experimental data from [36]
(a) CT,fs = 6.0
(b) CT,fs = 9.5
(c) CT,fs = 11.5
Figure 32: Comparison of CGE horizontal force predictions with experimental data from[36]
13
Figure 33: Wind tunnel model of the X-22 ducted propeller (left) and the CHARM computational model (right).
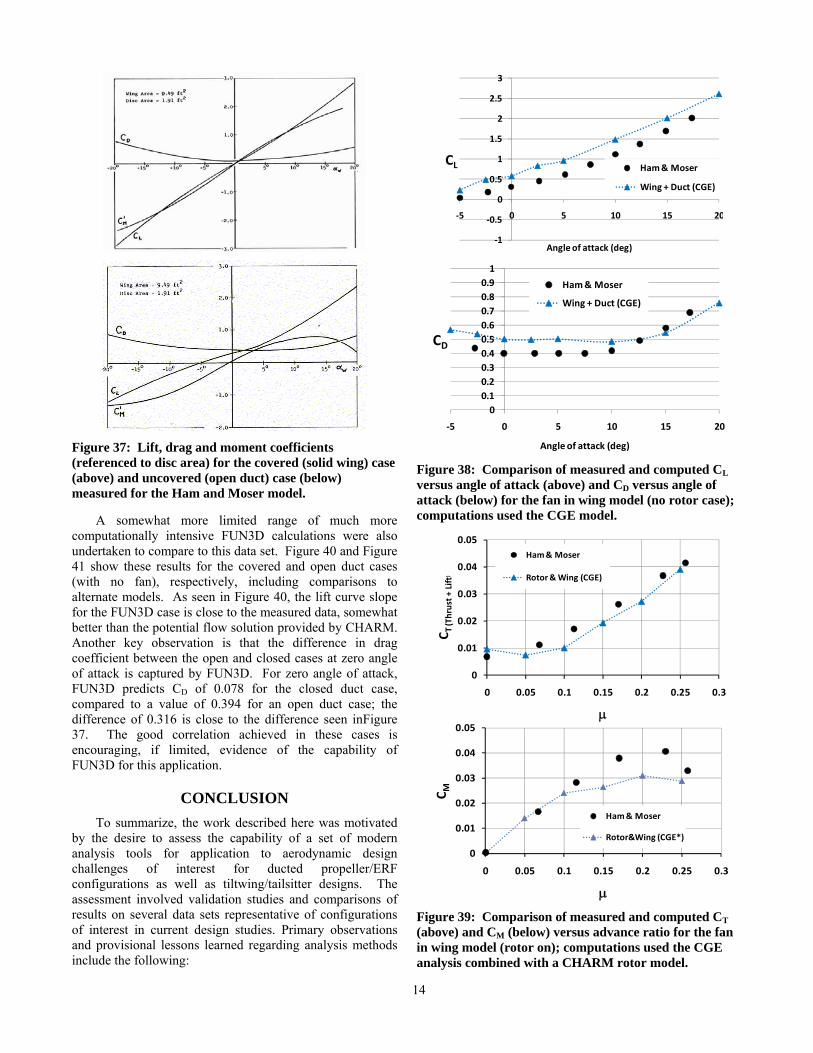
It was of interest to compare the predictions made by these tools to configurations more directly representative of an ERF design. While, as discussed above, a wide variety of data resources describe high-solidity fan-in-wing tests (e.g., [4, 5, 8, 9, 13, 38]) results, measurements of cases using lower-solidity rotors are relatively rare. One such resource is the work of Ham and Moser [39, 40] that describes wind tunnel testing of a simple model (Figure 36) with a low-solidity (2 bladed) rotor operating in a wing segment with a duct; the tests provided measured lift, drag, and moment data both for the duct covered and the duct open (Figure 37). The wing model itself featured a very low aspect ratio (0.7) wing (2.56 ft. in width and 3.8 ft. in chord) with 13% thick symmetric airfoil section. The model data was very useful as a validation resource for this application since it provided by closed- and open-wing results, as well as cases with and without rotor influence.
Comparisons were first made to these data for the no-rotor case using CGE, to assess its ability to model separated flow in this case. When compared over a range of angles of attack (with no rotor present), Figure 38 shows the correlation between calculations and measurements for lift and drag coefficients. (Note that the aerodynamic coefficients shown in these figures are referenced to the disk area rather than the wing area). While there is some offset from the measurements due to wind tunnel blockage effects associated with a large model in a relatively small tunnel, CGE captures the presence of a large zero-lift angle of attack, as well as the upward break in CD at 10 deg. angle of attack.
Subsequently, comparisons were made to model data for open duct cases with the rotor present, using a hybrid CGE/CHARM model. The simple rigid two-bladed rotor was modeled in CHARM, with a fixed collective pitch of 10 deg. Figure 39 shows a comparison of the lift and pitching moment experienced by the wing/rotor combination for an angle of attack of 0 deg. As is evident, the major features of the data are again captured. The combined wing and thrust coefficient is slightly underpredicted, while the comparison with overall pitching moment measurements are reasonable (note that these results include estimated rotor hub moments from CHARM added to the CGE solution aerodynamic flow solution).
0
1000
2000
3000
4000
5000
6000
0 10 20 30 40 50 60
Thrust (lbs)
Blade Angle (deg)
Test
CHARM
0
500
1000
1500
2000
2500
0 1000 2000 3000 4000 5000 6000
HP
Thrust (lbs)
Test
CHARM
Figure 34: Performance in hover for the ducted propeller in Figure 33; comparisons shown to measurements from [37].
Figure 35: Propulsive efficiency in axial flight for the ducted propeller in Figure 33; comparisons shown to measurements from [37].
Figure 36: Fan in wing wind tunnel model of Ham and Moser (left); flow field model generated by the CGE analysis at zero angle of attack, showing the vortical wake of the duct at this condition (right).
14
Figure 37: Lift, drag and moment coefficients (referenced to disc area) for the covered (solid wing) case (above) and uncovered (open duct) case (below) measured for the Ham and Moser model.
A somewhat more limited range of much more computationally intensive FUN3D calculations were also undertaken to compare to this data set. Figure 40 and Figure 41 show these results for the covered and open duct cases (with no fan), respectively, including comparisons to alternate models. As seen in Figure 40, the lift curve slope for the FUN3D case is close to the measured data, somewhat better than the potential flow solution provided by CHARM. Another key observation is that the difference in drag coefficient between the open and closed cases at zero angle of attack is captured by FUN3D. For zero angle of attack, FUN3D predicts CD of 0.078 for the closed duct case, compared to a value of 0.394 for an open duct case; the difference of 0.316 is close to the difference seen inFigure 37. The good correlation achieved in these cases is encouraging, if limited, evidence of the capability of FUN3D for this application.
CONCLUSION
To summarize, the work described here was motivated by the desire to assess the capability of a set of modern analysis tools for application to aerodynamic design challenges of interest for ducted propeller/ERF configurations as well as tiltwing/tailsitter designs. The assessment involved validation studies and comparisons of results on several data sets representative of configurations of interest in current design studies. Primary observations and provisional lessons learned regarding analysis methods include the following:
‐1
‐0.5
0
0.5
1
1.5
2
2.5
3
‐5 0 5 10 15 20
CL
Angle of attack (deg)
Ham & Moser
Wing + Duct (CGE)
0
0.1
0.2
0.3
0.4
0.5
0.6
0.7
0.8
0.9
1
‐5 0 5 10 15 20
CD
Angle of attack (deg)
Ham & Moser
Wing + Duct (CGE)
Figure 38: Comparison of measured and computed CL versus angle of attack (above) and CD versus angle of attack (below) for the fan in wing model (no rotor case); computations used the CGE model.
0
0.01
0.02
0.03
0.04
0.05
0 0.05 0.1 0.15 0.2 0.25 0.3
CT (Thrust + Lift)
Ham & Moser
Rotor & Wing (CGE)
0
0.01
0.02
0.03
0.04
0.05
0 0.05 0.1 0.15 0.2 0.25 0.3
CM
Ham & Moser
Rotor&Wing (CGE*)
Figure 39: Comparison of measured and computed CT (above) and CM (below) versus advance ratio for the fan in wing model (rotor on); computations used the CGE analysis combined with a CHARM rotor model.
15
‐1.5
‐1
‐0.5
0
0.5
1
1.5
‐15 ‐10 ‐5 0 5 10 15
CL
Angle of attack (deg)
Ham & Moser
Wing Only (FUN3D)
Wing Only (CHARM)
Figure 40: Comparison of measured and computed CL versus angle of attack for the fan in wing model; computations used the CHARM and FUN3D analyses.
‐1
‐0.5
0
0.5
1
1.5
2
‐10 ‐5 0 5 10 15
CL
Angle of attack (deg)
Ham & Moser
Wing + Duct (CGE)
Wing + Duct (FUN3D)
0
0.1
0.2
0.3
0.4
0.5
0.6
‐10 ‐5 0 5 10 15
CD
Angle of attack (deg)
Ham & Moser
Wing + Duct (CGE)
Wing + Duct (FUN3D)
Figure 41: Comparison of measured and computed CD versus angle of attack for the fan in wing model; computations used the CGE analysis and FUN3D analyses.
CHARM: comprehensive free wake rotor + potential flow (panel) airframe model, with empirical corrections
Works well for open rotor performance in for hover, transition, and axial flight.
Also performs well for ducted propeller systems in the presence of attached flow over the duct.
Constrained by duct flow separation limits (e.g.., due to high angle of attack and edgewise flight).
Compares will with lift and horizontal force data for propeller/wing interaction problems when the flow is largely attached, but accuracy degrades at high angles of attack.
Depends on empirical data on drag and maximum lift for wings, ducts, and rotors.
Fast turnaround on desktop computer systems
CGE: mid-level CFD model (optional actuator disk rotor)
An effective tool for complex interactions (e.g., rotor/wing interaction, analysis of solid boundary effects).
Good predictions of steady forces, mean flow fields even for some challenging problems involving wings with an embedded duct.
Limited success to date in some high angle of attack cases with complex propeller/wing interaction, where separation is not well defined
An extension of the model to capture viscous effects is highly desirable for maximum generality
Longer run times than CHARM; faster turn-around than FUN3D with similar setup
FUN3D: massively parallel URANS analysis
Best solution for complex configurations with separated flow modeling of those assessed
Captures 3D calculations essential for understanding flow physics in many important cases
Setup and execution costs for reliable prediction are substantial
While not presented here, the model has significant potential for resolving detailed blade aerodynamics, and particularly in complex ducted propeller and ERF cases
In general, these tools have produced encouraging validation results and provided useful insights into flow physics for several models representative of advanced configurations. Additional assessment and validation cases are ongoing, as is follow-on model development and enhancement motivated by the observations described above.
REFERENCES
1. Warwick, G., VTOL Visions. Aviation Week and Space Technology, 2013. 175(9).
2. Keen, E.B. et al, A Conceptual Design Study of a Vertical Lift Family of Systems, in American Helicopter Society Aeromechanics Conference. 2016: San Francisco, CA. Jan 2016.
3. Hickey, D.H. and J.V. Kirk, Survey of Lift-Fan Aerodynamic Technology. 1993, NASA-CR-177615.
16
4. Hickey, D.H. and D.R. Ellis, Wind-Tunnel Tests of a Semispan Wing with a Fan Rotating in the Plane of the Wing. 1959, NASA-TN-D-88.
5. Hickey, D.H. and L.P. Hall, Aerodynamic Characteristics of a Large-Scale Model With Two High Disk-Loading Fans Mounted in the Wing. 1963, NASA-TN-D-1650.
6. Kirk, J.V., D.H. Hickey, and L.P. Hall, Aerodynamic Characteristics of a Full-Scale Fan-in-Wing Model Including Results in Ground Effect with Nose-Fan Pitch Control 1964, NASA-TN-D-2368.
7. Hall, L.P., D.H. Hickey, and J.V. Kirk, Aerodynamic Characteristics of a Large-Scale V/STOL Transport Model with Lift and Lift-Cruise Fans. 1967, NASA-TN-D-4092.
8. Parks, W.C., R.L. Swingle, and W.A. Swope, XV-5A Aerodynamic Propulsion Data Correlation and Characteristics Development Based on Wind Tunnel Characteristics. 1968, USAAVLABS TR 67-75.
9. Gerdes, R.M., Lift-fan Aircraft - Lessons Learned from XV-5 Flight Experience, in AIAA International Powered Lift Conference. 1993, AIAA-1993-4838 Santa Clara, CA.
10. Lindenbaum, B., V/STOL Concepts and Developed Aircraft – Volumes I and II. 1986, AFWAL TR-86-3071: Universal Energy Systems and Air Force Systems Command.
11. Fluk, C., et al., The X-19 V/STOL Technology – A Critical Review. 1967, AFFDL-TR-66-195: Curtiss-Wright Corporation and Air Force Flight Dynamics Laboratory Research & Technology Division.
12. Nietz, T.C. and S. Baber. An Innovative UAV Design. in AIAA 3rd "Unmanned Unlimited" Technical Conference, Workshop and Exhibit. 2004. Chicago, IL: AIAA-2004-6380.
13. Thouault, N., C. Breitsamter, and N.A. Adams, Numerical and Experimental Analysis of a Generic Fan-in-Wing Configuration. Journal of Aircraft, 2009. Vol. 46(No. 2): p. pp. 656-666.
15. Maisel, M.D., D.J. Giulianetti, and D.C. Dugan, The history of the XV-15 tilt rotor research aircraft from concept to flight. NASA/SP-2000-4517, 2000.
16. Anderson, S.B., Historical overview of V/STOL aircraft technology. NASA TM 81280, 1981.
17. Goodson, K.W., Comparison of wind-tunnel and flight results on a four-propeller tilt-wing configuration. NASA TN-D 3217, 1966.
18. Moore, M. NASA Puffin Electric Tailsitter VTOL Concept. in 10th AIAA Aviation Technology, Integration, and Operations (ATIO) Conference. 2010. AIAA Reston, VA.
19. Wachspress, D.A., T.R. Quackenbush, and A.H. Boschitsch. First-Principles, Free-Vortex Wake Model for Helicopters and Tiltrotors. in 59th Annual Forum of the American Helicopter Society. 2003. Phoenix, AZ.
20. Wachspress, D.A., T.R. Quackenbush, and A.H. Boschitsch, Rotorcraft Interactional Aerodynamics with Fast Vortex/Fast Panel Methods. Journal of the American Helicopter Society, 2003. Vol. 48(No. 4).
21. Quackenbush, T.R., et al. Aeromechanical Analysis Tools for Design and Simulation of VTOL UAV Systems. in 60th Annual Forum of the American Helicopter Society 2004. Baltimore, MD.
22. Boschitsch, A.H., W.J. Usab, and R.J. Epstein, Fast Lifting Panel Method, in AIAA 14th Computational Fluid Dynamics Conference. 1999, AIAA-99-3376: Norfolk, Virginia.
23. Usab, W.J. and A.H. Boschitsch, Next Generation Preliminary Design Technology. 1999, Continuum Dynamics Inc., CDI Report No. 99-06 (final report to NASA, contract NAS1-99025).
24. Keller, J.D., et al. Computational Fluid Dynamics for Flight Simulator Ship Airwake Modeling. in Interservice/Industry Training, Simulation, and Education Conference (I/ITSEC) 2007. 2007. Orlando, FL.
25. Whitehouse, G.R., et al. Investigation of Mixed Element Hybrid Grid-Based CFD Methods for Rotorcraft Flow Analysis. in 66th Annual Forum of the American Helicopter Society. 2010. Phoenix, AZ.
26. Aftosmis, M.J., M.J. Berger, and J.E. Melton, Robust and Efficient Cartesian Mesh Generation for Component-Based Geometry, in 35th Aerospace Sciences Meeting and Exhbit. 1997, AIAA-1997-0196: Reno, NV.
27. Aftosmis, M.J., M.J. Berger, and J.J. Alonso, Applications of a Cartesian Mesh Boundary-Layer Approach for Complex Configurations, in 44th AIAA Aerospace Sciences Meeting. 2006, AIAA-2006-0652: Reno, NJ.
28. Whitehouse, G.R., T.R. Quackenbush, and A.H. Boschitsch. Variable Fidelity Preliminary Design Tools for Advanced Vertical Flight Vehicles. in 66th Annual Forum of the American Helicopter Society. 2010. Phoenix, AZ.
29. Anon., FUN3D-Analysis and Design. 2013, NASA http://fun3d.larc.nasa.gov
30. Quon, E.W., et al., Unsteady Reynolds-Averaged Navier–Stokes-Based Hybrid Methodologies for Rotor–Fuselage Interaction. Journal of Aircraft, 2012. Vol. 49(No. 3).
31. Felker, F.F., et al., Performance and Loads Data from a Hover Test of a 0.658-Scale V-22 Rotor and Wing. NASA-TM-89419, 1987.
32. Acree, C., JVX Proprotor Performance Calculations and Comparisons with Hover and Airplane-mode Test Data. NASA Technical Memorandum TM–2009-215380, April, 2009.
33. Johnson, W., An Assessment of the Capability to Calculate Tilting Prop-rotor Aircraft Performance, Loads and Stability. NASA TP-2291, 1984.
34. Wachspress, D.A., G.R. Whitehouse, and T.R. Quackenbush, Predicting the Influence of Blade Tip
17
Shape on Hovering Rotor Performance with Comprehensive Analyses. 2015.
35. Grunwald, K.J., Experimental Study of Wind-tunnel Wall Effects and Wall Corrections for a General-Research V/STOL Tilt Wing Model with Flap. NASA TN-D2887, 1965.
36. Traybar, J.J., Analysis and Comparison of Aerodynamic Data Obtained in a Large Wind Tunnel and a Moving-Model Track Facility for a General Research Tilt-Wing VTOL Configuration. USAAVLABS TR 69-74, 1969.
37. Mort, K.W. and B. Gamse, A Wind Tunnel Investigation of a 7-Foot Diameter Ducted Propeller. 1967, NASA Technical TN-D 4142.
38. Gregory, N., W.G. Raymer, and E.M. Love, The Effect of Forward Speed on the Inlet Flow Distribution and Performance of a Lifting Fan Installed in a Wing. 1965, Ministry of Aviation, Aeronautical Research Council Reports and Memoranda 3388.
39. Ham, N.D. and H.H. Moser, Preliminary Investigation of a Ducted Fan in Lifting Flight, in 26th Annual Meeting of the Institute of the Aeronautical Sciences. 1958.
40. Ham, N.D. and H.H. Moser, Preliminary Investigation of a Ducted Fan in Lifting Flight. Journal of the American Helicopter Society, 1958. Vol. 3(No. 3).