Analysis of aggregate output supply response of selected food grains in Nigeria
Akanni, K. A* and Okeowo, T. A.
Department of Agricultural Economics, College of Agricultural Sciences, Olabisi Onabanjo University, P. M. B. 2002, Ago-Iwoye, Ogun State, Nigeria.
Accepted 27 October, 2011
Food grains, which are major sources of energy and vital nutrients, are in short supply in many Nigerian households. Government, at various times, has embarked on importation of these food items to augment local supply. The main objective of this study was to examine the various determinants of the quantities of cereals (rice, maize, millet and sorghum) that are supplied into the Nigerian economy. Statistical information on domestic and imported quantities of these grains was obtained for some 37 years (1970 to 2007). Some economic models, including equilibrium output supply function and co-integration models were used. An all -time maximum output of 8,090,000 tonnes was recorded for rice followed by millet with 7,100,000 tonnes with mean values of 4,228,900.47; 4477, 026.31; 3,596,894.73 and 2,034,719.00 for maize, rice, millet and sorghum respectively. Rainfall was consistent for all the four crops with an all- time maximum of 136.41 mm rainfall and mean value of 37.93 mm. Trace test reveals that the hypothesis of no co-integration (Ho: r = 0) is rejected at p < 0.05; given that the calculated Trace test statistic (98.45) is higher than the critical value (95.75) at p < 0.05. However, the test that r ≤ 1 could not be rejected. Thus, Trace test reveals that the series in maize output supply response model are co-integrated, with only 1 co-integrating equation existing between them. Producer price of rice was positive and statistically significant at 1% level. The output response of rice to hectarage was not statistically significant but was positive. Rice importation showed a negative sign and was statistically insignificant in Nigeria. There is the tendency for the price of agricultural products to drop, which may consequently reduce the level of domestic production and thus discourage commercial production. Maize output, hectarage, producer price and import quantities were non-stationary series. Thus, they cannot be included in their levels in least square regression models. The insignificant impact of prices on millet output could have arisen from the fact that lagged prices are better considered by the farmers. Key words: Market supply, economic models, food grains, importation, production output.
INTRODUCTION Preambles The food supply response in Nigeria has been limited by structural and institutional constraints that have persisted despite market reforms.Non-price factors can have a more profound impact than prices on aggregate *Corresponding author. E-mail: [email protected]. Tel: +234-805-604-6858.
agricultural output. These factors include the condition of infrastructure (such as roads, irrigation schemes, and communication networks); the availability of marketing services, modern inputs, and credit (especially in rural areas); and government support in the form of research and extension services, human capital development, and commitment to reform. Physical factors such as weather conditions and soil quality also affect output.
One of the major disturbing phenomena in Nigeria today is the shortage of food grains with the attendant result of soaring prices and rising importation of these
commodities. This shortage can be attributed to a number of factors among which are the increase in population which is not matched by the rate of growth in the food production and poor storage system (Adeniyi, 1984). Food shortage and subsequent rise in price of food items is experienced in Nigeria due to a number of other problems facing crop farmers in general. These problems range from high cost of production as a result of increase in price of input, low return from the enterprise in terms of income, low efficiency of resource utilization, lack of capital, non-availability of land and scarcity of improved planting materials which is capable of giving higher yields. Added to this myriad of problems is the price fluctuation of these grains caused by seasonality of production, poor storage infrastructures, unsteady market structures and unstable government trade policies. According to the report, imports of cereals by Nigeria are forecast to remain above 4.5 million tonnes in 2008 representing 15% of the country‟s total domestic cereal utilization indicating that domestic cereal prices are driven mainly by regional supply and demand. These are determined: 1. On the supply side, by lower production status due to irregular and insufficient rainfall, high price of fertilizer, low price of grains in the past two years with little incentive to produce. Moreover, the restrictive trade policy of the Nigerian government limits food imports from the international markets increasing the pressure on the domestic market. 2. On the demand side, to a large extent by food processing industries and the poultry sector which has recovered significantly. The excess liquidity generated by high oil prices is also contributing to higher demand in Nigeria.
This study therefore examined the output supply patterns and aggregate supply response of cereals (rice, maize, millet and sorghum) in Nigeria. This entailed the assessment of the various determinants of the quantities of cereals that were supplied into the Nigerian food grains market between 1970 and 2007. Theoretical/conceptual framework The theoretical framework is based on the concept of supply response in agricultural production. Supply response generally refers to the variation of agricultural output and acreage mainly as a result of variations in price (Olayide and Heady, 1982).This implies that the concept refers to shifts in supply curves and the movements along the curves. This is because the price- quantity relationship can be isolated only in theory,
Akanni and Okeowo 267 ceteris paribus. Basically, supply response concerns output response to a change in price of the product. This may be due to the use of more or less resources that may be as a result of price increase or decrease. Again, the response may be occasioned by a change in farm size.Furthermore, technological changes under the influence of production variables like credit, price, weather, market information and so on, may bring out supply response.Hence, supply response has to do with factors that move the supply curve. Here, the Error Correction Model (ECM) with co-integration analysis is discussed because it captures the forward-looking behavior of producers optimizing their production in dynamic situations.ECM is used to analyze non-stationary time series that are known to be co-integrated. It assumes co-movement of the variables in the long-run. The general ECM is of the form: ∆Yt = C + 3αk∆Yt-n +(Yt-1-3βjXjt-n) +γT +Фt … (1) Where ∆ is the deference operator such that ∆Yt =Yt- Yt-1. αj and βj are respectively vectors of short – run and long-run supply elasticities with respect to factor j.Yts are the assumed co-integrated time series variables (including previous supply levels Yt-n and explanatory variables Xt-n). Research problem In Nigeria, there is a general shortage in the domestic supply of foodgrains.This has often resulted in increased market prices of the commodities, thus necessitating occasional importation to beef up local supply. Persistent increase in human population which is not matched by the rate of growth in the food production has been adduced to the food grains shortage (Adeniyi, 1984).High cost of production as a result of increase in price of input, low farm income, low efficiency of resource utilization and inadequate capital are some of other reasons responsible for shortages in food grains supply. The resultant effect of these problems is the increased need for the importation of food grains to augment local supply.
High urban population growth, changing consumption patterns, increased feed uses in the rapidly growing poultry sector and continued expansion of the country‟s milling capacity have again emphasized the need for a higher import level for foodgrains.Despite the numerous policy options and attempts by government in the production sector, there has been a steady decline in the output of the cereals between 1970 and 2007 .Similarly, the land area under the cultivation of cereals also declined so tremendously due largely to reduction in the size and technology of the farming population and poor soil fertility levels. The producer price for the cereals had
268 J. Stored Prod. Postharvest Res. risen so sharply particularly within the past twenty years. This has negatively affected the quality and quantity of food intake of most Nigerians, particularly in the rural and low income groups. Again, persistent increases in human population and reduced local production status necessitated bloated import profile for cereals over the past three decades. A general increase in world population had continually put some pressure on the world price level for cereals thereby forcing it to rise particularly within the past thirty years.
In view of this research problem, it is pertinent to ask the following fundamental questions: 1) What is the pattern of supply of major foodgrains in Nigeria? and 2) What are the determinants of the foodgrains supply level?
This study, therefore, provided answers to these and other relevant questions. LITERATURE REVIEW In a study conducted by Rahji et al. (2008) on the rice supply response in Nigeria using the Nerlovian Adjustment Model it was noted that rice is an important food crop but the inadequate level of the crop‟s production is evidenced by problems, usually in terms of the ever widening supply and demand for the crop in the country. This in turn has resulted in the use of scarce foreign reserve on importation of the commodity that could be efficiently produced locally. The estimated trend equations showed that time had significant influence on output, area and yield of rice over the period. The short and long run prices are inelastic as they are less than one. The estimated coefficient of adjustment ranged between 0.23 and 0.33, hence the speed of adjustment by the variable is said to be sluggish. Under this situation, achieving significant increase in output will be difficult. Measures that will lead to the productivity increase in rice production are therefore necessary. The study recommended that rice farmers should be encouraged to adopt and use improved technologies like the New Rice for Africa (NERICA) variety. The extension service delivery system must also be improved in order to achieve the desire result. Similarly, Mythili (2006) carried out a supply response of Indian farmers comparing the pre and post reform periods in India. The study revealed that supply response to price changes was capable of increasing liberalization in the agricultural sector. Past studies revealed weak supply response for Indian agriculture. There are no recent reliable estimates to see if the response has improved after the economic reform introduced in the early 90s in India. This study estimated supply response for major crops during pre and post reform period using Nerlovian adjustment cum adaptive
expectation model. Estimation is based on dynamic panel data approach with pooled cross section-time series data across state for India. The standard procedure is to use area indicator of supply due to the reason that area decision is totally under the control of farmers. Moreover, using supply indicator conceals some variation in and yield if they move the opposite direction. In this paper, it was hypothesized that acreage response underestimates supply response and farmer response to price incentives partly through intensive application of other inputs given the same area which is reflected in yield.
Acreage and yield response function were estimated and the supply response estimated were derived from these two responses. The significant features of the specification used in the study in both main and suitable crops are jointly estimated by single equation by introducing varying slop non food grains. The study finds no significant differences in supply elasticity between pre and post reform period for the majority of crops. It raises questions such as whether the constraints are properly identified by the policies or if the impact of the reform is yet to be found in order to make a prominent impact on response parameter. In this study infrastructural variables other than irrigation could not be introduced due to lack of information for a time series. Results confirmed that farmer‟s respond to price incentive equally by more intensive application of non-land inputs. Further analysis of the reasons for little impact reforms on the response was awaited.
Rahji and Adewunmi (2008) conducted a study on the market supply response and demand for local rice in Nigeria with implications for self-sufficiency policy. The main objective of the study was to apply a supply response model to rice production in Nigeria. This study examined the supply response and demand for local rice in Nigeria between 1960 and 2004. A system of equations using secondary data was estimated by OLS and 2 Stage Least Square techniques. Area planted with local rice is mainly affected by expected price of output, agriculture wage rate and by the partial adjustment coefficient.
The short run response elasticity is 0.077. The implied long run response elasticity is 1.578. The partial adjustment measure is 0.49 thereby indicating some difficulties in the supply response to changing economic conditions. The price elasticity of demand obtained is 0.841. The demand for local rice is thus price inelastic. Rice income inelasticity is 0.3378, that is, it is also inelastic. The ban on rice importation could be said to be a step in the right direction. This policy should be continued and policed. However, price, output and non-price incentives that can exert significant influence on rice supply response and demand are required if the self sufficiency goal is to be achieved.
METHODOLOGY
Data for the study
This study was based on time series secondary data obtained from various sources spanning 1970 to 2007. They are obtained from various editions of the National Bureau of Statistics‟ review of external trade. National Bureau of Statistics‟ Trade Summary and Annual Abstract of Statistics, Central Bank of Nigeria‟s Economic and Financial Review and Statistical Bulletin covering various years. Import quantities were extracted for the entire period (1970 to 2007) from FAO (2008) – an online database maintained by Food and Agriculture Organization (FAO).
Data analytical procedure/ modeling techniques
The economic model
The aggregate output supply function, following Ghatak and Ingersent (1984), was specified as follows:
Qt = f (HAt, WPt, Pt, Mt, RFt, et ) (2) Where: Qt = Output of grains in year t (Tonnes); HAt = Hectarage in year t; WPt = World price (Dollars); Pt = Producer price per tonne (Naira); Mt = Quantity imported in year t (Tonnes); RFt = Weather variable (that is, rainfall); et = Error term.
The model was estimated for all the cereals (rice, maize, millet and sorghum). Based on theory, output supply quantity (Q
i) is
determined principally by the yield and area cultivated being a function of price of the commodity relative to other non-price variables. Thus, following the usual approaches in literatures, the long-run equilibrium output supply function adopted in this study is specified in double logarithmic form as follows:
Where: lnQit = the natural logarithm of aggregate output supply in
year t measured by the output quantity in tonnes; lnHAit = the
natural logarithm of area cultivated to ith cereal in year t measured
by the hectarage; lnPit = the natural logarithm of Nigeria‟s producer
prices of the ith
cereal in Naira; lnWPit = the natural logarithm of the
average world price of Nigeria‟s cereals; lnMit = the natural
logarithm of the quantity of the cereals imported into Nigeria from records of FAO; lnRF
it = the natural logarithm of rainfall for the
period of 1970 to 2007; βjs = are the coefficient of the ith variable in
the model, while ut is the stochastic residual term. The models were
estimated for rice, maize, millet and sorghum. The coefficients 1,
2, 3, 4 and 5 can be interpreted, in a similar version to Arize et al. (2000), as the elasticity of output supply for the commodity under reference with respect to the determinant factors. The apriori
expectation is that 1, 2, 3 and 5 > 0, since an increase in producer price, hectarage, world price and rainfall are expected to stimulate domestic production. Higher world prices and increase in economic activities in the rest of the world are also expected to encourage increased Nigeria‟s output which will also ginger
exports. However, it is expected that 4 < 0, since importation discourages domestic production in view of lower production costs.
The statistical model and estimation procedure While the estimation of the theoretical model specified in equation
Akanni and Okeowo 269 (3) would appear straight forward, recent development in time series modelling points to the need for caution by first examining the statistical properties of the series and incorporating these in the final model specification where necessary, as to guarantee non-spurious regression. The tests for statistical properties of the series were done in three stages. The first stage of the analysis was the test for stationary of the individual economic series, which is a precondition for application of least square techniques, and the failure of which Granger and Newbold (1974) observe results in spurious regression. This test was conducted on each series using
procedures for the two variants of augmented Dickey-Fuller (ADF) tests, with one lagged term, in EViews.
Having ascertained that all the series in the economic model are non-stationary in their level, but stationary in their first difference, it became obvious that least square technique would not be appropriate for the estimation of the economic model. Thus, bearing in mind the need to accommodate the interdependence of relationships between most economic variables, the economic
model was re-conceptualized as a vector autoregressive system (3), allowing for the possibility of co-integration among the endogenous variables.
4
1
11
i
tttitt eyyBxy (4)
Where: x = is vector of deterministic variables, constant (C) and/or trend; y = is vector of I (1) endogenous variables – lnQ
i, lnP
i, lnHA
i,
ln WPi,lnM
i and lnRF
i; β, and are matrices of coefficients to
be estimated, while e is vector of stochastic residuals. Term in β gives the influence of the associated deterministic
variables, while represents short-term elasticities of response. And, where evidence of r < 5 co-integrating relations exists, by
Granger causality theorem, ; in which is the co-
integrating vector (containing the long-run elasticities), while
elements of are the adjustment parameters in the vector error
correction model. The next stage in the modelling technique was to test for co-
integration among the endogenous variables in the VAR system. This was implemented in EViews (1998) using procedures for Johansen (1992, 1995b) system based techniques. The test utilizes a trace statistic based likelihood-ratio (LR) test for the number of co-integrating vectors in the system.
Trend analysis
Trend analysis was undertaken by making output quantity a function of time for the four crops being handled.The modeling is as follows:
Xsr = βo + βiTi +µi (5)
Xsz = βo + βiTi +µi (6)
Xsm = βo + βiTi +µi (7)
Xss = βo + βiTi +µi (8)
Where, Xsr = Actual output of rice (tons); Xsz = Actual output of maize (tons); Xsm = Actual output of millet (tons); Xss = Actual output
270 J. Stored Prod. Postharvest Res.
Ou
tpu
t (0
.000
to
ns)
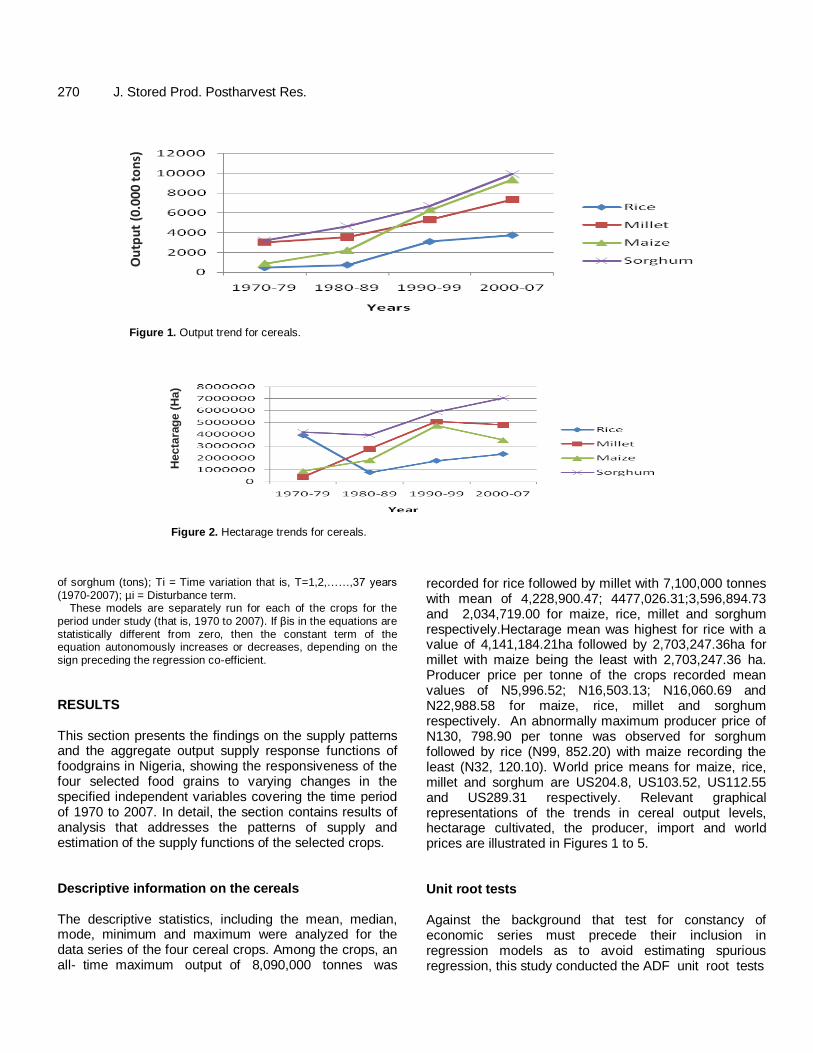
Figure 1. Output trend for cereals.
Hecta
rag
e (
Ha)
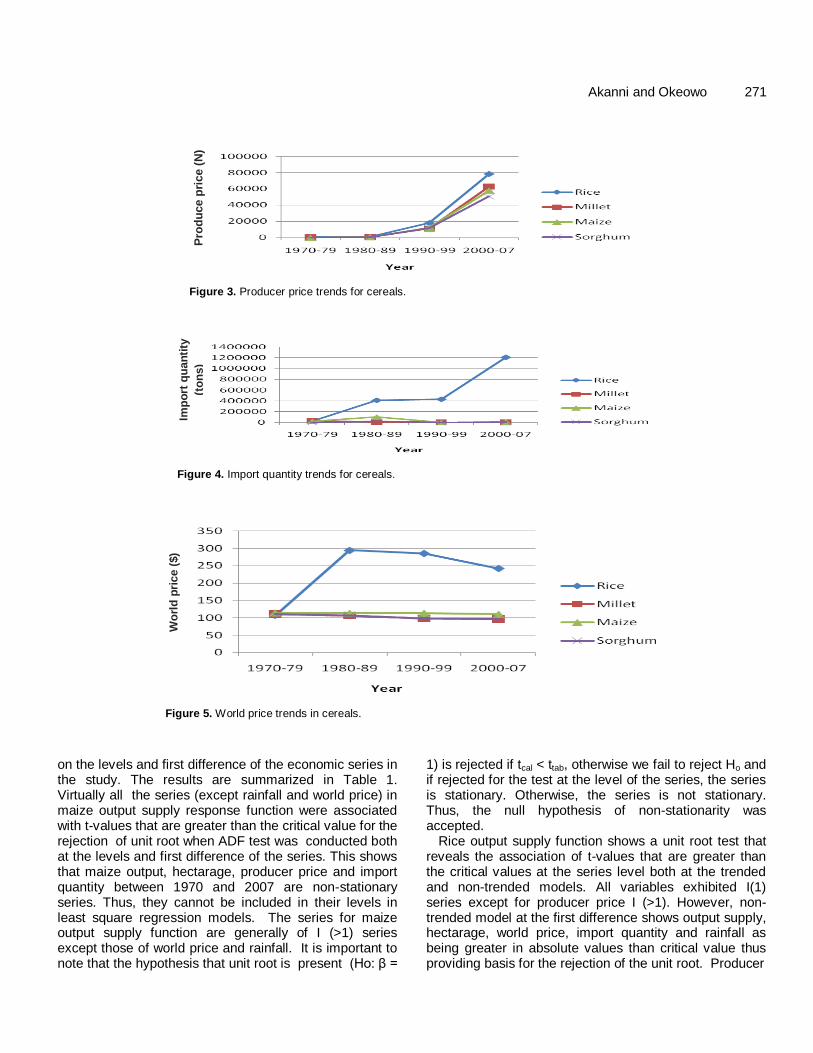
Figure 2. Hectarage trends for cereals.
of sorghum (tons); Ti = Time variation that is, T=1,2,……,37 years (1970-2007); µi = Disturbance term.
These models are separately run for each of the crops for the
period under study (that is, 1970 to 2007). If βis in the equations are statistically different from zero, then the constant term of the equation autonomously increases or decreases, depending on the sign preceding the regression co-efficient.
RESULTS This section presents the findings on the supply patterns and the aggregate output supply response functions of foodgrains in Nigeria, showing the responsiveness of the four selected food grains to varying changes in the specified independent variables covering the time period of 1970 to 2007. In detail, the section contains results of analysis that addresses the patterns of supply and estimation of the supply functions of the selected crops. Descriptive information on the cereals The descriptive statistics, including the mean, median, mode, minimum and maximum were analyzed for the data series of the four cereal crops. Among the crops, an all- time maximum output of 8,090,000 tonnes was
recorded for rice followed by millet with 7,100,000 tonnes with mean of 4,228,900.47; 4477,026.31;3,596,894.73 and 2,034,719.00 for maize, rice, millet and sorghum respectively.Hectarage mean was highest for rice with a value of 4,141,184.21ha followed by 2,703,247.36ha for millet with maize being the least with 2,703,247.36 ha. Producer price per tonne of the crops recorded mean values of N5,996.52; N16,503.13; N16,060.69 and N22,988.58 for maize, rice, millet and sorghum respectively. An abnormally maximum producer price of N130, 798.90 per tonne was observed for sorghum followed by rice (N99, 852.20) with maize recording the least (N32, 120.10). World price means for maize, rice, millet and sorghum are US204.8, US103.52, US112.55 and US289.31 respectively. Relevant graphical representations of the trends in cereal output levels, hectarage cultivated, the producer, import and world prices are illustrated in Figures 1 to 5. Unit root tests Against the background that test for constancy of economic series must precede their inclusion in regression models as to avoid estimating spurious regression, this study conducted the ADF unit root tests
Akanni and Okeowo 271
Pro
du
ce p
rice (
N)
Figure 3. Producer price trends for cereals.
Imp
ort
qu
an
tity
(to
ns)
Figure 4. Import quantity trends for cereals.
Wo
rld
pri
ce
($)
Figure 5. World price trends in cereals.
on the levels and first difference of the economic series in the study. The results are summarized in Table 1. Virtually all the series (except rainfall and world price) in maize output supply response function were associated with t-values that are greater than the critical value for the rejection of unit root when ADF test was conducted both at the levels and first difference of the series. This shows that maize output, hectarage, producer price and import quantity between 1970 and 2007 are non-stationary series. Thus, they cannot be included in their levels in least square regression models. The series for maize output supply function are generally of I (>1) series except those of world price and rainfall. It is important to note that the hypothesis that unit root is present (Ho: β =
1) is rejected if tcal < ttab, otherwise we fail to reject Ho and if rejected for the test at the level of the series, the series is stationary. Otherwise, the series is not stationary. Thus, the null hypothesis of non-stationarity was accepted.
Rice output supply function shows a unit root test that reveals the association of t-values that are greater than the critical values at the series level both at the trended and non-trended models. All variables exhibited I(1) series except for producer price I (>1). However, non-trended model at the first difference shows output supply, hectarage, world price, import quantity and rainfall as being greater in absolute values than critical value thus providing basis for the rejection of the unit root. Producer
272 J. Stored Prod. Postharvest Res.
Table 1. Results of ADF unit root tests.
Parameter Test statistic at levels Test statistic first difference Comment
Non trended model Trended model Non trended model Trended model
To reject Ho, ADF t-value must be negative, and greater in absolute value than the critical ADF statistic (i.e. tcal < ttab).
price of rice however exhibited non-stationary throughout. Rice output, hectarage and rainfall had t-values at the trended first difference ADF test that were greater than critical values. Thus, we reject the null hypothesis.
For millet ADF test revealed that variables examined at their levels using both the trended and non-trended models of the ADF regression test recorded t-values that were greater than the critical value for the rejection of unit root when ADF test was conducted. At the first difference of the series, millet output supply, import quantity, rainfall and world price had t-values that were greater in absolute value. This shows that hectarage, producer price, and import quantity between 1970 and 2007 are non-
stationary series. Thus, they cannot be included in their levels in least square regression models. However, at the levels of the series none of the variables is qualified for inclusion in the least square regression models. The series are generally I (1) series except for hectarage and producer price I (>1).
Result of unit root test for sorghum showed the determinants as being non-stationary at levels with and without trend term except the import quantity and rainfall. In general term, virtually all series (except import quantity and rainfall) in the sorghum output supply response function were associated with t-values that are greater than the critical value for the rejection of the unit root
Akanni and Okeowo 273
Table 2. Johansen co-integration tests for maize.
Hypothesized Eigen value
Trace 0.05 Prob.
No. of CE(s) Statistic Critical value
Trace test
None * 0.669381 98.45473 95.75366 0.0322
At most 1 0.418670 58.61036 69.81889 0.2805
At most 2 0.389862 39.08267 47.85613 0.2570
At most 3 0.302472 21.29615 29.79707 0.3394
At most 4 0.203734 8.328492 15.49471 0.4310
Maximum Eigen value
None 0.669381 39.84437 40.07757 0.0531
At most 1 0.418670 19.52769 33.87687 0.7885
At most 2 0.389862 17.78651 27.58434 0.5130
At most 3 0.302472 12.96766 21.13162 0.4552
At most 4 0.203734 8.201589 14.26460 0.3586
At most 5 0.003519 0.126903 3.841466 0.7217
Source: Data analysis, 2009.
when ADF test was conducted at the level of series. This shows that except for rainfall and import quantity; sorghum output, hectarage, world price and producer price between 1970 and 2007 are non-stationary series. Thus, they cannot be included in their levels in least square regression models. The series for sorghum output supply function are generally of I (1) series except those of import quantity and rainfall. The significant and important evidence from the unit root tests relates to the general presence of non-stationary series in the model for the four crops under study.
Tests for co-integration
For any meaningful long-run relationship to exist between non-stationary series, it is important that some linear combinations of the series must be co-integrated; such that even though the individual I(1) series may drift apart in the short run, they follow a common trend which permits stable long-run relations between them. Thus, this study conducted the Johansen (1992, 1995b) co-integration tests for the linear combination of the series in the output supply response model for the four crops. The results are summarized in Tables 2 to 5.
Co-integration test for maize
Table 2 presents results of Johansen (1992, 1995b) test of co-integration between maize output and its determinants using both the Trace test and the Maximum Eigen value test. Although maximum Eigen value statistic
provides no evidence of co-integration, results of the Trace test reveals that the hypothesis of no co-integration (Ho: r = 0) is rejected at p < 0.05; given that the calculated Trace test statistic (98.45) is higher than the critical value (95.75) at p < 0.05. However, the test that r ≤ 1 could not be rejected. Thus, Trace test reveals that the series in maize output supply response model are co-integrated, with only 1 co-integrating equation existing between them. Co-integration test for rice
Table 3 present results of Johansen (1992, 1995b) test of co-integration between rice output and its determinants using both the Trace test and the Maximum Eigen value test. Both tests provide evidence of co-integration. The results of the Trace test reveals that the hypothesis of no co-integration (Ho: r = 0) is rejected at p < 0.05; given that the calculated trace test statistic (143.51) is higher than the critical value (95.75) at p < 0.05. Similar results are obtained for r ≤ 1to r ≤ 5. Thus, trace test and maximum Eigen value test reveals that the series in rice output supply response model are co-integrated, with more than 1 co-integrating equation existing between them.
Co-integration test for millet
Table 4 presents the results of Johansen (1992, 1995b) test of co-integration between millet output and its determinants using the Trace test and the maximum
274 J. Stored Prod. Postharvest Res.
Table 3. Johansen co-integration tests for rice.
Hypothesized Eigen value
Trace 0.05 Prob.**
No. of CE(s) Statistic Critical value
None * 0.788193 143.5054 95.75366 0.0000
At most 1 * 0.605582 87.63056 69.81889 0.0010
At most 2 * 0.450661 54.13816 47.85613 0.0115
At most 3 * 0.364634 32.57276 29.79707 0.0234
At most 4 * 0.268033 16.24484 15.49471 0.0385
At most 5 * 0.129968 5.012115 3.841466 0.0252
None * 0.788193 55.87484 40.07757 0.0004
At most 1 0.605582 33.49239 33.87687 0.0555
At most 2 0.450661 21.56540 27.58434 0.2435
At most 3 0.364634 16.32792 21.13162 0.2063
At most 4 0.268033 11.23273 14.26460 0.1429
At most 5 * 0.129968 5.012115 3.841466 0.0252
Source: Data analysis, 2009.
Table 4. Johansen Co-integration test for millet
Hypothesized Eigen value
Trace 0.05 Prob.**
No. of CE(s) Statistic Critical value
None * 0.689687 118.4149 103.8473 0.0039
At most 1 0.552239 76.28867 76.97277 0.0563
At most 2 0.434053 47.36282 54.07904 0.1732
At most 3 0.365303 26.86967 35.19275 0.2955
At most 4 0.166517 10.50377 20.26184 0.5904
At most 5 0.103834 3.946659 9.164546 0.4201
None * 0.689687 42.12622 40.95680 0.0368
At most 1 0.552239 28.92585 34.80587 0.2128
At most 2 0.434053 20.49316 28.58808 0.3754
At most 3 0.365303 16.36590 22.29962 0.2731
At most 4 0.166517 6.557108 15.89210 0.7231
At most 5 0.103834 3.946659 9.164546 0.4201
Source: Data analysis, 2009.
Eigen value test. Both test statistics provide evidence of co-integration as results of the Trace test and maximum Eigen value test reveal that the hypothesis of no co-integration (Ho: r = 0) is rejected at p < 0.05; given that the calculated Trace test statistic (98.45) and maximum Eigen value test statistic (42.13) is higher than the critical value (95.75) and (40.95) respectively at p < 0.05. However, the test that r ≤ 1 could not be rejected. Thus, both tests reveal that the series in millet output supply response model are co-integrated, with only 1 co-integrating equation existing between them.
Co-integration test for sorghum Table 5 presents the results of Johansen (1992, 1995b) test of co-integration between sorghum output and its determinants using both the Trace test and the maximum Eigen value test. Although maximum Eigen value statistic provides no evidence of co-integration, results of the Trace test reveals that the hypothesis of no co-integration (Ho: r = 0) is rejected at p < 0.05; given that the calculated trace test statistic (98.45) is higher than the critical value (95.75) at p < 0.05. However, the test that r ≤ 1 could not be rejected implying that the series in sorghum output supply response model are co-integrated, with only 1 co-integrating equation existing between them. Estimation of the short -run elasticities The short- run elasticity of the relationship between the various crops‟ output supply response to their determinants and the speed of adjustment to any stock to the long run equilibrium was captured within the short run error correcting model (ecm) equation. Results indicated that the ecm terms are associated with the desired negative co-efficients which however are significant only for millet and sorghum (p < 0.01).A negative ecm value suggests that any shock to the long run equilibrium is corrected with the output supply response occurring in the opposite direction to that of the impact of the exogenous variable such as drought, that destabilizes the equilibrium. The speed of adjustment is measured by the co-efficient, which shows the fraction of the shift away
Akanni and Okeowo 275
Table 5. Johansen co-integrating test for sorghum.
Hypothesized Eigen value
Trace 0.05 Prob.
No. of CE(s) Statistic Critical value
None * 0.657396 120.1604 117.7082 0.0347
At most 1 0.570951 81.59789 88.80380 0.1479
At most 2 0.473961 51.13529 63.87610 0.3647
At most 3 0.342701 28.00962 42.91525 0.6215
At most 4 0.247227 12.90342 25.87211 0.7457
At most 5 0.071733 2.679699 12.51798 0.9122
None 0.657396 38.56248 44.49720 0.1916
At most 1 0.570951 30.46260 38.33101 0.3004
At most 2 0.473961 23.12567 32.11832 0.4091
At most 3 0.342701 15.10620 25.82321 0.6249
At most 4 0.247227 10.22372 19.38704 0.5949
At most 5 0.071733 2.679699 12.51798 0.9122
Source: Data analysis, 2009.
from the equilibrium that is corrected within the next one year. The speed of adjustment was rather too slow (sluggish), and insignificant for maize and rice but faster and significant for millet and sorghum. For millet, 42% of any shock to the long run equilibrium is corrected within the next one year. This indicates that the equilibrium is restored within 2 years and 3 months. For sorghum, about 86% of the shock to the long run equilibrium is corrected within a year and the equilibrium is restored within one year and two months. Table 6 however suggests that the short run elasticities of response is generally poor as co-efficients of virtually all the lagged variables were not significant except for output supply and import quantity of millet. Trend analysis of aggregate output supply of selected cereals The result of the estimated trend analysis for the output of selected cereals are presented in Table 7.The co-efficients of the time trends were positive for all the cereals. This means that time was a relevant determinant of the variations in all sets of outputs of cereals. The co-efficients are statistically significant (p < 0.01) for the four crops signifying general output increases over the period. The regression equations also had good fit with R
2 value
of 0.87 and F-value of 230.20 for sorghum, R2 value of
0.73 and F-value of 98.31 for millet, R2
value of 0.88 for maize with F-value of 269.01 and R
2 value of 0.83 and F-
value of 169.13 for rice respectively. Since positive co-efficient values (slopes) were observed for the output supply series, it could be concluded that significant
growth or increases were recorded in output supply levels of the selected cereals during the period under investigation. Estimated aggregate output supply functions This study estimated the output supply equations for Nigeria‟s main food grains namely maize, rice, sorghum and millet. Equations 9 to 12 showed the supply functions with their corresponding coefficient of multiple determinations (R
2) for the crops under investigation.
Detailed information on the result of regression analysis of the aggregate output supply models are provided in Table 8. Maize output has only hectarage and producer price being statistically significant at 5 and 1% respectively (Equation 9). On the overall, the coefficient of multiple determinations (0.76) indicated that all the regressors accounted for 76% of the variability in the maize output.
Based on a priori the coefficients for hectarage, rainfall, world price and producer price are positive whereas that of import quantity is negative. From the findings in equation 9 the coefficient for hectarage and producer price for maize conform to a priori as they are positive. This indicates that a unit increase in hectarage and producer price will bring about corresponding increases in output of maize. The rainfall variable has a negative coefficient in the model. World price that should have been positive was inversely related. The interpretation of these results is a mixture in the sense that maize as an annual crop is sensitive to moisture stress hence a favorable weather condition measured by rainfall would
276 J. Stored Prod. Postharvest Res.
Table 6. Vector error correction model (VECM) of aggregate output supply response for selected cereals in Nigeria.
Error correction Maize Rice Millet Sorghum
ECM Term -0.0333969 (-0.18550) -0.011752 (-0.73501) -0.421576 (-3.09930) -0.863695 (-2.80002)
Equation (10) showed the responses of rice to the tested variables. Producer price of rice was positive and statistically significant at 1% level. This indicates a conformation to theoretical expectations. The output response of rice to hectarage was not statistically
significant but was positive. Rice importation showed a negative sign and was statistically insignificant. Experience has shown that the era of rice ban in Nigeria boosted domestic production tremendously. From Equation (10), three of the five determinants were
For instance, in the rice regression model, rainfall, world price and producer price were significant at 1% respectively whereas import quantity and hectarage were insignificant. On the overall, using the coefficient of multiple determinations (R
2) 65.2% of the variability in the
rice output is attributed to the independent variables. The regression coefficient for hectarage, world price and producer price conformed with a priori expectations as
they have positive signs showing that a unit increase in hectarage, world price and producer price will bring about corresponding increase in the output of rice whereas that of import quantity and rainfall were negative showing declining output with increases in import quantity and rainfall. This is not unexpected, as the quantum of rainfall may not necessarily be effective as the distribution over time of production:
As shown in Equation (11), world price for sorghum was statistically significant (p < 0.01). The output supply regression model has an R
2 of 0.82 and 3 of the 5
variables being statistically significant (world price = p < 0.1; hectarage = p < 0.01 and import quantity = p < 0.05)
with 82% variability in sorghum output supply being attributed to the five independent variables. Producer price was positive for the equation but was however not statistically significant:
(0.60) (-1.15) (1.23) (5.05)*** (-4.14)*** Equation 12 shows the coefficients for the millet model. Only the import quantity and rainfall were statistically significant (p < 0.01) from the linear model. An R
2 of 0.76
was recorded. DISCUSSION Nearly all the series (except rainfall and world price) in maize output supply response function were associated with t-values that are greater than the critical value for the rejection of unit root when ADF test was conducted both at the levels and first difference of the series. This shows that maize output, hectarage, producer price and import quantity between 1970 and 2007 are non-stationary series. Thus, they cannot be included in their levels in the least square regression models. The series for maize output supply function are generally of I (>1) series except those of world price and rainfall. Thus, the hypothesis that unit root is present (Ho: β = 1) is rejected if tcal < ttab, and if rejected for the test at the level of the series, the series is stationary. Thus, the null hypothesis of non-stationary was accepted. The output supply function for rice shows a unit root test that implies the association of t-values that are greater than the critical values at the series level. All variables exhibited I (1) series except for producer price I (>1). However, non-trended model at the first difference shows output supply, hectarage, world price, import quantity and rainfall as
being greater in absolute values than critical value thus providing the basis for the rejection of the unit root. Producer price of rice however exhibited non-stationary throughout. Rice output, hectarage and rainfall had t-values at the trended first difference ADF test that were greater than critical values.
For millet, ADF test revealed that variables examined at their levels using both the trended and non-trended models of the ADF regression test recorded t-values that were greater than the critical value for the rejection of unit root when ADF test was conducted. At the first difference of the series, millet output supply, import quantity, rainfall and world price had t-values that were greater in absolute value. This shows that hectarage, producer price, and import quantity between 1970 and 2007 are non-stationary series. This agreed with the earlier position held by Rahji and Adewunmi (2008), Akpokodje (2008) , Adeniyi (1984) and Olubode et al. (2006) on similar studies on food grains. Thus, these variables cannot be included in their levels in least square regression models. However, at the levels of the series, none of the variables is qualified for inclusion in the least square regression models. The series are generally I (1) series except for hectarage and producer price I (>1). CONCLUSION AND RECOMMENDATIONS In this study, the relatively low price elasticity further
278 J. Stored Prod. Postharvest Res. confirmed that in Nigeria, agriculture is still less responsive to price incentives. While good quantities of rainfall were capable of raising the output supply of all the cereals, it is interesting to note that world price for such crops as maize and millet had relatively insignificant effect. The near-zero impact of prices on millet output could have arisen from the fact that lagged prices are better considered by farmers as agricultural products have their prices set before planting (Akpodojie, 2008). However, Olubode et al. (2006) noted that, if price rises significantly, without sufficient machinery and credit to increase supply in response to the „good‟ price, the price response might remain low. Again, for a nation like Nigeria, where importation is increasing, especially for rice and maize, there is the tendency for the price of agricultural products to drop. This may not be a good inspiration for the local farmers. This in turn, may discourage commercial production. As rightly observed by Akpokodje (2008) agricultural price policy measures must be carefully implemented such that local production of cereals does not suffer at the expense of the import.
Generally, the output supply responses for all the crops were positive for increases in hectarage, rainfall, producer price, and world price but negative (inversely) to import quantities. This shows that favorable weather and increase in hectarage are critical to raising the output supply response since the associated coefficients were positive and significant for all the crops. The significant and direct impact of quantity of rainfall is an indication that investment in irrigation (artificial water supply to the crops) would exercise significant impact in raising output of the selected cereals in Nigeria. It thus suggests that government would better support increased output of these crops and food security in Nigeria by supporting both private and public investment in irrigation facilities. The fact that the coefficient of producer price is positive for all crops but significant for sorghum (p < 0.01), maize (p < 0.01) and rice (p < 0.01) is an indication that farmers in Nigeria respond positively to price incentives. Thus, domestic producer price support policy, such as a guaranteed minimum price policy will enhance domestic supply of food grain in the country. Critical evidence in this study is the significant but inverse relationship between output supply response and import quantities for all the crops. This shows that an unregulated importation tends to discourage domestic production of all the selected crops. Thus, some kinds of domestic support such as imposition of higher tariffs on imported foodgrains and effective control of smuggling are critical in stimulating domestic production of the crops. The need for government to be more firm in the control of rice and maize importation is obvious. Bello (2004) rightly noted that Nigeria is known to have the potential to produce enough rice to meet local requirements and even export.
It is the belief of the authors that, while these recom-mendations are not exhaustive, proper implementation of all or some of them would go a long way in stimulating the desired results in making Nigeria self- sufficient in food grains production‟. With increased supply frontiers in foodgrains, the quality of household food intake and the access of livestock and brewing industries to these grains will be enhanced. In the long-term, this might lead to a significant reduction in the market prices of cereals in this country. REFERENCES
Adeniyi JP (1984). “Generating increased rice supply in Nigeria: A study
of Marketed surplus and Home Consumption”. J. Econ. Bus. Environ., 2(1&2): 39-49.
Arize AC, Chooekawong P, Prasanpanic V (2000): Foreign Trade
Behaviour in Thailand: Stable of Unstable? Am. Econ. Rev., 44(2): 36-45
Akpokodje G (2008). “Impact of price and non-price factors on
aggregate crop output in Nigeria”. J. Rural Econ., 4(1): 1-24 Bello A (2004). Nigeria Imported US700 million rice in 2003: Federal
Minister of Agriculture and Rural Development. Mallam Adamu Bello
in Nigerian Tribune Newspaper. EViews (1998). “EViews Version 3.1 Help Topics”, EViews, Quantitative