Analysis of Biogenic Amines by GC/FID and GC/MS Laura Nakovich Thesis submitted to the faculty of the Virginia Polytechnic Institute and State University in partial fulfillment of the requirements for the degree of MASTER OF SCIENCE In Chemistry Dr. Harold M. McNair, Chair Dr. Paul R. Carlier Dr. Larry T. Taylor July 16, 2003 Blacksburg, Virginia Key Words: Gas Chromatography, Biogenic Amines, Propyl Chloroformate Derivatives, Mass Spectroscopy Copyright 2003, Laura Nakovich
Transcript
Analysis of Biogenic Amines by GC/FID and GC/MS
Laura Nakovich
Thesis submitted to the faculty of the Virginia Polytechnic Institute and State University in partial fulfillment of the requirements for the degree of
MASTER OF SCIENCE
In
Chemistry
Dr. Harold M. McNair, Chair Dr. Paul R. Carlier Dr. Larry T. Taylor
July 16, 2003
Blacksburg, Virginia
Key Words: Gas Chromatography, Biogenic Amines, Propyl Chloroformate Derivatives, Mass Spectroscopy
Copyright 2003, Laura Nakovich
Analysis of Biogenic Amines by GC/FID and GC/MS
Laura Nakovich
(Abstract)
Biogenic amines (particularly histamine in the presence of putrescine and
cadaverine) can lead to scombroid food poisoning if levels become too high. Low levels
of these biogenic amines occur naturally, but high levels (FDA sets 50 ppm of histamine
in fish as the maximum allowable level) can lead to scombroid poisoning.
A number of analytical methods have been employed to analyze biogenic amines,
especially High Performance Liquid Chromatography (HPLC). Amines in general are
difficult to analyze by Gas Chromatography (GC) due to their lack of volatility and their
interaction with the GC column often leading to significant tailing and poor
reproducibility. GC methods could be simpler and cheaper than HPLC equipment in
some cases. Biogenic amines need to be derivatized before both GC and HPLC
analyses. The objective of this research was to develop a relatively fast, reproducible
method to derivatize and quantitate biogenic amines in fish at trace levels using GC/FID.
The derivatizing reagent used in the experiments was propyl chloroformate, useful for
aqueous samples. A method for GC/MS was also developed and used to confirm the
identity of six derivatized biogenic amines. To our knowledge no reference spectra for
these derivatives has been published.
It was concluded that best results are obtained using a Cold-On-Column (C.O.C.)
inlet with a short column (15 meters), thick film stationary phase (ZB-5, 1.00µm df), and
with recommendations to cut 40 cm from the inlet end of the column every 25 injections
when using C.O.C. Duplicate samples of Atlantic Salmon were analyzed on days 0, 3,
and 5. Levels of histamine were below 50 ppm for days 0 and 3, but day 5 showed
average levels of 160 pm (cadaverine), 1000 ppm (histamine), and 350 ppm (tyramine).
Good precision of six amine stardards at 50 ppm was shown: heptylamine 5.2%,
Dedicated to my parents John and Joan Nakovich and my brother John Nakovich.
Thank you for believing in me to help me see that if I work hard enough there are no
limits to what I can do, and for loving me enough to let me go.
vi
Table of Contents
Analysis of Biogenic Amines by GC/FID and GC/MS .................................................. ii
Acknowledgements .......................................................................................................... iv
Dedication .......................................................................................................................... v
Table of Contents ............................................................................................................. vi
Table of Figures.............................................................................................................. viii
Table of Structures ........................................................................................................... x
Table of Tables ................................................................................................................. xi
Chapter 1-Introduction and Background....................................................................... 1
GAS CHROMATOGRAPHY AND AMINE ANALYSIS.......................................................................... 2 DERIVATIZATION OF AMINES............................................................................................................ 3 CARBAMATE DERIVATIVES OF AMINES .......................................................................................... 6
TYRAMINE 12.59 MINUTES................................................................................................................... 46 FIGURE 29. DAY 3 SALMON SAMPLE B, RUN 3 OUT OF 5; CADAVERINE 11.61, HISTAMINE 11.88, AND
TYRAMINE 12.59 MINUTES................................................................................................................... 47 FIGURE 30. DAY 5 SALMON SAMPLE A, RUN 3 OUT OF 5; PUTRESCINE 10.96, CADAVERINE 11.47, HISTAMINE
11.73, AND TYRAMINE 12.45 MINUTES. ............................................................................................... 49 FIGURE 31. DAY 5 SALMON SAMPLE B, RUN 3 OUT OF 5; PUTRESCINE 10.96, CADAVERINE 11.47, HISTAMINE
11.73, AND TYRAMINE 12.44 MINUTES. ............................................................................................... 49 FIGURE 32. RUN 3 OF 5, 100 PPM AMINE MIX (HEPTYLAMINE 8.30, PUTRESCINE 11.11, CADAVERINE 11.61,
HISTAMINE 11.88, TYRAMINE 12.59, SPERMIDINE 16.58 MINUTES). .................................................... 57 FIGURE 33. DERIVATIVE BLANK RUN WITH UNKNOWN PEAKS AT 13.42 AND 14.90 MINUTES. ..................... 57 FIGURE 34. RUN 3 OF 5, 50 PPM AMINE MIX (HEPTYLAMINE 8.29, PUTRESCINE 11.11, CADAVERINE 11.61,
HISTAMINE 11.87, TYRAMINE 12.59, SPERMIDINE 16.57 MINUTES). .................................................... 57 FIGURE 35. RUN 3 OF 5, 50 PPM AMINE MIX WITH HOT INLET 200�C (HEPTYLAMINE 8.86, PUTRESCINE 11.97,
A fillet of fresh Atlantic Salmon was purchased from Kroger for a five day study.
After purchase it was immediately brought into the lab and analyzed as descrbed below.
The method is based on part in work done by Antoine et al25. It should be noted that the
salmon was analyzed in duplicate. Fifteen grams of the salmon were weighed on a
Mettler AE 260 Delta Range Scale (Columbus, OH). The fish was then chopped up into
very small fragments with a knife and placed into a plastic Nalgene bottle, which
contained 50 mL of methanol (Burdick and Jackson, Muskegon, MI) and 50 mL of HPLC
grade water. The solution in this bottle was homogenized by vortex mixing for two
minutes. The salmon mix was then placed into a 45°C water bath for 45 minutes. Next
the extract was cooled to 30°C in a cold water bath. Upon cooling, a portion of the mix
was centrifuged in plastic tubes for 20 minutes. Then 200 µL of the supernate was used
for derivatization by the same propyl chloroformate derivatization method used on the
standard amines, however the sample was not diluted 1:5 after derivatization. Lastly, the
derivatized salmon extracts were analyzed by the GC/FID method five times and one
time by the GC/MS method. The entire salmon extraction and derivatization process was
repeated in duplicate on days three and five. After the initial salmon analysis on day one
and until day five, the salmon fillet was stored at 4°C. The resulting data from the
salmon study is included and analyzed in Chapter 5-Salmon Analysis Results.
17
Chapter 3-GC/MS Results of Standards
18
Introduction
It was necessary to perfom GC/MS analysis on the biogenic amines once they had
been derivatized to confirm that the derivatives actually existed. It was not sufficient to
use only single standards of each derivatized biogenic amine and retention times for
confirmation of peak identity because it would not have ensured that the peak was
actually the propyl chloroformate derivative and not a contaminant or degradation
product. To my knowledge there is no spectra libraray containing the propyl
chloroformate derivatives of the biogenic amines examined in this study. Therefore, it
was important to perform a comprehensive analysis of the derivatized amine ion
fragments.
Amine Standard Derivatized
The chromatogram of the 50 ppm derivatized amine standard is shown in Figure 5. There are eleven major peaks that appear, as well as a few minor ones that
should be examined. Analysis of individual peaks is discussed in depth in this chapter.
Average of 12.627 to 12.644 min.: 13MAY00.D (-)156
213
43
70 130
25998 284173
316 403196 342242 377
Figure 17. Spermidine derivative GC/MS spectra.
33
Table 11. Derivatized Spermidine-Proposed Ion Fragments
Fragments Ion
(molecular
weight)
Suggested Structure
Molecular
Ion
403
C
O
C
O
OCH2CH2CH3CH24
N CH23
NH
OCH2CH2CH3C
O
CH3CH2CH2O NH
+.
Derivative
Fragment
Ion
316
C
O C
O
OCH2CH2CH3
CH24
N CH23
NHCH3CH2CH2O NH+
Derivative
Fragment
Ion
259 C
O
NCH3CH2CH2O NH CH23
C
O
OCH2CH2CH3
CH2
+
Derivative
Fragment
Ion
130 CH2CH2 N
HOCH2CH2CH3C
O
+
Derivatizing
Reagent
Fragment
Ion
43 CH3CHCH3+
Derivative Blanks
There are several peaks that appear in Figure 5 (retention times 1.82, 2.71, 8.27
minutes) that are not amine derivatives or degradation products. These peaks, as well as
34
a few smaller ones, appear in Figure 18 of a derivative blank that was run after it was
diluted 5:1 in the organic solvent mix iso-octane/chloroform. The blank included the
same amounts of reagents and water, but not the amines. The derivative blank was
prepared the same as all other derivatives. The peak at 1.87 minutes is a xylene that
shows up in most runs and the peak at 2.72 minutes is identified as propyl carbonate.
The remaining peaks in Figure 18 are a variety of siloxane peaks most likely from the
column or septa that did not show up regularly in other analyses.
2.00 4.00 6.00 8.00 10.00 12.00 14.00 16.000
50000
100000
150000
200000
250000
300000
350000
400000
450000
500000
550000
600000
650000
Time-->
Abundance
TIC: 05310302.D 1.87
2.72
4.11
5.33
6.43
7.41
8.27 9.03 9.73 10.51
Figure 18. Derivative blank run by GC/MS, diluted 5:1.
One additional derivative blank was run that had been treated in the same way as
the derivative above, except that is was not diluted 5:1. The resulting chromatogram is
shown in Figure 19. There are several other peaks that appear in Figure 5, which can be
explained by this blank derivative run (retention times 1.82, 2.71, 11.28, and 12.06
minutes). These peaks are not amine derivatives or degradation products, however they
do appear consistently in almost all derivatives run by either GC/MS or GC/FID (results
in Chapter 4-GC/FID Results of Standards).
35
2.00 4.00 6.00 8.00 10.00 12.00 14.00 16.00
0
50000
100000
150000
200000
250000
300000
350000
400000
450000
Time-->
Abundance
TIC: 05310301.D
1.84
2.71
11.29
12.06
Figure 19. Derivative blank run by GC/MS, not diluted 5:1.
36
Chapter 4-GC/FID Results of Standards
37
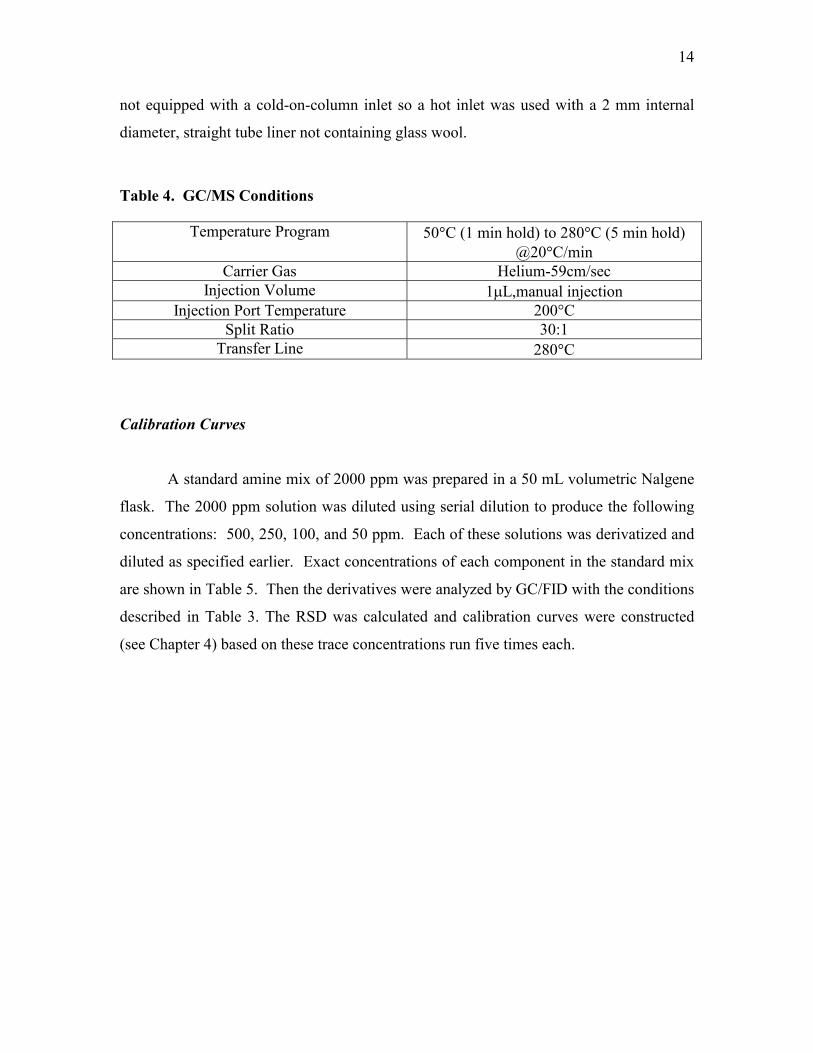
Calibration Curves
A calibration curve was constructed using the following concentrations: 100, 50,
20, and 10 ppm. The results of the 100 ppm amine standard are listed in Table 12.
Table 12. 100 ppm Amine Standard
Data File 77.7ppm Hep 8.30min 87.7ppm Put 11.11min 87.3ppm Cad 11.61 min 90.7ppm His 11.88 min 93.3ppm Tyr 12.59 min 92.5ppm Spe 16.58 min06240301.d 818.7 317.1 427.5 82.1 100.7 285.606240302.d 883.9 344.8 463.0 85.8 109.7 313.406240303.d 943.3 371.0 496.7 89.3 117.4 337.006240304.d 963.5 377.8 505.8 87.4 119.8 346.706240305.d 1027.8 403.6 539.8 90.5 127.8 371.3Average 927.4 362.9 486.6 87.0 115.1 330.8Std Dev 79.6 33.1 42.9 3.3 10.3 32.7%RSD 8.6 9.1 8.8 3.8 9.0 9.9
The % RSD for the amines is good at less than 10%. The resolution and peak shapes are good with slight fronting on heptylamine, putrescine, and cadaverine (Appendix, Figure 32). There are two peaks at 13.41 and 14.89 minutes that are unknown, but they appear consistently in the runs and are also in the derivative blank run (Appendix, Figure 33). The signal to noise ratios for the 100 ppm standard are all equal to or greater
than 20:1. Table 13 lists the results of the 50 ppm standard amine mix. The % RSD’s are
still below 10% for all of the amines and even below 7% for all amines except histamine.
Table 13. 50 ppm Amine Standard
Data File 38.9ppm Hep 8.30 min 43.9ppm Put 11.11 min 43.7ppm Cad 11.61 min 45.4ppm His 11.88 min 46.7ppm Tyr 12.59 min 46.3ppm Spe 16.58 min06250324.d 400.8 234.0 304.9 69.7 73.8 199.306250325.d 390.6 228.1 296.8 62.8 69.5 195.006250326.d 360.1 208.5 274.4 56.7 66.4 177.006250327.d 362.7 210.9 276.8 60.5 66.0 177.006250328.d 360.2 208.2 274.6 54.2 65.5 175.7Average 374.9 217.9 285.5 60.8 68.2 184.8Std Dev 19.4 12.2 14.3 6.0 3.5 11.4%RSD 5.2 5.6 5.0 9.9 5.1 6.2
38
The peak shapes and resolution are good (see Appendix, Figure 34). There does not
appear to be any fronting or tailing. At 50 ppm the signal to noise ratios for the standard
amines are all equal to or greater than 20:1.
A set of data was run at 50 ppm using the same GC/FID conditions as listed in
Table 3 except that there was no oven tracking because the inlet used was not COC, but a
hot inlet at 200°C. The liner used was a 2 mm inner diameter, straight tube, with no glass
wool. The results of the study are listed in Table 14 and a representative chromatogram
is shown in the Appendix, Figure 35. The spermidine peak is not detected in this set of
runs and the tyramine peak shape is very broad, tailing, and there appears to be a doublet.
Overall, the %RSD is at least 9% higher than the 50 ppm sample run COC. Also, the
peak areas using the COC inlet are an order of magnitude higher than they are for the hot
inlet. The poor results of the hot inlet study may be attributed to thermal degradation of
the carbamate derivatives in the inlet. It would have been very difficult and perhaps
impossible to use a hot inlet for quantitative analysis with the amine derivatives and still
achieve the same low limits of detection seen here (10ppm). Therefore, COC was
employed as the inlet of choice for the quantitative portion of the analysis.
Table 14. 50 ppm Amine Standard*, Hot Inlet 200°C
Data File 38.9ppm Hep 8.86 min 43.9ppm Put 11.97 min 43.7ppm Cad 12.52 min 45.4ppm His 12.85 min 46.7ppm Tyr 13.94 min 46.3ppm Spe 16.58 min06290303.d 16.6 5.9 7.8 NQ 12.5 ND06290304.d 18.6 6.7 8.6 NQ 7.3 ND06290305.d 14.2 5.0 6.8 NQ 7.0 ND06290306.d 22.3 7.8 9.8 NQ 6.3 ND06290307.d 14.2 4.5 6.1 NQ 5.4 NDAverage 17.2 6.0 7.8 7.7Std Dev 3.4 1.3 1.5 2.8%RSD 19.8 22.1 18.7 36.1
*NQ-not quantitatable, ND-not detectable
The 20 ppm standard amine mix results are shown in Table 15. The %RSD for the amines is good in the range from 2.4% to 5.3%. The peak
shapes and resolution (see Appendix, Figure 36) are still good with signal to noise ratios
The calibration curve for heptylamine is shown in Figure 20. The linearity is good with a
correlation coefficient of R2 = 0.9911.
40
Calibration Curve for Heptylamine
y = 12.259x - 47.918R2 = 0.9911
-200.00
0.00
200.00
400.00
600.00
800.00
1000.00
0 20 40 60 80 1
Concentration (ppm)
Peak
Are
a (p
A)
00
Figure 20. Heptylamine Calibration Curve
Below is the calibration curve for putrescine (Figure 21). The linearity is good with a
correlation coefficient of R2 = 0.9973.
Calibration Curve for Putrescine
y = 3.4524x + 63.398R2 = 0.9856
0.0050.00
100.00150.00200.00250.00300.00350.00400.00
0 20 40 60 80 1
Concentration (ppm)
Peak
Are
a (p
A)
00
Figure 21. Putrescine Calibration Curve.
41
Figure 22 shows the calibration curve for cadaverine. The correlation coefficient
is very good at R2 = 0.9918.
Calibration Curve for Cadaverine
y = 4.7845x + 72.619R2 = 0.9918
0.00100.00200.00300.00400.00500.00600.00
0 20 40 60 80 1
Concentration (ppm)
Peak
Are
a (p
A)
00
Figure 22. Cadaverine Calibration Curve
The calibration curve for histamine is shown in Figure 23. The linearity is good
with a correlation coefficient of R2 = 0.9746.
Calibration Curve for Histamine
y = 0.6852x + 26.628R2 = 0.9746
0.0020.0040.0060.0080.00
100.00
0 20 40 60 80 1
Concentration (ppm)
Peak
Are
a (p
A)
00
Figure 23. Histamine Calibration Curve.
42
Figure 24 shows the calibration curve for tyramine. The correlation coefficient is
good at R2 = 0.9962.
Calibration Curve for Tyramine
y = 0.9877x + 22.922R2 = 0.9962
0.0020.0040.0060.0080.00
100.00120.00140.00
0 20 40 60 80 100
Concentration (ppm)
Peak
Are
a (p
A)
Figure 24. Tyramine Calibration Curve.
The last calibration curve is for spermidine, and it is shown in Figure 25. The
linearity is good with an R2 = 0.9836.
43
Calibration Curve for Spermidine
y = 3.0528x + 48.422R2 = 0.9836
0.0050.00
100.00150.00200.00250.00300.00350.00400.00
0 20 40 60 80 1
Concentration (ppm)
Peak
Are
a (p
A)
00
Figure 25. Spermidine Calibration Curve.
44
Chapter 5-Salmon Analysis Results
45
Introduction
The guidance level that the FDA has set for the limit of histamine in fish is 50
ppm26. It has been shown that people are more likely to become sick from scombroid
toxicity with levels of 200 ppm or higher, however if there is 50 ppm histamine in one
part of the fish there may be 500 ppm in another part of the fish so the lower limit is used
as the acceptable standard27. It is significant to also consider the presence of other
biogenic amines such as putrescine and cadaverine because it is believed that they
contribute to the toxicity of histamine28. The results of the salmon study, including levels
of biogenic amines detected, are presented in this chapter.
Salmon Results-Day 1
After the fresh salmon was extracted, derivatized, and run by GC/FID it was
determined that no biogenic amines were present in either sample replicate 1 (A) or
replicate 2 (B). The quantitation limit was based on the lowest level of the calibration
curve at 10 pmm, with limits of detection estimated to be around 2-3 ppm for GC/FID.
The resulting chromatograms are shown in Figure 26 and Figure 27.
min0 2 4 6 8 10 12 14 16
pA
0
200
400
600
800
1000
1200
1400
FID1 B, (LAN\06250314.D)
4.3
50
4.4
12
4.9
63
6.3
35
12
.28
6
Are
a: 16
5.999
13
.45
2
14
.90
8
15
.344
Figure 26. Day 1 Salmon sample A, run 3 out of 5.
46
Figure 27. Day 1 Salmon sample B, run 3 out of 5.
There are several small, unknown peaks in the chromatograms, but they do not
correspond to the biogenic amines that were run in the standards. GC/MS runs did not
show evidence of biogenic amine derivatives for either sample A or B for day one.
Salmon Results-Day 3
After the salmon samples for day three were extracted, derivatized and run by GC/FID there were some trace levels of biogenic amines found, namely cadaverine, histamine, and tyramine. These GC/FID runs are shown in Figure 28 and Figure 29.
min0 2 4 6 8 10 12 14 16
pA
0
200
400
600
800
1000
1200
FID1 B, (LAN\06250320.D)
4.3
48
4.4
11
6.3
32
13
.67
3
min0 2 4 6 8 10 12 14 16
pA
0
200
400
600
800
1000
1200
FID1 B, (LAN\06270303.D)
4.3
43
4.4
06
6.3
31
11
.60
2 1
1.8
75
12
.28
6 1
2.5
87
Figure 28. Day 3 Salmon sample A, run 3 out of 5; cadaverine 11.60, histamine
11.88, and tyramine 12.59 minutes.
47
min0 2 4 6 8 10 12 14 16
pA
0
50
100
150
200
FID1 B, (LAN\06270309.D)
4.3
48
4.4
10
6.3
09
10
.58
9
11
.60
7 1
1.8
78
12
.59
3
13
.67
2
15
.35
4
Figure 29. Day 3 Salmon sample B, run 3 out of 5; cadaverine 11.61, histamine
11.88, and tyramine 12.59 minutes.
Levels of histamine were too low to quantitate based on a signal to noise ratio less than 10:1. Cadaverine had a signal to noise ratio greater than 10:1, and based on extrapolation of the calibration curve the average level of cadaverine was found to be 13 ppm (0.62 mg cadaverine/100 mg salmon, 6.2ppm for sample A and 2.0 mg cadaverine/100 mg salmon, 20 ppm for sample B). The percent RSD is very high (73%) at these low levels of cadaverine so the reproducibility of the data is not as good. Tyramine had a signal to noise ratio equal to 20:1 for sample A and 11:1 for sample B and average peak areas did fall within the calibration curve. For sample A there was 5.4 mg tyramine/100 mg salmon (54 ppm) and for sample B there was 6.2 mg tyramine/100 mg salmon (62 ppm). The average, therefore, was 58 ppm tyramine with standard deviation of 6 ppm and %RSD of 9.7%. The data for the replicate injections of samples A and B are listed below in Table 17 and Table 18, respectively.
GC/MS analysis was done for both samples A and B of day 3 to confirm the
prescence of cadaverine, histamine, and tyramine. These chromatograms and spectra are
displayed in the Appendix; Figure 38 through Figure 45.
Salmon Results-Day 5
On the last day of the study four biogenic amines were detected after extraction,
derivatization, and GC/FID and GC/MS analysis. Putrescine, cadaverine, histamine, and
tyramine were identified. Putrescine was detected with a signal to noise ratio of 11:1 for
sample A and 20:1 for sample B, however based on the peak areas being too low the
putrescine was not quantifiable. Cadaverine, histamine, and tyramine were quantitatable.
The representative chromatograms for the GC/FID runs are shown in
Figure 30 and Figure 31.
49
Figure 30. Day 5 Salmon sample A, run 3 out of 5; putrescine 10.96, cadaverine
11.47, histamine 11.73, and tyramine 12.45 minutes.
min0 2 4 6 8 10 12 14 16
pA
0
25
50
75
100
125
150
175
FID1 B, (LAN\06290315.D)
4.2
22
4.2
83
9.1
37
10
.44
9
10
.96
4
11
.46
8 1
1.7
34
12
.11
0 1
2.4
45
12
.94
2
13
.44
5
min0 2 4 6 8 10 12 14 16
pA
0
25
50
75
100
125
150
175
200
FID1 B, (LAN\06290322.D)
4.2
26
4.2
87
5.9
86
9.1
39
10
.45
0
10
.96
3
Are
a: 307
.156
11
.46
7 1
1.7
32
12
.10
9
12
.44
2
12
.94
2
Figure 31. Day 5 Salmon sample B, run 3 out of 5; putrescine 10.96, cadaverine
11.47, histamine 11.73, and tyramine 12.44 minutes.
The peaks shapes are good overall except for a small shoulder on the cadaverine peak. The signal to noise ratios for cadaverine, histamine, and tyramine are all at least 75:1 for both samples A and B. In Table 19 and Table 21 the %RSD’s for the analyte peak areas for day five samples A and
B, respectively. All the %RSD’s are good at less than 10%.