Page 1
Analysis of biological pathways, associated with
orthodontic force, using multiplex arrays.
by
Jay Louise Wilson
A thesis submitted to the University of Birmingham for the degree of
MASTER OF PHILOSOPHY
School of Dentistry
St Chad’s Queensway
Birmingham
B4 6NN
October 2010
Page 2
University of Birmingham Research Archive
e-theses repository This unpublished thesis/dissertation is copyright of the author and/or third parties. The intellectual property rights of the author or third parties in respect of this work are as defined by The Copyright Designs and Patents Act 1988 or as modified by any successor legislation. Any use made of information contained in this thesis/dissertation must be in accordance with that legislation and must be properly acknowledged. Further distribution or reproduction in any format is prohibited without the permission of the copyright holder.
Page 3
DEDICATION
To my husband Paul without whose help and support I would not be writing this
today.
Page 4
ACKNOWLEDGEMENTS
I would like to thank my supervisors Professor I.L.C Chapple and Dr W.P Rock for
their help and guidance through this study.
I would also like to thank Mr P.J Turner and Mrs S.J Church for their assistance in
making the clinical aspect of this thesis possible and Dr M Grant for helping me with
the laboratory side of this study and the writing of this thesis.
Page 5
ABSTRACT
Objective
The objective of the proposed study was to investigate tissue changes induced by
orthodontic forces at both tension and compression sites, with a view to better
understanding the biological processes that lead to differing rates of tooth movement
and adverse events.
Methods
Gingival Crevicular Fluid (GCF), was collected from mesiobuccal and distopalatal
locations on maxillary canine and second molar teeth using Periopaper! strips for 30s
from volunteers (n=21). Samples were taken at: baseline, before appliance placement
and tooth extraction (B); three months into orthodontic treatment (T1); at four hours
(T2); 1 week (T3); and 6 weeks (T4) after a distalising force had been applied to the
maxillary canine teeth. At each time point detailed periodontal health measures and
plaque scores were recorded, as well as impressions of the teeth. Study casts were
used to measure canine movement. GCF volumes were recorded and proteins eluted
into sterile water and stored at -80°C. Cytokines (GM-CSF, IFN", IL-1#, IL-2, IL-4,
IL-5, IL-6, IL-8, IL-10 and TNF$), tissue (MMP-9, TIMP-1 and 2) and bone
metabolism (RANKL and OPG) biomarkers were measured using muliplex protein
arrays on a Luminex 200! machine.
Page 6
Data analysis
Data were analysed using a Prism computer softwear programme.
Results
Tension sites at the maxillary canines showed increases in IL-1!, IL-8, TNF", MMP-
9 and TIMPs 1 and 2 across time points T2-T4, whereas the compression sites for
these teeth showed increases in IL-1! and IL-8 only at T2, MMP-9 at T3 and T4 and
RANKL at T4. GCF volume increased from T2 to T4 but plaque scores or bleeding
on probing did not increase over this time. Increases in the levels of biomarkers were
more consistently detected at sites of tension than of compression. Other biomarkers
were below assay detection limits.
Conclusions
There were significant changes in the profile of several biomarkers at the various time
points. These were consistant with tissue remodelling. Although differences were
seen between tension and compression sites, none of these were statistically
significant.
Increases in TNF", GM-CSF, IL-1! and IL-8 correlated with the rate of tooth
movement. MMP-9, TIMP-1 and TIMP-2 correlated with rate of movement 4 hours
after application of a distalising force.
Page 7
CONTENTS
Chapter 1
Introduction and Background 1
1.1 Introduction 2
1.2 Background 4
1.2.1 Remodelling of the periodontium 4
1.2.2 Bone remodelling 5
1.2.2.1 The bone remodelling cycle 5
1.2.2.2 Bone deposition 7
1.2.3 Theory of tooth movement 8
1.2.4 Remodelling of the periodontal ligament 11
1.2.4.1 Areas of compression 11
1.2.4.2 Areas of tension 13
1.2.5 Control of orthodontic tooth movement 14
1.2.5.1 Biomechanical theory 14
1.2.5.2 Pressure-tension theory 15
1.2.5.3 Piezo-electric theory 16
1.2.6 Effect of orthodontic forces on the periodontum 17
1.2.6.1 The gingival tissues 17
1.2.6.2 Connective tissue attachments 17
1.2.6.3 Periodontal health monitoring in the orthodontic patient 20
Page 8
1.2.6.3.1 BPE - Basic Periodontal Examination 21
1.2.6.3.2 Plaque levels 21
1.2.6.3.3 Severity of gingivitis 21
1.2.6.4 Force delivery systems to generate orthodontic tooth
movements 22
1.2.6.4.1 Force magnitude 22
1.2.6.4.2 Force duration 24
1.2.6.5 Mechanisms of force application 25
1.2.7 Force application measurement 26
1.2.8 Tooth movement measurement 27
1.2.9 Gingival crevicular fluid (GCF) 28
1.2.9.1 The gingival crevice 28
1.2.9.2 The formation of gingival crevicular fluid 28
1.2.9.3 The composition of gingival crevicular fluid 29
1.2.9.4 Collection of gingival crevicular fluid 30
1.2.9.5 Previous orthodontic studies using GCF 30
1.2.10 Inflammatory cytokines 32
1.2.11 Tissue metabolites 35
1.2.12 Bone metabolites 36
1.2.13 Aims of the study 38
1.2.14 Hypotheses 39
Page 9
Chapter 2
Materials & Methods 40
2.1 Materials 41
2.2 Methods 43
2.2.1 Ethical approval 43
2.2.2 Patient recruitment 43
2.2.3 Treatment 45
2.2.4 Gingival crevicular fluid 48
2.2.4.1 Calibration of Periotron 8000TM 48
2.2.4.2 Collection of GCF 48
2.2.5 Measurements used in periodontal indices 51
2.2.5.1 BPE (Basic Periodontal Examination) 51
2.2.5.2 Bleeding index 52
2.2.5.3 Plaque levels 52
2.2.6 Impression taking 53
2.2.7 Force application 54
2.2.8 Multiplex assay 56
2.2.9 Statistics 58
Page 10
Chapter 3
Clinical Indices Results 59
3.1 Introduction 60
3.2 Tooth movement 60
3.3 Plaque index 64
3.4 Gingival bleeding 67
3.5 GCF volume 70
3.6 GCF volume correlations 72
3.6.1 GCF correlations to Plaque and Bleeding scores 72
3.6.2 GCF correlations to speed of tooth movement 74
Page 11
Chapter 4
Cytokine Results 75
4.1 Introduction 76
4.2 Interleukin-1! 76
4.2.1 Associations between clinical indices and IL-1! levels. 78
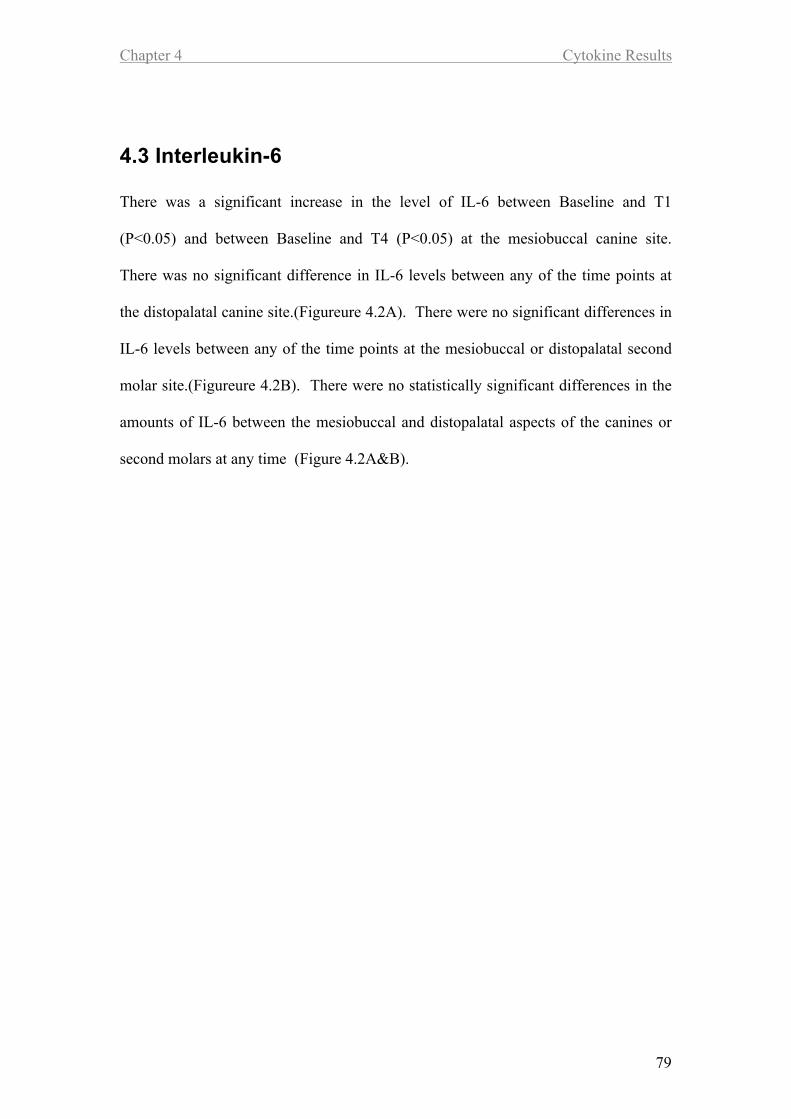
4.3 Interleukin-6 79
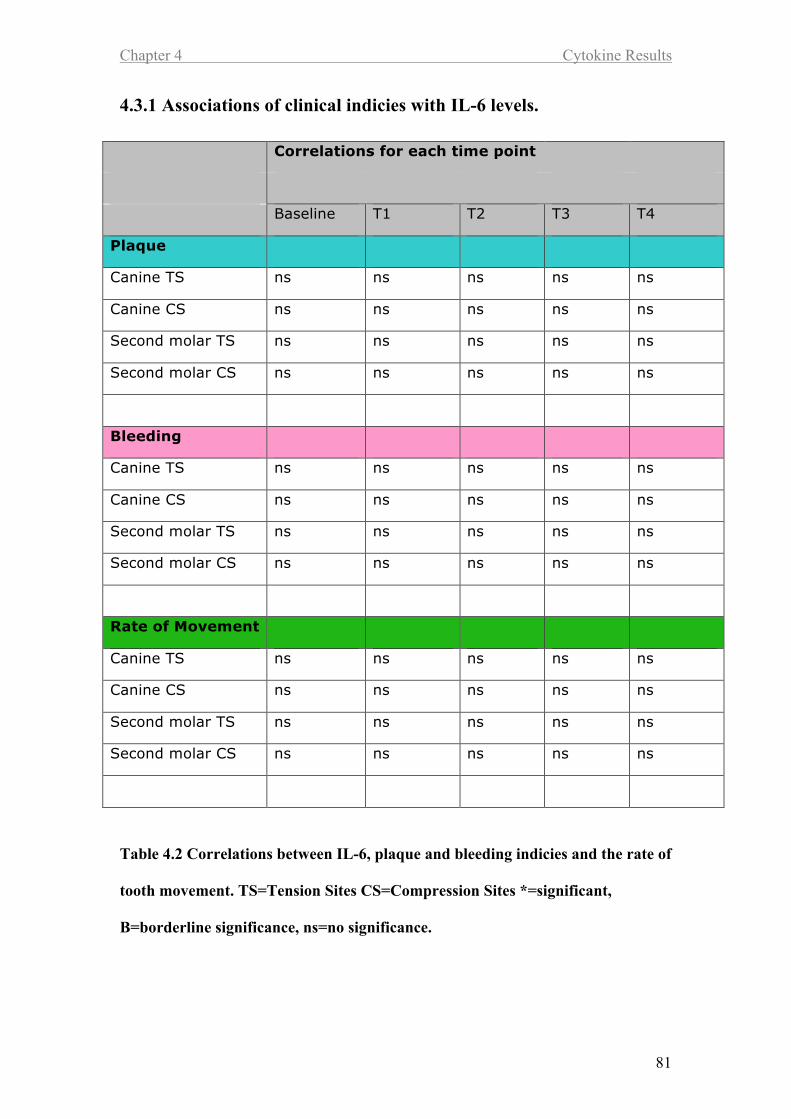
4.3.1 Associations of clinical indicies with IL-6 levels. 81
4.4 Interleukin-8 82
4.4.1 Associations between clinical indices and IL-8 levels. 84
4.5 Tissue Necrosis Factor $ 85
4.5.1 Associations between clinical indices and TNF$ levels. 87
4.6 Granulocyte-Macrophage Colony-Stimulating Factor 88
4.6.1 Associations between clinical indices and GM-CSF levels 90
4.7 Interferon " 91
4.7.1 Associations between clinical indices and IFN# level 93
Page 12
Chapter 5
Tissue Metabolite Results 94
5.1 Introduction 95
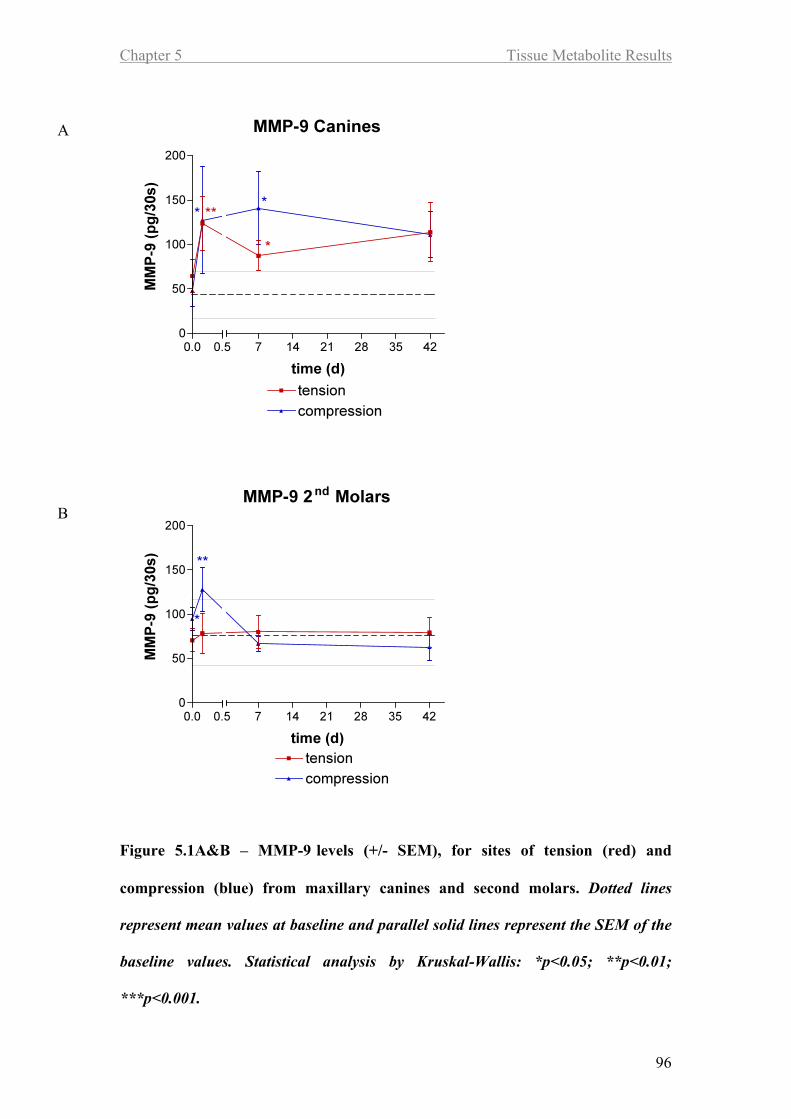
5.2 Matrix Metallopeptidase-9 95
5.2.1 Associations between clinical indices and MMP-9 levels. 97
5.3 Tissue Inhibitor of Metalloproteinases-1 98
5.3.1 Associations between clinical indices and TIMP-1 levels 100
5.4 Tissue Inhibitor of Metalloproteinases-2 101
5.4.1 Associations between clinical indices and TIMP-2 levels 103
5.5 Ratio MMP-9 / TIMP-1 104
5.5.1 Associations between clinical indices and MMP-9/TIMP-1
levels. 106
5.6 Ratio MMP-9 / TIMP-2 107
5.6.1 Associations between clinical indices and MMP-9/TIMP-2
levels. 109
Page 13
Chapter 6
Bone Metabolite Results 110
6.1 Introduction 111
6.2 Osteoprotegerin 111
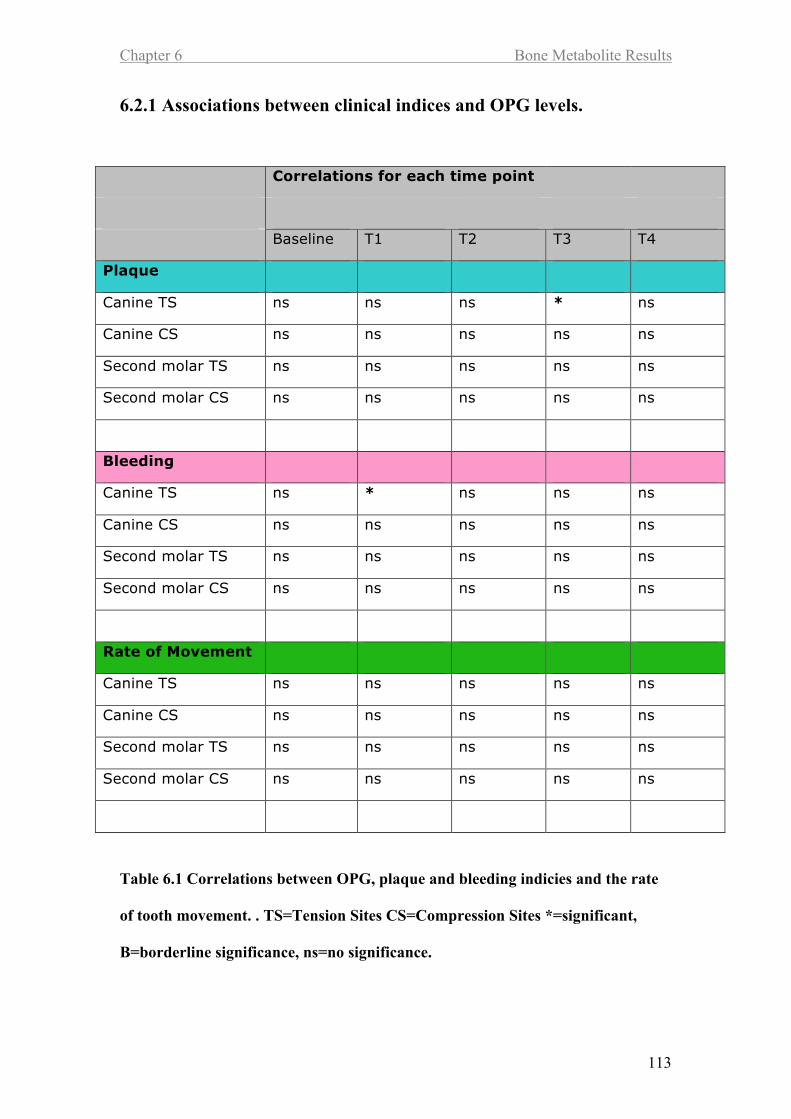
6.2.1 Associations between clinical indices and OPG levels 113
6.3 Receptor Activator of Nuclear Factor Kappa-B Ligand 114
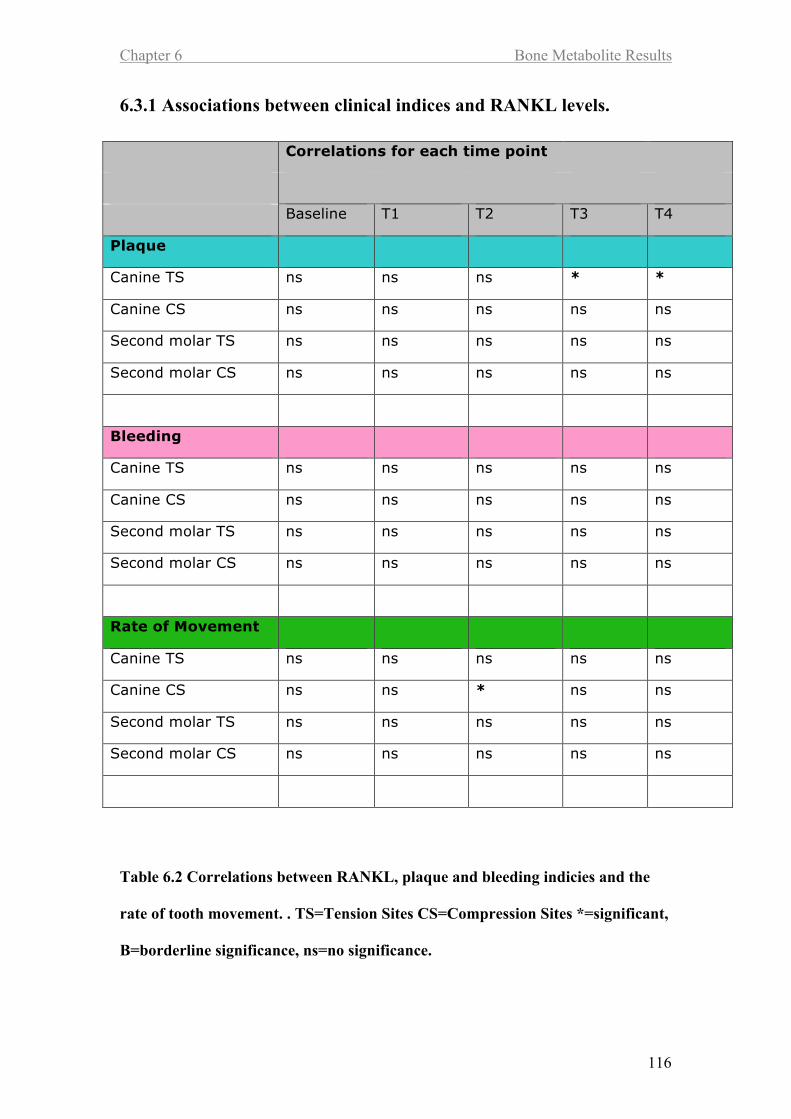
6.3.1 Associations between clinical indices and RANKL levels 116
6.4 RANKL/OPG Ratio 117
6.4.1 Associations between clinical indices and RANKL/OPG levels
119
Page 14
Chapter 7
7.1 Discussion 120
Chapter 8
8.1 Conclusions 130
Chapter 9
9.1 References 133
Appendices
Page 15
List of Tables
Table 1.1 Ideal force levels for different types of tooth movement 23
Table 2.1 Inclusion and exclusion criteria 44
Table 2.2 Volumes of GCF used in multiplex assays 57
Table 3.1 Comparisons of GCF volume changes with plaque and bleeding scores
at tension and compression sites around the maxillary canines and
second molars 73
Table 4.1 Correlations between IL-1!, plaque and bleeding indices and the rate
of tooth movement 78
Table 4.2 Correlations between IL-6, plaque and bleeding indices and the rate of
tooth movement 81
Table 4.3 Correlations between IL-8, plaque and bleeding indices and the rate of
tooth movement 84
Table 4.4 Correlations between TNF" plaque and bleeding indices and the rate of
tooth movement 87
Table 4.5 Correlations between GM-CSF, plaque and bleeding indices and the
rate of tooth movement 90
Page 16
Table 4.6 Correlations between IFN#, plaque and bleeding indices and the rate of
tooth movement 93
Table 5.1 Correlations between MMP-9, plaque and bleeding indices and the rate
of tooth movement 97
Table 5.2 Correlations between TIMP-1, plaque and bleeding indices and the rate
of tooth movement 100
Table 5.3 Correlations between TIMP-2, plaque and bleeding indices and the rate
of tooth movement 103
Table 5.4 Correlations between MMP-9/TIMP-1 ratio, plaque and bleeding
indices and the rate of tooth movement 106
Table 5.5 Correlations between MMP-9/TIMP-2 ratio, plaque and bleeding
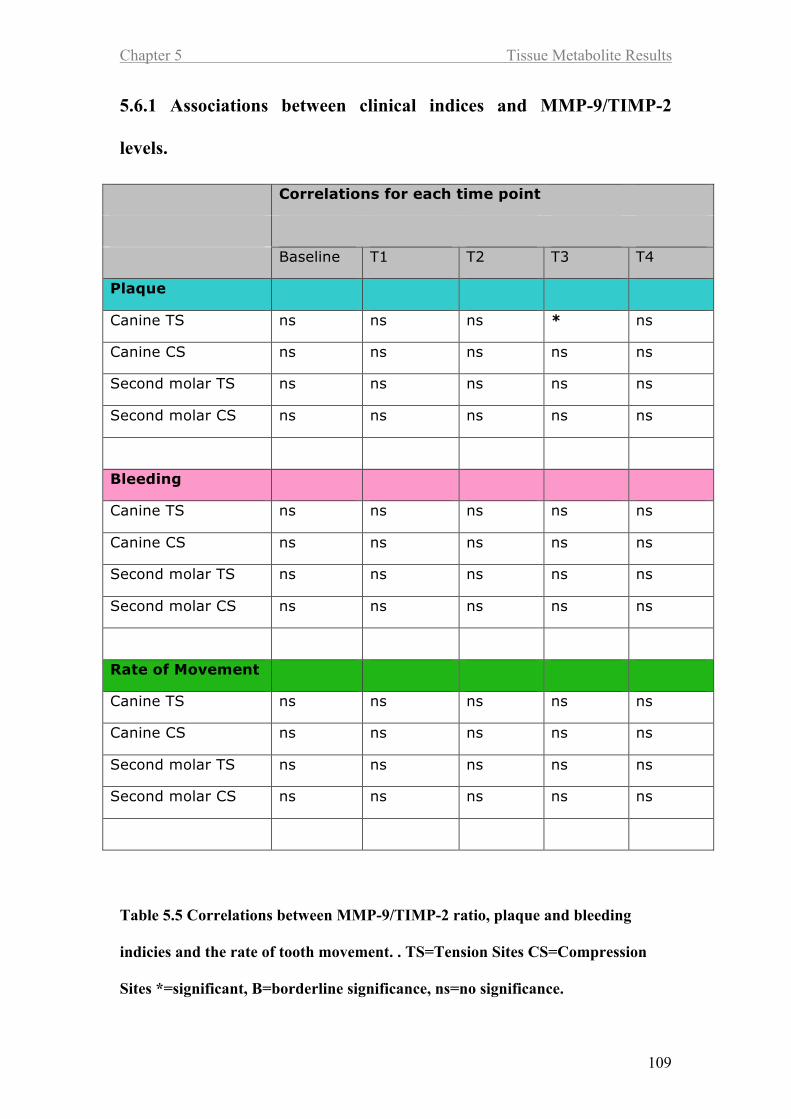
indices and the rate of tooth movement 109
Table 6.1 Correlations between OPG, plaque and bleeding indices and the rate of
tooth movement 113
Table 6.2 Correlations between RANKL, plaque and bleeding indices and the
rate of tooth movement 116
Page 17
Table 6.3 Correlations between RANKL/OPG ratio, plaque and bleeding indices
and the rate of tooth movement 119
Page 18
List of Figures
Figure 1.1 The bone remodelling cycle and metabolite interactions 37
Figure 2.1 A straightwire appliance with upper and lower Stainless Steel
archwires 46
Figure 2.2 Summary of periodontal assessement and sample collection along the
course of the study 47
Figure 2.3 Periostrip in a distobuccal position relative to the upper left central
incisor, illustrationg that it is held in place by the gingival 50
Figure 2.4 A 9mm NiTi closing coil spring stretched on a ligature between the
upper canine and upper first molar 54
Figure 2.5 An intra oral tension guage (Correx) used to measure the force
produced when a coil spring is stretched 55
Figure 2.6 The principle of a Luminex assay 57
Figure 3.1 Clinical measurements of tooth movement, from maxillary canines
A&B and the speed of tooth movement between the different time points. 62
Figure 3.2 Overall tooth movement, from maxillary canines 63
Page 19
Figure 3.3 Full mouth plaque scores at each time point 65
Figure 3.4 Clinical values and scores for plaque levels, at sites of tension (red)
and compression (blue) on maxillary canines and second molars 66
Figure 3.5 Full mouth bleeding scores at each time point 68
Figure 3.6 Clinical values and scores for plaque levels, at sites of tension (red)
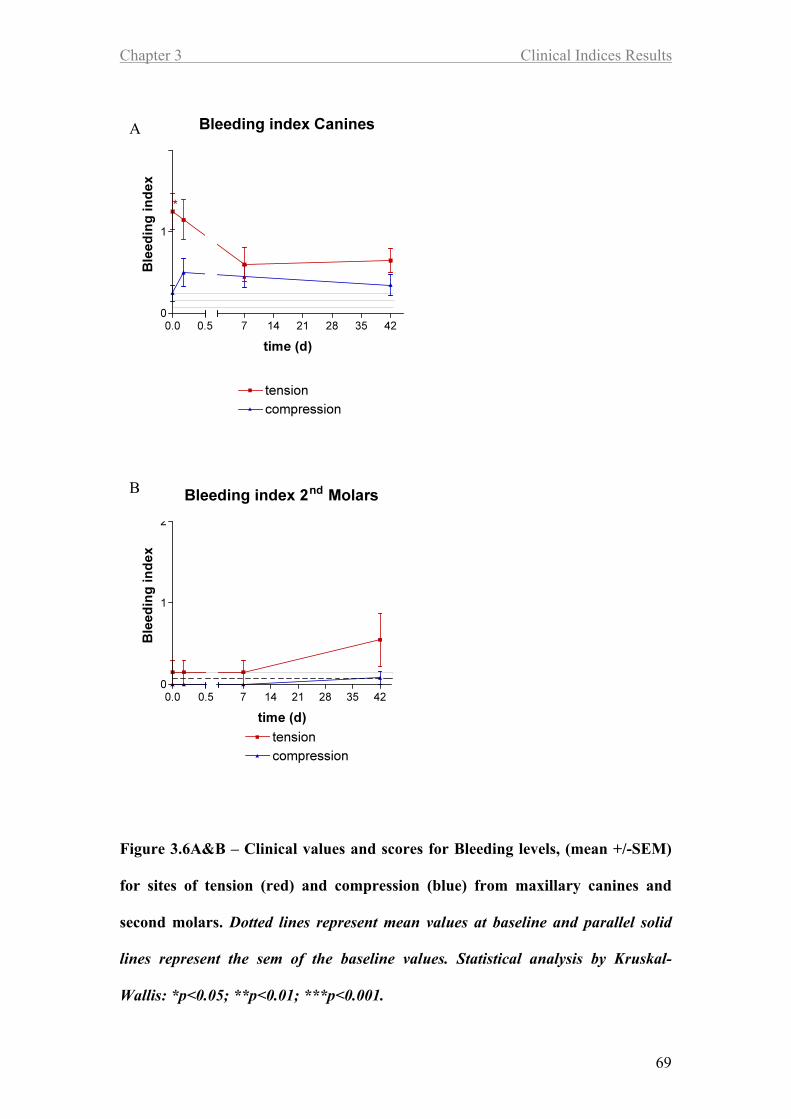
and compression (blue) on maxillary canines and second molars 69
Figure 3.7 Clinical values and scores for plaque levels, at sites of tension (red)
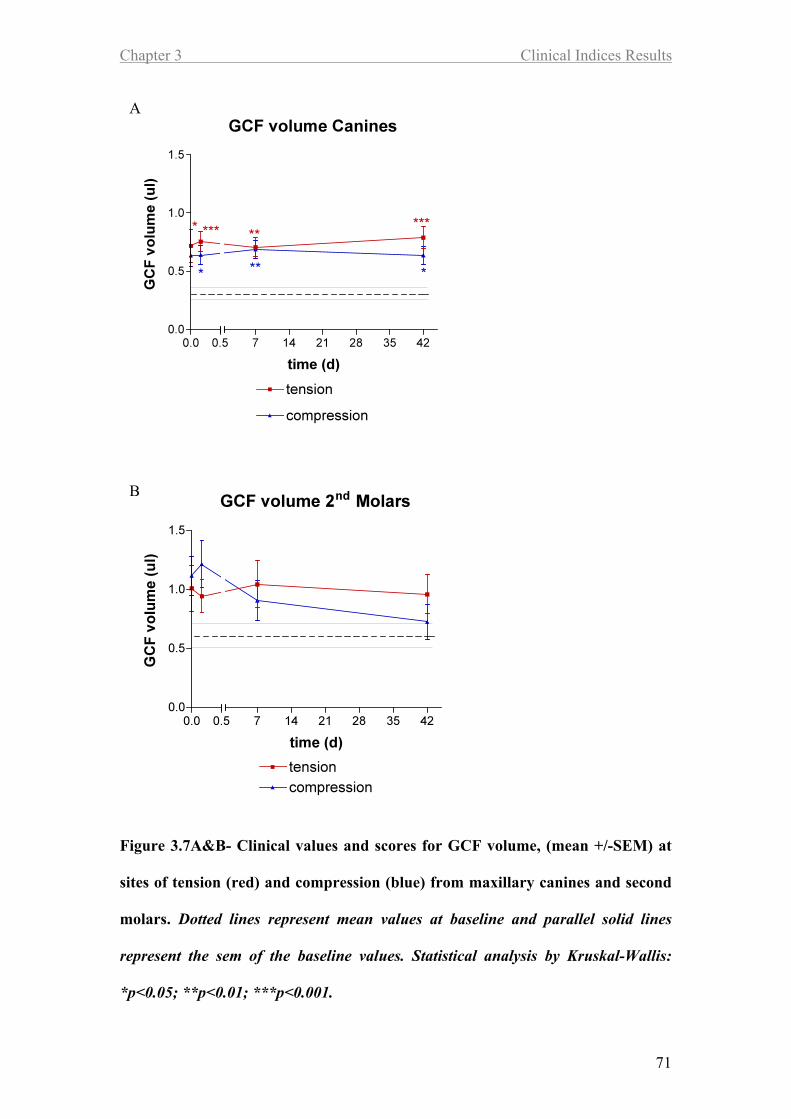
and compression (blue) on maxillary canines and second molars 71
Figure 4.1 IL-1# levels (mean +/- SEM), at sites of tension (red) and compression
A&B (blue) on maxillary canines and second molars 77
Figure 4.2 IL-6 levels (mean +/- SEM), at sites of tension (red) and compression
A&B (blue) on maxillary canines and second molars 80
Figure 4.3 IL-8 levels (mean +/- SEM), at sites of tension (red) and compression
A&B (blue) on maxillary canines and second molars 83
Figure 4.4 TNF$ levels (mean +/- SEM), at sites of tension (red) and compression
A&B (blue) on maxillary canines and second molars 86
Page 20
Figure 4.5 GM-CSF levels (mean +/-SEM), at sites of tension (red) and
A&B compression (blue) on maxillary canines and second molars 89
Figure 4.6 IFN# levels (mean +/- SEM), at sites of tension (red) and compression
A&B (blue) on maxillary canines and second molars 92
Figure 5.1 MMP-9 levels (mean +/- SEM), at sites of tension (red) and
A&B compression (blue) on maxillary canines and second molars 96
Figure 5.2 TIMP-1 levels (mean +/- SEM), at sites of tension (red) and
A&B compression (blue) on maxillary canines and second molars 99
Figure 5.3 TIMP-2 levels (mean +/- SEM), at sites of tension (red) and
A&B compression (blue) on maxillary canines and second molars 102
Figure 5.4 MMP-9/TIMP-1 levels (mean +/- SEM), at sites of tension (red) and
A&B compression (blue) on maxillary canines and second molars 105
Figure 5.5 MMP-9/TIMP-2 levels (mean +/- SEM), at sites of tension (red) and
A&B compression (blue) on maxillary canines and second molars 108
Figure 6.1 OPG levels (mean +/- SEM), at sites of tension (red) and compression
A&B (blue) on maxillary canines and second molars 112
Page 21
Figure 6.2 RANKL levels (mean +/- SEM), at sites of tension (red) and
A&B compression (blue) on maxillary canines and second molars 115
Figure 6.3 RANKL/OPG ratio (mean +/- SEM), at sites of tension (red) and
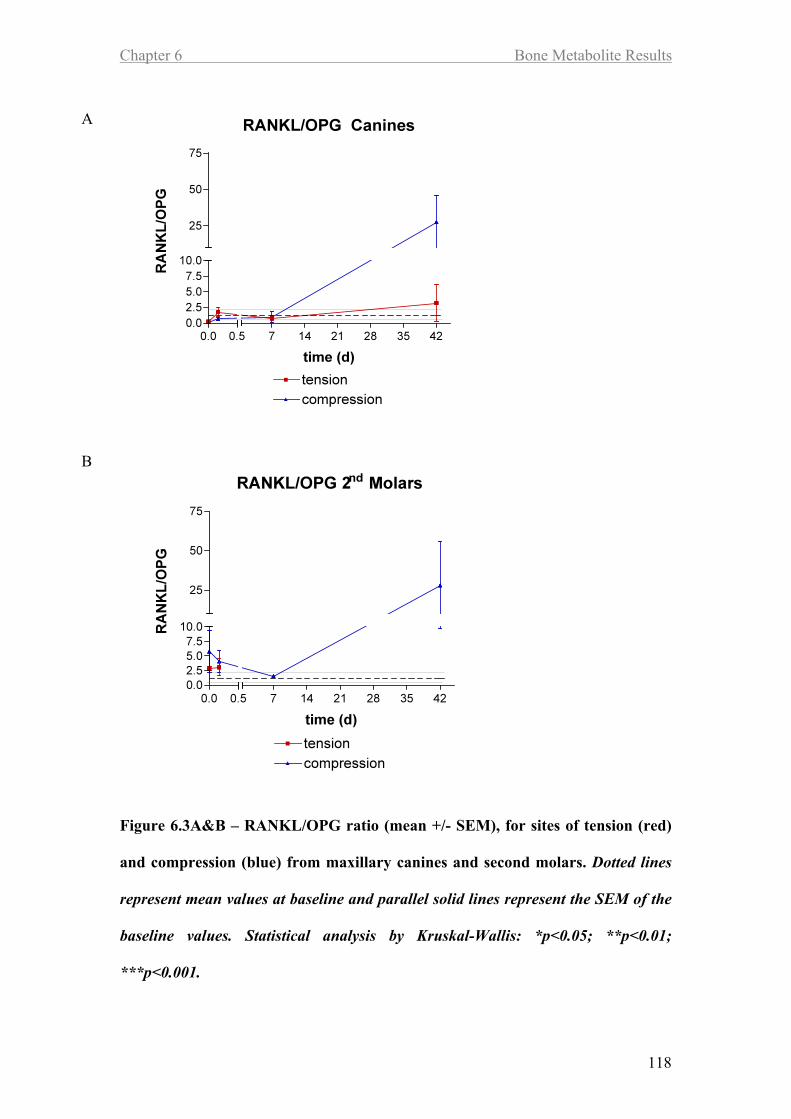
A&B compression (blue) on maxillary canines and second molars 118
Page 22
Chapter 1 Introduction and Background
1
Chapter 1
Introduction and Background
Page 23
Chapter 1 Introduction and Background
2
1.1 Introduction
Application of an appropriate force to a tooth results in tooth movement. Orthodontic
therapy is based on this principle and relies upon remodelling of the periodontal
ligament, gingival soft tissue and alveolar bone (periodontium) in order to allow tooth
movement, during which tissue is removed ahead of the tooth and deposited behind.
The periodontium consists largely of connective tissue. For optimal rates of tooth
movement the biological reaction generated in response to orthodontic force must be
optimised to prevent iatrogenic and degenerative changes including resorption of root
dentine.
Many factors influence the course of orthodontic treatment, including patient
compliance and individual biological responses to the application of orthodontic force
(Reitan, 1954). Gingival crevicular fluid (GCF) is a serum transudate. During its
passage from the vascular system, through the periodontal tissues and into the
gingival crevice, various substances (microbial or host-origin) are incorporated which
reflect the biology and physiology of the local tissues (Last et al., 1988). Studies have
used gingival crevicular fluid to assess changes within the periodontium and have
related those changes to tooth movement. However the majority of studies have
assessed individual biomarkers, which are representative of only a single biological
pathway. Waddington and Embery (2001) concluded that “It may well be that a
package of biomarkers may provide a more complete answer”.
Page 24
Chapter 1 Introduction and Background
3
Protein/cytokine arrays provide a contemporary technology necessary to
simultaneously profile different pathways, including inflammatory cytokine (e.g. IL-
1, TNF!) pathways and bone metabolic pathways involving matrix metalloproteinases
(MMPs) and their inhibitors (TIMPs). MMPs are zinc-dependent proteases with the
capacity to degrade extracellular matrix proteins (e.g. collagen, elastin). MMP-2 and 9
and TIMP-1 and 2 are thought to be important in bone metabolism (NIH, 2006). In
the present study panels of cytokines, tissue and bone metabolites were quantified in
GCF using protein arrays, to profile the biological response to orthodontic force.
Page 25
Chapter 1 Introduction and Background
4
1.2 Background
1.2.1 Remodelling of the periodontium
Orthodontic tooth movement requires remodelling of the periodontal tissues, with
tissue removal ahead of the tooth and the deposition and re-establishment of tissue
architecture behind. Orthodontic therapy is dependent on this remodelling.
When similar force systems are set up in different individuals the rate of tooth
movement varies due to differences in bone density, connective tissues, and cellular
responses within the periodontal ligament.
Whilst the response of individual teeth to orthodontic force is important, there is little
research available to enable the orthodontist to guage ideal force levels and thus
achieve optimal rates of tooth movement. It is known that subjects vary in their
responses to orthodontic forces irrespective of age (Reitan, 1954), but it is not known
how to predict this.
Page 26
Chapter 1 Introduction and Background
5
1.2.2 Bone remodelling
Bone structure is intimately related to function; an outer layer of dense cortical bone
surrounds a core of less dense trabecular bone. The cells predominantly responsible
for the turnover of bone matrix are osteoblasts and osteoclasts.
1.2.2.1 The bone remodelling cycle
The initial steps of bone remodelling involve the differentiation and activation of
osteoclast precursors to form osteoclasts, which then begin the process of bone
resorption. Resorption is followed by bone formation, the number of sites entering a
phase of bone formation combined with the rate of resorption will determine overall
turnover (Ericksen et al., 1986; Charles et al., 1987).
As mentioned previously, the process of bone resorption and formation are
interlinked. Details of the linking mechanisms are unknown, although transforming
growth factor (TGF)-ß, insulin-like growth factor (IGF) and plasminogen activators
have all been suggested (Martin and Ng, 1994).
The osteoclast is the primary resorbing cell. Initially there is recruitment and
dissemination of osteoclast progenitors. Such cells are haemopoietic in origin and are
related to the monocyte-macrophage lineage. Differentiation into osteoclasts is
thought to involve cell-to-cell interaction with osteoblast stromal cells (Suda et al.,
1996).
Page 27
Chapter 1 Introduction and Background
6
The bone surface is prepared by the removal of the surface un-mineralised osteoid by
the osteoblasts which line it and produce many proteolytic enzymes including MMPs,
collagenase and gelatinase. Osteoclasts recognise extracellular bone matrix proteins
such as osteopontin through cell surface integrin adhesion molecules.
The osteoclast then becomes activated at the surface of the mineralised bone. Such
activation is thought to be mediated through the osteoblast via local factors or cell-to-
cell contacts (Fuller et al., 1991).
Osteoclasts resorb the bone surface by producing hydrogen ions, which change the pH
balance and dissolve the inorganic elements. Proteolytic enzymes then degrade the
organic components. The organic matrix is composed mainly of collagen type I (90%
of the protein in bone) and is degraded by two main types of enzyme, the lysosomal
cysteine proteinases cathepsin B, L, and K together with the matrix
metalloproteinases; collagenase and gelatinase B.
The cessation of osteoclast activity results from apoptosis (programmed cell death),
which suggests that the regulation of osteoclast life span may be another important
determinant of bone metabolism.
Page 28
Chapter 1 Introduction and Background
7
1.2.2.2 Bone deposition
Around nine days following the onset of resorption, when the osteoclast has eroded
the bone surface to a maximum depth, a reversal process begins. Osteoclastic activity
is reduced by apoptosis. Increased calcium levels within the sub-cellular space inhibit
further resorption whilst substances released from the bone matrix during resorption
initiate osteoclast deactivation.
As with resorption, bone deposition is the end point of a complex cascade of events
involving proliferation of primitive mesenchymal cells, formation of preosteoblasts,
matrix formation and mineralization. Osteoblasts converge onto the base of the
resorption cavity to form osteoid. Cells are attracted towards the resorptive defect by
local factors including Transforming Growth Factor " (TGF-") and the exposed type I
collagen. Local proliferation of osteoblast precursors is influenced by TGF-"
,Insulin-Like Growth Factor (IGF) I and II, Fibroblast Growth Factor (FGF) and
Platelet Derived Growth Factor (PDGF).
Differentiation of cells into mature osteoid-producing cells is mediated by IGF-I and
BMP-2. Osteoid begins to mineralise 13 days later at a rate of approximately 1µm
per day (Ericksen et al., 1986). Bone formation continues until the cavity is filled,
over 120-180 days.
Page 29
Chapter 1 Introduction and Background
8
1.2.3 Theory of tooth movement.
The first theory was described by Burstone (1962) who suggested that there were 3
phases of tooth movement: an initial phase, a lag phase, and a post lag phase.
In the initial phase there is rapid movement after the application of force largely
attributable to displacement of the tooth in its socket. After the initial phase, there is a
lag period due to hyalinization in areas of compression. No further tooth movement
occurs until cells complete the removal of necrotic tissue. The third phase of tooth
movement follows the lag period, during which the rate of movement gradually or
suddenly increases (Burstone, 1962).
Other studies have proposed a time/ displacement model for tooth movement (Pilon et
al., 1996, Vas Leeuwen et al., 1999). These studies divided the curve representing
tooth movement into 4 phases. The first phase lasts 24 hours to 2 days and represents
initial movement of the tooth inside its bony socket (Burstone’s initial phase). This is
followed by a second phase, when tooth movement stops for 20-30 days (Burstone’s
lag phase). After removal of necrotic tissue tooth movement is accelerated in the third
phase (Burstone’s post lag phase) and continues into the fourth phase.
Neither hypothesis provides conclusive evidence to explain the detailed nature of the
biological mechanism of tooth movement. Other studies in the 20th
century and the
early 21st century demonstrated that many cellular and tissue reactions start in the
initial phase of tooth movement, immediately after force application. Because of the
compression and stretch of fibres and cells in the PDL, the complex process of
recruitment of osteoclast and osteoblast progenitors, as well as extravasation and
Page 30
Chapter 1 Introduction and Background
9
chemoattraction of inflammatory cells begins. Blood flow disruption due to distortion
of the PDL fibres leads to the development of hyalinized areas and the arrest of tooth
movement, which can last 4-20 days. Only removal of necrotic tissue and bone
resorption from adjacent marrow spaces (indirect resorption) and from the direction of
the viable PDL (undermining resorption) allow the resumption of tooth movement.
This comprehensive process requires the recruitment of phagocytic cells such as
macrophages, foreign body giant cells, and osteoclasts from adjacent undamaged
areas of the PDL and alveolar bone marrow cavities. These cells remove necrotic
tissues from compressed PDL sites and adjacent alveolar bone. In areas of PDL
tension, quiescent osteoblasts are enlarged and start producing new osteoid.
Osteoblast progenitors are recruited from the population of fibroblast-like cells
(pericytes) around PDL capillaries, which proliferate and migrate toward the alveolar
bone surface, along the stretched Sharpey’s fibers. Simultaneously, PDL fibroblasts in
tension zones begin multiplying and remodelling their surrounding matrix.
The third and fourth phases of orthodontic tooth movement, also known as the
acceleration and linear phases, respectively, start about 40 days after initial force
application. The pressure sides of teeth exhibit collagen fibres without proper
orientation. Here, irregular bone surfaces are found, indicating direct or frontal
resorption.
The development and removal of necrotic tissue is a continuous process during tooth
displacement, rather than a single event (von Böhl et al.,2004 a and b). This
conclusion is supported by one of Melsen’s hypotheses that “indirect bone resorption
at the pressure side is not a reaction to force but an attempt to remove ischemic bone
Page 31
Chapter 1 Introduction and Background
10
lying adjacent to the hyalinised tissue. The subsequent direct bone resorption could be
considered part of the remodelling process.”The tension sides in the third and fourth
phases clearly show bone deposition, as evidenced by alkaline phosphatase positive
osteoblastic cells” (Melsen, 1999).
Teeth subjected to high forces show hyalinization more often than teeth experiencing
light forces. Thus, development of hyalinization zones has a definite relationship to
the force magnitude, but it was found to have no relationship to the rate of tooth
movement. Once tooth movement has started after the second (arrest) phase, bone
remodelling takes place at a certain rate, independent of force magnitude (Von Bohl
et al., 2004). These findings agree with those of Owman-Moll et al. (1996) and Van
Leeuwen et al. (1999), who also reported the location of hyalinization was found
mostly buccal or lingual to the mesio-distal plane. Studies have also shown that a lag
period exists between an abrupt change in mechanical loading and the attainment of
maximal response (Jaworski et al., 1980).
Page 32
Chapter 1 Introduction and Background
11
1.2.4 Remodelling of the periodontal ligament
1.2.4.1 Areas of compression
Compression of the periodontium produces narrowing of the periodontal ligament and
vascular restriction. This can lead to ischaemia, necrosis and vessel degeneration. A
high enough force can lead to hyalinisation or sterile necrosis. However if the
periodontal ligament can be maintained despite the reduction in blood supply, cellular
activity increases with differentiation of monocytes into fibroblasts and osteoclasts.
These two cell types are responsible for remodelling of the soft and hard tissues. The
breakdown products of tissue turnover may be detected in GCF (Last et al., 1988).
Areas of hyalinisation are devoid of blood supply, so that the host is unable to recruit
a cellular inflammatory response and resorption cannot occur. However, orthodontic
force is distributed unevenly within the periodontal ligament, there are adjacent areas
of normal periodontium and these areas contribute to remodelling of the hyalinised
areas as osteocytes and vascular elements penetrate hyalinised tissue, whilst the
alveolar bone in this area is removed by underlying resorption. (Rygh et al., 1973).
Removal of bone from areas of compression is not a simple or continuous process.
Following application of orthodontic force, small bony changes occur within the first
three days, followed by a wave of resorption lasting one week, which is then followed
by bony deposition (King et al., 1992). Bone remodelling can continue for some time
even after the orthodontic force has been removed (King et al., 1992). In order to
investigate host response to orthodontic force, a period of time should separate force
application and assessment of the response to that force.
Page 33
Chapter 1 Introduction and Background
12
Osteoclasts within the resorptive area arise from two sources, some are derived
locally and arrive within hours of the initiation of orthodontic force (Reitan, 1951),
some arrive two days later and arise from the haematogenous cell population (Roberts
and Ferguson, 1989). Although osteoclasts are the primary resorptive cells,
osteoblasts possess receptors for the chemical signal of resorption namely;
parathyroid hormone, eicosanoids (e.g. Prostaglandin E2) and various cytokines
(Meghji, 1992).
Bone resorption is undertaken by organic acids, lysosomal enzymes, matrix
metalloproteinases (MMPs) and serine proteases (Keeling et al., 1993). Thus the
inorganic components are dissolved and the organic matrix digested in a process
called frontal resorption.
Page 34
Chapter 1 Introduction and Background
13
1.2.4.2 Areas of tension
Fibres of the periodontal ligament stretch in areas of tension. This is associated with
vascular dilatation and an increase in local vascular activity (Rygh et al., 1986). In
areas under tension the volume of collagen reduces in the first three days whilst
vascularisation increases (Crumley, 1964). Mechanical stress leads to the production
of collagenase enzymes (MMPs) produced by macrophages and fibroblasts (Sandy,
1992). Collagen fibres within the periodontal ligament exist in coiled forms. When
tooth movement exceeds the intrinsic fibre length, new fibres must be synthesised and
incorporated into the ligament proper.
Osteoblasts are generated from progenitor cells locally within the periodontium
(Roberts and Chase, 1981). Following vascular dilatation, an area of intense
increased vascular activity develops. Osteoblasts form sheets of densely packed cells
on the bone surface and secrete the extracellular organic matrix of bone; components
include type I collagen, osteocalcin, osteoponin and osteonectins. Cytokines,
proteoglycans and growth regulating factors are also released. Osteoid deposition
begins some two days following the application of orthodontic force and shortly
afterwards mineralisation occurs within the deeper osteoid layers, although the
surface layers remain un-calcified (Rygh et al., 1986).
Page 35
Chapter 1 Introduction and Background
14
1.2.5 Control of orthodontic tooth movement
There is still much to be discovered about the biological basis of orthodontics. Four
theories have been proposed:
o The biomechanical theory
o The pressure/tension theory
o The piezoelectric theory
o The hydrodynamic theory
The hydrodynamic theory will not be discussed in this thesis.
1.2.5.1 Biomechanical theory
The biomechanical theory is based on mechanical distortion of cell membranes and
resultant activation of phospholipase A2 (Sandy et al., 1993). Phospholipase A2
initiates arachidonic acid metabolism, which in turn activates the lipoxygenase
pathway (leukotrienes and HETE) and the cyclo-oxygenase pathway (prostoglandins).
There is clinical evidence that both leukotrienes and prostoglandins are linked to tooth
movement (Yamasaki et al., 1989; Mohammed et al., 1989). Prostaglandins feedback
to G protein coupled receptors and stimulate second messenger cascades, resulting in
a cellular response that causes bone removal at compression sites and deposition at
tension sites.
Page 36
Chapter 1 Introduction and Background
15
1.2.5.2 Pressure-tension theory
The pressure-tension theory relates changes in periodontal ligament blood flow,
following the application of pressure, to the release of chemical messengers that effect
cellular responses. Tension and compression within the periodontal ligament result in
a gradual relocation of periodontal tissue fluids. Blood flow is reduced in areas of
compression, but maintained or increased in areas of tension. Changes in blood flow
may be in the order of 50 percent, with vascular endothelial junctions being important
pathways for fluid transport (Tang et al., 1993). Reduction in blood flow lowers
oxygen tension and a mild inflammatory reaction develops (Tuncay et al., 1994).
Recruitment of different cell types produces a local environment rich in biologically
active substances, further modulated by systemic factors; parathyroid hormone,
calcitonin and vitamin D, that can also influence the production of cytokines and
prostaglandins (Dewhurst et al., 1987).
Fibroblasts within the periodontal ligament are involved in collagen turnover and
mediate biochemical transfer of the mechanical force applied orthodontically to the
teeth and to the surrounding tissues, including the alveolus. Biochemical signals
involved in this process include prostaglandins, neurotransmitters, cytokines and
interleukins (Ten Cate et al., 1976). Intracellular events including the elevation of
intracellular calcium follow the direct stimulation of isolated fibroblasts by hydraulic
pressure (Nakago-Matsuo et al., 1996). Raised levels of intracellular calcium cause
cellular responses, including proliferation, differentiation and the secretion of
additional biological signals (Berridge, 1993).
Page 37
Chapter 1 Introduction and Background
16
1.2.5.3 Piezo-electric theory
Piezoelectric theory relates the generation of electrical charge following the distortion
of bone matrix. Applied stress results in a reorientation of matrix proteoglycans
which induce changes in cell membrane polarity and activation of membrane enzymes
(Grimm, 1972). This leads to cell-membrane interactions and the opening or closing
of stress-related ion channels (Davidovich, 1991). McDonald and Yettram (1995)
examined the effects of mechanically loading bone on the ionic distribution in
osteocytes. They found that when an external force was applied to osteocytes there
was a change in the sodium ion and a great change in potassium ion distribution
within the cells , but no change in chloride ions. A similarity between the pattern of
distribution of strain energy density and the ions within the osteocytes was also seen.
Areas of compression become electronegatively charged whilst areas of tension
become electropositively charged. The end result is that bone is resorbed and
deposited simultaneously, the turnover equilibrium being shifted to favour one or the
other at different times. For remodelling to occur the strain level should exceed a
value of 0.02N (Frost, 1983). Finite element analysis has shown that this level can be
exceeded in the periodontal ligament (Middleton et al., 1996). The periodontal
ligament appears to experience higher strains than adjacent bone and dentine.
Middleton et al. (1996) suggested that bone may not experience sufficient strain to
begin remodelling during normal orthodontic loading.
Page 38
Chapter 1 Introduction and Background
17
1.2.6 Effect of orthodontic forces on the periodontum
1.2.6.1 The gingival tissues
The perceived benefits resulting from orthodontic treatment must be weighed against
the potential harm, including the development of plaque-induced gingivitis and
gingival hyperplasia. These conditions may be reversible alter appliance removal and
appropriate oral hygiene measures (Zachrisson and Zachrisson, 1972) or they may
require surgical intervention.
Pseudopocketing of the periodontium may arise because of an increase in gingival
margin height relative to the cemento-enamel junction (CEJ). It is therefore
reversible, maximum reduction in pocket depth occurring within one month following
appliance removal and institution of oral hygiene methods. Further reductions
continue for up to four months post treatment. There is no significant difference in
pocket depth between test and control teeth after two years in healthy adolescent
patients (Zachrison and Alnaes, 1973). Therefore, orthodontic treatment does not
seem to have any permanently damaging effects upon the gingival tissues in healthy
adolescent patients.
1.2.6.2 Connective tissue attachments
There is individual variation in the attachment losses experienced by different
subjects. Boyd et al. (1989) found no clinically significant attachment losses in
adolescents and adults following orthodontic treatment, if normal periodontal tissues
were present before and throughout treatment (Boyd et al., 1989). However,
Zachrisson and Alnaes (1973) found a statistically significant difference in mean
Page 39
Chapter 1 Introduction and Background
18
attachment loss between an orthodontically treated group (0.41mm) and an untreated
control group (0.11mm) with certain individuals losing 2mm of attachment at some
sites (Zachrisson and Alnaes 1973). Similarly Hamp et al. (1982) found a 0.28mm
bone loss around bonded teeth during treatment compared to 0.22mm in the control
group over the same period. Several explanations may account for the
control/treatment group variation in these studies. It is difficult to evaluate
attachment loss with accuracy as a result of differing methodologies, oral hygiene
levels, tissue inflammation, probing force, probing angle, probe design, appliance
types, differing gingival-bracket distances, position of the probe around the gingival
margin, and visibility of the probe’s scale to the operator.
The amount of force used during tooth movement is thought to influence loss of
alveolar bone during orthodontic treatment (Reitan 1974). In the absence of plaque
and with orthodontic forces at physiological levels, bone loss should not occur as a
result of orthodontic movement (Eliasson et al., 1982).
It is incorrect to assume that “physiological” force levels are those that would not
produce a pathological reaction in all cases, since the threshold values for bone
remodelling vary between individuals. As the pathological reaction of greatest
concern is root resorption one does not know if this sequel is present unless
radiographs are taken and it may be that the incidence of root resorption is higher than
that reported. Other influences on crestal bone include closure of extraction sites and
the effects of calculus and plaque when they are moved from a supragingival
environment following tooth up righting (Zachrisson and Zachrisson, 1972).
Page 40
Chapter 1 Introduction and Background
19
Patient age during orthodontic treatment also influences the potential risk of alveolar
bone loss. Adults may experience greater amounts of bone loss than adolescents,
since the experience of periodontal disease is higher in this group (Reitan, 1954; Van
Der Velden, 1984). Also, it is rare to find significant alveolar bone loss in the early
teenage years. Zacharrisson and Alnaes (1974) looked at 51 adolescents with a Class
II division I malocclusion treated following extraction of upper first premolars and
compared them to an untreated group. Standardised radiographs demonstrated a CEJ
to alveolar crest distance of 1.1mm in the treatment group compared with 0.88mm in
the control, so that orthodontic treatment was associated with 0.22mm additional bone
loss (Zachrisson and Alnaes, 1974).
Orthodontic treatment at that time (1970s) involved the use of bands cemented to the
teeth to carry the bracket into which the orthodontic wires were fitted. Often such
bands could only be placed subgingivally in order to obtain a correct position of the
bracket on the tooth and this may have produced bone loss. Modern appliances use
the acid etch technique to attach brackets to the tooth, brackets are much smaller than
bands and subgingival positioning is thus far less common. Also brackets are usually
placed only on the buccal surfaces of the teeth.
Page 41
Chapter 1 Introduction and Background
20
1.2.6.3 Periodontal health monitoring in the orthodontic patient
Gingival and periodontal diseases are largely diagnosed by visual criteria and physical
examination of the periodontal tissues using probes of various designs. During a
periodontal examination the clinician looks for several specific indicative factors,
including;
o Tissue colour and contour
o Presence of bleeding on probing
o Extent of gingival recession
o Probing pocket depth and attachment levels
o Presence of suppuration
o Degree of tooth mobility
o Presence, position, number and size of tooth furcations
o Radiographic evidence of bone loss
These methods are largely qualitative and are dependent on the preferences and
estimations of the individual clinician, leading to possible variation in results, unless
the clinician is calibrated. Also, the assessments are subjective measures of historical
disease and are therefore difficult to use as a means of predicting the course and
severity of progressive periodontal disease. Variables involved include probe
dimensions, construction, placement and reference point, probing force, gingival
tissue condition, tooth alignment and shape, and the presence of subgingival deposits.
In order to evaluate progressive inflammatory disease a series of clinical indices were
developed during the 1960s and 1970s based upon evidence of tissue damage.
Despite short comings, these indices remain in widespread use and provide a simple
Page 42
Chapter 1 Introduction and Background
21
means for determining and recording the progression of periodontal diseases over a
period.
1.2.6.3.1 BPE - Basic Periodontal Examination
The Basic Periodontal Examination is a screening assessment to identify the presence
or absence of periodontitis, it requires that the periodontal tissue should be examined
with a standardised periodontal probe using light pressure to test for bleeding, plaque
retention and pocket depth. The dental arches are divided into sextants and the worst
score per sextant is recorded using a hierarchical index.
1.2.6.3.2 Plaque levels
The plaque index is a clinical measure of the quantity of plaque at a specific tooth
site. Variations include the Plaque index (Loe, 1967) and the Turesky modification of
the Quigley Hein index (Turesky et al., 1970). The latter is one of the most commonly
used. Orthodontic tooth movement requires appliances which are bulky and plaque
retentive and so Ciancio et al. (1985) developed a bonded bracket plaque index to take
account of this.
1.2.6.3.3 Severity of gingivitis
The gingival index is a qualitative clinical measure of inflammatory changes within
the gingival tissues (Loe, 1967).
Page 43
Chapter 1 Introduction and Background
22
1.2.6.4 Force delivery systems to generate orthodontic tooth movements
Three variables affect the biological response to orthodontic force: force magnitude;
duration; and means of application.
1.2.6.4.1 Force magnitude
Light forces have been recommended for efficient and less painful tooth movement
(Hixon et al., 1969). However the rate of tooth movement bears little relation to force
magnitude (Andreason and Zwanziger, 1980). It can therefore be suggested that the
importance of light forces lies not in the production of an optimal rate of tooth
movement, but in limiting the undesirable side effects of heavy forces which increase
the risk of radicular damage, however the forces that produce these side effects vary
amongst individuals making it difficult to discern what a heavy force is (Owan-Moll
et al., 1996). Optimal forces for given tooth movements are listed in Table 1.1. The
surface area within the periodontium changes along the length of the tooth as teeth
taper apically, therefore the forces required for intrusive movements are very low.
Page 44
Chapter 1 Introduction and Background
23
Table 1. 1 Ideal force levels to achieve different types of tooth movement (taken
from Laura Mitchell. An Introduction to Orthodontics. 2nd Edition. Oxford. 2001)
Type of movement Force required (g)
Tipping 30-60g
Bodily movement 100-150g
Rotation 50-75g
Extrusion 50-75g
Intrusion 15-25g
Page 45
Chapter 1 Introduction and Background
24
1.2.6.4.2 Force duration
A light, continuous force is the most efficient for producing tooth movement and
heavy, continuous forces should be avoided. Interaction between force magnitude
and the duration is complex since the applied force components can be subject to
rapid force decay with time, especially those made from elastic polymers. Nickel-
Titanium (NiTi) wires used in the initial phases of treatment do not obey Hooks Law
i.e. the loading/unloading curve is not a straight line.
Page 46
Chapter 1 Introduction and Background
25
1.2.6.5 Mechanisms of force application
Nickel-Titanium alloys have two properties; super-elasticity and shape memory.
These properties offer advantages during orthodontic tooth movements. Super-
elasticity is the ability to demonstrate a non-linear loading curve such that the wire
will exert the same force whether it is deflected a short or long distance. Constant
force delivery over a range of activation during use is thought to be an efficient
method of force delivery (Miura et al., 1988).
Page 47
Chapter 1 Introduction and Background
26
1.2.7 Force application measurement
The simplest method for measuring force is with the use of an intraoral Corex tension
gauge. Several studies have compared different means of force application to find the
most efficient means of space closure (Dixon et al., 2002; Nightingale and Jones,
2003). All of these studies have concluded that the NiTi coil springs produce the
most constant and effective force and this is the method of force application to be
used in the present study.
Page 48
Chapter 1 Introduction and Background
27
1.2.8 Tooth movement measurement
Assessment of the rate of orthodontic tooth movement involves measurement of
distance and time. It is difficult to determine the distance over which each tooth
moves during treatment because all teeth involved in the appliance move by varying
degrees in varying directions. Anatomical structures have been used as reference
points, for example palatal rugae, although the identification of suitable fixed
structures during appliance therapy can be problematic (Almeida et al., 1995).
Baldwin et al., (1999) used a reflex metrograph at six weekly intervals to calculate the
three dimensional tooth movements produced by NiTi archwires.
Another method of assessing tooth movement is to measure the linear displacement of
anatomical contact points using a dial calliper. During orthodontic alignment the
teeth line up so that contact point displacement reduces with time. This can be used
to indicate the rate of achievement of alignment and hence act as an indicator for rate
of tooth movement. Such a method was first developed by Little, (1975) and used as
an indicator of stability in lower incisor position following orthodontic treatment over
time.
Page 49
Chapter 1 Introduction and Background
28
1.2.9 Gingival crevicular fluid
1.2.9.1 The gingival crevice
The gingival crevice is a relatively fragile tissue barrier, which separates the internal
tissues of the body from a hostile external environment, the mouth. In health this
barrier is known as the junctional epithelium. It is non-keratinised and permeable and
so allows materials from the mouth to pass into the periodontium and vice versa.
1.2.9.2 The formation of gingival crevicular fluid (GCF)
The gingival crevice contains fluid that is derived from beneath the gingival margin.
In health this gingival crevicular fluid (GCF) is a serum transudate and therefore
contains all of the components of serum and some cellular elements, in particular
polymorphonuclear leucocytes (PMNL).
A local osmotic gradient is responsible for the movement of fluid from intravascular
to perivascular sites. During the process various substances may be incorporated into
the fluid, reflecting the biology and physiology of the surrounding tissues. In health
GCF composition reflects the physiological processes underlying normal tissue
turnover, in gingivitis and periodontitis it becomes an inflammatory exudate
developed in response to inflammatory and immunological reactions. Similarly,
during orthodontic tooth movement the composition of the fluid may alter to reflect
periodontal connective tissue turnover.
Page 50
Chapter 1 Introduction and Background
29
1.2.9.3 The composition of gingival crevicular fluid
As a result of the permeability of the junctional epithelium, even in clinical health
there exists a degree of infiltration of inflammatory cells in the periodontium. Once
disease is established the gingival connective tissue becomes a site of acute
inflammation. The cardinal signs of acute inflammation are seen clinically within the
gingival tissue, which becomes red, swollen and oedematous, a cellular PMNL
infiltration becomes evident. With time the normally thin junctional epithelium
becomes punctuated with microulcerations and may bleed easily with applied
pressure. Therefore, in gingivitis and other inflammatory diseases of the
periodontium the serum transudate becomes an inflammatory exudate. As previously
mentioned, during orthodontic treatment inflammatory reactions are also generated,
one initiated by pressure gradients within the periodontal membrane, the second
resulting from the microbial plaque challenge.
Substances that may be involved in connective tissue remodelling have been studied
by measuring their concentrations in GCF. Last et al., (1988) found an increase in
chondroitin sulphate (a type of glycosaminoglycan) on the side to which teeth were
moved orthodontically. Grieve et al., (1994) found that levels of prostaglandin E and
interleukin 1 " increased over a period of 24-48 hrs following the initiation of tooth
movement. Lactic and citric acid levels also increase during tooth movement
(Miyajima et al., 1991). Plasminogen activator and plasminogen activator inhibitor
have been studied in health, gingivitis and periodontal disease (Xiao et al., 2000).
These and other studies may enable measurements of the constituents of GCF to be
used to monitor biological events in particular during orthodontic tooth movement.
Page 51
Chapter 1 Introduction and Background
30
1.2.9.4 Collection of gingival crevicular fluid
The most commonly used sampling method uses a paper strip inserted into the
gingival crevice until mild tissue resistance is felt. It is left in position for a known
period of time whilst GCF is absorbed into it (Brill and Krass, 1958). A sampling
period of 30s has been adopted by most investigators with the use of a methyl
cellulose collecting strip. The composition of GCF varies with the amount of gingival
inflammation (Curtis et al., 1988). In order to illustrate the levels and change in
levels of collected GCF compounds the sample may be assessed using the total
amount collected over a pre-determined period. (Chapple et al., 1999)
1.2.9.5 Previous orthodontic studies using GCF
The presence/expression of regulatory proteins within GCF has been recognised as a
measure for monitoring orthodontic treatment outcome. Reports have focused on the
presence of new mediators and on regulation of the levels of these proteins.
Some studies have investigated one or two proteins only due to the limitations of the
available assays. Different time points have been selected for sampling and different
sampling methods used. Orthodontic appliances and movements vary between
studies and different test teeth have been used. This makes it difficult if not
impossible to compare studies many of which are under powered.
A meta-analysis on the role of GCF cytokines in orthodontic tooth movement has
been attempted with a view to generating a time-related pattern for the production of
GCF cytokines that may provide evidence at the cellular level. The meta-analysis
was not justified due to the heterogeneity of the reports Many studies did not
Page 52
Chapter 1 Introduction and Background
31
discriminate between sites of tension and compression or only took samples from
compression sites. (Ren and Vissink, 2008)
Page 53
Chapter 1 Introduction and Background
32
1.2.10 Inflammatory cytokines
Orthodontic tooth movement is a type of tissue injury leading to an inflammatory
response (Davidovitch, 1991). Endothelial cells are activated and cytokines and
chemoattractants that result in leukocyte activation are produced (Cooper and Sims,
1989). This interaction between endothelial cells and leukocytes is important in the
inflammatory process, as it produces pro-inflammatory cytokines (PIC) and anti-
inflammatory cytokines (AIC) (Maroszynska and Fiedor, 2000). PICs and AICs are
bioactive molecules which maintain and regulate the inflammatory process by
paracrine and autocrine signalling (Callard et al 1999). Cytokines that affect bone
metabolism, and thereby orthodontic tooth movement, include interleukin1(IL-1),
interleukin2(IL-2), interleukin 3 (IL-3), interleukin 6 (IL-6), interleukin 8 (IL-8),
tumor necrosis factor alpha (TNF!), interferon-# (IFN#), and osteoclast differentiation
factor (ODF) (Krishnan and Davidovitch, 2006). Studies in bone remodeling have
indicated that certain PICs, such as interleukins (IL-1b, -6, and -8) and tumor necrosis
factor-alpha (TNF-a), are important regulators in the bone remodeling process upon
mechanical stimulation (Ren et al., 2007). The most potent among these is IL-1,
which directly stimulates osteoclast function through the IL-1 type 1 receptor,
expressed by osteoclasts. IL-1 secretion is triggered by various stimuli, including
neurotransmitters, bacterial products, other cytokines, and mechanical forces
(Davidovitch, 1995). IL-1 has two forms coding different genes. IL-1 attracts
leukocytes and stimulates fibroblasts, endothelial cells, osteoclasts, and osteoblasts to
promote bone resorption and inhibit bone formation (Sabatini et al., 1988).
Osteoblasts are target cells for IL-1, which in turn activate osteoclasts to resorb bone
Page 54
Chapter 1 Introduction and Background
33
(Davidovitch, 1995). IL-1! is a key mediator in a variety of activities in immune and
acute-phase inflammatory responses (Dinarello, 1989).
IL-6 regulates the immune response at inflammation sites and stimulates osteoclast
formation and the bone-bioabsorbing activity of preformed osteoclasts. (Okada and
Murakami 1998; Dinarello, 1989). IL-8 regulates the influx of leukocytes at a site of
inflammation. It also is a potent neutrophil chemoattractant and activator that is
secreted by monocytes, macrophages, epithelial cells, and fibroblasts, all of which are
abundant in the periodontal environment. (Ren et al., 2007). Tuncer et al., 2005
reported increased levels of IL-8 at PDL tension sites and proposed it to be a
triggering factor for bone remodeling. TNF!, another pro-inflammatory cytokine, was
shown to elicit inflammation and stimulate bone resorption. TNF! is synthesised and
released by monocytes and macrophages by activation of leukocytes in vitro and is a
potent inducer of bone resorption (Bertolini et al., 1986). Davidovitch et al., 1988;
Satio et al., 1990; Alhashimi, 2000 and Alhashimi, 2001 have shown that TNF!
directly stimulates the differentiation of osteoclast progenitors to osteoclasts in the
presence of macrophage colony-stimulating factor (M-CSF). Davidovitch et al.,
(1988) and Saito et al., (1990) demonstrated marked increases in the staining intensity
for IL-1 and TNF! in cells of the PDL and alveolar bone during orthodontic tooth
movement.
In contrast to interferon-! and interferon-", which can be expressed by all cells,
interferon-" (IFN#) is secreted by T lymphocytes and natural killer cells only and is
the only Type II interferon. It is serologically distinct from Type I interferons and it is
acid-labile, while the Type I variants are acid-stable. IFN# has antiviral,
Page 55
Chapter 1 Introduction and Background
34
immunoregulatory, and anti-tumour properties (Schroder et al., 2004). It alters
transcription of at least 30 genes, producing a variety of physiological and cellular
responses. Activation by IFN# is achieved by its interaction with heterodimeric
interferon # receptors. IFN# suppresses osteoclast formation by rapidly degrading the
RANK adaptor protein TRAF6 in the RANK-RANKL signalling pathway, which
otherwise stimulates the activation of the transcription factor NF$B.
Page 56
Chapter 1 Introduction and Background
35
1.2.11 Tissue metabolites
Matrix metalloproteinases (MMPs) are zinc-dependent endopeptidases of the matrixin
family (Nagase, 1999). Most are secreted as inactive enzymes (pro-enzymes) which
are activated in the extracellular compartment or in the vicinity of other MMPs or
serine proteases (Nagase, 1997). The proteolytic activity of MMPs is under the
control of circulating and endogenous tissue specific inhibitors which control extent
of extracellular matrix remodelling (Starkey and Barrett, 1973).
The main substrates of the gelatinases are Type IV collagen and gelatin, The
gelatinases are MMP-2 and MMP-9. MMP-2, MMP-9 and TIMPs-1 and 2 are thought
to be important in bone metabolism (Birkedal-Hansen et al., 1993).
Page 57
Chapter 1 Introduction and Background
36
1.2.12 Bone metabolites
RANKL (Receptor Activator for Nuclear Factor $ B Ligand) and OPG
(osteoprotegenrin) are members of the TNF super family and regulate bone resorption
(Lerner 2004). RANKL is membrane bound and can be found on osteoblasts,
fibroblasts and activated T and B cells. Its osteoclastogenic action is blocked by the
soluble decoy receptor OPG, whose expression is tightly regulated by systemic and
local stimuli. RANKL is a principle osteoclast activator, produced by osteoblasts.
Nulizygous mutant mice with deletion of the RANKL gene have been found to be
osteopetrotic as there is no osteoclast activity due to the absence of an osteoblast
signal. When RANKL protein was injected into these mice the ostopetrosis reversed.
RANKL has also been shown to be important for the differentiation of osteoclasts
from their monocytic precursors. RANKL increases and OPG levels decrease in GCF
samples during orthodontic tooth movement (Mogi et al., 2004).
Page 58
!
!
"#$%&'()#$!
!!!"#$%&*()#$!
!!!!!+,!
-&(().%/!
!!!01&$%)#%#!
234567!
3-468346"9!
:+;!6<=;!6<>!
!!!!6:?!
"#$%&')('@/!
-)('@AB!
+CD1&ECF1&(@/%!
!!!!539G!
!!!
539G<!
:2H-I?;!6<=;!6<>;!6<==!
49?;!4:?*%$)J!
!!!"0:!
"#$%&')('@/!
4620#!
!
!
!!!!!!!!!!!!!!!!!K"9L!5LI"5046"9!!!!!!!!!!!!!!!!!!!!!!!!!!!!!!!!!!!!!!!!!!!!!!!!!!!!!!!!!!!!!!!!!!!!!!!!!!!!!K"9L!?"52346"9!
4:?*%$)!
220#!
K&/%!5%B&D%((@/.!
Figure 1.1 The bone remodelling cycle and metabolite interactions (adapted from a diagram at www.endotext.org)
!
Page 59
Chapter 1 Introduction and Background
38
1.3 Aims of the study
The aim of the present study is to investigate the effects of orthodontic tooth
movement on the periodontium by analysing cytokine, protease and protease-inhibitor
protein levels within GCF. Arrays will be employed to profile several biomarkers
simultaneously within GCF and to correlate changes in protein profiles with differing
applied forces and also between zones of tension and compression.
The objective of the proposed study is to improve our understanding of tissue changes
induced by orthodontic forces, with view to a better understanding of differing rates
of tooth movement and adverse events.
Page 60
Chapter 1 Introduction and Background
39
1.4 Hypotheses
The null hypotheses were that when an orthodontic force was applied to a tooth;
1) There is no change in the biomarker profile in GCF.
2) There is no difference in the GCF biomarker profiles at the compression and
tension sites.
3) There are no correlations between the various cytokines tested and the rate of tooth
movement.
Page 61
Chapter 2 Materials and Methods
40
Chapter 2
Materials & Methods
Page 62
Chapter 2 Materials and Methods
41
2.1 Materials
Orthodontic materials:
MBT prescription brackets (3M Unitek)
0.014 Nikel Titanium Archwires
0.018 Nikel Titanium Archwires
0.018 Stainless Steel Archwires
9mm NiTi closing coil springs
Intra oral tension guage ( Correx)
Long ligatures
Elastomeric modules (TP orthodontics)
Alginate impression material
Impression trays
Periodontal materials:
WHO probe
Periopaper Strips TM
Periotron 8000 TM
Page 63
Chapter 2 Materials and Methods
42
Laboratory materials:
MMP-9 and TIMPs (1, 2, 3 & 4) were measured using Fluorokine MAP kits from
R&D systems (Abingdon, UK).
RANKL and OPG were measured using LINCOplex kits from Millipore (Watford,
UK).
Cytokines (GM-CSF, IFN!, IL-1", IL-2, IL-4, IL-5, IL-6, IL-8, IL-10 and TNF#)
were measured using the Cytokine 10-plex kit from Invitrogen (Paisley, UK).
Page 64
Chapter 2 Materials and Methods
43
2.2 Methods
2.2.1. Ethical approval
Prior to the commencement of the study ethical approval was obtained from the
Coventry Research Ethics Committee (Reference number 08/H1210/72). Potential
subjects and parents were given all the relevant information both verbally and in
writing at their first attendance to the orthodontic clinic. They were then given at
least a week to review and digest the information before being consented to join the
study. Information and consent forms are shown in Appendix A1.
2.2.2 Patient recruitment
This is a pilot study. Due to the size and nature of this study and lack of previous data
we could not calculate a sample size. However, studies of individual biomarkers
demonstrate significant changes detected with time during periodontal disease activity
on 10-20 volunteers, where change is measured longitudinally within the same
subjects at a power of >0.08 (P<0.05) (Brock et al., 2004, Wright et al.,2003). Thus
we aimed to recruit a minimum of 20 subjects and planned to do a post hoc sample
size calculation to aid future research.
21 consecutive subjects were invited to take part in the study as they attended the
Birmingham Dental Hospital to begin a course of orthodontic treatment. Inclusion
and exclusion criteria are shown in Table 2.1.
Page 65
Chapter 2 Materials and Methods
44
Table 2.1 Inclusion and exclusion criteria
Inclusion Criteria Exclusion Criteria
Aged 12-20 years Smokers
Good systemic health Have a full mouth plaque and bleeding
score of >20%
Competent Probing depth values >4mm
About to undergo a course of orthodontic
therapy with fixed appliances
Radiographic evidence of periodontal
bone loss
Requires removal of both upper first
premolar teeth
Courses of anti-inflammatory or
antimicrobial treatments taken within 1
month prior to study
Has upper canine teeth fully erupted
within the oral cavity
Page 66
Chapter 2 Materials and Methods
45
2.2.3 Treatment
A detailed periodontal examination was carried out, to record plaque index, bleeding
on probing and bleeding index. Gingival crevicular fluid (GCF) samples were taken
from the test teeth (the maxillary canine teeth) and upper arch impressions were
taken. During the next few weeks the maxillary first premolar teeth were extracted
and one week was allowed for gingival healing before attachment of the straightwire
appliance. All subjects had the same bracket system (MBT prescription), elastomeric
modules (TP orthodontics) and archwire sequence. After three months into appliance
treatment and after tooth extraction, having followed a normal archwire progression
(0.014 Nikel Titanium!0.018 Nikel Titanium !0.018 Stainless Steel). Archwire
changes were made at 6 weeks and 10 weeks, the 0.018 Stainless Steel archwire being
placed at 10 weeks. 4 weeks later the distalising force was applied to the test tooth.
This delay was to ensure that the teeth had aligned onto the archwire before the
distalising force was applied to move the canine tooth so that the biomarker changes
detected were due to mesiodistal and not buccopalatal tooth movement. 4 weeks after
the stainless steel archwire was placed, another detailed periodontal examination,
upper arch impression and GCF collection was undertaken, (Test point T1). After
samples were taken at T1 a 9mm NiTi closing coil spring was placed between hooks
on the brackets of the upper canine and the first molar with the aid of a ligature. The
ligature was tightened to produce a force of 100g according to the intra-oral tension
guage. At T2, T3 and T4 detailed periodontal examinations, upper arch impressions,
GCF collections and force adjustments were carried out (Figure 2.2).
Page 67
Chapter 2 Materials and Methods
46
Figure 2.1 A straightwire appliance with upper and lower Stainless Steel
archwires.
Page 68
Chapter 2 Materials and Methods
47
Figure 2.2 Summary of periodontal assessement and sample collection along the
course of the study.
Page 69
Chapter 2 Materials and Methods
48
2.2.4 Gingival Crevicular fluid
2.2.4.1 Calibration of Periotron 8000TM
.
The Periotron 8000 was calibrated by adding 35 known fluid volumes to periopaper
strips, using Hamilton positive pressure syringes. The numerical readings given by
the Periotron per volume were recorded. Each volume was tested thrice to minimise
error and the Periotron was cleaned and dried between samples (Appendix B.1).
The mean value per volume was calculated and a calibration curve plotted. A fourth
polynomial regression equation was formulated, from the mean values, and this
formula was used to create a reference table that related volumes to the numerical
readings shown on the Periotron 8000 (Chapple et al., 1999a) (Appendix B.2).
2.2.4.2 Collection of GCF
Prior to sample collection the test area was isolated with cotton-wool rolls and the
teeth were air dried using a triple air syringe to remove saliva. The air was blown in a
downwards direction to avoid drying the gingival crevice. GCF samples were
collected using Periopaper strips TM
placed into the gingival crevice for 30 seconds
until mild tissue resistance was felt (Brock et al., 2004). A Periopaper strip was then
placed into the jaws of the calibrated Periotron 8000 to be read. Figure 2.3 shows
the insertion of a Periostrip into a distobuccal position. In each subject and at each
study time point individual Periopaper strips were placed into the gingival crevice at
the mesiobucal and distopalatal aspects of both maxillary canine teeth. Samples were
Page 70
Chapter 2 Materials and Methods
49
then combined separately for compression and tension sites. Each pair of strips were
eluted into sterile PBS (200 µl) and stored under liquid nitrogen until assay.
Mesiobuccal and distopalatal sampling sites were chosen to represent tension and
compression. Because these are diametrically opposite, the risk of drawing GCF
round the crevice from one site to the next is minimised.
Page 71
Chapter 2 Materials and Methods
50
Figure 2.3 Periostrip in a distobuccal position relative to the upper left central
incisor.
Page 72
Chapter 2 Materials and Methods
51
2.2.5 Measurement of periodontal indicies
2.2.5.1 BPE (Basic Periodontal Examination)
Probing depth was measured as part of the BPE screen using a WHO ( World Health
Organisation) E-type probe. The gingival crevice surrounding each tooth was probed
for bleeding, plaque retention and pocket depth. The following scores were applied:
0 No bleeding or pocketing or plaque retention detected
1 Bleeding on probing - no pocketing > 3.5mm and no plaque retention
2 Plaque retention present - no pocketing > 3.5mm
3 Pockets > 3.5mm but <5.5mm in depth
4 Pockets > 5.5 mm in depth
The dental arches were then split into sextants and the worse score per sextant was
recorded as a general measure of periodontal health.
Page 73
Chapter 2 Materials and Methods
52
2.2.5.2 Bleeding index
Full mouth bleeding indices were performed at each visit as a measure of
inflammation. The WHO E type probe was placed into the gingival margin of each
tooth in turn and run around its circumference. Each tooth was then split into mesial,
distal, buccal and palatal sites for recording purposes.
A score of 1 was given per site if bleeding was present and a score of 0 if it was
absent. All scores were added to give the total number of sites expressed as a
percentage.
Number of sites scoring 1 x 100 = Percentage of the mouth with bleeding sites.
Total number of Sites
2.2.5.3 Plaque levels
Full mouth plaque indices were obtained at each visit. A disclosing dye was applied
to the teeth, the subject was then asked to rinse the mouth to remove excess dye.
A score of 1 was given per site if plaque was evident and 0 if it was not. Scores were
added and the total number of sites calculated as a percentage.
Number of sites scoring 1 X 100 = Percentage of sites with plaque
Total number of sites
A separate more detailed plaque score was then calculated for each of the upper
canines using the Tureskey modification of the Quigley Hein index:
Page 74
Chapter 2 Materials and Methods
53
Code 0= No plaque at the site examined following disclosure.
Code 1= A fine broken line of plaque present at the gingival margin of the
examination site.
Code 2= A fine unbroken line of plaque present at the gingival margin of the
examination site.
Code 3= Plaque covering up to a third of the crown from the gingival margin.
Code 4= Plaque covering up to two thirds of the crown from the gingival margin.
Code 5= Total tooth coverage.
This was recorded for the same four sites on these teeth (mesial, distal, buccal,
palatal).
2.2.6 Impression taking
Alginate impressions of the upper arch were taken at all sampling stages in order to
monitor tooth movement. The impression was then disinfected and moved into the
laboratory for model casting.
Page 75
Chapter 2 Materials and Methods
54
2.2.7 Force application
Three months into the fixed orthodontic treatment, at T1, the 9mm NiTi coil springs
were placed with the aid of a ligature, between the hook on the canine bracket and the
hook on the first permanent molar attachment. The 9mm NiTi closing coils were then
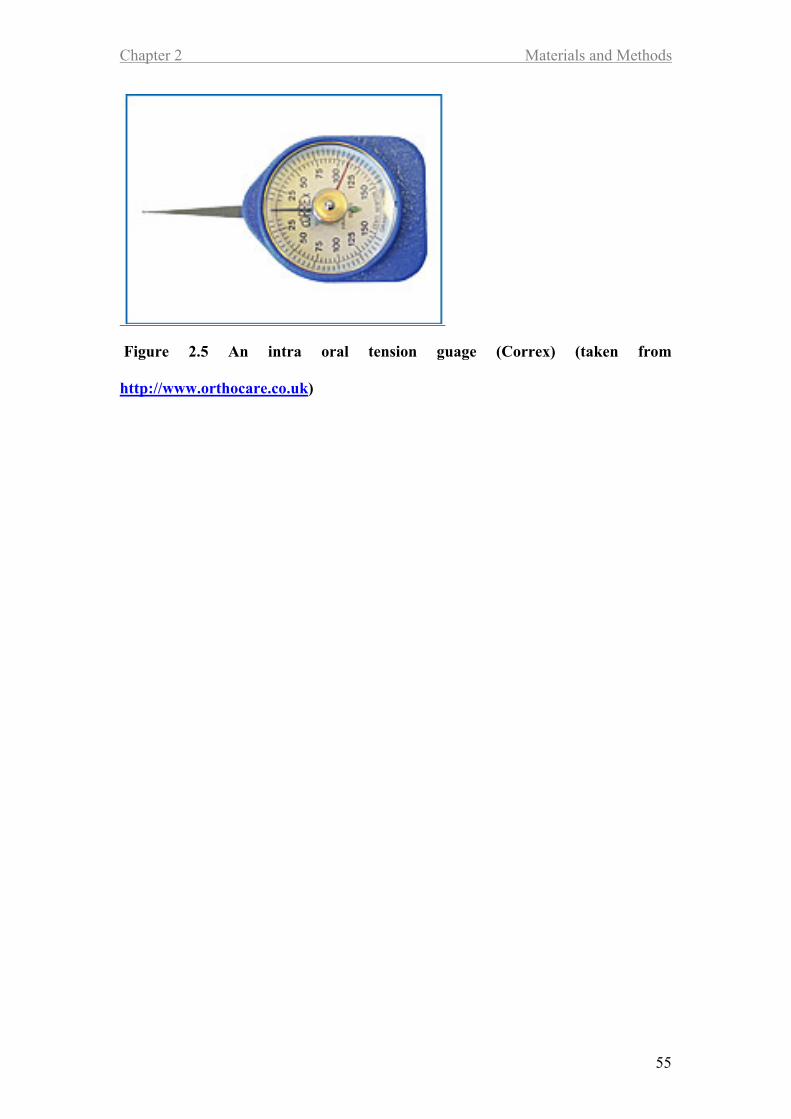
stretched, with the aid of the ligature and an intra oral tension guage (Correx) was
used to ensure that 100g of force was being applied. At the following appointment
the force was checked if necessary the ligature was tightened until the force returned
to 100g.
Figure 2.4 A 9mm NiTi closing coil spring stretched on a ligature between the
upper canine and upper first molar ( taken from http://www.orthocare.co.uk)
Page 76
Chapter 2 Materials and Methods
55
Figure 2.5 An intra oral tension guage (Correx) (taken from
http://www.orthocare.co.uk)
Page 77
Chapter 2 Materials and Methods
56
2.2.8 Multiplex assay
After collection, the GCF samples, were thawed on ice and aliquoted (50ul), so that
repeated freeze-thaw cycles could be minimised. Biomarkers were detected using
Luminex multi-analyte technology. Samples were defrosted and volumes of fluid
extract were used for each assay (Table 2.2). Samples were incubated with antibodies
immobilized on colour-coded microparticles, to detect molecules of interest, washed
to remove unbound material and then incubated with biotinylated antibodies also to
the molecules of interest. After further washing a streptavidin-phycoerythrin
conjugate was added before a final washing to bind to the biotinylated antibodies.
Figure 2.6 shows the capture of an analyte and the detection of that analyte by the
recognition of the bead and the quantitation of the fluorescent phycoerythrin signal by
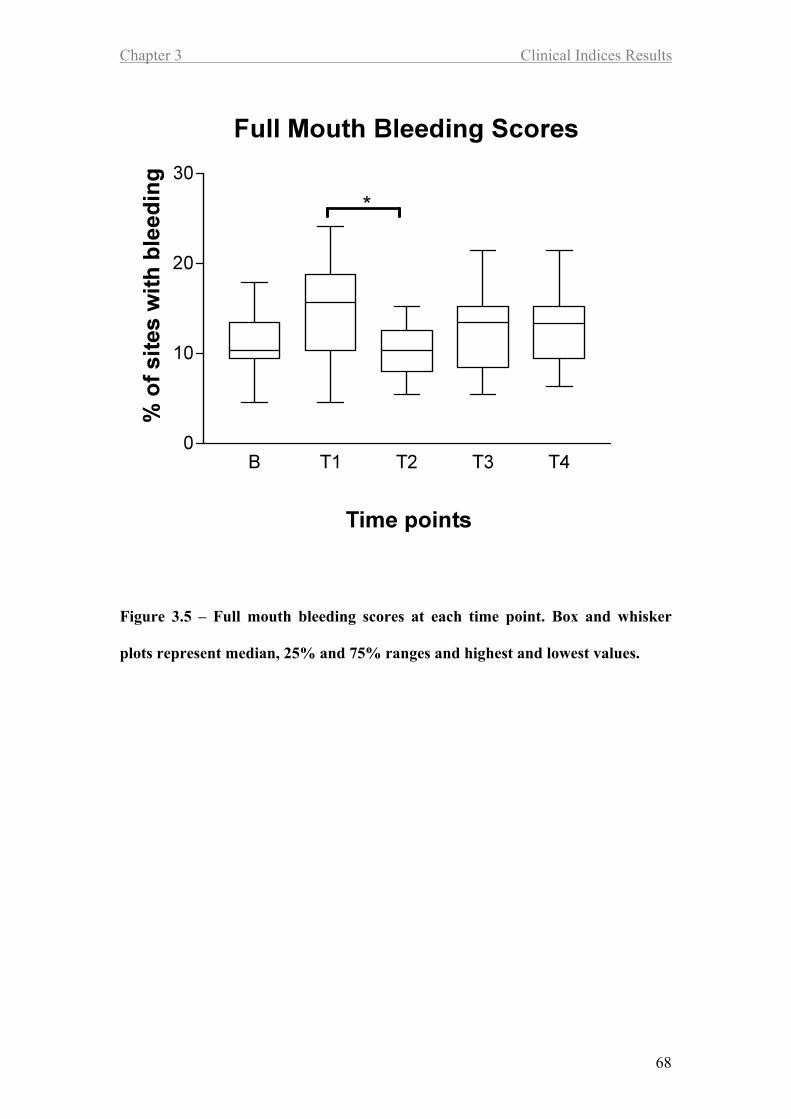
two lasers. The Luminex analyzer determines the magnitude of phycoerythrin
derived signal in a microparticle-specific manner.
Page 78
Chapter 2 Materials and Methods
57
Table 2.2 Volumes of GCF used in multiplex assays
Analytes Volume of
extract
Kit Manufacturer
TIMPs (1, 2, 3 & 4) 1"l R&D
MMP-9 1"l R&D
OPG 25"l Millipore
RANKL 25"l Millipore
Cytokines (GM-CSF, IL-1", IL-2, IL-4, IL-5,
IL-6, IL-8, IL-10, IFN !, TNF#)
50"l Invitrogen
Figure 2.6 Principle of Luminex assay (taken from University of Pittsburg
Cancer Institute website http://www.upci.upmc.edu/luminex/sources.cfm)
Page 79
Chapter 2 Materials and Methods
58
2.2.9 Statistics
Differences in individual GCF analytes across the course of the study were analyzed
by non-parametric statistics (Kruskal-Wallis with Dunn’s post test).
Page 80
Chapter 3 Clinical Indices Results
59
Chapter 3
Results
Clinical Indices
Page 81
Chapter 3 Clinical Indices Results
60
3.1 Introduction
When looking for changes in GCF it is important to record bleeding and plaque
indices at all time points to know if the changes were due to alterations in GCF
constituents following tooth movement and not due to confounding factors such as
poor oral hygiene (indicated by high plaque and bleeding scores). Changes in GCF
volumes were recorded in order to calculate biomarker levels as “total amount” per 30
second sample time as well as concentration.
This chapter presents clinical measurements taken at each time point to establish the
status of the periodontal tissues during orthodontic treatment. Values include GCF
volume, plaque index, gingival index and tooth movement.
3.2 Tooth movement
The distance between contact points on the upper canines and the second premolars
was measured from study models. Measurements were repeated three months after
the start. The percentage coefficient of variation for these measurements was low,
showing high levels of intra-examiner agreement (CV % mean 0.17 range -6.45 to
8.54).
Averages of the two measurements were used for data analysis. The averages for left
and right at each time point were combined and divided to give an average value of
tooth movement of the upper canines (Figure 3.1A). There were significant changes
(p<0.001) in tooth movement between T1 (before distalising force was applied) and
Page 82
Chapter 3 Clinical Indices Results
61
T4 (distalising force active for six weeks), and between time points T2 (distalising
force active for four hours) and T4 (Figure 3.1A). A general trend can also be seen
for space decreasing steadily from T2 to T3 to T4.
The speed of tooth movement was calculated by dividing the distance moved by the
time taken (Figure 3.1B).
Page 83
Chapter 3 Clinical Indices Results
62
Figure 3.1A&B – Clinical measurements of tooth movement, from maxillary
canines and the speed of tooth movement between the different time points(mean
+/- sem). Statistical analysis by Kruskal-Wallis: *p<0.05; **p<0.01; ***p<0.001.
A
B
1B
Page 84
Chapter 3 Clinical Indices Results
63
On the basis of the tooth movement results the subjects were divided into three even
groups; those whose teeth moved fastest, those with medium movement and those
with slow movement, so that other measurements might be stratified for speed of
movement (Figure 3.2).
Figure 3.2 – Overall tooth movement, of maxillary canines (T4-T1) Dotted lines
represent tertile divisions into the three tooth movement speed groups (slow,
medium and fast movers) and parallel solid line represents the median.
Page 85
Chapter 3 Clinical Indices Results
64
3.3 Plaque index
There were no significant differences in full mouth plaque scores between any of the
time points (Figure 3.3), demonstrating that appliance wear did not compromise
plaque removal. Plaque levels around the upper canines and second molars did not
alter with appliance placement or when a spring and distalising force was applied
(Figure 3.4A). However, there was a trend indicating that the mesiobuccal aspect of
the upper canines (tension site) harboured more plaque than the distopalatal aspect
(compression site) (Figure 4A). The reverse can be said of the second molars with the
mesiobuccal (tension site) harbouring more plaque (figure 3.4B).
Plaque scores at tension sites were found to be significantly greater at canines when
compared to second molars at T1 (P<0.001) , T2 (P<0.05), T3 (P<0.001) and T4
(P<0.01). At the compression sites there was significantly more plaque on the second
molars than the canines at T1(P<0.05).
Page 86
Chapter 3 Clinical Indices Results
65
Figure 3.3 Full mouth plaque scores at each time point. Box and whisker plots
represent median, 25% and 75% ranges and highest and lowest values.
Page 87
Chapter 3 Clinical Indices Results
66
Figure 3.4A&B – Clinical values and scores for Plaque levels (mean +/- SEM),
for sites of tension (red) and compression (blue) from maxillary canines and
second molars. Dotted lines represent mean values at baseline and parallel solid
lines represent the sem of the baseline values. Statistical analysis by Kruskal-
Wallis: *p<0.05; **p<0.01; ***p<0.001.
B
A
Page 88
Chapter 3 Clinical Indices Results
67
3.4 Gingival bleeding
Full mouth bleeding scores increased between baseline and T1, indicating that when
appliances were placed bleeding scores increased (Figure 3.5). However, this trend
was not found to be statistically significant. There was a significant decrease in
bleeding between time points T1 and T2, when the distalising spring was placed
There was a significant (p<0.05) rise in bleeding mesiobuccal to canines between
baseline and T1, when appliances were placed (Figure 3.6A). However the same
change was not seen at the distopalatal site (Figure 3.6A). There were no significant
changes between any of the other time points. At all time points the mesiobuccal
aspect of the upper canines had a greater tendency to bleed than the distopalatal
aspect (Figure 3.6A), perhaps indicating a difference in the tension and compression
sites.
The second molars showed no significant changes between any of the time points or
between tension and compression sites (Figure 3.7B). Bleeding scores at the tension
sites were found to be significantly greater at canines than second molars at T1
(P<0.001) and T2 (P<0.01).
Page 89
Chapter 3 Clinical Indices Results
68
Figure 3.5 – Full mouth bleeding scores at each time point. Box and whisker
plots represent median, 25% and 75% ranges and highest and lowest values.
Page 90
Chapter 3 Clinical Indices Results
69
Figure 3.6A&B – Clinical values and scores for Bleeding levels, (mean +/-SEM)
for sites of tension (red) and compression (blue) from maxillary canines and
second molars. Dotted lines represent mean values at baseline and parallel solid
lines represent the sem of the baseline values. Statistical analysis by Kruskal-
Wallis: *p<0.05; **p<0.01; ***p<0.001.
B
A
Page 91
Chapter 3 Clinical Indices Results
70
3.5 GCF volume
GCF volume increased at mesiobuccal canine sites between Baseline and T1 and
between time points T1 and T2, when the spring was applied, before leveling out
through time points T3 and T4 (Figure 3.7A). The changes between baseline and T1,
T2, T3 and T4 were significant (p<0.05). No other volume changes between time
points were significant. The GCF volume changes at the distopalatal aspects of the
upper canines showed similar trends to the mesiobuccal sites, although the changes
between Baseline and T1 were not significant (Figure 3.7A). However, changes
between baseline and T2, T3 and T4 were significant (p<0.05). There was no
statistical difference in GCF volumes between the compression (distopalatal) and
tension (mesiobuccal) sites at any time (Figure 3.7A).
None of the volume changes at the second molar sites were significantat any of the
time points. There was no significant difference between the sites of tension and
compression around the second molars. GCF volume was not found to be
significantly greater or less at canines when compared to second molars.
Page 92
Chapter 3 Clinical Indices Results
71
Figure 3.7A&B- Clinical values and scores for GCF volume, (mean +/-SEM) at
sites of tension (red) and compression (blue) from maxillary canines and second
molars. Dotted lines represent mean values at baseline and parallel solid lines
represent the sem of the baseline values. Statistical analysis by Kruskal-Wallis:
*p<0.05; **p<0.01; ***p<0.001.
B
A
Page 93
Chapter 3 Clinical Indices Results
72
3.6 GCF volume correlations
3.6.1 GCF correlations to plaque and bleeding scores.
There was a significant correlation between plaque scores and GCF levels at time
points T1 for the canine tension site (P<0.01) and T1 for the canine compression site
(P<0.001). None of the second molar plaque changes were significantly correlated
with changes in the GCF volumes around those teeth. None of the correlation
between bleeding scores and GCF volumes proved significant at both the canines and
second molars (Table 3.1).
Page 94
Chapter 3 Clinical Indices Results
73
Table 3.1 – Comparisons of GCF volume changes to plaque and bleeding scores
at tension and compression sites around the maxillary canines and second
molars. Statistical analysis using Spearman Rank Correlation.
!! "#$%$&! !! !! "#$%$&! !! !! '&()$*!+),#-! !! '&()$*!+),#-!
!! .&$'%)$!/%0&! ! ")12-&''%)$!/%0&! ! ")12-&''%)$!/%0&! ! .&$'%)$!/%0&!
!! 3,#45&!! 6,&&*%$7!! ! 3,#45&!! 6,&&*%$7!! ! 3,#45&!! 6,&&*%$7!! ! 3,#45&!! 6,&&*%$7!!
!! 8$*&9! 8$*&9! ! 8$*&9! 8$*&9! ! 8$*&9! 8$*&9! ! 8$*&9! 8$*&9!
6#'&,%$&! !! !! ! :;! :;! ! <:! <:! ! <:! <:!
=51>&-!)?!@A!3#%-'! :;! :;! ! ;BCD! ;B<<! ! ;BCD! ;B<E! ! ;BFD! G;BC<!
/2&#-1#$!-! ;BCC! ;B::! ! ;B<D! ;BHF! ! ;B:E! ;BFI! ! ;B;E! ;BCC!
3!J#,5&!K0L)G0#%,&*M! ;B<F! ;BCH! ! ='! ='! ! $'! ='! ! ='! $'!
!! !! !! ! !! !! ! !! !! ! !! !!
.<! !! !! ! !! !! ! !! !! ! !! !!
=51>&-!)?!@A!3#%-'! :;! :;! ! :;! :;! ! <:! <:! ! <:! <:!
/2&#-1#$!-! !"#$! ;B<F! ! !"%&! ;B:C! ! G;B<D! G;B:F! ! G;B;D! =)!J#,5&!
3!J#,5&!K0L)G0#%,&*M! !"!!%! ;BF:! ! !"!'! ;BCC! ! ;BHI! ;BDC! ! ;BN;! !!
!! !( !! ! !( !! ! !! !! ! !! !!
.:! !( !! ! !( !! ! !! !! ! !! !!
=51>&-!)?!@A!3#%-'! :;( :;! ! :;( :;! ! <:! <:! ! <:! <:!
/2&#-1#$!-! ;B:C( ;B:<! ! ;B<F( ;B;:! ! G;BF<! ;B:F! ! G;B<C! =)!J#,5&!
3!J#,5&!K0L)G0#%,&*M! ;BCC! ;BCE! ! ;BF:! ;BND! ! ;B;N! ;BD:! ! ;BHE! !!
!! !! !! ! !! !! ! !! !! ! !! !!
.C! !! !! ! !! !! ! !! !! ! !! !!
=51>&-!)?!@A!3#%-'! :;! :;! ! :;! :;! ! <:! <:! ! <:! <:!
/2&#-1#$!-! ;BC<! ;B:D! ! ;B;C! ;B:E! ! ;B<D! G;BDH! ! ;BC<! =)!J#,5&!
3!J#,5&!K0L)G0#%,&*M! ;B<N! ;B:N! ! ;BN:! ;B:C! ! ;BHF! ;B<C! ! ;BCC! !!
!! !! !! ! !! !! ! !! !! ! !! !!
.D! !! !! ! !! !! ! !! !! ! !! !!
=51>&-!)?!@A!3#%-'! :;! :;! ! :;! :;! ! <:! <:! ! <:! <:!
/2&#-1#$!-! ;B;;:! ;B<C! ! ;B<D! ;B:D! ! G;BC;! G;B:<! ! ;B;N! G;BCN!
3!J#,5&!K0L)G0#%,&*M! ;BNN! ;BFE! ! ;BFI! ;BC:! ! ;BCD! ;BF<! ! ;BIE! ;B:<!
Page 95
Chapter 3 Clinical Indices Results
74
3.6.2 GCF correlations to speed of tooth movement.
No significant correlations were found between GCF volume and speed of tooth
movement at any time within or between tension and compression sites around both
canines and second molars.
Page 96
Chapter 4 Cytokine Results
75
Chapter 4
Results
Cytokines
Page 97
Chapter 4 Cytokine Results
76
4.1 Introduction
This chapter presents cytokine levels measured from GCF collected during the
orthodontic treatment. Ten cytokines were assayed; GM-CSF, INF!, IL-1", IL-2, IL-
4, IL-5, IL-6, IL-8, IL-10, and TNF#. Four were beneath the detection levels of the
assays and six will be reported. Correlations between cytokine levels and clinical
measures were analysed by Spearman Rank Correlations.
4.2 Interleukin-1!
There were significant differences between the levels of IL-1" expressed
mesiobuccally to the upper canine, between Baseline and T2 (p<0.01), Baseline and
T3 (P<0.05) and Baseline and T4 (P<0.01) (Figure 4.1A). Significant differences
between the levels of IL-1" expressed distopalatally to the upper canine were found
between Baseline and T2 only (p<0.01) (Figure 4.1A).
There were no significant differences between the levels of IL-1! expressed either
mesiobucally or distopalatally to the upper second molars, between any time points.
There were no statistically significant differences in the amount of IL-1! between
the mesiobuccal and distopalatal aspects of the canines or second molars at any of the
time points. Figure 4.1A indicates a trend for lower levels of IL-1! at the distalpalatal
(compression) sites at all time points except baseline, where they were very similar to
mesiobuccal (tension) sites.
Page 98
Chapter 4 Cytokine Results
77
Figure 4.1A&B – IL-1! levels (mean +/- SEM), for sites of tension (red) and
compression (blue) from maxillary canines and second molars. Dotted lines
represent mean values at baseline and parallel solid lines represent the SEM of the
baseline values. Statistical analysis by Kruskal-Wallis: *p<0.05; **p<0.01;
***p<0.001.
A
B
Page 99
Chapter 4 Cytokine Results
78
4.2.1 Associations between clinical indices and IL-1! levels.
Table 4.1 Correlations between IL-1! ,plaque and bleeding indicies and the rate
of tooth movement. TS=Tension Sites CS=Compression Sites *=significant,
B=borderline significance, ns=no significance.
Correlations for each time point
Baseline T1 T2 T3 T4
Plaque
Canine TS ns ns ns ns ns
Canine CS * * ns ns ns
Second molar TS ns ns ns ns ns
Second molar CS ns ns ns ns ns
Bleeding
Canine TS ns ns ns ns ns
Canine CS ns ns ns ns ns
Second molar TS ns ns ns ns ns
Second molar CS ns ns ns ns ns
Rate of Movement
Canine TS ns ns B ns ns
Canine CS ns ns ns ns ns
Second molar TS ns ns ns ns ns
Second molar CS ns ns ns ns ns
Page 100
Chapter 4 Cytokine Results
79
4.3 Interleukin-6
There was a significant increase in the level of IL-6 between Baseline and T1
(P<0.05) and between Baseline and T4 (P<0.05) at the mesiobuccal canine site.
There was no significant difference in IL-6 levels between any of the time points at
the distopalatal canine site.(Figureure 4.2A). There were no significant differences in
IL-6 levels between any of the time points at the mesiobuccal or distopalatal second
molar site.(Figureure 4.2B). There were no statistically significant differences in the
amounts of IL-6 between the mesiobuccal and distopalatal aspects of the canines or
second molars at any time (Figure 4.2A&B).
Page 101
Chapter 4 Cytokine Results
80
Figure 4.2A&B – IL-6 levels (mean +/- SEM), for sites of tension (red) and
compression (blue) from maxillary canines and second molars. Dotted lines
represent mean values at baseline and parallel solid lines represent the SEM of the
baseline values. Statistical analysis by Kruskal-Wallis: *p<0.05; **p<0.01;
***p<0.001.
A
B
Page 102
Chapter 4 Cytokine Results
81
4.3.1 Associations of clinical indicies with IL-6 levels.
Correlations for each time point
Baseline T1 T2 T3 T4
Plaque
Canine TS ns ns ns ns ns
Canine CS ns ns ns ns ns
Second molar TS ns ns ns ns ns
Second molar CS ns ns ns ns ns
Bleeding
Canine TS ns ns ns ns ns
Canine CS ns ns ns ns ns
Second molar TS ns ns ns ns ns
Second molar CS ns ns ns ns ns
Rate of Movement
Canine TS ns ns ns ns ns
Canine CS ns ns ns ns ns
Second molar TS ns ns ns ns ns
Second molar CS ns ns ns ns ns
Table 4.2 Correlations between IL-6, plaque and bleeding indicies and the rate of
tooth movement. TS=Tension Sites CS=Compression Sites *=significant,
B=borderline significance, ns=no significance.
Page 103
Chapter 4 Cytokine Results
82
4.4 Interleukin-8
There was a significant increase in IL-8 levels between Baseline and T2 (P<0.001).
Levels of IL-8 were also significantly higher than at Baseline at T3 (P<0.01) and T4
(P<0.05) (mesiobuccal tension canine sites). There was also a significant increase in
IL-8 levels between Baseline and T1 (P<0.05) at the distopalatal canine site (Figure
4.3A).
There were however no statistically significant differences in the amount of IL-8
between the mesiobuccal and distopalatal aspects of the canines at any time (Figure
4.3A).
There were no significant differences in the amount of IL-8 between any of the time
points at the mesiobuccal and distopalatal second molar sites. There was no
statistically significant difference in the amount of IL-8 between the mesiobuccal and
distopalatal aspects of the second molars at any time (Figure 4.3B).
Page 104
Chapter 4 Cytokine Results
83
Figure 4.3A&B – IL-8 levels (+/- SEM), for sites of tension (red) and
compression (blue) from maxillary canines and second molars. Dotted lines
represent mean values at baseline and parallel solid lines represent the SEM of the
baseline values. Statistical analysis by Kruskal-Wallis: *p<0.05; **p<0.01;
***p<0.001.
A
B
Page 105
Chapter 4 Cytokine Results
84
4.4.1 Associations between clinical indices and IL-8 levels.
Correlations for each time point
Baseline T1 T2 T3 T4
Plaque
Canine TS ns * ns ns ns
Canine CS ns * ns ns ns
Second molar TS ns ns ns ns ns
Second molar CS ns ns ns ns ns
Bleeding
Canine TS ns ns ns ns ns
Canine CS ns ns ns ns ns
Second molar TS ns ns ns ns ns
Second molar CS ns ns ns ns ns
Rate of Movement
Canine TS ns ns ns ns ns
Canine CS ns ns ns ns ns
Second molar TS ns ns ns ns ns
Second molar CS ns ns ns ns ns
Table 4.3 Correlations between IL-8, plaque and bleeding indicies and the rate of
tooth movement. TS=Tension Sites CS=Compression Sites *=significant,
B=borderline significance, ns=no significance.
Page 106
Chapter 4 Cytokine Results
85
4.5 Tissue Necrosis Factor "
Significant differences were found in TNF# levels at mesiobuccal sites between
Baseline and T2 (P<0.05) and Baseline and T4 (P<0.01). No statistically significant
differences were found in TNF# levels at any time for the distobuccal sites. (Figure
4.4A)
There were no statistically significant differences in the amount of TNF# between the
mesiobuccal and distopalatal aspects of the canines at any time studied (Figure 4.4A).
There was a significant difference in the amount of TNF# between Baseline and T1
(P<0.05) and Baseline and T2 (P<0.01), at mesiobuccal second molar sites. No
statistically significant differences were found at distobuccal second molar sites.
There was no statistically significant difference in the amount of TNF# between the
mesiobuccal and distopalatal aspects of the second molars (Figure 4.4B).
Page 107
Chapter 4 Cytokine Results
86
Figure 4.4A&B – TNF" levels (mean +/- SEM), for sites of tension (red) and
compression (blue) from maxillary canines and second molars. Dotted lines
represent mean values at baseline and parallel solid lines represent the SEM of the
baseline values. Statistical analysis by Kruskal-Wallis: *p<0.05; **p<0.01;
***p<0.001.
A
B
Page 108
Chapter 4 Cytokine Results
87
4.5.1 Associations between clinical indices and TNF" levels.
Correlations for each time point
Baseline T1 T2 T3 T4
Plaque
Canine TS ns ns ns ns ns
Canine CS ns * ns ns ns
Second molar TS ns ns ns ns ns
Second molar CS ns ns ns ns ns
Bleeding
Canine TS ns ns ns ns ns
Canine CS ns ns ns ns ns
Second molar TS ns ns ns ns ns
Second molar CS ns ns ns ns ns
Rate of Movement
Canine TS ns ns * ns ns
Canine CS ns ns ns ns ns
Second molar TS ns ns ns ns ns
Second molar CS ns ns ns ns ns
Table 4.4 Correlations between TNF#, plaque and bleeding indicies and the rate
of tooth movement. TS=Tension Sites CS=Compression Sites *=significant,
B=borderline significance, ns=no significance.
Page 109
Chapter 4 Cytokine Results
88
4.6 Granulocyte-Macrophage Colony-Stimulating
Factor
No statistically significant differences were found in the levels of GM-CSF between
any times at any sites.
There were no statistically significant differences in the amount of GM-CSF between
the mesiobuccal and distopalatal aspects of the canines at any time (Figure 4.5A).
There was a significant difference in the amount of GM-CSF between Baseline and
T1 (P<0.05) at mesiobuccal second molar sites. There were no significant differences
in the amount of GM-CSF between any time points at the distopalatal second molar
sites. There were no statistically significant differences in the amount of GM-CSF
between the mesiobuccal and distopalatal aspects of the second molars at any time
(Figure 4.5B).
Page 110
Chapter 4 Cytokine Results
89
Figure 4.5A&B – GM-CSF levels (mean +/-SEM), for sites of tension (red) and
compression (blue) from maxillary canines and second molars. Dotted lines
represent mean values at baseline and parallel solid lines represent the SEM of the
baseline values. Statistical analysis by Kruskal-Wallis: *p<0.05; **p<0.01;
***p<0.001.
A
B
Page 111
Chapter 4 Cytokine Results
90
4.6.1 Associations between clinical indices and GM-CSF levels.
Table 4.5 Correlations between GM-CSF, plaque and bleeding indicies and the
rate of tooth movement. TS=Tension Sites CS=Compression Sites *=significant,
B=borderline significance, ns=no significance.
Correlations for each time point
Baseline T1 T2 T3 T4
Plaque
Canine TS ns ns ns ns ns
Canine CS ns ns ns ns ns
Second molar TS ns ns ns ns ns
Second molar CS ns ns ns ns ns
Bleeding
Canine TS ns ns ns ns ns
Canine CS ns ns ns ns ns
Second molar TS ns ns ns ns ns
Second molar CS ns ns ns ns ns
Rate of Movement
Canine TS ns ns * ns ns
Canine CS ns ns ns ns ns
Second molar TS ns ns ns ns ns
Second molar CS ns ns ns ns ns
Page 112
Chapter 4 Cytokine Results
91
4.7 Interferon #
No significant differences were found for the levels of IFN! at either site at any time.
There were no statistically significant differences in the amount of IFN! between the
mesiobuccal and distopalatal aspects of the canines at any time (Figure 4.6A).
There were no significant differences in the amount of IFN! at any time at the
mesiobuccal or distopalatal second molar sites. There were no statistically significant
differences in the amount of IFN! at the mesiobuccal and distopalatal aspects of the
second molars at any time points (Figure 4.6B).
Page 113
Chapter 4 Cytokine Results
92
Figure 4.6A&B – IFN# levels (mean +/- SEM), for sites of tension (red) and
compression (blue) from maxillary canines and second molars. Dotted lines
represent mean values at baseline and parallel solid lines represent the SEM of the
baseline values. Statistical analysis by Kruskal-Wallis: *p<0.05; **p<0.01;
***p<0.001.
A
B
Page 114
Chapter 4 Cytokine Results
93
4.7.1 Associations between clinical indices and IFN# levels.
Table 4.6 Correlations between IFN#, plaque and bleeding indicies and the rate
of tooth movement. TS=Tension Sites CS=Compression Sites *=significant,
B=borderline significance, ns=no significance.
Correlations for each time point
Baseline T1 T2 T3 T4
Plaque
Canine TS ns ns ns ns ns
Canine CS ns * ns ns ns
Second molar TS ns ns ns ns ns
Second molar CS ns * * ns ns
Bleeding
Canine TS * ns ns ns ns
Canine CS ns ns ns ns ns
Second molar TS ns ns ns ns ns
Second molar CS ns ns ns ns ns
Rate of Movement
Canine TS ns ns ns ns ns
Canine CS ns ns ns ns ns
Second molar TS ns ns ns ns ns
Second molar CS ns ns ns ns ns
Page 115
Chapter 5 Tissue Metabolite Results
94
Chapter 5
Results
Tissue Metabolites
Page 116
Chapter 5 Tissue Metabolite Results
95
5.1 Introduction
This chapter presents findings for tissue metabolites measured in GCF taken at all
time points during the orthodontic treatment. Five tissue metabolites were assayed;
MMP-9, TIMP-1, TIMP-2, TIMP-3, TIMP-4. However, TIMPs 3 and 4 were
beneath the detection levels of the assays. The three detectable compounds and their
ratios will now be reported upon. Correlations between metabolite levels and clinical
measures were analysed using Spearmans Rank Correlations, unless otherwise stated.
5.2 Matrix Metallopeptidase-9
There were significant differences between the levels of MMP-9 expressed
mesiobuccally to the upper canine, between time points; Baseline and T2 (p<0.01)
and Baseline and T3 (P<0.05) (Figure 5.1A). There were also significant differences
between the levels of MMP-9 expressed distopalatally to the upper canine, between
Baseline and T3 (p<0.05) and Baseline and T4 (p<0.05) (Figure 5.1A). Significant
differences were found in MMP-9 levels around the second molars at the mesiobucal
(compression) site from Baseline at T1 (P<0.05) and T2 (P<0.01) (Table 5.1B).
There were no statistically significant differences in the amount of MMP-9 from the
mesiobuccal and distopalatal aspects of the canines or second Molars at any time.
Page 117
Chapter 5 Tissue Metabolite Results
96
Figure 5.1A&B – MMP-9 levels (+/- SEM), for sites of tension (red) and
compression (blue) from maxillary canines and second molars. Dotted lines
represent mean values at baseline and parallel solid lines represent the SEM of the
baseline values. Statistical analysis by Kruskal-Wallis: *p<0.05; **p<0.01;
***p<0.001.
A
B
Page 118
Chapter 5 Tissue Metabolite Results
97
5.2.1 Associations between clinical indices and MMP-9 levels.
Table 5.1 Correlations between MMP-9, plaque and bleeding indicies and the
rate of tooth movement. . TS=Tension Sites CS=Compression Sites *=significant,
B=borderline significance, ns=no significance.
Correlations for each time point
Baseline T1 T2 T3 T4
Plaque
Canine TS ns ns ns ns ns
Canine CS * ns ns ns ns
Second molar TS ns ns ns ns ns
Second molar CS ns ns ns ns ns
Bleeding
Canine TS ns ns ns ns ns
Canine CS ns ns ns ns ns
Second molar TS ns ns ns ns ns
Second molar CS ns ns ns ns ns
Rate of Movement
Canine TS ns ns ns ns ns
Canine CS ns ns ns ns ns
Second molar TS ns ns ns ns ns
Second molar CS ns ns ns ns ns
Page 119
Chapter 5 Tissue Metabolite Results
98
5.3 Tissue Inhibitor of Metalloproteinases-1
There were significant differences between the levels of TIMP-1 expressed
mesiobuccally to the upper canine, between time points Baseline and T2 (p<0.05),
Baseline and T3 (P<0.01) and Baseline and T4 (P<0.001) (Figure 5.2A). There were
also significant differences between the levels of TIMP-1 expressed distopalatally to
the upper canine, between Baseline and T2 (p<0.05) (Figure 5.2A). There was a
significant difference between TIMP-1 levels at Baseline and T3 at the second molar
mesiobuccal (compression site) (P<0.05) (Figure 5.2B).
There were no statistically significant differences in the amount of TIMP-1 between
the mesiobuccal and distopalatal aspects of the canines or second molars at any time.
Page 120
Chapter 5 Tissue Metabolite Results
99
Figure 5.2A&B – TIMP-1 levels (mean +/- SEM), for sites of tension (red) and
compression (blue) from maxillary canines and second molars. Dotted lines
represent mean values at baseline and parallel solid lines represent the SEM of the
baseline values. Statistical analysis by Kruskal-Wallis: *p<0.05; **p<0.01;
***p<0.001.
A
B
Page 121
Chapter 5 Tissue Metabolite Results
100
5.3.1 Associations between clinical indices and TIMP-1 levels.
Table 5.2 Correlations between TIMP-1, plaque and bleeding indicies and the
rate of tooth movement. . TS=Tension Sites CS=Compression Sites *=significant,
B=borderline significance, ns=no significance.
Correlations for each time point
Baseline T1 T2 T3 T4
Plaque
Canine TS ns ns ns ns ns
Canine CS ns * ns ns ns
Second molar TS ns ns ns ns ns
Second molar CS ns ns ns ns ns
Bleeding
Canine TS ns ns ns ns ns
Canine CS ns ns ns ns ns
Second molar TS ns ns ns ns ns
Second molar CS ns ns ns ns ns
Rate of Movement
Canine TS ns ns ns ns ns
Canine CS ns ns ns ns ns
Second molar TS ns ns ns ns ns
Second molar CS ns ns ns ns ns
Page 122
Chapter 5 Tissue Metabolite Results
101
5.4 Tissue Inhibitor of Metalloproteinases-2
There were significant differences between the levels of TIMP-2 expressed
mesiobuccally to the upper canine, between time points Baseline and T2 (p<0.05),
Baseline and T3 (P<0.01), Baseline and T4 (P<0.05) and T1 and T3 (P<0.05) (Figure
5.3A). There were also significant differences between the levels of TIMP-2
expressed distopalatally to the upper canine between Baseline and T3 (p<0.05)
(Figure 5.3A). There were no significant changes in TIMP-2 levels at the second
molars.
There were no significant differences in TIMP-2 expression between the mesiobuccal
and distopalatal aspects of the canines or second molars at any of the time points
(Figure 5.3B).
Page 123
Chapter 5 Tissue Metabolite Results
102
Figure 5.3A&B – TIMP-2 levels (mean +/- SEM), for sites of tension (red) and
compression (blue) from maxillary canines and second molars. Dotted lines
represent mean values at baseline and parallel solid lines represent the SEM of the
baseline values. Statistical analysis by Kruskal-Wallis: *p<0.05; **p<0.01;
***p<0.001.
B
A
Page 124
Chapter 5 Tissue Metabolite Results
103
5.4.1 Associations between clinical indices and TIMP-2 levels.
Correlations for each time point
Baseline T1 T2 T3 T4
Plaque
Canine TS ns ns ns ns ns
Canine CS ns ns ns ns ns
Second molar TS ns ns ns ns ns
Second molar CS ns ns ns ns ns
Bleeding
Canine TS ns ns ns ns ns
Canine CS ns ns ns ns ns
Second molar TS ns ns ns ns ns
Second molar CS ns ns ns ns ns
Rate of Movement
Canine TS ns ns ns * ns
Canine CS ns * ns ns ns
Second molar TS ns ns ns ns ns
Second molar CS ns ns ns ns ns
Table 5.3 Correlations between TIMP-2, plaque and bleeding indicies and the
rate of tooth movement. . TS=Tension Sites CS=Compression Sites *=significant,
B=borderline significance, ns=no significance.
Page 125
Chapter 5 Tissue Metabolite Results
104
5.5 Ratio MMP-9 / TIMP-1
There were no significant differences between the ratio of MMP-9/TIMP-1 expressed
mesiobuccally or distopalatally to the upper canine or second molar, between any
time points.
There were no statistically significant differences in the ratio of MMP-9/TIMP-1
between the mesiobuccal and distopalatal aspects of the canines or second molars at
any time.
Page 126
Chapter 5 Tissue Metabolite Results
105
Figure 5.4A&B – MMP-9/TIMP-1 levels (mean +/- SEM), for sites of tension
(red) and compression (blue) from maxillary canines and second molars. Dotted
lines represent mean values at baseline and parallel solid lines represent the SEM
of the baseline values. Statistical analysis by Kruskal-Wallis: *p<0.05; **p<0.01;
***p<0.001.
A
B
Page 127
Chapter 5 Tissue Metabolite Results
106
5.5.1 Associations between clinical indices and MMP-9/TIMP-1
levels.
Correlations for each time point
Baseline T1 T2 T3 T4
Plaque
Canine TS ns ns ns ns ns
Canine CS ns ns ns ns ns
Second molar TS ns ns ns ns ns
Second molar CS ns ns ns ns ns
Bleeding
Canine TS ns * ns ns ns
Canine CS ns ns ns ns ns
Second molar TS ns ns ns ns ns
Second molar CS ns ns ns ns ns
Rate of Movement
Canine TS ns ns ns ns ns
Canine CS ns ns ns ns ns
Second molar TS ns ns ns ns ns
Second molar CS ns ns ns ns ns
Table 5.4 Correlations between MMP-9/TIMP-1 ratio, plaque and bleeding
indicies and the rate of tooth movement. . TS=Tension Sites CS=Compression
Sites *=significant, B=borderline significance, ns=no significance.
Page 128
Chapter 5 Tissue Metabolite Results
107
5.6 Ratio MMP-9 / TIMP-2
There were no significant differences between the ratio of MMP-9/TIMP-2 expressed
mesiobuccally or distopalatally to the upper canine or second molar, at any time
(Figures 5.5A and 5.5B).
There were no significant differences in the ratio of MMP-9/TIMP-2 between the
mesiobuccal and distopalatal aspects of the canines or second molars at any time.
Page 129
Chapter 5 Tissue Metabolite Results
108
Figure 5.5A&B – MMP-9/TIMP-2 levels (mean +/- SEM), for sites of tension
(red) and compression (blue) from maxillary canines and second molars. Dotted
lines represent mean values at baseline and parallel solid lines represent the SEM
of the baseline values. Statistical analysis by Kruskal-Wallis: *p<0.05; **p<0.01;
***p<0.001.
A
B
Page 130
Chapter 5 Tissue Metabolite Results
109
5.6.1 Associations between clinical indices and MMP-9/TIMP-2
levels.
Correlations for each time point
Baseline T1 T2 T3 T4
Plaque
Canine TS ns ns ns * ns
Canine CS ns ns ns ns ns
Second molar TS ns ns ns ns ns
Second molar CS ns ns ns ns ns
Bleeding
Canine TS ns ns ns ns ns
Canine CS ns ns ns ns ns
Second molar TS ns ns ns ns ns
Second molar CS ns ns ns ns ns
Rate of Movement
Canine TS ns ns ns ns ns
Canine CS ns ns ns ns ns
Second molar TS ns ns ns ns ns
Second molar CS ns ns ns ns ns
Table 5.5 Correlations between MMP-9/TIMP-2 ratio, plaque and bleeding
indicies and the rate of tooth movement. . TS=Tension Sites CS=Compression
Sites *=significant, B=borderline significance, ns=no significance.
Page 131
Chapter 6 Bone Metabolite Results
110
Chapter 6
Results
Bone Metabolites
Page 132
Chapter 6 Bone Metabolite Results
111
6.1 Introduction
This chapter presents findings for bone metabolites measured in GCF taken at all time
points during the orthodontic treatment. OPG and RANKL were assayed and are
reported together with their ratios. Correlations between OPG and RANKL levels
and clinical measures were analysed by Spearman Rank Correlations, unless
otherwise stated.
6.2 Osteoprotegerin
There were no significant differences between the levels of OPG expressed
mesiobuccally or distopalatally to the upper canine or at second molar sites between
any time points (Figure 6.1A&B).
There were no statistically significant differences in the amount of OPG between the
mesiobuccal and distopalatal aspects of the canines or second molars at any time.
Page 133
Chapter 6 Bone Metabolite Results
112
Figure 6.1A&B – OPG levels (mean +/- SEM), for sites of tension (red) and
compression (blue) from maxillary canines and second molars. Dotted lines
represent mean values at baseline and parallel solid lines represent the SEM of the
baseline values. Statistical analysis by Kruskal-Wallis: *p<0.05; **p<0.01;
***p<0.001.
A
B
Page 134
Chapter 6 Bone Metabolite Results
113
6.2.1 Associations between clinical indices and OPG levels.
Table 6.1 Correlations between OPG, plaque and bleeding indicies and the rate
of tooth movement. . TS=Tension Sites CS=Compression Sites *=significant,
B=borderline significance, ns=no significance.
Correlations for each time point
Baseline T1 T2 T3 T4
Plaque
Canine TS ns ns ns * ns
Canine CS ns ns ns ns ns
Second molar TS ns ns ns ns ns
Second molar CS ns ns ns ns ns
Bleeding
Canine TS ns * ns ns ns
Canine CS ns ns ns ns ns
Second molar TS ns ns ns ns ns
Second molar CS ns ns ns ns ns
Rate of Movement
Canine TS ns ns ns ns ns
Canine CS ns ns ns ns ns
Second molar TS ns ns ns ns ns
Second molar CS ns ns ns ns ns
Page 135
Chapter 6 Bone Metabolite Results
114
6.3 Receptor Activator of Nuclear Factor Kappa-B
Ligand
There were no significant differences between the levels of RANKL mesiobuccally to
the upper canine, between any of the time points. There was a significant difference
between the levels of RANKL expressed distopalatally to the upper canine, between
Baseline and T4 (p<0.05) (Figure 6.2A). There were no significant changes in the
levels of RANKL at either second molar site (Figure 6.2B).
There were no statistically significant differences in the amount of RANKL between
the mesiobuccal and distopalatal aspects of the canines or second molars at any time.
Page 136
Chapter 6 Bone Metabolite Results
115
Figure 6.2A&B – RANKL levels (+/- SEM), for sites of tension (red) and
compression (blue) from maxillary canines and second molars. Dotted lines
represent mean values at baseline and parallel solid lines represent the SEM of the
baseline values. Statistical analysis by Kruskal-Wallis: *p<0.05; **p<0.01;
***p<0.001.
A
B
Page 137
Chapter 6 Bone Metabolite Results
116
6.3.1 Associations between clinical indices and RANKL levels.
Correlations for each time point
Baseline T1 T2 T3 T4
Plaque
Canine TS ns ns ns * *
Canine CS ns ns ns ns ns
Second molar TS ns ns ns ns ns
Second molar CS ns ns ns ns ns
Bleeding
Canine TS ns ns ns ns ns
Canine CS ns ns ns ns ns
Second molar TS ns ns ns ns ns
Second molar CS ns ns ns ns ns
Rate of Movement
Canine TS ns ns ns ns ns
Canine CS ns ns * ns ns
Second molar TS ns ns ns ns ns
Second molar CS ns ns ns ns ns
Table 6.2 Correlations between RANKL, plaque and bleeding indicies and the
rate of tooth movement. . TS=Tension Sites CS=Compression Sites *=significant,
B=borderline significance, ns=no significance.
Page 138
Chapter 6 Bone Metabolite Results
117
6.4 RANKL/OPG Ratio
There were no significant differences between the RANKL/OPG ratio expressed
mesiobuccally to the upper canine, between any time points. There was a significant
difference between the levels of RANKL/OPG expressed distopalatally to the upper
canine between T2 and T4 only (p<0.05). None of the changes at either second molar
site were statistically different (Figure 6.3A).
There were no statistically significant differences in the amount of RANKL/OPG
ratio expressed at any time (Figure 6.3B).
Page 139
Chapter 6 Bone Metabolite Results
118
Figure 6.3A&B – RANKL/OPG ratio (mean +/- SEM), for sites of tension (red)
and compression (blue) from maxillary canines and second molars. Dotted lines
represent mean values at baseline and parallel solid lines represent the SEM of the
baseline values. Statistical analysis by Kruskal-Wallis: *p<0.05; **p<0.01;
***p<0.001.
A
B
Page 140
Chapter 6 Bone Metabolite Results
119
6.4.1 Associations between clinical indices and RANKL/OPG levels.
Correlations for each time point
Baseline T1 T2 T3 T4
Plaque
Canine TS ns ns ns * ns
Canine CS ns ns ns ns ns
Second molar TS ns ns ns ns ns
Second molar CS ns ns ns ns ns
Bleeding
Canine TS ns ns ns ns ns
Canine CS ns ns ns ns ns
Second molar TS ns ns ns ns ns
Second molar CS ns ns ns ns ns
Rate of Movement
Canine TS ns ns ns ns *
Canine CS ns ns ns ns ns
Second molar TS ns ns ns ns ns
Second molar CS ns ns ns ns ns
Table 6.3 Correlations between RANKL/OPG ratio, plaque and bleeding indicies
and the rate of tooth movement. . TS=Tension Sites CS=Compression Sites
*=significant, B=borderline significance, ns=no significance.
Page 141
Chapter 7 Discussion
120
Chapter 7
Discussion
Page 142
Chapter 7 Discussion
121
7.1 Discussion
This study is the first to measure a large number of inflammatory, tissue and bone
metabolism biomarkers using GCF from teeth undergoing orthodontic tooth
movement. The development of protein/cytokine arrays has allowed testing of more
than one biomarker within a small GCF sample, and thus profile changes occurring
within the tissues surrounding the tooth.
In the present study three null hypotheses were tested; 1) There will be no change in
the biomarker profile in GCF, 2) There will be no difference in the GCF biomarker
profiles at compression and tension sites. 3) There will be no correlations between the
various cytokines tested and the rate of tooth movement. Each of these hypotheses
will be commented on in turn.
Previous studies that have recorded plaque and gingival health measurements have
not reported them in detail (Yamaguchi et al., 2006; Giannopoulou et al., 2006).
Unless high levels of oral hygiene are achieved prior to, and maintained during,
treatment it is impossible to tell if the changes to the bio-markers are due to tooth
movement or changes in oral hygiene and the resultant periodontal inflammation.
This study demonstrated significant increases in GCF volume at both the tension and
compression sites on canines during movement. No differences in GCF volume were
found between tension and compression sites and there were no differences between
the GCF levels at the canines in comparison to the second molars. These findings
suggest that there was a systemic response caused by the appliance placement and
tooth movement, since a localised response would have lead to raised GCF around
Page 143
Chapter 7 Discussion
122
the upper canines but unchanged GCF levels at the second molars which have no
appliances or active forces acting upon them.
No significant differences were seen in full mouth plaque scores at any time. This
demonstrated no compromise in plaque removal due to appliance placement. Neither
did plaque levels increase when a distalising spring was placed, even though the
springs harboured food particles.
Plaque scores at tension sites were significantly greater at the canines than the second
molars at all time points except baseline. It is possible that this demonstrates that a
combination of appliance placement and space opening mesial to the upper canine
tooth may have encouraged food accumulation and hampered efficient plaque
removal. Alternatively as the canine was the tooth undergoing most tooth movement
it may be that it was more uncomfortable to clean.
Yamaguchi et al., (2006) found that Substance P and IL-1! were significantly
increased in gingivae adjacent to teeth, which were orthodontically moved for up to
72 hours after force application, but remained at baseline levels around the control
teeth. The forces applied to these teeth were probably not acting at their later
sampling times, Substance P would have likely been increased at these time points
also. Erdinc and Dincer (2004) suggested that from the results of their study that they
felt that the perception of pain may be related to Substance P release. Hence teeth
undergoing active movement are associated with pain. Substance P was not measured
in the present study however other studies have also related increased IL-1! levels
with increased pain perception (Giannopoulou et al., 2006). IL-1! was shown to be
Page 144
Chapter 7 Discussion
123
increased in canine tension sites in the present study at all time points and so that
pain/discomfort may be the reason for increased plaque accumulation at these sites
relative to the second molar.
Bleeding indices remained constant except for the decrease seen between baseline and
4 hours after a distalising force was applied, indicating that periodontal inflammation
was less once the spring had been applied and then returned back to normal levels for
the subject. Or perhaps that the forces created caused a relative tissue ischemia due to
the distortion of periodontal cappiliaries and blood vessels.
Correlations between plaque scores and GCF levels were significant at both tension
and compression canine sites 3 months after appliance placement. This suggests that
before the distalising force was applied to the canine, increases in GCF associated
with these teeth were due to inflammation from insufficient plaque removal.
Bleeding indices at tension sites were higher at the canines than the second molars
after 4 hours and 7 days of distalising force. It is likely that active force causes more
periodontal inflammation than passive force at a tension site.
Analysis of the amount of tooth movement showed that teeth had begun to move 4
hours after a distalising force had been applied and that they had moved a
significantly greater distances 42 days after force application. Analysis of speed of
movement demonstrated that 4hrs after the application of a distalising force tooth
movement was fastest. It then decelerated over 7 and 42 days, perhaps illustrating that
at 4 hours the tooth was in the first phase of tooth movement in displacement
Page 145
Chapter 7 Discussion
124
(Burstone, 1962). During the second phase of tooth movement which is a lag period
with relatively low rates of tooth displacement. Hyalinization occurs in the PDL in
areas of compression and no further tooth movement can happen until necrotic tissue
is removed.
Analysis of cytokines around the canines revealed significant increase in IL-1!, IL-8,
and TNF" in comparison to baseline levels at tension sites once a distalising force
was active. 4 hours after the distalising force was placed IL-1! levels peaked at
canine tension and compression sites and IL-8 levels peaked at canine tension sites.
This suggests that these levels rose quickly in response to the orthodontic force as part
of an acute reaction. IL-1! attracts leukocytes and stimulating fibroblasts and
endothelial cells osteoclasts which promote bone resorption and inhibit bone
formation. IL-8 is thought to be a trigger factor for bone remodelling TNF" which
promotes bone resorption, it is therefore likely that both should peak at tension sites.
IL-8 also regulates the influx of leukocytes to the site of inflammation. Whether this
reaction is inflammatory or not is a subject for debate. Meikle (2006) suggested that
tooth movement did not meet three of the four classical criteria of inflammation
(redness, heat, swelling and pain), only pain was present. He suggested that tooth
movement was best regarded as an exaggerated form of normal physiological
turnover combined with foci of tissue repair. TNF alpha levels peaked 42 days after a
distalising force was applied, perhaps revealing a more chronic inflammatory
response. IL6 showed an increase at the tension site 3 months into appliance treatment
and 42 days after the distalising force had been applied, suggesting that it was
released more slowly and not as a response to acute inflammation. GM-CSF and IFN"
levels remained constant at canine sites. TNF" and GM-CSF levels rose at the
Page 146
Chapter 7 Discussion
125
compression sites on the second molars 3 months after appliance placement. Four
hours after the distalising force was applied the TNF" values rose again. All other
cytokine levels tested at the second molars remained constant. Increases in cytokines
recorded at the control second molar teeth, may imply that the application of force
affects the whole mouth, though this change was more transient than that seen at the
canines.
At Baseline and three months into treatment IL-1! , IL-8, TNF#, IFN" levels all
showed associations with plaque levels at canine sites. There were no significant
correlations between plaque and bleeding indices and the levels of IL-1! , IL-8 or
TNF# once the distalising force had been applied. This suggests subsequent changes
in IL-1! , IL-8 and TNF# were due to orthodontic force and tooth movement. IL-6
and GM-CSF were not associated with plaque and bleeding scores at any point in the
study. This suggests fluctuations in cytokine levels once a distalising force was
applied were due to inflammation resulting from orthodontic forces.
This study agrees with clinical findings from other studies which have shown that IL-
1! and TNF# are all elevated in gingival crevicular fluid collected from patients
during the early phases of orthodontic tooth movement (Grieve et al 1994 ; Lowney et
al 1995 ; Uematsu et al. 1996).
Dudic et al (2006), found that the GCF levels of IL-1!, SP, and PGE2 in
orthodontically moved teeth were significantly higher than for the control teeth at
both tension and compression sides throughout force application. The increase,
relative to baseline values, was generally higher in tension sides. They also found
Page 147
Chapter 7 Discussion
126
that although biomarker patterns were different at tension and compression sites, with
generally higher values of cytokines at tension site, they were not significantly raised.
The present findings support this view.
Tissue metabolites showed similarities to cytokines with MMP-9, TIMP-1 and TIMP-
2 expressed more at canine tension sites following application of distalising force,
with peaks at 7 days for TIMP-1 and 42 days for TIMP-2. MMP-9 was low after 7
days. Increases in MMP-9 occurred 7 days after force application at the compression
sites. Initially it seems that the levels of all bone metabolites increased in response to
the orthodontic distalising force. But that by 7 days the TIMPs 1 and 2 remained high
at tension sites, whereas MMP-9 levels dropped at the tension sites and increased at
the compression sites. It is thus likely that new bone formation was at progress in the
tension sites by this time. The higher levels of TIMPs would have inhibited the
release of MMP-9, reducing its level so that boney resorption was occurring at
compression sites. The ratios of MMP-9 to TIMP-1 and TIMP-2 did not produce
significant conclusions.
There were no correlations between increases in plaque and bleeding scores and any
tissue metabolites once a distalising force was applied. It can thus be deduced that
changes in biomarker levels were due to the distalising force and resultant tooth
movement.
Regarding the bone metabolites, none of the changes in OPG levels were significant.
However RANKL levels were significantly higher after 42 days at the canine
compression sites. Also the ratio of OPG to RANKL was significantly different after
Page 148
Chapter 7 Discussion
127
42 days. This suggests that the OPG RANKL interaction occurs later on in tooth
movement. There were no correlations with plaque and bleeding scores at
compression sites so these changes are most likely be a consequence of applied force
and tooth movement. Kanzaki et al. (2002) found that culture media from compressed
PDL fibroblasts stimulated osteoclastogenesis in peripheral blood mononuclear cell
cultures and that RANKL mRNA expression was upregulated in the cells. OPG
expression in contrast remained unchanged as was found in this study. Kawasaki et al,
(2006) discussed the differences between adult and juveniles for the expression of
OPG and RANKL in GCF. The amount of tooth movement for juveniles was larger
than for adults after 168 hours (7 days). After 24 hours RANKL levels were increased
and those of OPG decreased in GCF samples from the compression side during
orthodontic tooth movement in both juveniles and adults. The RANKL/OPG ratio in
GCF from adult patients was lower than that in the juvenile samples perhaps
explaining why tooth movement is slower in adults.
The ratio of OPG to RANKL around second molar compression sites was similar to
that at canine compression sites, suggesting that bony resorption was occurring at
both of these sites simultaneously.
Yamaguchi et al. (2006) reported on associations between increases in RANKL
expression in compressed periodontal ligament cells and root resorption. Compressed
PDL cells obtained from patients demonstrating severe external apical root resorption
produced large amounts of RANKL, small amounts of OPG and stimulated osteoclast
formation. A mini review of the topic Tyrovola et al. (2008) also described a link
between RANKL levels, osteoclastic activation and root resorption. If an optimal
Page 149
Chapter 7 Discussion
128
RANKL level could be targeted it might be possible to create tooth movement
without causing resorption.
Increases in TNF#, GM-CSF, IL-1! and IL-8 at the canines were correlated to speed
of movement, indicating a rapid inflammatory response to applied force. Tissue and
bone metabolism biomarkers followed different patterns. MMP-9, TIMP-2 and TIMP-
1 correlated with speed of movement 4 hours after application of a distilasing force.
However, MMP-9 levels continued to increase at sites of compression and TIMP-1
levels continued to increase at sites of tension 7 days after force. These changes in
MMP-9 would be consistent with a need to decrease the density of soft tissue under
compression. Bone metabolism biomarkers were not significantly correlated with
speed of movement; however the greatest changes in OPG levels were seen within 4
hours of force application. RANKL increased at 42 days after application of a
distilising force. This could be the start of Phase 3 of tooth movement, where the
increase in RANKL at sites of compression could indicate that activation of
osteoclasts and bone resorption has begun.
The present study subjects were divided into 3 groups depending on their overall rate
of tooth movement. Biomarker profiles were then compared for each of the groups to
see if there were any obvious differences between fast movers, medium movers and
slow movers. However, no statistically significant differences were found and only
IL-1! showed a clear pattern with levels being highest in fast movers at all times and
lowest in slow movers.
Page 150
Chapter 7 Discussion
129
The present study has provided greater insight into tooth movement and the biological
response of the surrounding tissues to this movement. However the group size was
insufficient to give the study enough power to demonstrate possible significant
differences. Post Hoc power analysis suggests that a sample size greater than 120
patients would be required, and the subject warrants further. It would also be
interesting to add an additional time point at 84 days to look at the changes occurring
once the tooth is in Stage 3 of orthodontic tooth movement (Burstone, 1962).
Much of the recent research into tooth movement has looked at ways to reduce the lag
phase of tooth movement, when hyalinisation occurs. Studies have looked at
minimising hyalinisation by examining the amount and duration of force on the teeth.
It would be useful to look at a profile of cytokines in subjects receiving differing
amounts of force and their durations.
Page 151
Chapter 8 Conclusions
130
Chapter 8
Conclusions
Page 152
Chapter 8 Conclusions
131
8.1 Conclusions
This study investigated the effects of orthodontic tooth movement on the
periodontium by analysing cytokine, tissue and bone metabolite levels within GCF.
As plaque and bleeding scores remained constant after force application, it is likely
that biomarker changes in the periodontium most likely resulted from orthodontic
forces.
The null hypotheses being tested in this study were that, when an orthodontic force
applied to a tooth
1) There will be no change in the biomarker profile in GCF.
This was disproved and this null hypothesis is rejected. There were significant
changes in the profile of several biomarkers at various times which were consistant
with tissue remodelling.
2) There will be no difference in the GCF biomarker profiles at the compression
and tension sites.
Although differences were seen between tension and compression sites, none were
statistically significant. It is likely that a greater number of subjects are needed to
prove statistical significance between sites. Thus this hypothesis stands.
Page 153
Chapter 8 Conclusions
132
3) There will be no correlations between the various cytokines tested and the rate of
tooth movement.
This was also disproved by increases of TNF!, GM-CSF, IL-1" and IL-8 at the
canines, which correlated with the rate of tooth movement. MMP-9, TIMP-2 and
TIMP-1 levels increased in line with speed of movement 4 hours after application of
force.
Page 154
Chapter 9 References
133
Chapter 9
References
Page 155
Chapter 9 References
134
9.1 References
Aass AM, Albandar J, Aasenden R, Tollefsen T, Gjermo P. Varitation in
prevalence of radiographic bone loss in sub groups of 14yr old school children in
Oslo.
Journal of Clinical Periodontology 1988; 15: 130-133.
Alhashimi N, Frithiof L, Brudvik P, Bakhiet M. Orthodontic movement induces
high numbers of cells expressing interferon at mRNA and protein levels.
Journal of Interferon Cytokine Research 2000; 20: 7-12.
Alhashimi N, Frithiof L, Brudvik P, Bakheit M. Orthodontic movement and de
novo synthesis of proinflammatory cytokines.
American Journal of Orthodontics and Dentofacial Orthopaedics 2001;119:307-12.
Almeida MA, Phillips C, Kula K, Tulloch C. Stability of the palatal rugae as
landmarks for analysis of dental casts.
Angle Orthodontist 1995; 65: 43-48
Andreasen GF, Zwanziger D. A clinical evaluation of the differential force concept
as applied to the edgewise bracket.
American Journal of Orthodontics 1980; 78: 25-40.
Page 156
Chapter 9 References
135
Baldwin PD, Pender N, Last KS. Effects on tooth movement of force delivery from
nickel-titanium arch wires.
European Journal of Orthodontics 1999; 21: 481-489
Berridge MJ. Inositol triphosphate and calcium signalling.
Nature 1993;361:315-325.
Bertolini DR, Nedwin GE, Bringman TS, Smith DD, Mundy GR. Stimulation of
bone resorption and inhibition of bone formation in vitro by human tumour necrosis
factors.
Nature 1986; 319: 516-518.
Birkedal-Hansen H, Moore WG, Bodden MK, Windsor LJ, Birkedal-Hansen B,
DeCarlo A, Engler JA. Matrix metalloproteinases: a review.
Critical reviews in Oral Biology and Medicine 1993; 4(2):197-250.
Bolcato-Bellemin A L, Elkaim R, Abehsera A, Fausser J L, Haikel Y,
Tenenbaum H. Expression of mRNAs encoding for ! and " integrin subunits,
MMPs and TIMPs in stretched human periodontal ligament and gingival fibroblasts.
Journal of Dental Research 2000; 79 :1712 – 1716
Boyd RL, Leggott PJ, Quinn RS, Eakle WS, Chambers D. Periodontal
implications of orthodontic treatment in adults with reduced or normal periodontal
tissues versus those of adolescents.
American Journal of Orthodontics and Dentofacial Orthopaedics 1989; 96:191-199
Page 157
Chapter 9 References
136
Brill N and Krass B. The passage of tissue fluid into the clinically healthy gingival
pocket.
Acta Odontologica Scandinavia 1958; 16: 233-245.
Brock G R, Butterworth C J, Matthews J B, Chapple ILC. Local and systemic
total antioxidant capacity in periodontitis and health.
Journal of Clinical Periodontology 2004; 31(7): 515–521
Buehler WJ and Cross W B. Nitinol unique Y alloy with a memory.
Wire Journal 1969; 2: 41-49
Burstone CJ. The biomechanics of tooth movement. In: Kraus BS, Riedel RA
editor. Vistas in orthodontics. Philadelphia: Lea & Febiger; 1962;p. 197–213
Callard R, George AJ, Stark J. Cytokines chaos and complexity.
Immunity 1999; 11: 507-513.
Chapple IL, Landini G, Griffiths GS, Patel NC, Ward RS. Calibration of the
Periotron 8000 and 6000 by polynomial regression.
Journal of Periodontal Research 1999; 34: 79–86.
Charles P, Ericksen EF, Mosekilde L, Melsen F, Jensen FT. Bone turnover and
balance evaluated by a combined calcium balance and 47 calcium kinetic study and
dynamic hisomorphometry.
Metabolism; clinical and experimental 1987; 36: 1118-1124
Page 158
Chapter 9 References
137
Ciancio, D, Cunat, J, Mather M, & Harvey D. A comparison of plaque
accumulation in bonded versus banded teeth.
Journal of Dental Research 1985, 64, Special Issue, 325, Abstract 1664.
Cooper SM, Sims MR. Evidence of acute inflammation in the PDL subsequent to
orthodontic tooth movement in rats.
Australian Orthodontic Journal 1989; 11: 107-109
Crumley PJ. Collagen formation in normal and stressed periodontium.
Periodontics 1964; 2: 53-61
Curtis MA, Griffiths GS, Price SJ, Coulthurst SK, Johnson NW
Total protein concentration of gingival crevicular fluid; variation with sampling time
and gingival inflammation.
Journal of Clinical Periodontology 1988; 15: 628-632
Davidovitch Z, Nicolay OF, Ngan PW, Shanfeld JL. Neurotransmitters, cytokines
and the control of alveolar bone remodelling in orthodontics.
Dental Clinics of North America 1988; 32: 411-435
Davidovich Z. Tooth movement.
Critical reviews in Oral Biology and Medicine. 1991; 21: 411-450
Davidovitch Z. Cell biology associated with orthodontic tooth movement. In:
Berkovitz BB, MoxhamBJ, Newman HN, editors. The periodontal ligament in health
and disease. St Louis: Mosby; 1995.
Page 159
Chapter 9 References
138
Dewhurst FE, Ago JM, Peros WJ, Stashenko P. Synergism between parathyroid
hormone and interleukin I in stimulation bone resorption in organ culture.
Journal of Bone Mineral Research 1987; 2: 127-134.
Dinarello CA. Interleukin-1 and its biologically related cytokines.
Advanced Immunology 1989; 44: 153-205.
Dixon V, Read M, O'Brien K, Worthington H, Mandall N. A random clinical trial
to compare three methods of orthodontic space closure,
Journal of Orthodontics 2002; 29; 31-36
Dudic A, Kiliaridis S, Mombelli A, Giannopoulou C. Composition changes in
gingival crevicular fluid during orthodontic tooth movement: comparisons between
tension and compression sides.
European Journal of Oral Science 2006; 114: 416–422.
Eliasson L, Hugoson A, Kurol J, Siuwe H. The affects of orthodontic treatment on
periodontal tissues in patients with reduced periodontal support.
European Journal of Orthodontics 1982; 4: 1-9.
Erdinç AME and Dinçer B. Perception of pain during orthodontic treatment with
fixed appliances
European Journal of Orthodontics 2004; 26 : 79-85.
Page 160
Chapter 9 References
139
Ericksen E, Mosekilde L, Melsen F. Trabecular bone remodelling and balance in
primary hyperparathyroidism.
Bone 1986; 7: 213-221.
Frost HM. A determination of bone architecture; the minimum affective strain.
Clinical Orthopaedic Research 1983; 175: 286-292
Fuller K, Gallagher AC, Chambers TJ. Osteoclast resorption-stimuating activity
is associated with osteoblast surface and / or extracellular matrix.
Biochemical and Biophysical Research Communications 1991;181:67-73
Giannopoulou C, Dudic A, Kiliaridis S. Pain Discomfort and Crevicular Fluid
Changes Induced by Orthodontic Elastic Separators in Children.
The Journal of Pain 2006; 7(5):367-376
Grieve W G, Johnson G K, Moore R N, Reinhardt R A, DuBois L M
Prostaglandin E (PGE) and interleukin-1 " (IL-1 " ) levels in gingival crevicular fluid
during human orthodontic tooth movement.
American Journal of Orthodontics and Dentofacial Orthopedics 1994; 105 :369 – 374
Grimm FM. Bone bending, a feature of orthodontic tooth movement.
American Journal of Orthodontics and Dentofacial Orthopaedics 1972; 62: 384-393
Page 161
Chapter 9 References
140
Hamp SE, Lundstrom F, Nyman S. Periodontol conditions in adolescents subjected
to multiband orthodontic treatment with controlled oral hygiene.
European Journal of Orthodontics 1982; 4: 77-86.
Hixon EH, Atikian H, Callow GE, McDonald HW, Tracy RJ. Optimal force,
differential force and anchorage.
American Journal of Orthodontics and Dentofacial Orthopaedics 1969; 55: 437-457.
Jaworski ZFG, Liskova-Kiar M, Uhthoff HK. Effect of long term immobilisation
on the pattern of bone loss in older dogs.
Journal of Bone Joint Surgery 1980; 62:104-110
Kanzaki H, Chiba M, Shimizu Y Mitani H. Periodontal ligament cells under
mechanical stress induce osteoclastogenesis by receptor activator of nuclear factor #
B ligand up-regulation via prostaglandin E 2 synthesis.
Journal of Bone and Mineral Research, 2002; 17: 210 – 220
Kawasaki K, Takahashi T, Yamaguchi M, Kasai K. Effects of aging on RANKL
and OPG levels in gingival crevicular fluid during orthodontic tooth movement.
Orthodontic and Craniofacial Research , 2006; 9: 137–142
Keeling SD, King GJ, McCoy EA, Valdez M. Serum and alveolar bone phosphatase
changes reflect bone turnover during orthodontic tooth movement.
American Journal of Orthodontics and Dentofacial Orthopaedics, 1993; 103: 320-326.
Page 162
Chapter 9 References
141
Kennedy DB, Joondeph DR, Little RM Osterberg SK
The effect of extraction and orthodontic treatment on dentoalveolar support.
American Journal of Orthodontics 1983; 84: 183-190.
King GJ, Keeling SD, Wronski TJ. Histomorphologic and chemical study of
alveolar bone turnover in response to orthodontic tipping. Bone Biodynamics in
Orthodontic and Orthopaedic treatment,1992 (ED.DS Carlson and SA Goldstein).
281-297.
Krishnan V, Davidovitch Z. Cellular, molecular, and tissue level reactions to
orthodontic force. American Journal of Orthodontics and Dentofacial Orthopedics
2006;129:1-32.
Last KS, Donkin C, Embery G. Glycosaminoglycans in human crevicular fliud
during orthodontic tooth movement.
Archieves of Oral Biology 1988; 33: 907-912
Little RM. The Irregularity Index: A quantitative score of mandibular anterior
alignment
American Journal of Orthodontics 1975; 68 (5): 554-563
!
Lerner U. H. Inflammation-induced bone remodelling in periodontal disease and the
influence of post-menopausal osteoporosis.
Journal of Dental Research 2006; 85: 596-607.
Page 163
Chapter 9 References
142
Lerner U. New molecules in the tumour necrosis factor ligand and receptor
Super families with importance for physiological and pathological bone resorption.
Critical Reviews in Oral Biology and Medcine. 2004; 15: 64-81.
Loe H. The gingival index, the plaque index and the retention index system.
Journal of Periodontology 1967; 38: 610-616.
Lowney J J, Norton L A, Shafer D M, Rossomondo E F. Orthodontic
forces increase tumour necrosis factor alpha in the human gingival sulcus.
American Journal of Orthodontics and Dentofacial Orthopedics, 1995; 108 :
519 – 524
Manhartsberger Cand Seidenbusch W. Force delivery of Ni-Ti springs.
American Journal of Dentofacial Orthopaedics 1996; 109: 8-21.
Maroszynska I, Fiedor P. Leukocytes and endothelial interaction in as rate limiting
step in the inflammatory response and a key factor in the ischaemia reprofusion
injury.
Annals of transplantation 2000; 5: 5-11
Martin TJ and NG K. Mechanisms by which cells of the osteoblast lineage control
osteoclast formation and function.
Journal of Cellular Biochemistry 1994; 56: 357-366
Page 164
Chapter 9 References
143
McDonald F and Yettram AL Loading of cells and a possible upper limit of load
response with respect to strain energy density.
Journal of biomedical materials research 1995; 29(12):1577-85
Meghji S. Bone remodelling.
British Dental Journal 1992; 172: 235-242
Meikle M. The tissue, cellular, and molecular regulation of orthodontic tooth
movement: 100 years after Carl Sandsted.
European Journal of Orthodontics 2006: 28(3): 221-240
Melsen B. Biological reaction of alveolar bone to orthodontic
tooth movement.
Angle Orthodontist 1999; 69: 151-8.
Middleton J, Jones M, Wilson A. The role of the periodontal ligament in bone
remodelling; the initial development of a time – dependent finite element model.
American Journal of Orthodontics and Dentofacial Orthopaedics 1996; 109: 155-162.
Miura F, Mogi M, Ohura Y, Karibe M. The super-elastic Japanese NiTi alloy wire
for use in Orthdontics.
American Journal of Orthodontics and Dentofacial Orthopedics. 1988; 94: 89-96
Page 165
Chapter 9 References
144
Miyajima K, Ohno Y, Iwata T, Tanida K, Iizuka T
The lactic acid and citric acid content in the gingival fluid of orthodontic patients.
Aichi Gakuin Dental Science 1991; 4:75-82.
Mogi M, Otogoto J,Ota N,Togari A. Differential expression of RANKL and
osteoprotegerin in gingival crevicular fluid of patients with periodontitis.
Journal of Dental Research 2004. 83:166-169
Mohammed A Dimitris H, Tatakis N, Dziak R
Leukotrienes in orthodontic tooth movement,
American Journal of Orthodontics and Dentofacial Orthopaedics 1989; 95:231-237
Nagase H,Woessner JF Jr. Matrix Metalloproteinases.
Journal of Biological Chemistry 1999; 274: 21491-21494
Nagase H. Activation mechanisms of matrix metalloproteinases.
Journal of Biological Chemistry 1997; 378: 151-160
Nakago-Matsuo C, Matsuo T, Nakago T. Intracelluar calcium response to
hydraulic pressure in human periodontal ligament fibroblasts.
American Journal of Orthodontics and Dentofacial Orthopaedics 1996; 109: 244-248
Nightingale C, and Jones S.P. A clinical investigation of force delivery
systems for orthodontic space closure.
Journal of Orthodontics, 2003; 30: 229–236
Page 166
Chapter 9 References
145
NIH press release Woburn, Mass, May 31, 2006 - http://www.piercenet.com
Okada H, Murakami S. Cytokine expression in periodontal health and disease.
Critical Reviews of Oral Biological Medicine 1998; 9: 248-266.
Owman-Moll P, Kurol J, Lundgren P. Effects of doubled orthodontic force
magnitude on tooth movement and root resorption.
European Journal of Orthodontics 1996; 18: 141-50.
Pilon JJ, Kuijpers-Jagtman AM, Maltha JC. Magnitude of orthodontic forces and
rate of bodily tooth movement: an experimental study in beagle dogs.
American Journal of Orthodontics and Dentofacial Orthopaedics 1996; 110(1): 16-23.
Reitan K. Tissue reaction as related to age factor.
Journal of Dental Research, 1954; 74: 271-27
Reitan K. The initial tissue reaction incident to orthodontic tooth movement as
related to the influence of function.
Acta Odontologica Scandinavia 1951; 9: 1-240
Reitan K. Tissue reaction as related to the age factor.
Dental Research 1954; 74: 271-279.
Reitan K. Biomechanical principles and reactions.
In:Graber TM,ed. Current orthodontic concepts and techniques. Philadelphia:WB
Saunders, 1969:56-159.
Page 167
Chapter 9 References
146
Reitan K. Initial tissue behaviour during apical root resorption.
Angle Orthodontist 1974; 44: 68-82.
Reitan K, Rygh P. Biomechanical principles and reactions.
In: Orthodontics: current principles and techniques, (ed. TM Graber and RL
Vanarsdall), (2nd
edn) 1994, 96-192. Mosby Year biik, St. Lois
Ren Y, Hazemeijer H, de Haan B, Qu N, de Vos P. Cytokine Profiles in Crevicular
Fluid During Orthodontic Tooth Movement of Short and Long Durations
Journal of Periodontology 2007; 78: 453-458.
Ren Y, Vissink A. Cytokines in crevicular fluid and orthodontic tooth movement.
European Journal of Oral Science 2008; 116: 89–97.
Roberts WE, Chase DC. Kinetics of cell proliferation and migration associated with
orthodontically induced osteogenesis.
Journal of Dental Research 1981; 60: 174-181
Roberts WE, Ferguson DJ. Cell kinetics of the periodontal ligament.
In the biology of orthodontic tooth movement, (ed. LA Norton and CJ Burstone).
1989. CRC press, Boca Raton, Florida.
Rygh P. Ultrastructural changes in pressure zones of human periodontium incident to
orthodontic tooth movement.
Acta Odontologica Scandinavia 1973; 31: 109-122
Page 168
Chapter 9 References
147
Rygh P, Bowling K, Hovlandsdal L, Williams S. Activation of the vascular system:
a main mediator of periodontal fibre remodelling in orthodontic tooth movement.
American Journal of Orthodontics 1986; 89: 453-468
Sabatini M, Boyce B, Aufdemorte T, Bonewald L, Mundy GR. Infusion of
recombinant human interleukin 1 and 1— cause hypercalcemia in normal mice.
Proceedings of the National Academy of Sciences of the United States of America
1988; 85: 5235-9.
Sandy JP. Tooth eruption and orthodontic tooth movement.
British Dental Journal 1992;172:141-149
Sandy J, Farndale R, Meikle, M. Recent advances in understanding mechanically
induced bone remodelling and their relevance to orthodontic theory and practice,
American Journal of Orthodontics and Dentofacial Orthopedics 1993; 103: 212-222
Saito S, Ngan P, Saito M, Kim K, Lanese R, Shanfeld J, Davidovitz Z.
Effect of cytokines of prostaglandin E and cAMP in human periodontal ligament
fibroblasts in vitro.
Archives of Oral Biology 1990; 35(5): 387-95.
Schroder K, Hertzog PJ, Ravasi T and Hume DA
. "Interferon-$ an overview of
signals, mechanisms and functions".
Journal of Leukocyte Biology 2004; 75: 163-189.
Page 169
Chapter 9 References
148
Starkey PM, Barrett AJ. Inhibition by alpha-macroglobulin and other serum
proteases.
Biochemistry Journal 1973; 131: 823-831.
Suda T, Ubagawa N,Takahashi N. Cells of bone: osteoclast generation. In:
Principles of bone biology, Bilezikian JP, Raisz LG and Rodan GA (eds). 87-102.
Acedemic press, San Diego 1996.
Tang MPF, Sims MR, Sampson WJ, Dreuer CW. Evidence for endothelial
junctions acting as a fluid flux pathway in tensioned periodontal ligament.
Archives in Oral Biology 1993; 38: 273-276
Ten Cate AR, Deporter DA, Freeman E. The role of fibroblasts in the remodelling
of the periodontal ligament during physiologic tooth movement.
American Journal of Orthodontics 1976; 69: 155
Tuncay OC, Ho D, Barker MK. Oxygen tension regulates osteobast function.
American Journal of Orthodontics and Dentofacial Orthopedics 1994; 105: 457-463
Tuncer BB, Ozmeriç N, Tuncer C, Teoman I, Cakilci B, Yücel A, Alpar R, Balo!
K. Levels of interleukin-8 during tooth movement:
Angle Orthodontologist 2005; 75: 539-44.
Page 170
Chapter 9 References
149
Tureskey S, Gilmore ND, Glickman I. Reduced plaque formation by the
chloromethly analogue of vitamin C.
Journal of Periodontology 1970; 41: 41-43
Tyrovola JB, Spyropoulos MN, Makou M, Perrea D. Root resorption and the
OPG/RANKL/RANK system: a mini review.
Journal of Oral Science 2008; 50(4): 367-76
Uematsu S, Mogi M, Deguchi T. Interleukin (IL)-1 " , IL-6, tumour necrosis factor-
! , epidermal growth factor, and B 2 -microglobulin levels are elevated in gingival
crevicular fluid during human orthodontic tooth movement.
Journal of Dental Research, 1996; 75 : 562 – 567
Van Der Velden U. Effects of age on the periodontium- review article.
Journal of Clinical Periodontology 1984; 11: 181-194.
Van Leeuwen EJ, Maltha JC, Kuijpers-Jagtsman AM.
Tooth movement with light continuous and discontinuous forces in beagle dogs.
European Journal of Oral Science 1999; 107: 468-74.
von Böhl M, Maltha JC, Von Den Hoff JW, Kuijpers-Jagtman AM. Focal
hyalinization during experimental tooth movement in beagle dogs.
American Journal of Orthodontic Dentofacial Orthopedics 2004; 125: 615-23.
Page 171
Chapter 9 References
150
von Böhl M, Maltha JC, Von den Hoff H, Kuijpers-Jagtman AM. Changes in the
periodontal ligament after experimental tooth movement using high and low
continuous forces in beagle dogs.
Angle Orthodontist 2004; 74: 16-25.
Waddington RJ, Embery G. Proteoglycans and orthodontic tooth movement.
Journal of Orthodontics 2001; 28: 281-290
Wright HJ, Chapple ILC, Matthews JB. Levels of TGF"1 in gingival crevicular
fluid during a 21-day experimental model of gingivitis.
Oral Diseases 2003; 9(2): 88-94.
Xiao Y, Bunn CL, Bartold PM. Detection of tissue plasminogen activator and
plasminogen activator inhibitor in gingival crevicuar fluid from healthy, Gingivitis
and Periodontitis patients.
Journal of Clinical Periodontology 2000; 27(3): 149-156.
Yamaguchi M, Aihara N, Kojima T, Kasai K. RANKL Increase in Compressed
Periodontal Ligament Cells from Root Resorption.
Journal of Dental Research 2006; 85(8): 751-756.
Yamaguchi M, Yoshii M, Kasai K. Relationship between substance P and
interleukin-1" in gingival crevicular fluid during orthodontic tooth movement in
adults.
European Journal of Orthodontics 2006; 28(3): 241-246.
Page 172
Chapter 9 References
151
Yamasaki K, Shibata Y, Imai S, Tani Y, Shibasaki Y and Fukuhara T. Clinical
application of prostaglandin E1(PGE1) upon orthodontic tooth movement,
American Journal of Orthodontics and Dentofacial Orthopedics 1989; 85:508-518
Zachrisson S, Zachrisson BU. Gingival condition associated with orthodontic
treatment.
Angle Orthodontist 1972; 42: 26-34.
Zachrisson BU, Alnaes L. Periodontal condition in orthodontically treated and
untreated individuals. I. Loss of attachment, gingival pocket depth and clinical crown
height.
Angle Orthodontist 1973; 43: 402-411
Zachrisson BU, Alnaes L. Periodontal condition in orthodontically treated and
untreated individuals. II. Alveolar bone loss: radiographic findings.
Angle Orthodontist 1974; 44(1): 48-55.
Page 174
Appendix A 1
Participant Information Sheet
Orthodontic tooth movement Version 4.0 (18
th June 2008)
Assessment of changes in gingival fluid biomarkers during orthodontic tooth
movement
You are being invited to take part in a research study. Before you decide it is
important for you to understand why the research is being done and what it will
involve. Please take time to read the following information carefully and discuss it
with your parents and others if you wish. Ask us if there is anything that is not clear
or if you would like more information. Take time to decide whether or not you wish
to take part. Thank you for reading this.
What is the purpose of the study?
By measuring the forces applied to a tooth and the concentration of certain chemicals
released by the tissues around a tooth, this study aims to assess whether the levels of
such chemicals change when different forces are applied. This study will help to
create a better understanding of the bone processes that take place when a force is
applied to a tooth. It is hoped that it will ultimately help to identify those patients
whose teeth will move faster or slower, so that treatment planning may be improved
in the future to improve results for individual patients.
Page 175
Why have I been chosen to take part in the study?
You have been chosen to take part in the study because you are a patient aged 12-16
years, with good general health and are about to undergo a course of treatment with
fixed braces.
Do I have to take part in the study?
It is up to you to decide whether or not to take part. If you do decide to take part you
will be given this information sheet to keep and be asked to sign a consent form. If
you decide to take part you are still free to stop at any time and without giving a
reason. A decision to stop at any time, or a decision not to take part, will not affect
the care you receive.
What will happen to me if I take part?
If you decide to take part in this study you will be treated in exactly the same manner
as all our patients and will receive your treatment as normal but will be asked to
attend the hospital for one long visit and one extra appointment to enable some
samples to be taken from you and samples will also be taken at four of your routine
appointments. Also you will have impressions taken of your teeth as well as gum
health and plaque measurements at every appointment when samples are taken.
You will not be eligible to take part in the study if-
! You are a smoker.
! Have poor oral hygiene
! Signs of significant gum disease.
! Evidence of bone loss around the teeth on xrays.
! Have taken a courses of anti-inflammatory's or antimicrobial medicines within
1 month prior to the study.
Page 176
What do I have to do?
At your treatment planning appointment (baseline) the study will be discussed, you
may ask any questions that you need to and your consent will be obtained and a
medical history taken. Your gum health will be assessed and the amount of plaque on
your teeth will be measured. Paper strips will be used to collect fluid from around
your teeth (called gingival crevicular fluid or GCF) this is painless and you will not
feel the sample collection. Three months later the samples will be taken again and a
spring will be placed to help to close the spaces where teeth have been taken out (as
per normal) your gum health and plaque levels will again be assessed and an
impression taken of your top teeth. Four hours later the samples will be repeated,
together with gum health, plaque levels and an impression. Four days later you will
need to attend an extra visit for samples to be taken, your gum health and plaque
levels will be assessed and an impression of the top teeth taken. Five weeks later at
your routine brace adjustment appointment more samples will be taken, gum health
and plaque levels will be assessed and an impression of the top teeth taken.
Treatment will then continue as normal.
Will my taking part in the study be confidential?
You will be allocated a study number, so that your name will not be disclosed to
anyone except the people treating you. Your name will not be identified with the data
collected other than by a code. If you wish to know your personal results these can be
shared with you after the study is complete. You will have a dedicated team looking
after you who will answer any questions you have at any stage.
Are there any side effects of the treatment?
You will be receiving no additional treatment as part of the study. There are no side
effects involved in giving the samples as previously discussed.
What are the possible disadvantages and risks of taking part?
There are no disadvantages to taking part, you will have long visit and one extra visit
of about 10 minutes and you will need the gum fluid samples taken at this visit. At
the longer visit you are free to leave the hospital after the morning part of your
appointment, but we need you to return 4 hours later for the afternoon part.
What are the possible benefits of taking part?
You will get the chance to have your brace checked at the additional appointment,
which may help to address any problems or concerns. Also patients in the study will
have their oral hygiene levels very closely monitored, which will minimise their risk
of developing early decay around the brace/gum disease.
What if new information becomes available?
If new information becomes available, you will be told at your next visit.
What happens when the research study stops?
At the end of the study, you will return to normal treatment.
Page 177
What if something goes wrong?
You are only providing gum fluid samples, so nothing will go wrong with this aspect
of the study. However, if you have any worries or concerns or problems a member of
the study team will be available to discuss these with you. If you wish to make a
complaint you should contact Professor P Lumley by writing to the Birmingham
Dental Hospital, St Chad’s Queensway, B4 6NN or calling 0121 236 8611.
Who is organising and funding the research?
This study is one that we have designed and led at the Dental Hospital.
What about my travel costs for the additional visit?
If you request re-imbursement of reasonable travel costs for the additional visit this
will be provided in cash upon presentation of receipts. Please ask the study clinician
and they will arrange this for you.
Who has reviewed this study?
The study has been reviewed by Coventry Research Ethics Committee.
Contact for further information?
If you need further information please phone 0121 237 2735 and ask to speak to Jay
Wilson who is managing the study.
Page 178
Study Flow Chart
Patient presents to the Birmingham dental hospital to start fixed brace treatment.
Patient invited to join the study. Study
explained, questions answered, information sheet
and consent form given to patient. Tooth
cleaning and gum health assessed.
Samples collected at treatment planning
appointment.
Brace fitted.
Coil placed on brace and samples taken
Samples taken
Samples taken
Routine appointment: final samples taken
Routine treatment. Treatment will continue as normal as if the
patient had not been involved in a study.
Patient not included in
study.
3 Months later
4 Hours later
4 Days later
38 Days later
Patient Declines or Does
not meet criteria
Study Ends
Extra
Visit
Longer
Visit
Patient recruited into
study
Page 179
Participant Consent Sheet Version 4.0 (18
th June 2008)
Assessment of changes in gingival fluid biomarkers during orthodontic tooth
movement
Consent Statement:
I have read the information sheet (version 4.0 dated 18th
June 2008) and been given
the opportunity to ask any questions I wished to ask. I understand what is involved in
the project and I agree to take part in the study. I understand that the study team will
need to access my treatment notes and that anonymous data will need to be analysed
by members of the study team. I understand that my identity will be confidential to
the study team alone and that I may withdraw from the study at any stage, without
detriment to my treatment.
Subject signature & date
Subject Name (please print)
Name & Signature & date of team member taking consent
Page 180
Parent Information Sheet
Orthodontic tooth movement Version 4.0 (18
Th June 2008)
Assessment of changes in gingival fluid biomarkers during orthodontic tooth
movement
Your child is being invited to take part in a research study. Before you decide it is
important for you to understand why the research is being done and what it will
involve. Please take time to read the following information carefully and discuss it
with others if you wish. Ask us if there is anything that is not clear or if you would
like more information. Take time to decide whether or not you wish to take part.
Thank you for reading this.
What is the purpose of the study?
By measuring the forces applied to a tooth and the concentration of certain chemicals
released by the tissues around a tooth, this study aims to assess whether the levels of
such chemicals change when different forces are applied. This study will help to
create a better understanding of the biological processes that take place when a force
is applied to a tooth. It is hoped that it will ultimately help to identify those patients
whose teeth will move faster or slower, so that treatment planning may be improved
in the future to optimise results for individual patients.
Why has my chid been chosen to take part in the study?
Your child has been chosen to take part in the study because he/she is a patient aged
12-16 years, with good general health and is about to undergo a course of fixed brace
treatment.
Does my child have to take part in the study?
It is up to you and your child to decide whether or not to take part. If you do decide
to take part you will be given this information sheet to keep and both be asked to sign
a consent form. If you decide to take part you are still free to withdraw at any time
and without giving a reason. A decision to withdraw at any time, or a decision not to
take part, will not affect the standard of care received by your child.
What will happen to my child if we take part?
If you decide to take part in this study your child will be treated in exactly the same
manner as all our patients and will receive their treatment as normal but will be asked
to attend the hospital for one long visit and one extra appointment to enable some
samples to be taken, samples will also be taken at four routine appointments. Also
impressions will be taken of your child’s teeth as well as gum health and plaque
measurements at every appointment when samples are taken.
Page 181
Your child will not be eligible to take part in the study if-
! They are a smoker.
! Have poor oral hygiene
! Signs of signifficant gum disease.
! Evidence of bone loss around the teeth on xrays.
! Have taken a course of anti-inflammatory's or antimicrobial medicines within
1 month prior to the study.
What do we have to do?
At the treatment planning appointment (baseline) the study will be discussed, you
may ask any questions that you need to and your consent will be obtained together
with your child’s and a medical history taken. Gum health will be assessed and the
amount of plaque on your child’s teeth will be measured. Paper strips will be used to
collect fluid from around the teeth (called gingival crevicular fluid or GCF) this is
painless and your child will not feel the sample collection. Three months later the
samples will be taken again and a spring will be placed to help to close the spaces
where teeth have been taken out (as per normal) gum health and plaque levels will
again be assessed and an impression taken of the top teeth. Four hours later the
samples will be repeated, together with gum health, plaque levels and an impression.
Four days later you will need to attend an extra visit for samples to be taken, gum
health and plaque levels will be assessed and an impression of the top teeth taken.
Five weeks later at the routine brace adjustment appointment more samples will be
taken, gum health and plaque levels will be assessed and an impression of the top
teeth taken. Treatment will then continue as normal.
Will our taking part in the study be confidential?
Your child will be allocated a study number, so that their name will not be disclosed
to anyone except the clinical people treating you. Their name will not be identified
with the data collected other than by a code. If you wish to know your child’s
personal results these can be shared with you after the study is complete. You will
have a dedicated team looking after you who will answer any questions you have at
any stage.
Are there any side effects of the treatment?
Your child will be receiving no additional treatment as part of the study. There are no
side effects involved in giving the samples as previously discussed.
What are the possible disadvantages and risks of taking part?
There are no disadvantages to taking part, you will have one long visit and one extra
visit of about 10 minutes, you will need the gum fluid samples taken at this visit. At
the longer visit you and your child are free to leave the hospital after the morning part
of your appointment, but we need you to return 4 hours later for the afternoon part.
Page 182
What are the possible benefits of taking part?
Your chid will get the chance to have their brace checked at the additional
appointment, which may help to address any problems or concerns. Also patients in
the study will have their oral hygiene levels very closely monitored, which will
minimise their risk of developing early decay around the brace/gum disease.
What if new information becomes available?
If new information becomes available, you will be informed of this at your next visit.
What happens when the research study stops?
At the end of the study, your child will enter a normal review process and any further
treatment needed will be arranged with a member of staff as is normal practice.
What if something goes wrong?
Your child is only providing gum fluid samples, so nothing will go wrong with this
aspect of the study. However, if you have any worries or concerns or problems a
member of the study team will be available to discuss these with you. If your child is
harmed due to someone’s negligence, then you may have grounds for a legal action
but you may have to pay for it. If you wish to make a complaint you should contact
Professor P Lumley by writing to the Birmingham Dental Hospital, St Chad’s
Queensway, B4 6NN or calling 0121 236 8611.
Who is organising and funding the research?
This study is one that we have designed and led at the Dental Hospital.
What about my travel costs for the additional visit?
If you request re-imbursement of reasonable travel costs for the additional visit this
will be provided in cash upon presentation of receipts. Please ask the study clinician
and they will arrange this for you.
Who has reviewed this study?
The study has been reviewed by Coventry Research Ethics Committee.
Contact for further information?
If you need further information please phone 0121 237 2735 and ask to speak to Jay
Wilson who is managing the study.
Page 183
Parent Consent Sheet Version 4.0 (18
th June 2008)
Assessment of changes in gingival fluid biomarkers during orthodontic tooth
movement
Childs Name:………………………………………………………………………….
Consent Statement:
I have read the information sheet (version 4.0 dated 18th
June 2008), and been given
the opportunity to ask any questions I wished to ask. I understand what is involved in
the project and I agree for my child to take part in the study. I understand that the
study team will need to access my child’s treatment notes and that anonymous data
will need to be analysed by members of the study team. I understand that my child’s
identity will be confidential to the study team alone and that we may withdraw from
the study at any stage, without detriment to treatment.
Guardian signature
Guardians Name (Please print) & Date
Name & Signature & date of team member taking consent
Page 184
Appendix B 1
Periotron 8000 calibration.
Raw data
Volume (ul)
Periotron Reading Mean
1 2 3
0.02 4 5 5 4.67
0.04 9 10 10 9.67
0.06 15 16 16 15.67
0.08 19 19 19 19.00
0.1 23 24 23 23.33
0.12 29 32 30 30.33
0.14 34 35 36 35.00
0.16 37 38 39 38.00
0.18 40 39 41 40.00
0.2 43 42 44 43.00
0.22 50 51 52 51.00
0.24 55 55 55 55.00
0.26 57 58 57 57.33
0.28 60 62 61 61.00
0.3 64 63 64 63.67
0.32 65 66 66 65.67
0.34 68 68 69 68.33
0.36 72 72 73 72.33
0.38 77 78 78 77.67
0.4 80 81 80 80.33
0.42 83 83 83 83.00
0.44 86 85 85 85.33
0.46 88 89 88 88.33
0.48 95 96 95 95.33
0.5 98 97 97 97.33
0.6 107 110 109 108.67
0.7 119 118 118 118.33
0.8 123 124 125 124.00
0.9 139 137 137 137.67
1 146 145 146 145.67
1.1 152 151 150 151.00
1.2 159 158 156 157.67
1.3 164 163 161 162.67
1.4 169 168 167 168.00
1.5 171 172 169 170.67
Page 186
Appendix B 2
Periotron values for set fluid volumes calculated from the previous equation.
Volume Periotron value Volume Periotron value Volume Periotron value
0.004 1 0.277 60 0.707 119
0.008 2 0.282 61 0.717 120
0.012 3 0.288 62 0.727 121
0.016 4 0.294 63 0.737 122
0.02 5 0.299 64 0.747 123
0.024 6 0.305 65 0.757 124
0.028 7 0.311 66 0.768 125
0.032 8 0.317 67 0.778 126
0.036 9 0.323 68 0.788 127
0.04 10 0.329 69 0.799 128
0.044 11 0.335 70 0.81 129
0.048 12 0.341 71 0.821 130
0.052 13 0.347 72 0.832 131
0.056 14 0.353 73 0.844 132
0.06 15 0.359 74 0.856 133
0.065 16 0.366 75 0.867 134
0.069 17 0.372 76 0.879 135
0.073 18 0.378 77 0.89 136
0.077 19 0.385 78 0.903 137
0.082 20 0.391 79 0.915 138
0.086 21 0.398 80 0.927 139
0.09 22 0.404 81 0.94 140
0.095 23 0.411 82 0.953 141
0.099 24 0.417 83 0.966 142
0.103 25 0.424 84 0.979 143
0.108 26 0.431 85 0.992 144
0.112 27 0.438 86 1.006 145
0.117 28 0.445 87 1.02 146
0.121 29 0.452 88 1.034 147
0.126 30 0.459 89 1.048 148
0.13 31 0.466 90 1.063 149
0.135 32 0.473 91 1.078 150
0.14 33 0.48 92 1.093 151
0.144 34 0.488 93 1.108 152
0.149 35 0.495 94 1.124 153
0.154 36 0.503 95 1.14 154
0.158 37 0.511 96 1.157 155
0.163 38 0.518 97 1.173 156
0.168 39 0.525 98 1.19 157
0.173 40 0.533 99 1.208 158
0.178 41 0.541 100 1.226 159
0.183 42 0.549 101 1.244 160
0.188 43 0.557 102 1.263 161
0.192 44 0.565 103 1.283 162
Page 187
0.197 45 0.573 104 1.303 163
0.202 46 0.581 105 1.323 164
0.208 47 0.59 106 1.345 165
0.213 48 0.599 107 1.368 166
0.218 49 0.607 108 1.391 167
0.223 50 0.615 109 1.416 168
0.228 51 0.624 110 1.442 169
0.233 52 0.633 111 1.47 170
0.239 53 0.642 112 1.499 171
0.244 54 0.651 113 1.532 172
0.249 55 0.66 114 1.569 173
0.255 56 0.669 115 1.614 174
0.26 57 0.679 116 1.673 175
0.266 58 0.688 117
0.271 59 0.698 118