S. M. TANG,* S. H . TANG, T. S. TAY, and A. T. R E T T Y Department of Physics, National University of Singapore, Singapore 0511 (S.M.T., S.H.T.); Elvin Gems Pte. Ltd., 79 Jalan Taman, Singapore 1232 (T.S.T.); and Retry Enterprises, 3 Lengkok Merak, Singapore 1024 (A.T.R.)
Trace element analysis of 60 Burmese and Thai rubies by using the technique of proton-induced x-ray emission was carried out. It was found that the Burmese rubies contained higher concentrations of all impurities except iron. Our results also reveal that vanadium and iron are useful indicators for Burmese and Thai ruby attribution. The Thai rubies have high contents of iron and very low concentrations of vanadium. On the other hand, all the Burmese rubies examined contain significant amounts of vanadium, and their iron contents are, on the average, four times lower than those in the Tha i rubies.
Index Headings: Proton-induced x-ray emission; Gemstones .
INTRODUCTION
Burma and Thailand are the major sources of natural rubies. One of the two methods which have been used to distinguish the Burmese ruby from the Thai ruby is the examination of their colors. Colors of Burmese rubies range from pale pinkish red to deep red, and some fine- quality but rare Burmese rubies have a vivid "pigeon's blood" color. 1 Thai rubies exhibit color variations from strongly violet to deep crimson 2 but typically have brownish to purplish overtones. Identification of these rubies by their colors can be subjective and may not always be reliable. The other method employed by gem- ologists and experienced gem dealers is to look at the ruby inclusions by using a microscope. Many Burmese rubies contain crystalline inclusions of rutile, spinels, or calcite rhombs; 3 some exhibit short rutile needles ar- ranged in prismatic patterns, 4 while others have a growth structure with a "heatwave effect" appearance. 4 The most common inclusions in Thai rubies are subhexagonal to rounded opaque metallic grains of pyrrhotite, yellowish hexagonal platelets of apatite, and reddish brown al- mandite garnets2 ,6 These inclusions are usually sur- rounded by circular feathers and polysynthetic twinning planes. 7 Excellent illustrations and discussion of inclu- sions in gemstones can be found in a recent book by Gubelin and Koivula2 While a conclusive identification can usually be achieved by examining the inclusions, problems may still arise from the lack of characteristic inclusions or the absence of any inclusion in some rubies.
The characteristic color and inclusion of rubies from a certain source are obviously linked to the source's ge- ology. Most Burmese rubies are mined mainly in and around the Mogok region. The geology of this area is very complex, comprising mainly high-grade metamorphic schists and gneisses, granite intrusives, and the ruby- bearing metamorphic marble. Rubies from this region are chrome-rich, and this factor is believed I to give rise to the "pigeon's blood" color. The majority of the Thai
Received 10 April 1987; revision received 18 J u n e 1987. * Au tho r to whom correspondence should be sent .
rubies are mined from alluvial deposits in the Chantha- buri-Trat district. These secondary gem deposits come from weathered basaltic dykes formed in the early and middle Tertiary Orogenic period 9 and have an iron-rich nature. The brownish to purplish overtones of the Thai rubies have been attributed to their characteristically high concentrations of irony
Since some Burmese and Thai rubies cannot be iden- tified by either color or inclusions, there is a need to search for additional criteria by which to distinguish them. This article reports the results of our at tempt to develop such criteria by deploying the technique of proton-in- duced x-ray emission to analyze quantitatively the con- tents of chromium and iron as well as other trace ele- ments in a sizable quantity of Burmese and Thai rubies.
EXPERIMENTAL
The measurements were made with the use of 2 MeV protons produced from the 2.5 mV Van de Graaff ac- celerator at the National University of Singapore. The proton beam was collimated with a set of diaphragms that gave a beam spot of 4 mm diameter at the target position. Throughout the experiment, the proton beam was maintained at an average value of about 8 nano- amperes. A Si(Li) detector with a sensitive area of 36 mm 2 and a 0.007-mm-thick beryllium window was used for obtaining the x-ray spectra. The detector was placed outside the sample chamber against a 0.036-mm-thick hostaphan window of the chamber and at an angle of 90 ° to the beam. A manually operated sample ladder of 220 mm total displacment length was used for sample mount- ing. Ten samples can be mounted on the ladder simul- taneously. The samples were supported with adhesive tape that was free from interfering impurities. The counting time for each sample was 150 s.
The Samples. A total of 60 samples were studied. Twenty-nine of them were Burmese rubies purchased from several ruby wholesale markets in Thailand. The rest were obtained directly from gem cutters in Chan- thaburi and hence were believed to be rubies mined around that area. The samples were examined by two of the authors, Tay and Ret ty (gemologists and experienced gem dealers), prior to the experiment. The origins of the majority of the samples could be identified by their colors and inclusions. Thirty-one of these showed a medium dark purple-brownish red color--a typical color for Thai rubies. Among these thirty-one samples, twenty-eight had characteristic Thai ruby inclusions such as crystal pyrrhotite and polysynthetic twinning planes. The other twenty-nine samples exhibited Burmese ruby character- istics, displaying a light-to-medium pinkish red color and containing rutile needles, spinel crystals, or heat-wave-
ENERGY FIG. 1. Typical x-ray spectra of the Burmese (a) and the Thai (b) rubies obtained by 2 MeV proton excitation.
effect inclusions. Hence, of the sixty samples, three could not be definitely identified by their inclusions• All sam- ples were cleaned with acetone to remove any surface contamination before they were placed in the sample chamber for measurement.
Qualitative Characteristics. Over ten trace elements were observed in varying concentrations in all of the samples studied. The more prominent ones were Cr and Fe. Those present in less abundance but in most samples were Si, S, C1, K, Ca, Ti, V, and Mn. An observable amount of Ga was found in many samples. Other ele- ments detected in some of the rubies included Ni, Cu, and Zn. Figure la and lb show, respectively, the typical x-ray spectra of the Burmese and the Thai rubies. The striking differences between them are the apparent pres- ence of the V K~ peak in the former and the relatively high Fe Ks line in the latter.
The existence of the V K~ peak in all the spectra of the Burmese rubies is obvious by visual inspection, de- spite the presence of the interfering Ti K~ line. On the other hand, all except one of the Thai rubies have very low vanadium contents, and none of their spectra show a distinct V K. peak.
Generally, the Thai rubies have higher iron concen- trations than the Burmese rubies. However, their ranges of concentration do overlap. For a qualitative analysis of the spectra, it is convenient to compare the Fe K. intensity with the intensity of the neighboring Cr K. line.
The intensity ratio R = I(Fe K~)H(Cr K,) is below 0.3 for more than two-thirds of the Burmese samples. Over two-thirds of the Thai rubies, however, have R values greater than 0.7. The frequency distribution of such in- tensity ratios for each of the two groups of samples is shown in Fig. 2. It can be seen that no Burmese sample has an I(Fe K.)H(Cr K~) ratio greater than 0.7.
The only Thai sample that was found to contain a relatively high vanadium concentration was also f o u n d to have the lowest iron content of all the Thai rubies. In fact, the x-ray spectrum of this sample exhibits the typ- ical feature observed in the spectra of the Burmese ru- bies. This sample is also one of those which cannot be attributed definitely by its color and inclusions. There- fore, it is highly possible that the sample is of Burmese origin. It is not uncommon that gemstones are brought from Burma to Chanthaburi, because gem trading is much more active there. If this particular sample is indeed a Burmese ruby, then our results show that the distinction between the Burmese ruby and the Thai ruby can be based on their vanadium and/or iron contents.
Quantitative Analysis. The program AXIL 1° (_Analysis of X-ray spectra by !terative Least-squares fitting, ver- sion 04) was used on a PRO350 DEC microcomputer to determine the integrated counts of the x-ray peaks. The factors for converting the integrated counts to concen- trations were obtained by means of calibration stan- dards. Since rubies are corundum and contain 96-99 % n
APPLIED SPECTROSCOPY 45
Z
o '
15
10
0
10
5
Burmese rubies
% Thai rubies
0.0 0.5 1.0 1.5 2.0
I / I Fe K a / Cr K a
FIG. 2. Frequency distributions of the Fe K~ intensity to Cr K~ in- tensity ratio for the Burmese and the Thai rubies.
A1203, our calibration standards were made with the use of A12Oz powder as the matrix. Several standards were prepared in duplicate, each containing 2-3 % of two or three of the following elements and compounds : Si, S, CaCO3, Ti02, V205, Cr03, MnO2, and Fe20~. The ele- ments and compounds used to prepared the standards were of AR grade and in fine powder ~orm. They were mixed thoroughly with the A1203 matrix and some starch before being hydraulically pelletized at 190,000 psi. These calibration standards weighed about 1 gram each and had a diameter of 12 mm. Starch was used as a binder. It was found that an aluminum oxide pellet could crack easily if less than 10 % starch was added. We had made an experimental investigation and found that adding up to 25% of starch in making the standards would not result in any significant effect on the calibration. The calibration curve obtained with the standards is shown in Fig. 3. It is a plot of relative detection efficiency of the system vs. atomic number. Aluminum is taken as the reference and assigned a relative efficiency of 1.
Tables I and II give the concentrations of those trace elements observed in most of the samples. Other minor trace elements observed, namely Ni, Cu, Zn, and Ga, were not included in these tables, since they were present only in some of the samples and in relatively low concentra- tions. The sample that has a high content of vanadium
46 Volume 42, Number 1, 1988
~9 Z
~9
10 2
I0 i
i0 °
Ca
t I ! ! !
I I
I I
Ti V
%% Cr]~ n
~0% Fe
I I I I I
I ! ! ! ! I ! ! !
? I
15
0,% %
X
I I
10 20 25 30
ATOMIC NUMBER
Fro. 3. Relative detection efficiency curve obtained with calibration standards.
and was originally presumed to be a Thai ruby is now included in the Burmese group and labeled as sample BR30 in Table I. The concentrations are expressed in wt % with respect to A1203. The average concentration for each element is also shown. These results show that, on the average, the Burmese rubies contain higher concen- trations of all impurities except iron. In addition to va- nadium, which has already been mentioned, silicon and chromium are also present, at significantly higher con- centrations in the Burmese rubies than in the Thai ru- bies. However, concentrations of these elements vary substantially among individual samples within each species.
The element Ga was observed in 19 Burmese samples, with concentrations varying from 0.003% to 0.010%. Among the Thai samples, only 6 showed the presence of Ga in concentrations between 0.001 and 0.003 %.
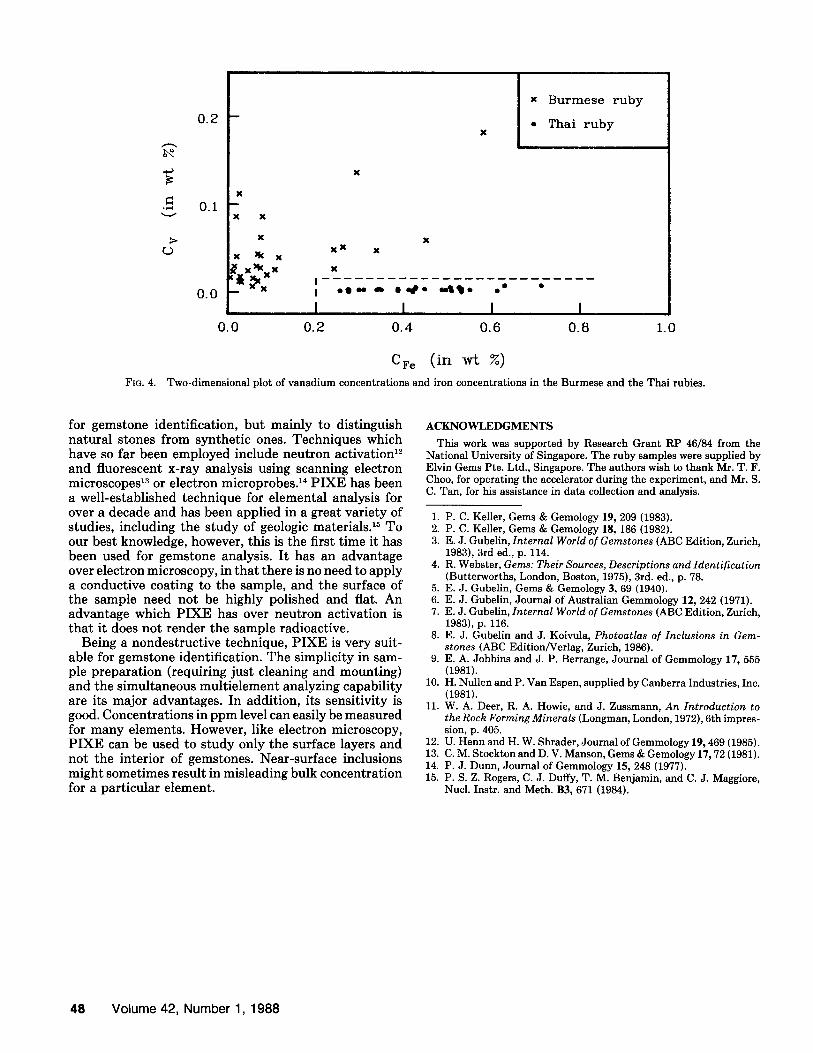
A two-dimensional plot of vanadium concentrations and iron concentrations in the Burmese and the Thai rubies is presented in Fig. 4. This plot clearly shows that data obtained with the Thai rubies form a cluster in the region bounded by Cv = 0.02 and CFe = 0.2 (dotted line).
DISCUSSION
Our results reveal some important characteristics of the Burmese and the Thai rubies. A selection of 60 sam- ples is deemed sufficient for establishing a preliminary
TABLE I. Trace elements in the Burmese rubies (in wt % w.r.t. A1203).
c r i t e r i o n t o d i f f e r e n t i a t e r u b i e s f r o m t h e s e t w o r e g i o n s . T h e m a i n q u e s t i o n is e x a c t l y w h e r e t h e l i n e o f b o u n d a r y in F ig . 4 s h o u l d be . T h e l eve l o f c o n f i d e n c e in a n y b o u n d - a r y e s t a b l i s h e d c a n b e i n c r e a s e d o n l y b y f u r t h e r s t u d y
TABLE II. Trace elements in the Thai rubies (in wt % w.r.t. A1203).
o f m o r e s a m p l e s . N e v e r t h e l e s s , v a n a d i u m a n d i r o n a r e d e f i n i t e l y u s e f u l i n d i c a t o r s fo r d i s t i n g u i s h i n g t h e B u r - m e s e r u b y f r o m t h e T h a i r u b y .
T r a c e e l e m e n t a n a l y s i s h a s b e e n u s e d fo r m a n y y e a r s
Two-dimensional plot of vanadium concentrations and iron concentrations in the Burmese and the Thai rubies.
for gemstone identification, but mainly to distinguish natural stones from synthetic ones. Techniques which have so far been employed include neutron activation 12 and fluorescent x-ray analysis using scanning electron microscopes 13 or electron microprobes2 4 PIXE has been a well-established technique for elemental analysis for over a decade and has been applied in a great variety of studies, including the study of geologic materials. 15 To our best knowledge, however, this is the first time it has been used for gemstone analysis. It has an advantage over electron microscopy, in that there is no need to apply a conductive coating to the sample, and the surface of the sample need not be highly polished and fiat. An advantage which PIXE has over neutron activation is that it does not render the sample radioactive.
Being a nondestructive technique, PIXE is very suit- able for gemstone identification. The simplicity in sam- ple preparation (requiring just cleaning and mounting) and the simultaneous multielement analyzing capability are its major advantages. In addition, its sensitivity is good. Concentrations in ppm level can easily be measured for many elements. However, like electron microscopy, PIXE can be used to study only the surface layers and not the interior of gemstones. Near-surface inclusions might sometimes result in misleading bulk concentration for a particular element.
ACKNOWLEDGMENTS
This work was supported by Research Grant RP 46/84 from the National University of Singapore. The ruby samples were supplied by Elvin Gems Pte. Ltd., Singapore. The authors wish to thank Mr. T. F. Choo, for operating the accelerator during the experiment, and Mr. S. C. Tan, for his assistance in data collection and analysis.
1. P. C. Keller, Gems & Gemology 19, 209 (1983). 2. P. C. Keller, Gems & Gemology 18, 186 (1982). 3. E.J. Gubelin, Internal World of Gemstones (ABC Edition, Zurich,
1983), 3rd ed., p. 114. 4. R. Webster, Gems: Their Sources, Descriptions and Identif ication
(Butterworths, London, Boston, 1975), 3rd. ed., p. 78. 5. E. J. Gubelin, Gems & Gemology 3, 69 (1940). 6. E. J. Gubelin, Journal of Australian Gemmology 12, 242 (1971). 7. E.J. Gubelin, Internal World of Gemstones (ABC Edition, Zurich,
1983), p. 116. 8. E. J. Gubelin and J. Koivula, Photoatlas of Inclusions in Gem-
stones (ABC Edition/Verlag, Zurich, 1986). 9. E. A. Jobbins and J. P. Berrange, Journal of Gemmology 17, 555
(1981). i0. H. Nullen and P. Van Espen, supplied by Canberra Industries, Inc.
(1981). 11. W. A. Deer, R. A. Howie, and J. Zussmann, An Introduction to
the Rock Forming Minerals (Longman, London, 1972), 6th impres- sion, p. 405.
12. U. Henn and H. W. Shrader, Journal of Gemmology 19, 469 (1985). 13. C.M. Stockton and D. V. Manson, Gems & Gemology 17, 72 (1981). 14. P. J. Dunn, Journal of Gemmology 15, 248 (1977). 15. P. S. Z. Rogers, C. J. Duffy, T. M. Benjamin, and C. J. Maggiore,