19
Analysis of Changing Hydrologic Extremes using the VIC model Daeryong Park and Momcilo Markus Illinois State Water Survey September 25 2012
| Date post: | 14-Feb-2017 |
| Category: |
Documents |
| Upload: | trinhkhuong |
| View: | 225 times |
| Download: | 3 times |

Analysis of Changing Hydrologic Extremes using the VIC model
Daeryong Park and Momcilo Markus
Illinois State Water Survey
September 25 2012
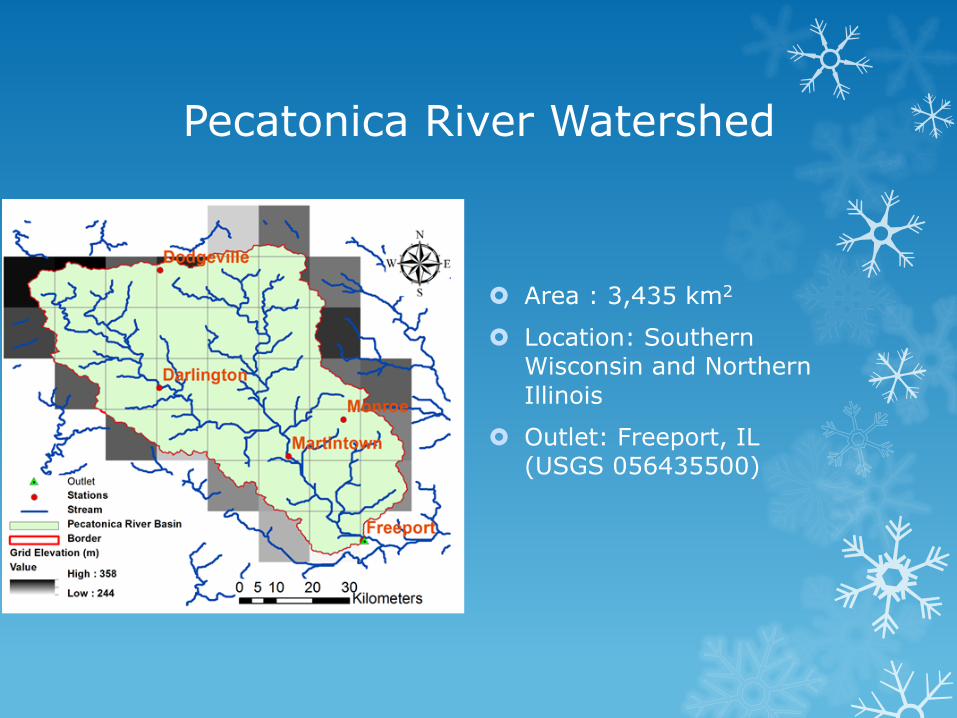
Pecatonica River Watershed
� Area : 3,435 km2
� Location: Southern Wisconsin and Northern Illinois
� Outlet: Freeport, IL (USGS 056435500)

Study Goals
� To test the applicability of the Variable Infiltration Capacity model in a flood frequency study
� To provide an explanation for the decreasing trend in winter flood peaks at Freeport on the Pecatonica River.

Trend of Peak Streamflow
(a) complete dataset
(b) February and March
(c) April through January
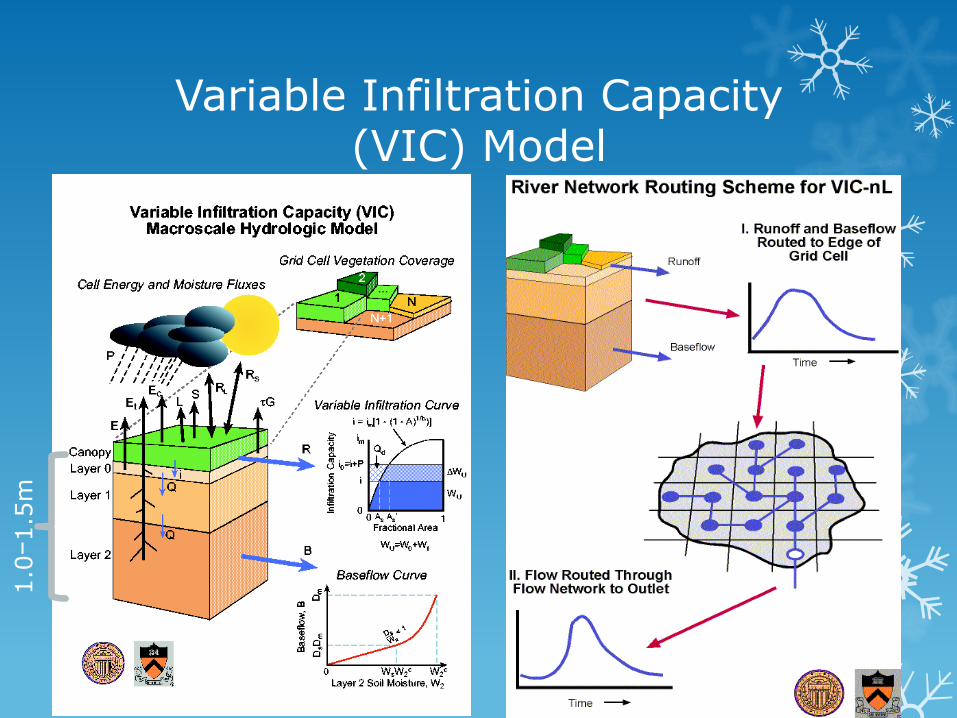
Variable Infiltration Capacity (VIC) Model
1.0−
1.5m

Input Data (1/8° degree grid size-approximately 10x12 km)
� Vegetation Library File � From USGS Global Land Cover Characteristics Database (about 30
vegetation classes)
� Changes in surface roughness and leaf area index (LAI)
� Vegetation Parameter File � From North American Land Data Assimilation System
(NLDAS)
� Soil Parameter File � From NLDAS Parameters web site
� Extract soil characteristics from the Natural Resource Conservation Service’s State Soil Geographic Database (STATSGO)
� Climate Forcing File (1915~2009) � NCDC Daily Precipitation (mm)
� NCDC Daily Minimum and Maximum Temperature (°C)
� Daily Wind Speed (NCEP/NCAR)
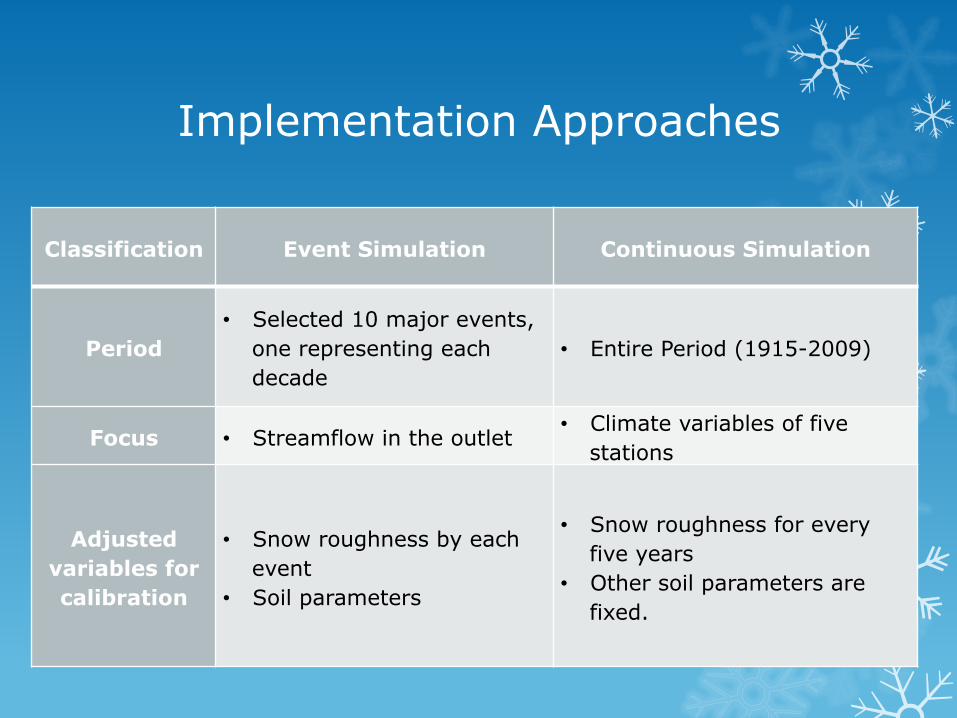
Implementation Approaches
Classification Event Simulation Continuous Simulation
Period • Selected 10 major events,
one representing each decade
• Entire Period (1915-2009)
Focus • Streamflow in the outlet • Climate variables of five
stations
Adjusted variables for calibration
• Snow roughness by each event
• Soil parameters
• Snow roughness for every five years
• Other soil parameters are fixed.
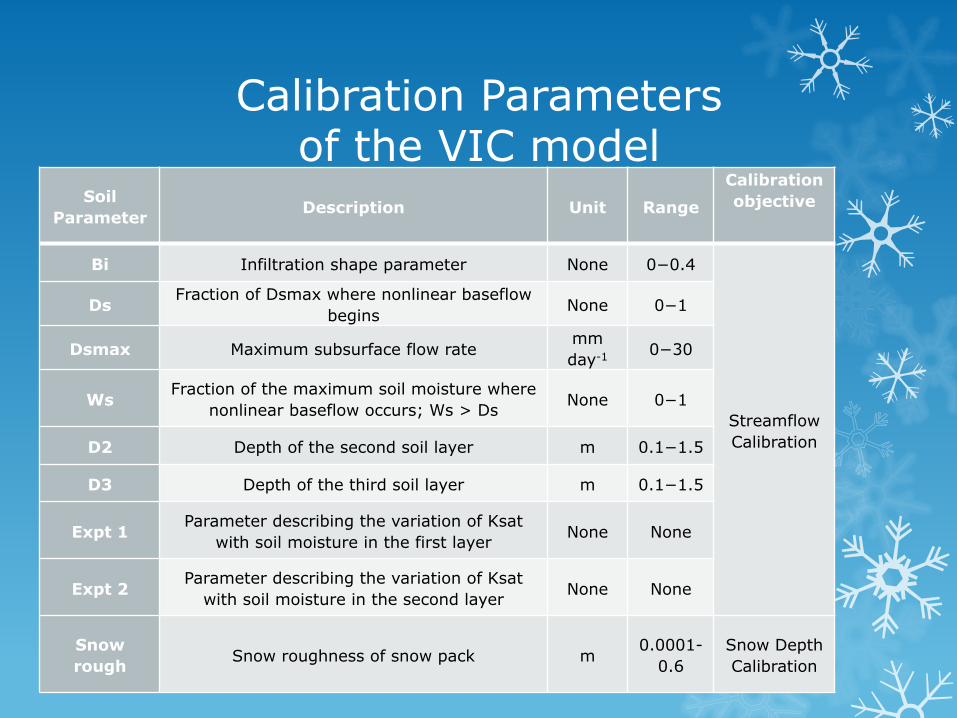
Calibration Parameters of the VIC model
Soil Parameter Description Unit Range
Calibration objective
Bi Infiltration shape parameter None 0−0.4
Streamflow Calibration
Ds Fraction of Dsmax where nonlinear baseflow
begins None 0−1
Dsmax Maximum subsurface flow rate mm day-1 0−30
Ws Fraction of the maximum soil moisture where
nonlinear baseflow occurs; Ws > Ds None 0−1
D2 Depth of the second soil layer m 0.1−1.5
D3 Depth of the third soil layer m 0.1−1.5
Expt 1 Parameter describing the variation of Ksat
with soil moisture in the first layer None None
Expt 2 Parameter describing the variation of Ksat
with soil moisture in the second layer None None
Snow rough Snow roughness of snow pack m
0.0001-0.6
Snow Depth Calibration

Results
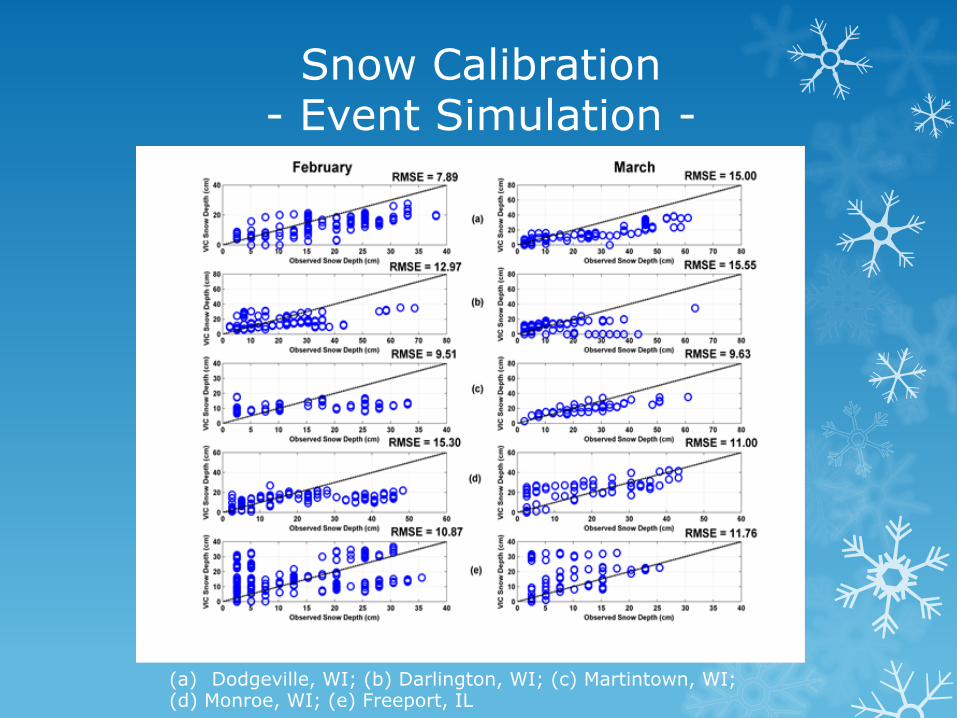
Snow Calibration - Event Simulation -
(a) Dodgeville, WI; (b) Darlington, WI; (c) Martintown, WI; (d) Monroe, WI; (e) Freeport, IL

Peak Streamflow - Event Simulation -

Trend of Nine Variables - Event Simulation –
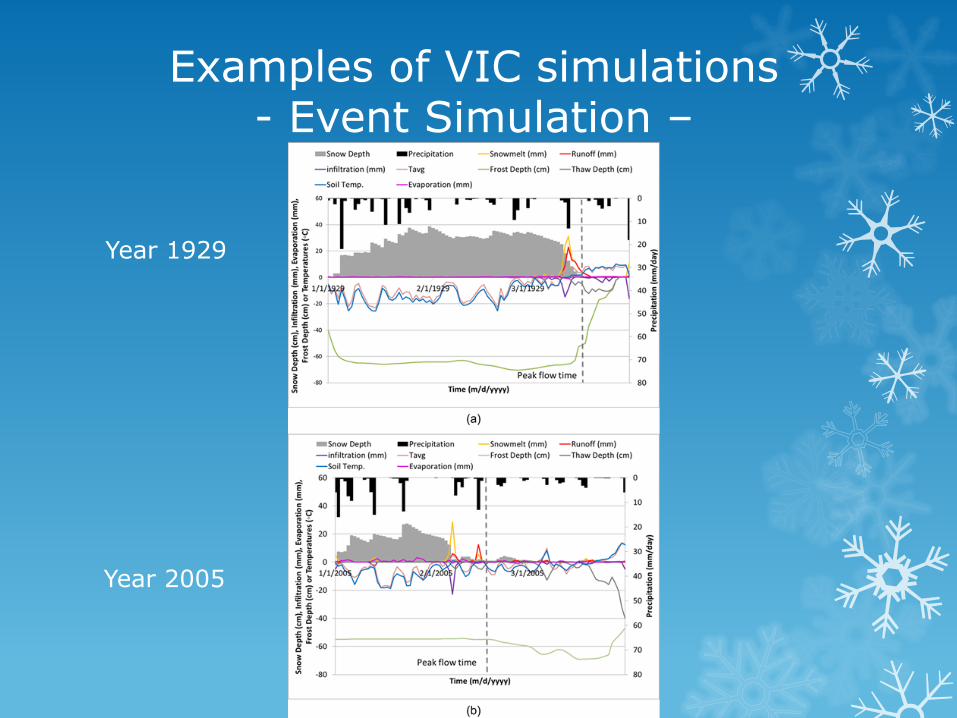
Examples of VIC simulations - Event Simulation –
Year 1929
Year 2005
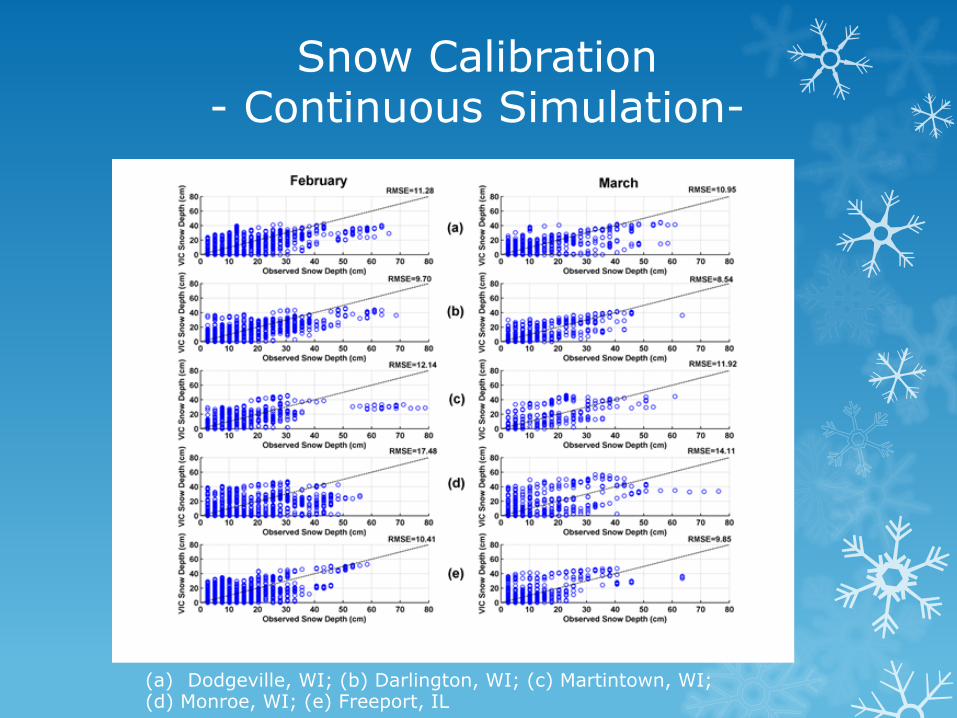
Snow Calibration - Continuous Simulation-
(a) Dodgeville, WI; (b) Darlington, WI; (c) Martintown, WI; (d) Monroe, WI; (e) Freeport, IL

Peak Streamflow - Continuous Simulation-
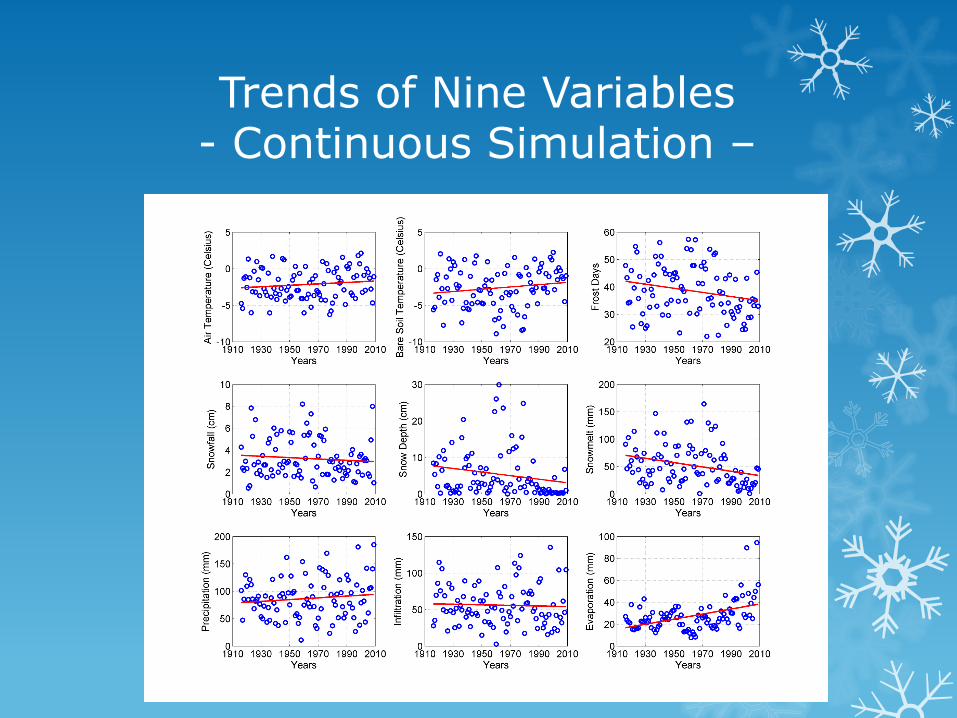
Trends of Nine Variables - Continuous Simulation –
Summary
� Snow fall, snow depth, snow melt and frost days show decreasing trend.
� Air temperature, bare soil temperature, precipitation, evaporation show increasing trend.
� Trends of these variables are consistent with increasing air temperature.

Conclusions
� VIC can simulate successfully snow accumulation and ablation process.
� VIC model can simulate peak event very accurately for event simulations.
� VIC provided a reasonable explanations for the decreasing winter flood peaks in the Pecatonica River

Thank you!
Questions?


