Proceeding of the 1st International Conference on Public Health, Vol. 1, 2015, pp. 23-29
Copyright © TIIKM
ISSN: 2324 – 6735 online
DOI: 10.17501/ icoph 2015-1104
231st International Conference on Public Health, 13th - 14th May 2015, Colombo, Sri Lanka
ANALYSIS OF CHILD ANTHROPOMETRIC
INDICATORS AND THEIR RESPECTIVE
DETERMINANTS IN INDIA
Naline, G1 and Viswanathan,B2
Madras School of Economics, Gandhi Mandapam Road, Chennai (India)
Abstract
With the MDG’s set to expire this year (2015), the achievements in the progress of child health
indicators in India has failed to distribute the fruits of the development evenly among the States and
also within states; as in one State performing well in one indicator and not in another indicator. The
main objective is to identify the predictors of child under nutrition and to analyze the differences in
the impact of determinants across the three indicators and between States. With NFHS 3 data, the
SUR technique is used to improve the efficiency of regression estimates as one hand errors in the
measurement in individual height for age and weight for age and weight for height is likely to be
correlated (contemporaneous correlation) and on the other hand other household level omitted
variables for a child belonging to the same household could also be correlated. Breusch-Pagan LM
Diagonal Covariance Matrix Test was used to check the appropriateness of SUR model. Different
regressors are found to be significant for three indicators. The CDF plot indicates there is a clear
convergence after the threshold point. The outcome of ICDS adoption varies across wealth groups
where from the poorest to richest category, median is increasing as a step function. Since nutrition
depends on various factors, the linkage of nutrition with sanitation policies, environment policies,
agriculture related policies and infrastructure is extremely needed to address under-nutrition.
Keywords: Child under-nutrition stunting, underweight, wasting, seemingly unrelated regression,
India
INTRODUCTION
Once child health is considered as an end in itself then any
health outcome variable based on child health automatically
becomes a significant component for economists and policy
makers to assess the triumph or malfunction of the various
policy interventions. Infants and young children are more
susceptible to infections and providing a disease free
environment both from a preventive and curative sense is a
major public health priority for any nation. Child’s height
and weight or the nutritional status can be viewed as an
outcome of the health production function (Becker, 1964
and Grossman, 1972) where the inputs include intake of
nutrients and diet patterns (Bhagowalia, 2010; Smith et al.,
2012; Martorell & Young, 2011.) exposures to infections
(Ramachandran & Gopalan, 2009), genetic dispositions
(Currie & Moretti, 2007 and Ackerson et. al, 2009) and
access to health care (Mosley & Chen, 1984).
Socio-economic inequalities in health outcomes are
becoming the emerging area of research in health literature
which ultimately affects the economic growth of the
country. In spite of tremendous progress the gains and
deprivations are unevenly distributed among the countries.
In South Asia moderate and severe stunting is around 38%
in 2012 and in Latin America it is around 11%. Some 6.6
million children under 5 years of age died in 2012, mostly
from preventable causes (UNICEF, Every Child Counts,
2014). India continues to have high levels of malnutrition in
some regions while in regions that have shown reductions
in the past three to four decades have somewhat stagnated
and slow changes are being observed (IFPRI, The
Challenge of Hidden Hunger Report, 2014 and IPPR
Report of Tackling Poverty, Hunger and Malnutrition,
2014).
Child undernutrition places a massive burden on the macro
economy and also it is a pressing alarm being addressed by
the government, and it is prominent to note according to the
Summary report of Progress towards Meeting the MDG’s,
2012, the child malnutrition target only has a small
likelihood of being met in India, further increasing the
severity of the situation. With the prevailing measures and
methodologies, various research studies have estimated the Corresponding Author Email: [email protected]
G. Naline and B. Viswanathan, / Analysis of Child Anthropometric Indicators and Their……….
24
most powerful indicators of child health such as
underweight, stunting and wasting, which embraces the
child level variables, household characteristics, parental
(mother and father) characteristics and policy related
variables. The methodologies for defining child health
outcomes are new and still in development. Major
approaches which have been used in the literature are factor
analysis (Menon, et al., 2000); cluster analysis, and linear
regression techniques, index methodologies
(Radhakrishnan & Ravi, 2004; Svedberg, 2007, Kanjilal, et
al.,2010); Concentration indices (Arokiasamy & Pradhan,
2011, Majumdar,2010), child under nutrition index,
composite index, infant and feeding index (Menon et. al,
2000; Svedberg, 2007 Ghaiha et. al, 2012) and multilevel
analysis (Subramanian et. al, 2009) .) However, there are
very few studies in the empirical literature on child
developmental outcomes that consider a unified approach
which combines all the important indicators of child growth
in particular or child health in general (Ghaiha et. al,2012
and Bhangura, 2014) It has been observed that different
indicators of child health outcomes like mortality,
morbidity or undernutrition as well as its different
components like perinatal or neo-natal mortality; stunting
or underweight respond to some common interventions but
are also quite varied in its temporal changes across different
geographical reasons (Viswanathan, 2014b). Such an
uneven nature of progress has been rather pronounced for a
country like India and evidence based policy making with a
unified approach becomes an important tool of analysis for
assessing the overall child growth pattern by considering
the child’s health as a composite indicator.
The objective of this study is to assess the nutritional
outcomes of children in India using an empirical framework
that not only gives scope for individual assessment but also
considers child as a single unit. This is possible using the
econometric technique of Seemingly Unrelated Regressions
(SUR) by estimating a set of equations jointly, with each
representing an anthropometric indicator. More
importantly, the aim is also to focus on an important policy
intervention viz, Integrated Child Development Services
(ICDS) in India on these different indicators while also
trying to understand (and control for) several other factors
that are likely to influence child growth. The study hopes to
provide further insights towards reduction in undernutrition
among young children in India.
The next section discusses the data and methodology.
Section 3 discusses the main findings of this study and the
last section briefly concludes this studies.
DATA AND METHODOLOGY
The study uses the third wave of the National Family
Health Survey for the year 2005-06 (IIPS, 2007). This is a
nationally representative survey of households (104302)
which has anthropometric data for the children(51,555)
aged 0-59 months, where 19483(38%) are the urban
household children and 32043(67%) are the rural household
children and the most recent survey on child nutrition
indicators that covers all the states of India with a wide
range information on socio-economic aspects. In spite of a
vast literature on child nutrition using this database, there
are several issues of relevance that are open to as
mentioned in the objective of this paper.
The SUR (Seemingly Unrelated Regression) model
This model proposed by Zellner (1962) is used for this
study wherein a three-equation system with dependant
variables such as HAZ (height for age), WAZ (weight for
age) and WHZ (weight for height) for children is specified.
The method allows for potentially different set of
explanatory variables and hence enriches the analysis
further. The z-score is adjusted for sex, age and
measurement and how far or close the child is to the
median value of the WHO reference standards (2006).iThe
model is represented as : Y = X + U
with
1Cx33
2
1
1kx3
2
1
Cxk33
2
1
1Cx33
2
1
U
U
U
X00
0X0
00X
Y
Y
Y
β
β
β
Y1 is HAZ (height for age), Y2 is WAZ(weight for age), Y3
is WHZ(weight for height); Xi is the vector of child level,
parental level and household level characteristics as well as
policy relevant and regional variables for the ith
anthropometric indicator thus allowing for different set of
explanatory variables (ki) for the different equations. The
vector i are the different coefficients to be estimated with
k1, k2 and k3 coefficients for the respective equation such
that the total number of coefficients is k= k1+k2 +k3. U is
the vector of residuals E(U)=0; E(UU)==I with
=ij, where ij=E(UiUj), i,j=1,2,3. If cl is the lth child in
the sample, then this correlation structure assumes that the
errors are correlated across the indicators for each child but
uncorrelated across different children where C the total
number of children in the sample.
X is a vector which comprises of the explanatory variables.
The model is distinct from OLS as the explanatory
variables are not same for all the system of equations and
the error terms will be correlated across equations and SUR
model requires the sample to be same for each equation.
The model was estimated with common set of child
variables (child age, gender, birth size, birth order,
vaccination, incidence of fever, cough, diarrhea and policy
variables) in each of the indicators while parental and
Proceeding of the 1st International Conference on Public Health, Vol. 1, 2015, pp. 23-29
25
Cut off point Z<-2
Height for Weight( Wasting)
Weight for Age(Underweight)
Height for Age(Stunting)
0.2
.4.6
.81
-5 0 5
Height For Age Weight for Age
Height for Weight
household variables varied across the indicator equations.
Along with a brief discussion about the nature of these
variables, the next section discusses the findings of the
model estimation,
RESULTS
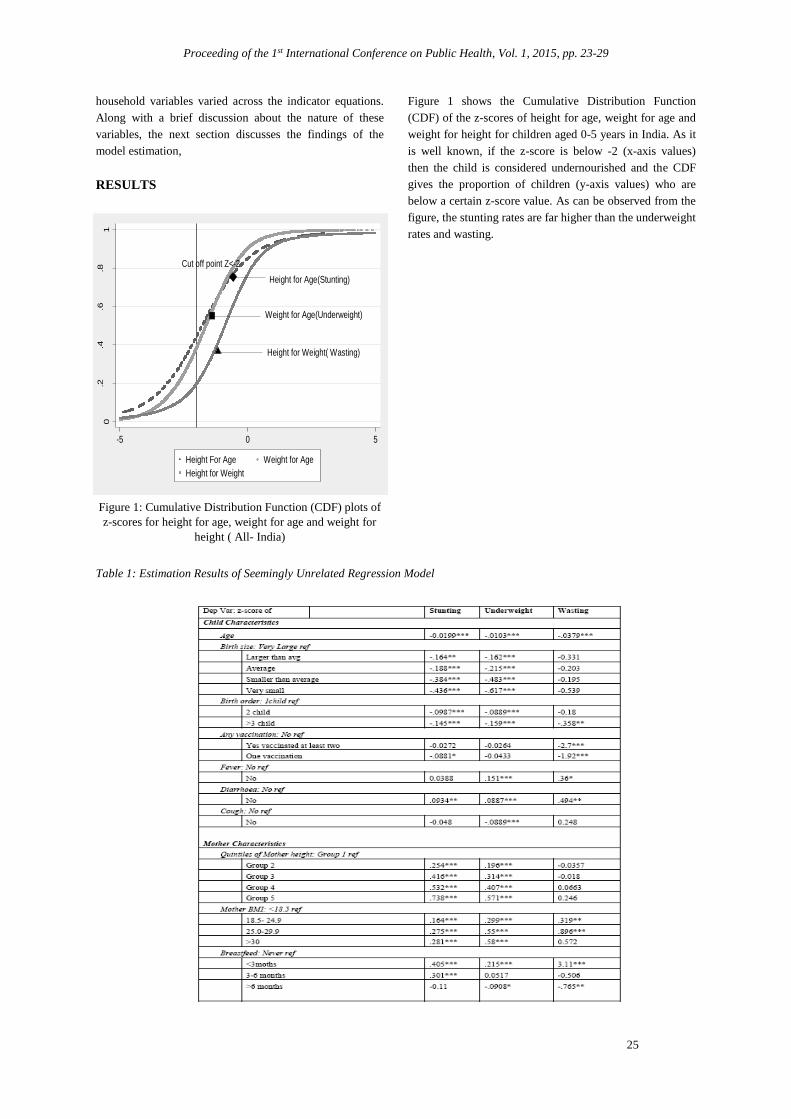
Figure 1: Cumulative Distribution Function (CDF) plots of
z-scores for height for age, weight for age and weight for
height ( All- India)
Figure 1 shows the Cumulative Distribution Function
(CDF) of the z-scores of height for age, weight for age and
weight for height for children aged 0-5 years in India. As it
is well known, if the z-score is below -2 (x-axis values)
then the child is considered undernourished and the CDF
gives the proportion of children (y-axis values) who are
below a certain z-score value. As can be observed from the
figure, the stunting rates are far higher than the underweight
rates and wasting.
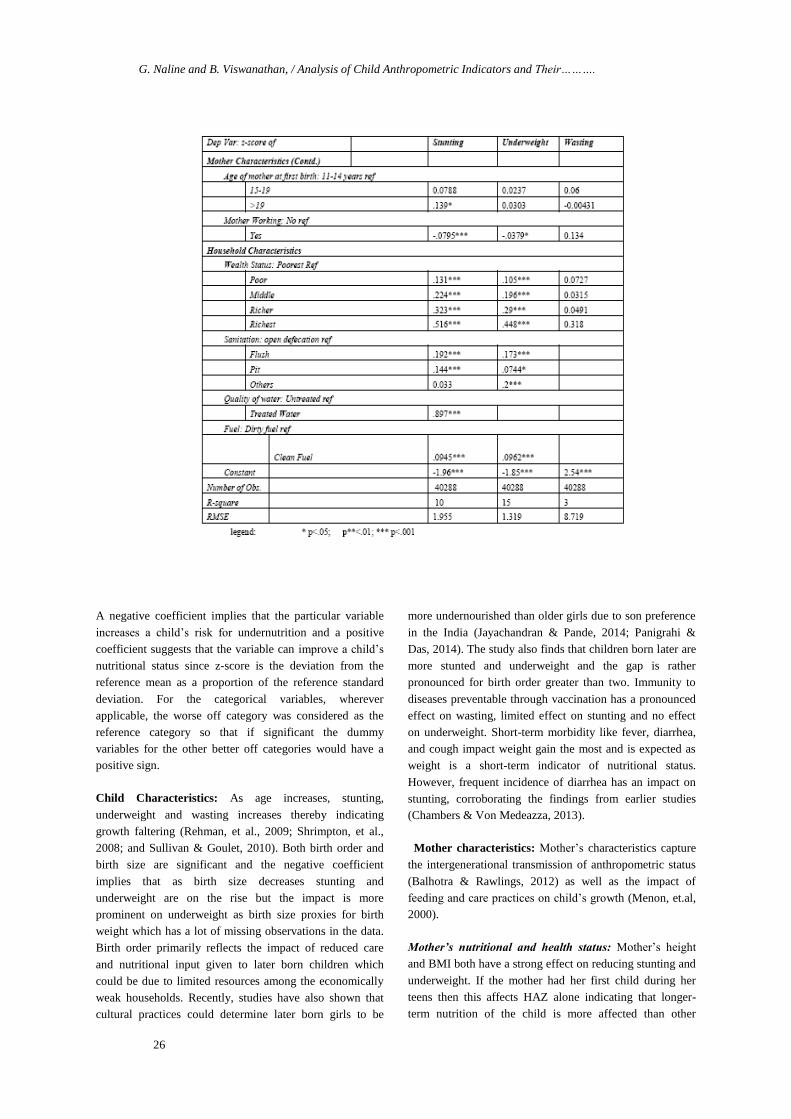
Table 1: Estimation Results of Seemingly Unrelated Regression Model
G. Naline and B. Viswanathan, / Analysis of Child Anthropometric Indicators and Their……….
26
A negative coefficient implies that the particular variable
increases a child’s risk for undernutrition and a positive
coefficient suggests that the variable can improve a child’s
nutritional status since z-score is the deviation from the
reference mean as a proportion of the reference standard
deviation. For the categorical variables, wherever
applicable, the worse off category was considered as the
reference category so that if significant the dummy
variables for the other better off categories would have a
positive sign.
Child Characteristics: As age increases, stunting,
underweight and wasting increases thereby indicating
growth faltering (Rehman, et al., 2009; Shrimpton, et al.,
2008; and Sullivan & Goulet, 2010). Both birth order and
birth size are significant and the negative coefficient
implies that as birth size decreases stunting and
underweight are on the rise but the impact is more
prominent on underweight as birth size proxies for birth
weight which has a lot of missing observations in the data.
Birth order primarily reflects the impact of reduced care
and nutritional input given to later born children which
could be due to limited resources among the economically
weak households. Recently, studies have also shown that
cultural practices could determine later born girls to be
more undernourished than older girls due to son preference
in the India (Jayachandran & Pande, 2014; Panigrahi &
Das, 2014). The study also finds that children born later are
more stunted and underweight and the gap is rather
pronounced for birth order greater than two. Immunity to
diseases preventable through vaccination has a pronounced
effect on wasting, limited effect on stunting and no effect
on underweight. Short-term morbidity like fever, diarrhea,
and cough impact weight gain the most and is expected as
weight is a short-term indicator of nutritional status.
However, frequent incidence of diarrhea has an impact on
stunting, corroborating the findings from earlier studies
(Chambers & Von Medeazza, 2013).
Mother characteristics: Mother’s characteristics capture
the intergenerational transmission of anthropometric status
(Balhotra & Rawlings, 2012) as well as the impact of
feeding and care practices on child’s growth (Menon, et.al,
2000).
Mother’s nutritional and health status: Mother’s height
and BMI both have a strong effect on reducing stunting and
underweight. If the mother had her first child during her
teens then this affects HAZ alone indicating that longer-
term nutrition of the child is more affected than other
Proceeding of the 1st International Conference on Public Health, Vol. 1, 2015, pp. 23-29
27
indicators. Early child birth affects the overall nutritional
status of the mother (Viswanathan, 2014a) thereby affecting
the nutritional status of the children she gives birth to. If the
mother lost a child (focusing on prenatal, neonatal or infant
mortality) it will affect the nutritional status of the future
offspring and this was also included to capture
intergenerational transmission where it increases the risk of
underweight.
Feeding and Care Practices: Breastfeeding has a stronger
impact on HAZ than on WAZ/WHZ. WHO recommends
the feeding of child solid foods should start when the child
is 6 months old along with breastfeeding, the survey
collected information about whether the mother gave liquid
food, solid food such as non- veg, vegetables and other
dairy products. Children who were supplemented with these
at least two food groups which were grouped from animal
protein, legumes, vitamin A rich foods and other dairy
products from their six months along with breastfeeding are
less malnourished than those who are not. Participation of
the mother in the labour market increases the level of
undernourishment of her child thereby showing that the
income effect due to her earnings overshadows the quality
of care that a mother may be able to provide due to her
presence at home all through the day during early years of
child growth, in the absence of formal or informal child-
care options and the burden of child care falling primarily
on the mother than on the father. Feeding and care practices
will also be influenced by mother’s education level.
Undernourishment levels are lower for children whose
mother has some education with higher secondary and
above level of education having substantial impact. In the
Indian context it is observed that women with no education
or less education participate in the labour market than with
middle or high levels of education (Josey, 2011).
Consequently we see that labour market participation and
employment show different kinds of impact. Once could
also interact these two variables to see if the non-linearity
shows up differently and will be attempted in a later study.
In Table 1 we observe that mother’s nutritional status
captured by her height and BMI levels has a strong impact
on child’s nutritional status capturing the impact of
intergenerational transmissions. Breastfeeding has an
impact on undernourishment but the effect is more
significant for HAZ than for other indicators. If the mother
is employed in the labour market then it lowers the child’s
nutritional status implying that this affects the time given
for early child-care care perhaps in the absence of formal or
informal child-care options and the burden of child care
falling primarily on the mother than on the father. We also
find that if the mother has not had early child birth or not
lost a child early on, or if she feeds other food supplements
focusing on dietary diversity, or if she is better educated
then they have significant positive impact on the child’s
nutritional status. These results are not reported here for
shortage of space. Most of often it is noted that height
(HAZ) of the child or long-term nutritional status is
impacted by these variables.
Household Characteristics: Economic status, socio-
demographic variables like caste, religion and household
size as well as access to basic amenities, like sanitation,
safe drinking water and less polluting cooking fuels are all
considered as household characteristics.
Economic status is captured through a categorical variable
with five categories as the data set does not provide income
or consumption expenditure. This categorical variable is
constructed based on the possession (or not) of several
consumer durable goods combined into a wealth index
using Principal Component Analysis. The first principal
component is then ranked in an increasing order and
households with the bottom 20% values are considered as
‘poorest’, the next 20% values are ‘poor; and so on with the
top 20% values as the ‘richest’ household. Compared to
children in the lowest economic strata, all the others have
better HAZ and WAZ values while WHZ is not affected at
all by economic status.
Among the social status variables caste has a significant
impact as socially disadvantaged groups have been
marginalized and discriminated historically even though
economic status has been controlled for. Underweight is
more likely among scheduled tribe children while stunting
is more among Scheduled Caste children compared to the
remaining social groups. Varied dietary habits, socio-
cultural practices across different religious groups and
discrimination against some religions could reflect in
poorer nutritional status for their children compared to
those from other religious groups (SCR, 20076). Our results
do not show variations in growth patterns across religious
groups. Sanitation in terms of open defecation, use of
untreated drinking water by the household, use of fuels like
wood, charcoal and cow-dung for cooking adversely affect
the growth pattern of children. These variables influence
the environmental conditions thereby creating disease-
prone environment- the former two for illnesses like
diarrhea and fever while the latter for respiratory illness. In
most cases one observes the impact to be more on HAZ and
WAZ than on WHZ.
With respect to demographic variables such as family size,
place of living, the results shows that the rural children are
in the risk of severe stunting so there is a remarkable
difference between rural and urban areas. If the family size
is more than 6 then the risk of undernutrition increases.
Since the incidence of diseases spreads through open
defecation and usage of unsafe drinking water, fuel
consumption it will affect the weight because of morbidity,
so variables of basic amenities like quality of water,
G. Naline and B. Viswanathan, / Analysis of Child Anthropometric Indicators and Their……….
28
-10
-5
05
Le
ng
th/h
eig
ht-
for-a
ge Z
-sco
re
Poorest Poorer Middle Richer Richest
No Yes No Yes No Yes No Yes No Yes
excludes outside values
-6
-4
-2
02
Le
ng
th/h
eig
ht-
for-a
ge Z
-sco
re
Poorest Poorer Middle Richer Richest
No Yes No Yes No Yes No Yes No Yes
excludes outside values
sanitation(Deaton & Spears, 2013), dirty/clean fuel was
added to the underweight and stunting equations and these
variables are significant and those children who are using
flush toilet and drinking treated safe water and less exposed
to dirty fuel are at the lower risk of under nutrition. The
gender of the household head implies the women headed
families children are facing higher risk of malnutrition than
the male headed families.
One of the main interests of this study is to assess the
impact of a child development scheme in place in India for
more than two decades though had a very varied presence
across the country and has been made mandatory by
judicial and legislative interventions more recently.
Integrated Child Development Services (ICDS) is supposed
to be made available to poorer regions and among poorer
households and has been shown to perform better in the
southern parts of the country. To incorporate this selection
problem, usage of ICDS by the child is interacted with
wealth status of its household and the coefficients shows
expected positive sign for the poorest(0.638) and negative
sign(-0.15) for the richest. Without interacting these two
variables if one includes only use (or non-use) of ICDS, we
find that the coefficients are negative indicating that those
with lower nutritional status access ICDS. Figures 2a and
2b shows the inequality in HAZ by wealth groups for the
Western and Southern regions of India respectively. These
two regions have been selected because the Southern region
performs well in terms of ICDS and Western region
happens to be worse. And moreover, this comparison has
been done only for stunting to highlight the fact that
appropriate young child feeding practices even among the
highest wealth quintile are extremely poor which badly
affects physical growth (World Bank Report, Nutrition in
India, 2014). The horizontal line in the middle indicates the
median. Without ICDs, median HAZ differs across wealth
groups being the lowest for the poorer households. With
ICDs, median stunting increases as a step function in
Western region. In southern region, even though the access
is higher, there exists a problem in program implementation
because it is actually not helping the poor as it intends to do
so.
Figure 2: Impact of access to ICDS on HAZ in Western and Southern Region
CONCLUSION
This study examined the determinants of nutritional
indicators with the help of SUR technique for children aged
5 and under in India. We find support for the fact that the
joint estimation of these three indicators show that the
factors affecting anthropometric status of children do vary.
The fact that older children loose out more than younger
ones, mothers who are undernourished and less educated
and less empowered, poverty, poorer access to amenities
like clean water, sanitation and less polluting cooking fuels
show that there is a lot of scope for public health
intervention. This has to come both in terms of investment
in improving the quality of facilities provided as well as
improving the access and usage of these facilities by
creating awareness. A major limitation of this study is in
the use of a decade old data in the absence of a
representative national level data on nutrition and child
growth. In the last decade India has shown tremendous
improvements in its economic growth and this should have
had a trickle-down effect. However, this growth has mainly
come in the non-agricultural sector and how this uneven
Proceeding of the 1st International Conference on Public Health, Vol. 1, 2015, pp. 23-29
29
growth would have impacted inequality in access to
resources and amenities and hence child growth remains a
matter of guess. If ICDS services are complemented with
better water, sanitation and other environment policies,
more lives of children can be saved and the impact of ICDS
could have a long term effect.
REFERENCES
Arokiaswamy, P, Pradhan, J (2011). Measuring wealth-
based health inequality among Indian children: the
importance of equity vs efficiency, Journal of Health Policy and Planning, 26 429-440.
Bhagowalia, P, Chen, S, Masters, W (2010). The
distribution of child’s nutritional status across countries and
over time, paper presented at American Agricultural
Economics Association Meeting.
Bangura, S. (2014). Fighting Undernutrition and Child
Mortality in Sierra Leone.African Journal of Food,
Agriculture, Nutrition and Development, 13(5), 8187-8208.
Chambers, R. and G. Von Medeazza, (2013).Sanitation and
Stunting: Undernutrition’s Blind Spot, Economic and Political Weekly, June-22, Vol. xlviii(25), 15-18.
Currie, J Moretti, E (2007). Biology as Destiny? Short and
long run determinations of intergenerational transmission of
birth weight, Journal of Labor economics, vol 25, No. 2,
pp.231-264.
Deaton, A et.all (2013). Stunting among children facts and
implications, Economic and Political Weekly, 48(34).
Gaiha, R, et.all (2010). Child Under nutrition in India, ASARC working paper.
Jayachandran, S, Pande, R(2013) Choice not genes,
probable cause for the India- Africa child height gap, Journal of Economic and Political Weekly, 48(34)
Josey, A.M. (2011), Women’s Workforce Participation and
Hours of Labour Supplied: Social, Economic and Regional
Aspects, Unpublished Master’s Thesis, Madras School of Economics, Chennai.
Kanjilal, B., Mazumdar, P. G., Mukherjee, M., & Rahman,
M. H. (2010). Nutritional status of children in India:
household socio-economic condition as the contextual
determinant. Int J Equity Health, 9(1), 19.
Martorell, R., & Young, M. F. (2012). Patterns of stunting
and wasting: potential explanatory factors. Advances in Nutrition: An International Review Journal,3(2), 227-233.
Mosley, W. H., & Chen, L. C. (1984). An analytical
framework for the study of child survival in developing countries. Population and development review, 25-45.
Nandy, S., & Svedberg, P. (2012). The Composite Index of
Anthropometric Failure (CIAF): an alternative indicator for
malnutrition in young children. In Handbook of Anthropometry (pp. 127-137). Springer New York.
Panigrahi, A., & Das, S. C. (2014). Undernutrition and Its
Correlates among Children of 3–9 Years of Age Residing
in Slum Areas of Bhubaneswar, India.The Scientific World
Journal, 2014.
Ramachandran, P., & Gopalan, H. S. (2009).
Undernutrition & risk of infections in preschool children. Indian J Med Res, 130(5), 579-83.
Radhakrishna, R., & Ravi, C. (2004). Malnutrition in India:
Trends and determinants. Economic and Political Weekly, 671-676.
Rehman, A. M., Gladstone, B. P., Verghese, V. P., Muliyil,
J., Jaffar, S., & Kang, G. (2009). Chronic growth faltering
amongst a birth cohort of Indian children begins prior to
weaning and is highly prevalent at three years of age.Nutr J, 8, 44.
Ruel, M. T., & Menon, P. (2002). Child feeding practices
are associated with child nutritional status in Latin
America: innovative uses of the demographic and health surveys. The Journal of nutrition, 132(6), 1180-1187.
Sachar Committee Report (2006).Social, Economic and
Educational Status of the Muslim Community of India,
Prime Minister’s High Level Committee, Cabinet
Secretariat, Government of India.
State of World Children report (2014). Every Child counts,
revealing disparities and advancing children’s rights, UNICEF
Subramanian S, Ackerson L, Dravey Smith G, John N
(2009). Association of maternal height with child mortality
anthropometric failure , and anemia in India JAMA vol.301, No.16, pp 1691-1701.
Sullivan, P. B., & Goulet, O. (2010). Growth faltering: how
to catch up and quest. European journal of clinical nutrition, 64, S1-S1.
Viswanathan, B. (2014a). Variations in Women’s Heights
across Social and Religious Groups among Indian States,
Social Indicators Research, Vol. 119 (2), Page 1149-69 DOI 10.1007/s11205-013-0531-4.
Viswanathan, B. (2014b). Prevalence of Undernutrition and Evidence on Interventions:
Challenges for India, Research Monograph No.49/2014, Madras School of Economics, Chennai
Von Grebmer, K., Saltzman, A., Birol, E., Wiesman, D.,
Prasai, N., Yin, S & Sonntag, A. (2014). Synopsis: 2014
Global Hunger Index: The challenge of hidden hunger (Vol. 83). Intl Food Policy Res Inst.
i Z-score is commonly used to define stunting, underweight
and wasting rates as per WHO standards. A child is said to
be moderately stunted or wasted or underweight if the z -
score value is less than -2 or below and severely stunted if
the z- score value is less than -3 or below.