64
Department of Forest Products Analysis of chip quality and value at Norske Skog Pisa Mill, Brazil Agneta Färlin Master Thesis ISSN 1654-1367 No 21 2008
Department of Forest Products
Analysis of chip quality and value at Norske Skog Pisa Mill, Brazil
Agneta Färlin
Master Thesis ISSN 1654-1367No 21 2008


Department of Forest Products
Analysis of chip quality and value at Norske Skog Pisa Mill, Brazil
Agneta Färlin
Master Thesis, 30 ECTS credits, D- level in Business AdministrationAgneta Färlin, Master of Science in Forestry, 02/07Supervisors at SLU: Mats Nylinder & Denise McCluskeySupervisors at Norske Skog: Anders Bjurulf & Jan Hill


Acknowledgements Firstly I would like to thank Anders Bjurulf and Jan Hill for letting me participate in this exciting area and during this era of research and developement at Norske Skog. Secondary, I would like to thank the people in Pisa; Luiz Barbosa, Admir Lopes Mora, and special thanks to Sverre Bjotveit and Henrique Graeml. A further thank you must also go to Patrik Axelsson and May Nilsen in Halden. Thank you to Tord Bergman at Iggesund Tools. I am very grateful to Ffion Cassidy and Alex Stodulka for the editing of my thesis. Last but not least I would like to thank to my supervisors at SLU, Mats Nylinder for your continual help and support, your enthusiasm has really inspired me. A further thank you to Denise McCluskey.
1

Abstract Norske Skog’s pulp and paper mill in Pisa, Brazil, was purchased by Norske Skog in 2000. Norske Skog is a world-leading producer of newsprint and magazine paper, with 18 paper mills around the world. The purpose of this study is to analyse the properties of the chips this mill uses as a raw material, and assess the significance of these properties from a commercial value perspective. The projected production capacity for the Pisa Mill will increase from the current 185 000 tonnes to 385 000 tonnes/ annum when a second production line (PM 2) will be installed from Union in Norway. At present the Norske Skog Mill buys slab wood chips from five sawmills, the mill also produce their own roundwood chips. Pisa Mill is currently using 75 percent roundwood and 25 percent sawmill chips. This study analyses roundwood chips produced at Pisa and from Pisa´s two largest suppliers of sawmill chips. To achieve the purpose of this study, chip samples were collected from three sources. Chip analysis was conducted by mechanical screening equipment (according to SCAN-standards) and an optical scanning machine (on a ScanChip). Chip properties were then assessed using bussiness strategy and cost make or buy concepts. In general the chips from Pisa Mill are short and thin. The sawmill chips have a bigger variation in size compared to the chips Pisa produces for their own consumption. This indicates that the chips from the external suppliers can be improved. And, it is recommended that Norske Skog contunue their dialogue with their suppliers so that the improvements are made. The study has shown that the size distribution of the chips is greater for the chips made of roundwood at Pisa compared to the two additional sawmills being studied. The results from the two sawmills indicate that the sawmill chips can be improved. The chip size distribution from mechanical screening and optical scanning gives variable results. As the difference seems to be the same for all chip sizes, it is independent of which system is being used as long as the method is stated when results are compared. As sawmill chips represent 25 percent of the raw material supply, the quality of this material is of great importance. While the direct costs of the sourced sawmill chips appear to be lower, there are additional direct costs which means that their actual costs are higher. Taking into account the strategic aspects, the company has chosen to buy sawmill chips, there are some benefits of using sawmill chips in their production. The purchasing roll is of great importance when using sawmill chips. From a cost perspective, the price for sawmill chips is lower compared to roundwood chips. Although there are additional costs using the slabwood chip of poorer quality, which has negative effects on the pulp and paper quality. Sawmill chips is a ready-made product, in roundwood chips there are additional costs when producing the chips. Since there have been changes in both sawmill chips and roundwood chips at Norske Skog’s mill in Brazil and influence in chip properties, the objective of my thesis is to study the commercial value of these changes and to obtain improved knowledge relating to the relevant characteristics of the wood chips. Key words: Norske Skog, roundwood chips, Sawmill chips, ScanChip, SCAN-CM, size distribution
2

Sammanfattning Massa- och pappersfabriken i Pisa, Brasilien, köptes av Norske Skog år 2000. Norske Skog är en världsledande producent av tidnings- och magasinpapper, och har 18 pappersfabriker spridda över världen. Syftet med studien är att analysera flisegenskaper ur ett ekonomiskt perspektiv på Norske Skogs massa- och pappersfabrik i Pisa i Brasilien. Produktionskapaciteten i fabriken i Pisa kommer att öka från 185 00 ton till 380 000 ton när PM 2 från fabriken i Union i Norge ska installeras. Norske Skog köper splintvedsflis från fem olika sågverk, fabriken producerar också egen rundvedsflis. I fabriken används 75 procent rundvedsflis och 25 procent av sågverksflis. Analyserna har gjorts på flisen som produceras på massa- och pappersfabriken i Pisa samt från Pisas två största sågverksflisleverantörer. För att uppnå syftet med studien, samlades flisprover från tre skillda flisproducenter. Mekanisk sållning (enligt SCAN- standard) och optisk sållning (på en ScanChip) användes för att analysera proverna. Flisegenskaperna analyserades ur en strategi perspektiv, samt ett köpa eller producera själv perspektiv. Flisen från Pisa är generellt korta och tunna. Sågverksflisen har sämre kvalitet jämfört med den flis Pisa producerar själva. Detta indikerar att sågverksflisen kan förbättras. Storleksfördelningen på flisen är bättre för rundvedsflisen jämfört med flisen från de två sågverken som var med i studien. Resultaten från längdfördelningen tyder på att förbättringar bör göras. Storleksfördelningen från den mekaniska- och den optiska sållningen visar på skilda resultat. Då skillnaden verkar vara den samma för alla flisstorlekar, spelar det ingen roll vilket system som används bara det är klart vilken metod som används om resultaten ska jämföras. Eftersom 25 procent av flisen som används vid fabriken kommer från sågverksflisen är det viktigt att kvaliteten på den är bra. Priset på sågverksflis är mycket lägre jämförelsevis med priset på rundvedsflis. Utifrån de strategiska aspekter företaget valt, är det vissa fördelar att använda sågvedsflis i produktionen. Inköparens roll är väldigt viktig. Ur ett kosnadsperspektiv är priset för sågvedsflis lägre i jämförelse med rundvedsflisen. Vissa egenskaper vad gäller sågverksflisens kvalité är dock negativa i processen och för slut-produkten vilket kan medföra extra kostnader. Sågverksflis är en färdig produkt, rundved behöver flisas i Norske Skogs fabrik. Då det har varit förändringar både i sågverksflisen och rundvedsflisen på Norske Skogs fabrik i Brasilien, undersöks ekonomiska värden av denna förändring grundat på utkomsten av flis-kvaliteten. Nyckelord: Norske Skog, rundvedsflis, ScanChip, SCAN-CM, storleksfördelning, sågverks-flis.
3
Table of contents Abstract 2 Sammanfattning 3 Table of contents 4 1. Introduction 5 1.2 Problem 5 1.3 Aim 6 1.4 Limitations 6 2. Theory 7 2.3 Statistics 15 2.4 Chip quality 16 2.5 Contamination/ pollution 17 3. Methodology 18 3.1 The research design 18 3.2 Approach to assessing the implications of chip properties on business strategy and practices 19 3.3 Method for measuring chip properties 20 4. Norske Skog’s operations in Brazil 23 4.1 Norske Skog 23 4.2 Norske Skog Pisa 23 4.3 Wood Supply 24 4.4 Suppliers of sawmill chips 25 4.5 Wood products utilized 27 5. Results / Findings 29 5.2 Length, width and thickness distribution between the three chip producers 29 5.3 Comparison between SCAN and ScanChip results 34 5.6 Contamination/ pollution 40 6. Analysis 43 7. Discussion 46 8. Conclusions 49 9. References 50 Appendix 1 52
4

1. Introduction 1.1 Background The Norske Skog Mill in Pisa, Brazil produces one third of the domestic consumption of newsprint paper. The mill was bought from Fletcher Challenge paper division in year 2000. The production capacity is 185 000 tonnes, and the production capacity will increase in the near future. The mill is located in the state of Paraná in southern Brazil. The mill utilises mainly loblolly pine (Pinus taeda) and some slash pine (Pinus elliottii), from plantation forests in the area. Pisa has long term wood supply agreement with Florestal Vale Do Corisco Company, and they are receiving about 70 % of the amount needed for their production from this company. The amount of wood needed for production is about 400 000 green tonnes per year (408 000 m3). (Graeml. 2007) Norske Skog buys slab wood chips from five sawmills and the mill is also producing their own roundwood chips. The mill uses 25 percent sawmill chips in their production and 75 percent are roundwood chips. Braspine is the biggest supplier of sawmill chips and Linea the second biggest. All chip suppliers, except StoraEnso get their logs from the forestry company Florestal Vale Do Corisco, and Norske Skog also get their pulpwood from the same company. (Graeml. 2007) The total quantity of sawmill chips Pisa receives each month is about 7 000 tonnes (80 000 tonnes/year) from the suppliers Braspine, Linea, Embalatec, StoraEnso and Benazzi. The wood supply agreement gives Norske Skog preference on buying the chips from the sawmills that buy wood from Florestal Vale Do Corisco with annual negotiations between Norske Skog and their suppliers. The mill in Pisa also buys roundwood and sawmill chips on the open market. Changes in the pulp production have been made. The input of sawmill chips has been changed from 20 percent to 25 percent in January 2007. (Graeml. 2007) As sawmill chips represent 25 percent of the raw material supply, the quality of this material is of great importance. The prices of sawmill chips are 74 percent lower compared to the roundwood chips (Graeml. 2007). Taking into account the strategic aspects the company has chosen, Norske Skog considers the affects of using sawmill chips in their production. The purchasing roll is of great importance since one-fourth of the chips are coming from external producers.
1.2 Problem According to earlier studies by Norske Skog, sawmill chips delivered to Pisa have negative effects on the quality of paper production (Axelsson, 2006). There have been changes in the chip production in Pisa mill; the mill is focusing on getting better quality of sawmill chips from their suppliers. As a result Norske Skogs mill in Pisa bought a size classifier according to SCAN standards in July 2006 and is doing measurements every day. SCAN-CM is a Scandinavian pulp, paper and board testing committee that describes standards for wood chips in pulp production. In December 2006, the chipper for roundwood was also adjusted to change the chip length with the overall objective to improve sawmill chip quality. The quality is closely linked to the production of the supplier. I am investigating which strategy is the best for the company; make own chips or buy. The purchasing roll is also looked at in relationship to other factors involved in the manufacture of pulp. Since one-fourth of the input in chips are coming from sawmill chips, this input is important for the outcome, in both quality and financially.
5

Norske Skog does daily measurements of the chips at their sawmill on a size classifier. The results obtained through this complementary research project were compared to the ongoing results obtained by Norske Skog. Chip samples were analysed in a ScanChip, which provides more information about the chips, as compared to a size classifier. The studies will be made on a ScanChip and a SCAN size classifier, which are two prescribed methods for analysing chip quality. The chip analyses are made on the two biggest sawmill chip producers. Analyses will also be made on the roundwood chips Pisa produces. The biggest supplier of sawmill chips is Braspine. Their mill is located just outside the Pisa mill, and trucks run between the sawmill and the pulpmill frequently, sending 2 800 tonnes of chips per month. Linea is Pisa’s second biggest supplier of sawmill chips. They receive 1 800 ton chips from Linea per month. Dry matter content of the chip is also measured, and the amount of sand in the sawdust fraction analysed.
1.3 Aim The aim of my thesis is to obtain information regarding sawmill chip properties to assess chip quality and its influence on make or buy decission making, to identify these affects on the production and purchasing of sawmill chip. Since there have been changes in both sawmill chips and roundwood chips at Norske Skog’s mill in Brazil and chip properties influence, the objective of my thesis is to study the commercial value of these changes and to obtain improved knowledge related to the relevant characteristics of the wood chips.
1.4 Limitations This study regarding chip properties will focus on chips produced by three different chip producers: roundwood produced by Norske Skog’s mill in Pisa, and the two main suppliers of sawmill chips; Braspine and Linea. The chips have been collected over a time period of seven weeks. The primary limitation of this study is time, since this master thesis should streach over a time period of 20 weeks. This was the limited duration of this thesis and the available resources that were offered for its completion.
6

2. Theory This theory section contains strategy and operational issues for looking at the commercial affects of roundwood and sawmill chips. This theory section contains chip theory for understanding the complexity of chips and chip property. There is also a statistic theory since there are statistic results in the report.
2.1.1 Purchasing Purchasing is a way to procure the right quantity and quality of product, within the appropriate timeframe, from the correct source and at the right price (Farmer & Jessop. 2005). The purchase should provide the company with material and/or goods or services that makes it possible for the company to run their business and to meet the consumers and their needs in a desirable way (Skoog & Wiklund. 2001). Put into a perspective of an organization, purchasing may be defined as the function that is responsible for materials, equipment or service that is required for production (Lysons. 1996). The start of a purchase activity often occurs following the recognition of a need and ends with the fulfillment of this need. Many purchases are however done in order to fulfill continuous needs; every transaction is therefore a part of series (Farmer & Jessop. 2005). The importance of purchasing has increased rapidly over the previous decades and is crucial for most of today’s companies in order to succeed. Despite this it wasn’t until the late 20th century that companies started to recognize the importance of an efficient purchasing. There are, however, three developing factors that have enhanced the status of purchasing within companies (Lysons. 1996):
1. the contribution of purchasing to profitability and added value; 2. the evolution of professional purchase; and 3. the recognition of the strategic importance of purchasing.
The average cost of materials and components for manufacturing company was in 1979 about 40 percent of the total cost. In 1994 the cost of materials and components had increased to over 60 percent of the total cost. The cost of raw material for sawmills are today often as high as 70 percent of the total cost. Materials can be classified into three categories (Lysons. 1996):
1. raw material 2. semi-finished goods and process materials 3. component parts and assemblies
The following fact comes from Gadde & Håkansson, 1998. For the purchasing process the price is an important factor and therefore the purchaser must cooperate with both co-workers and suppliers. A low price is not the same as a low cost since price is only one part of the total cost. Transportation cost, cost of delays, support, cost of stock, cost of administrative etc is also included in the total cost. Companies are increasing their specialisation on a specific part of the supply chain. The way one single company is handling their purchasing is important in their competition with other companies. Purchasing is a dominating part of the costs in the firm. The secondary aspect of purchasing cost is the goods, the company and its suppliers are deciding the quality of the goods.
7
One dollar less in purchasing price gives one dollar more in benefit, other things being equal, although one dollar less in price does not mean one dollar in surplus since there are other indirect costs in purchasing. That is why it is important to determine the price for the goods in relation to the end product. The possibility of changing the supplier is decreasing in many industries as specialisations are taking place. To improve the efficiency or quality, both company and their supplier should be engaged and both should have long-term agreements for getting the desired outcome. A company has the possibility to have one- or many suppliers. The amount of suppliers chosen is important to take into account for analysing what kind of effects this has on the company in the long term. By buying refined products the company can rationalise their production. The insight of benefits when having long term agreements is increasing among companies. There is no simple way of purchasing, each firm has different prerequisites and has their unique way of doing the purchasing. The company also has the possibility to outsource all production. For the purchasing process the price is, of course, an important factor and therefore the purchaser must cooperate with both co-workers and suppliers. But a low price is not the same as a low cost since price is only one part of the total cost. Transportation cost, cost of delays, support, cost of stock, cost of administrative etc is also included in the total cost.
2.1.2 Make or buy? Owning as much as possible of the resources has historically been seen as the best possibility for having an even flow in the production. Other positive effects with owning are the possibility of leading different activities to the same goal. Vertical integration has therefore been recommended when choosing strategy in the company. The company will focus on managing the company in an efficient way, which can lead to difficulties in development and flexibility. Investments that have been made decrease the freedom of action of the company. There have been changes in the value of owning; as the flexibility then is decreasing. The trend has developed to create less control of the supply chain and more flexibility when it comes to freedom of action, related to investments in facilities has decreased. A buying company can although increase their control over their suppliers by different kinds of collaborations and in common efforts. The tendencies for companies to decrease the vertical integration can not go too far, since the need for financial investments are important for the development of the company and its suppliers. Which activities that a firm has chosen to use, is based on the relative cost (Grant. 1999). Making a purchase of sale involves search costs, the cost of negotiating and drawing up a contract, the cost of monitoring to ensure that the other party’s side is being fulfilled, and the enforcement costs of arbitration or litigation should a dispute arise. All these cost are types of transaction costs. If the transaction costs associated with organizing across markets are greater than the administrative costs of organizing within firms, we can expect the coordination of productive activity are organized in the firm (Grant. 1999).
2.1.3 Firm Strategy The following facts are coming from Morgan & Hunt, 1999. Proponents of relationship marketing encourage firms to seek partners for long-term marketing relationships, to focus on
8

customer retention rather than customer capture. When expecting that relationship marketing is offering or contributes to a firm’s competitive advantage, which is hoped to be sustainable, there should be focus on this matter. These relationship-based competitive advantages (RBCAs) drive the success of relationship marketing. The firm are having a competitive advantage of having competencies build on a variety of foundational resources. Organizations must acquire the resources through purchases in the marketplace, the acquisition of firms having resources (vertical integration), creating or developing the resources internally, or through partnership with other organizations (relational exchange). Firms often enter relationships not reluctantly but optimistically. They realize that, strategically, to be more competitive, they must have access to valuable resources and that relationships often offer the best route to obtaining these resources, although some argue that participating in them will result in a loss of power in their own decision making. Treating resources strategically implies four managerial requirements, resources must be: 1. efficiently acquired or developed; 2. combined skilfully to create complex resources; 3. deliberately applied to competitive situations; and 4. dutifully maintained and protected to ensure on-going availability. The financial performance of the firm depends upon the costs of implementing strategies as well as the returns enjoyed from those strategies. Similarly, for resources to be a truly comparative advantage, the cost of acquiring them must be lower than the gains they impart. Efficiency of resource acquisitions is often a motive for relationship formation. When firms have access to external resources through partnerships, such resources can be combined with the firm’s internal resources to produce a competency that results in a competitive advantage. The negative effects allowing relationship-based resources is where resources acquired through relationships become a strategic hindrance by leading the firm to make poor decisions regarding investments or courses of action. When the long-term costs of existing relationships, and the resources shared in those relationships, outweigh the long-term benefits, we argue that relationship marketing theory urges managers to assess how the relationship can be salvaged. When salvaging the relationship is not the long-term best interest of all parties, the situation must be changed. Also one other negative effect can be that the exchanges can be nonreciprocal, resulting in an asymmetrical dependence upon the relationship for resources. Then the more powerful party can take advantage of the dependent partner, which leads to relationship failure through erosion of relationship commitment among the more resource-endowed partners. For a firm to obtain sustained competitive advantages by implementing strategies that exploit their internal strengths, through responding to environmental opportunities, while neutralizing external threats and avoiding internal weaknesses. Managers are important since it is the managers that are able to understand and describe the economic performance potential of a firm’s endowments. Managers or a managerial team is a firm resource that has the potential for generating sustained competitive advantages. Such advantages must be found in the rare, imperfectly imitable, and non-substitutable resources already controlled by a firm. Those
9

attributes of a firm’s physical, human, and organizational capital that do enable a firm to conceive of and implement strategies that improve its efficiency and effectiveness are a firm resources, which a particular firm could gain a competitive advantage (Barney. 1991). A firm is said to have a sustained competitive advantage when it is implementing a value creating strategy not simultaneously being implemented by any current or potential competitors and when these other firms are unable to duplicate the benefits of this strategy. Whether or not a competitive advantage is sustained depends upon the possibility of competitive duplication (Barney. 1991).
2.1.4 Production technology impact Purchasing seen in the perspective of the buyer; the purchase can be seen as a link to the facilities of the producers. This link can be shaped depending on the technology the company has to offer. If the company’s own technology has low flexibility the purchaser must give priority to liability relating to delivery and technical functions. The technology is the boards of what the company can produce. The problems the company may often have may also be linked to the technology of the firm. In the end the technology will provide the foundation when it comes to the adaptation and flexibility of the firm (Gadde & Håkansson. 1998).
2.1.5 Purchasing for processing industry Processing industries are dependent on raw material to maintain continuous production. The goods are quite homogenous and the equipment highly specialised. The difference in equipment between the various suppliers is what makes the buying procedure even more complex, in the pulp production the need for homogenous chips is to prefer for getting an uniform production. The purchasing in a processing industry are therefore two extremes- one standardised need for raw material, and one unique need for a highly specialised supplier (Gadde & Håkansson. 1998). The differences of the raw material are in general small, for some companies the small differences make the difference since they can be the cause for disturbances in the production. Since raw material is as important for the production some companies choose to integrate backwards, i.e. buy the supplier company or the raw material supplier, for example one pulp company that owns the forest. When owning the raw material supplier the increased safety for supply gives less freedom. Even if do not integrate backwards the safety for raw material can increase by having contracts with the suppliers over prolonged periods of time. It is common for one company to both have long term and short term agreements, the latter one are buying the goods where the benefits are best in the short run (Gadde & Håkansson. 1998).
2.1.6 Indirect and direct purchasing costs For buying companies the recommendation is to avoid being dependent of specific suppliers. Although there are benefits of using the suppliers standardised solutions since the big amount produced are beneficiary for the company. When having a close cooperation with the supplier there can be adjustments for getting the best solutions for that specific company (Grant. 1999). When looking at the company’s costs cooperation with the suppliers can lead to savings on the indirect costs. Looking at the purchasing price, the price itself is one part, but there are also other costs to take into account when buying the goods and there are possibilities to use the competence of the suppliers (Grant. 1999). The idée with a separate and professional purchasing unit is, according to, to make it more profitable and rational (Gadde & Håkansson. 1998).
10

To have close cooperation with the suppliers and purchaser can have a lot of positive effects, but there are also negative effects. The primary one is the problem that the company becomes dependent on their supplier, however the positive effects outweigh the negative. The dependence itself are usually both from the buying company and their supplier. Close collaborations also cost money. To get involved for the collaboration consumes a lot of resources, including time and money. To identify which relations are worth developing further are important from a strategic purchasing view. There is a connection between collaboration and stability, close collaborations are also stable (Grant. 1999). The price is the visible cost, but there are also hidden costs. If using standard solutions for the production, there are benefits in scale production. The price can depend on the buying company’s ability to negotiate and therefore the price can be bigger or smaller. One other way is to influence the supplier to produce better products (cost efficient) from the buyers point of view compared to the standard products that already exist. These two different ways of affecting the price leads to different supplier relations. The latter one has close collaborations compared to the first using standard solutions. There are also other costs that are affected by the way the company purchases goods. These costs are difficult to put a price on since they are indirect (Grant. 1999).
2.1.7 Benefits and costs of vertical integration Although big companies have continued to expand internationally, the dominant trends of the last 20 years have been “downsizing” and “refocusing”, as large industrial companies reduced both their product scope through focusing on their core business, and their vertical scope through outsourcing (Grant. 1999). Vertical integration refers to a firm’s ownership of vertically related activities. The greater the firm’s ownership and control over successive stages of the value chain for its product, the greater its degree of vertical integration. The extent of vertical integration is indicated by the ratio of a firm’s value added to its sales revenue. Highly integrated companies tend to have low expenditures on bought-in goods and services relative to their sales. Within the same industry, different companies can be successful with very different degrees of vertical integration, depending on the strategies they pursue and the resources and capabilities that they possess. The company can have long-term contracts, vendor partnerships instead of owning all parts in the value chain (Grant. 1999). In the design of vertical relationships there are risk allocations to take into account. Any arrangement beyond a spot contract is that its terms involve an allocation of risks between the parties. How risk is shared is dependent partly on bargaining power and partly on efficiency considerations. Also there are incentives to consider; for a contract to minimize transaction costs it must provide an appropriate set of incentives to the parties, for achieving the completeness in the specification of contracts also bears a cost. Often the most effective incentive is the promise of future business (Grant. 1999). Information access has the ability to impact the relationship between customer and producer since it is easier to access information when using internet (Prahalad, Ramaswamy. 2000). In the traditional marketplace, companies had far better access to information than individual consumers did. The competence of the consumer involves more than just setting up a dialogue. The product is no more than an artefact around which customers have experience. Customers are not
11

prepared to accept experiences fabricated by companies. Increasingly, they want to shape those experiences themselves, both individually and with experts or other customers (Prahalad, Ramaswamy. 2000). Managers can regard the customer as a source of competence, but they also have to face the reality that their customers are becoming their competitors. Customers can extract value in ways that were unimaginable even three years ago (Prahala, Ramaswamy. 2000). The new frontier for managers is to create the future by harnessing competence in an enhanced network that includes customers. To be serious about the new economy, you’re going to have to be the part you’re playing. As Hamlet said, you “must have that within which passeth show” (Prahala, Ramaswamy. 2000).
2. 2 Chips In this section I am describing chips and chip mesuring methods.
2.2.1 Chip properties The following facts about chips are mainly based on information from STFI report number 14 made by Hedenberg & Lundqvist, 1998. A high quality chip is a chip that has the right quality fibre for its production requirements. Chips should not have pollutants like bark or sand, and should be easy to impregnate with water. The fibre qualities are dependant on which part of the tree the chips come from, but the chipper can also affect fibre quality. In general longer chips have longer fibres, because fewer fibres are cut in the chipper. On the other hand longer chips are often thicker and are difficult to impregnate. Both chemical and mechanical pulp production require undamaged fibres since damage can lead to a weakening of the fibres in the pulp. When wood is being chipped, the fibres are being cut on one side and sprained on the other side of the chip. To take advantage of the long fibres that coniferous wood has, the size of the chips should be at least 30-40 mm long. (These numbers are based on Norway Spruce.) There is a linear correlation between the thickness and the length of the chip in a disc chipper. If the length increases, the thickness also increases, and when the chips get longer and thicker, they are harder to impregnate. When producing TMP (Thermo Mechanical Pulp) the aim is to have the longest fibres possible. The chips, therefore, cannot be to short. As mentioned earlier the impregnation must be taken in account since the chips also should be easy to impregnate with water. Studies have showed that middle sized chips give good pulp strength. If the chips are small, they pack too hard. Sawdust has a lot of negative effects on the pulp since it has a high amount of extracts like bark, resin and rot wood. If the sawdust is removed these particles are also being removed. Oversized chips have showed a decrease in (relative) strength of the pulp. This is probably caused because the size of the chips is disrupting the input to the refiner. According to Hoekstra et al(1983) the optimal chip thickness is between 3.5 – 6 mm.
12

The following presentation of chips is based on information from STFI report number 16 made by Hedenberg, Lundqvist & Bergman, 1998. The chip length, width and thickness depend on the type of chipping equipment being used and how it is adjusted. Chips are usually characterized by a standardized screening method in which a chip sample is divided into six fractions. There are also measuring devices based on image analysis, giving a more detailed description of the chips. Sawmill chips are made using different types of equipment. Chips from drum chippers are most similar to the chips from disc chippers. Chips from a chipping canter have a narrow length distribution. The most common way of producing chips in pulp mills is by using a disc chipper. The sawmill often employs other equipment, like chipping canters and drum chippers. Different chippers produce chips with different dimensions. Therefore, it is possible to change the size of the chips by changing the size on the chipper.
2.2.2 Measuring of sawmill chips The chip characteristics are used as a basis for chip trading and the sawmills optimise their chips by means of this method (Hedenberg et al. 1998). In Scandinavia the size classification is used for price determination. Optical scanning and mechanical screening are two methods of classifying different chip fractions. These two methods are presented below.
Mechanical screening SCAN-CM is a Scandinavian pulp, paper and board testing committee that describes standards for wood chips in pulp production. SCAN is one method for doing mechanical screening. For size classification I have used a chip classifier. From now on I will call mechanical screening SCAN. The analysis of the size classifications can be used for chip trading. The price determination is often linked to the proportions of the different chip fractions. The chips are usually screened to get a better size of the chips. This is very common within sawmill chips, which means that the result are not representative for the chipper since some chip sizes are being cut again(Hedenberg et al. 1998). The length of the chips is measured in the fibre direction. Width and thickness are measured perpendicular to this (Hedenberg et al. 1998). The following facts are based on SCAN-CM 40:01, Revised 2001. Chip classifier is an appartus for chip size classification, see figure 1. The chips are screened in following six dimentions.
- Oversize chips (45 mm hole) – Chips that do not pass the first screen of the classifier, when chip size classification is performed as specified in this Method.
- Overthick chips (8 mm slot) - Chips that pass the first screen of the classifier but are retained on the second screen, when chip sixe classification is performed as specified in this Method.
- Large accept chips (13 mm hole) – Chips that pass the top two screens of the classifier but are retained on the third screen, when chip size classification is performed as specified in this Method.
13

- Small accept chips (7 mm hole) - Chips that pass the top three screens of the classifier but are retained on the fourth screen, when chip size classifi ation is performed as specified in this Method.
- Pin chips (3 mm hole) – Chips that pass the top four screens of the classifier but are retained on the fifth screen, when chip size classification is performed in this Method.
- Fines - Particles that pass all five screens of the classifier, when chip size classification is performed as specified in this Method.
Apparatus:
Figure 1 . The five screens and the fines tray in the chip classifier (dimensions in millimeters). Source SCAN-CM 40:01.
Optical scanning The ScanChip is being used for optical rate of chip fractions. The following facts are based on information from STFI report number 16 made by Hedenberg, Lundqvist & Bergman, 1998. In order to continuously supervise the debarking and chipping a machine for online measurements of chip properties has been developed. There are optical reading calibrators that are using pictures and laser to make chip geometry analyses. ScanChip gives two different results. First, is optical screening where, every chip is tested to see which SCAN size classification it fits into. It is a simulation of the SCAN classification. The second provides measurements of the different dimensions of the chip; its length, width and thickness. The results show mean values, standard deviations and statistical distributions. These measurements can only be made on well-formed chips where the camera can find the cut surface of the chip. Then the machine can identify the length and width. On the thickness the ScanChip shows the distribution in 0.5 mm – intervals within the range of 2 to 12 mm. The length and width results are shown in 1 mm intervals for chips of length > 10 mm and width > 5 mm.
14
For roundwood chips the ScanChip measures about 50-65 weight- percent of the chips that can be used in the dimension classification. The measured amount (well-formed) sawmill chips are much lower, about 35 weight-percent. The amount of accepted chips gives a rate of “good” chips with clear cut surfaces.
SCAN - standards SCAN-CM is a Scandinavian pulp, paper and board testing committee that describes standards for wood chips in pulp production. The method used for chip collection and analysis follows SCAN-CM – standards. I have been using primarily SCAN-CM 39:94, dry matter content, SCAN-CM 40:01, size distribution, and SCAN-CM 42:95, bark content. Formula used for dry matter content according to SCAM-CM 39:94 (gram) X = 100 (b-c)/ (a-c) X is the dry matter content of the sample, expressed as a percentage; a is the mass of the container with sample before drying, in grams; b is the mass of the container with sample after drying, in grams; c is the mass of the empty and dry container, in grams.
2.3 Statistics The basic principle of sampling is very easy. Instead of studying the whole population you are studying samples to make estimations about the population. The samples should make a good picture of the population; the best case scenario is a copy in miniature. That is why you can use the sample as an approximation of the distribution of the population. The percentages that are being counted in the samples can be used to estimate the equivalent percentage for the population. In 95 percent of the cases of samples the estimations are lesser then the statistics error margin. That is why I am using the random sampling in my study. The following information comes mainly from Körner & Wahlgren, 1998. Random sampling is used to study a representative sample instead of measuring the whole population. This sample is used to try to make conclusions about the whole population of chips. It is not possible to make definitive conclusions when the information about the population is incomplete, but the samples should represent the population well enough to obtain reasonably accurate results. Sampling is used commonly in everyday life. When you are getting married, for example, you are basing your decision on a short period of time, and assuming that it will represent your whole life together. Statistics is about making this kind of decisions rational. Statistical errors are affected by the size of the sample. A bigger sample gives less error, but to decrease the errors by half you need to make the sample size four times bigger. The aim is to make estimations about the population. When the samples size is big enough, to get a trustful estimation is to use a confidence interval. The sample size (n) should be over 30 unless p is near 0 or 1. The confidence interval can be as trustworthy as you want, and this level of confidence is given my confidence coefficient. If I choose to have a confidence coefficient of 68 % or 99.9 % the interval will be bigger in the first one compared to the second. That is why it is common to use an interval with confidence coefficient of 95 % because the reliability is enough and the interval is not too wide at the same time. The mathematic formula for the samples is:
15

Equation: Mathematical formula
(1 )P PP Z
n−
±
n is the size of the sample and p is the share of the sample. . Margin of error: the probability of the samples share (test share) p are diverging from the share of the population with more than the statistic error range is less then five percent, using the confidence coefficient of 95 percent. The size of the error range depends on the size of the sample n and the share of the sample p. A bigger sample size gives more information and the statistic error range gets smaller. To make the error margin half the size you need to make the sample size four times bigger.
2.4 Chip quality The following facts mainly come from Berg et al. 1995 if not other credit is assigned. Different industry processes and different end products place different demands on raw materials. In chips it is mainly the storage time that affects the dehydration and moisture content, and today that is the biggest problem. The moisture in the wood is important. When chipping dry wood, an increase of pins and fines is seen. This affects the processing and decreases the strength of the pulp both mechanically and chemically. Chips that are dry are more difficult to impregnate as well. Debarking ability is the most important wood property that is affected by short term storage. Mechanical pulp production is sensitive to this since the bark that is not being removed in the debarker is found in the pulp. This is difficult to bleach, and it makes the pulp decrease in brightness.
Important wood properties The following facts come from Berg et al. 1995 if not credit is assigned. Dehydration course – Dehydration occurs when the moisture content is below 40 percent. Factors affecting the dehydration course are temperature, moisture content, rain, insulation, wind, the size of the pile and where the pulpwood is located in the pile, the amount of abraded bark, the dimensions of the pulp, wood anatomy and time of year at which it is being cut. The first five factors vary depending on the time of year and where the log is located. If the pile is located on a cutting area it dries out faster then one located in the forest. The bark protects the wood against dehydration. A good estimation of the dehydration is to look at the temperature; an even better estimation is also to consider the air humidity. Studies showed that despite higher temperature, a higher amount of humidity made the piles increase in weight. A good estimation of evapotranspiration (total amount of evaporation from land and water) is to also to look at the temperature, which gives a good estimation of the dehydration course. Bark - There is a correlation between dehydration and bond between bark and wood. When the wood dries, the bark becomes stuck on the wood. This can be changed by dampening the bark which increases the debarking ability.
16

Brightness – Brightness is an important feature of the pulp. When boiling the sulphate pulp, the pulp is dark and has to be bleached. TMP is generally bright without bleaching, which means that the brightness is directly affected by the raw material. The brightness of the wood depends on the amount of bark and the wood itself. Wood that is being stored in direct contact with the atmosphere (sun and oxygen) is influenced by such atmospheric factors, thereby affecting the properties of the wood. Resulting in the wood becoming increasingly yellow, which gives a darker pulp. When water treating the wood, bark substances are transferred from the bark to the outer parts of the wood making the youngest annual rings darker. Basic density – the weight of the dry wood in relation to its raw volume. This density shows the amount of wood in the substance. The substitution of pulp (ton pulp per m3 wood) is dependant upon basic density. This density also affects the amount of energy needed when refining. A thicker cell wall compared to the cell cavity gives a higher basic density. The cell wall of the late wood is thicker than that of early wood. Basic density decreases with increased size of the annual ring (Nylinder, 1982). Basic density varies between different geographical areas and between sawmill chips and pulpmill chips. The reason for this is that sawmill chips come from the lower parts of the tree and from sapwood, and roundwood chips come from the upper parts of the tree and from both heartwood and sapwood (Nylinder, 1982). Green density – green density is a function of moisture content and basic density. A high green density indicates a high amount of moisture (Berg et al. 1995). Early wood/ late wood – The fibres have different qualities depending on if it is early wood or late wood (Berg et al. 1995). Ring width – Correlation between average size of the ring and basic density has been shown (Berg et al. 1995).
2.5 Contamination/ pollution The amount of sand in the chips should be as low as possible, since a small amount of contamination always “shows” in the paper machine. When producing mechanical pulp the quantity of sand is especially important since the discs in the refiner that physically grind down the chips to pulp will be damaged (Axelsson, 2007). Most sand is in the bark, penetrating the bark during harvest. When the wood is stored in non asphalted areas, there is also a lot of pollution in the bark (Bergman, 2007).
17
3. Methodology This method section addresses how measurements of the physical properties of the chips were conduced, as well as the approach to the strategy assessment.
3.1 The research design The qualitative and the quantitative design of a study are two different approaches in science, which represents different perspectives. The common perspective for both of them is that they try to win new knowledge and states that a research always has to be objective to be trustful (Olsson & Sörensson. 2001). The most important difference between these approaches is how the researcher is using numbers and statistics. The qualitative analysis is focusing on the whole phenomena rather than specific words (Olsson & Sörensson. 2001). Qualitative methods are often used when the aim primarily is to gain understanding (Holme & Solvang. 1997). The design of a research is built on the problem and questions the researcher wants to explain. Both qualitative and quantitative analyses have been used in this study. The qualitative analyses have been used for describing five sawmills that are producing the sawmill chips being used at Norske Skog´s pulpmill and the quantitative analyses when analysing the sawmill chips. In the interview section it is not possible just answering yes or no to the questions I have used in the interviews, therefore a qualitative method is more suitable for the aim with the thesis rather than a quantitative method. Using this methodology the positive affects are getting an overview of the companies (Holme & Solvang. 1997). An advantage with the qualitative method is that it is flexible, which means that the problem and the aim can be changed during the research process (Holme & Solvang. 1997). It makes it possible to correct the research if some important aspect has been neglected when the research has started. The flexibility can also be a disadvantage if the research is not made in a consequent way, the aim with the research then is easy to loose. Another disadvantage with a qualitative research is that every unit that is researched needs a lot of recourses, which means that the researcher only can focus on a few number of units (Holme & Solvang. 1997). A professional interview must give information that is trustful (Christensen. 1998). The advantage with primary data (when I do the data collection based on the data needed for my thesis) is that the information is suitable to the thesis problem and aim, the information is current as well as the person that is interviewing is in some extension able to judge if the material is honest or not. A disadvantage is that the interviewer has to be competent and it takes a lot of time. Another advantage with in person interviews is that misunderstandings can be clarified (Christensen. 1998). A disadvantage with a semi structured interview (when the interview section are not as a strict as a structured interview, meaning for example that the questions are not being asked in exact same order in every interview) is that it takes longer time compared to a structured interview (Christensen. 1998). Since this type of survey are subjective, the liability of the results can be discussed(Holme & Solvang, 1997). A common mistake when it comes to interviews is that the respondent is not giving honest answers (Christensen. 1998). In some cases the interviewed person is expecting that the person asking the questions want a certain answer, and gives an answer that are most appropriate in that situation, which can result in a incorrect answer. Since my questions were
18

fundamental, and the persons being interviewed are people having the knowledge and authority to have access to this, I think my answers were correct. To collect information to the empery at the sawmills a manual was used for asking the same questions at each sawmill. Norske Skog is having long term agreements with just five sawmill, all five were being interviewed. I was interviewing the owner or the CEO at each sawmill. Since these people are having leading positions in their company, they have the competence to answer my questions. I was visiting the sawmills as a represent coming from Norske Skog, which may affect the results. The meetings were taken place at each sawmill and were face to face. The answers I got corresponded with my observations when I walked around the factory. The interviews were semi structured and were taken place at each of the sawmills during my visit. The people I talked to at the sawmills is the persons that Noske Skog´s employees are having daily contact with. The questions being asked on the visits was about:
- their main production - machinery the mill utilised - how much the mill produces - customers, domestic or exports - chips - lead time of logs - supply of logs - storage time - storage procedures.
Participative observations were made during these visits when being showed around and getting information of the company. The questions are fundamental, and therefore the answers should be trustful. I was coming as a represent from Norske Skog to the sawmills. This should make their answers fair since the questions are basic for the people being interviewed, and they know that the answers are easy to control. Quantitative analyses need the survey to be structured to be able to get the quantitative numbers wanted. This procedure is described in section 3.3. The quantitative part of the survey was to look at the: - Allocation of chips according to SCAN standards (SCAN-CM 40:01) - Allocation of chips according to ScanChip - Dry matter content - Amount of sand contamination - Assess impact of chip quality and its affects on make or buy decisions.
3.2 Approach to assessing the implications of chip properties on business strategy and practices Norske Skog have chosen to buy 25 percent of their chip input in the pulp production from external chip producers. Since 25 percent of the input are coming from external sources, theory of the purchasing roll are looked at. The quality of chips are different when coming from roundwood chips compared to sawmill chips. The sawmill chips are a finished product, although the sawmill chips has lower costs. There are also other indirect costs when using sawmill chips. Therefore theory of producing chip themselves or buying are looked at
19

3.3 Method for measuring chip properties Visits were made to two places in Sweden; to Korsnäs pulpmill to look at VMF Qbera economic association ( it is an economic association within the forestry sector which are doing impartial and cost efficient measurements according to national standards) (www.wmfqbera, 2007) procedures in measuring chips in Gävle and to a Setra Group Sawmill in Sala, to see their sawmill. The collections of chips in Brazil were made over a time period of seven weeks. Collections were also made after I left Brazil and were sent to Norway in order to get a total of 15 samples from each place. During the chip collection period, the aim was to spread the collections as widely as possible over that time. The time period when the samples were collected was in February and March. The samples from Pisa were taken from a pipe after the chipper. Once, the chips from Pisa were collected in the chip yard. The chips from the two sawmills were collected when the trucks were arriving at Pisa. Chips were taken according to the SCAN-standard, and dug out and taken from four to five different places in the same pile. Samples were taken twice a day if possible, otherwise an extra sample was collected the following time of collection. The goal was to have 15 samples from each place. Since I was only able to collect 10 from each place, samples were taken after my return to get the desired amount. Visits were made to the five suppliers of chips: Braspine, Linea, Embalatec, Benazzi and StoraEnso. The chip suppliers showed their production and how the chips were made. My study is done on two of the sawmill chips suppliers, Braspine and Linea. They were chosen because they are the two biggest suppliers of sawmill chips to Norske Skog’s mill in Jaguariaiva. A study was also done on the roundwood chips produced in Norske Skog´s mill. Visit was also made when doing a clear cut. Different plantation areas was also showed, it was plantation forests owned by Florestal Vale Do Corisco, and some plantations owned by StoraEnso. During this time chip samples were collected in the chip yard. When trucks were arriving to the pulpmill, samples were taken according to SCAN CM standards, two bags from each truck. The roundwood chips from Pisa were collected after chipper. Between the time the chips were collected and the time the chips left Brazil, they were chilled in a refrigerator. Before leaving Brazil the bags were treated with methyl bromide, 50g/m³, to preserve the chips during transportation to Norway. The chips were transported by plane. The chips were sent to Norway for analysis on the size classifier and the ScanChip. Each bag, marked with dates they were collected, was run through the ScanChip one at a time. The analyses started with ScanChip, instead of starting with the size classifier. I started to do the analyses on the ScanChip, then the size classifier since it was the most convenient way to do it because I also did measurements on the dust fraction as well. The order in which the analyses were done can only make a marginal difference in the results. I therefore chose to do it the most efficient way and started with the ScanChip. The 45 bags were run through the ScanChip one at a time. Each bag took about 20 minutes in total. After the chips were run through the ScanChip, the chips were collected again in a new bag, and stored for a few days until the bag was run through the size classifier. Each bag took
20

about 20 minutes in the size classifier in total as well. The chips were measured according to SCAN-CM – standards. Since I did my measurements at Norsk Virkesmåling just outside Saugsbruk in Halden, I followed their chip fractions scheme (flisfraksjonsskjema). One difference between VMF Qbera (Sweden) and Norsk Virkesmåling (Norway) is that bark is measured in fraction 4 in Sweden, but not in Norway. I followed the Norwegian standards not measuring the amount of bark in fraction 4 since the amount is very small anyway. Dry matter content was measured in chips collected in February according to SCAN-CM 40:01 in the laboratory of Pisa mill. The moisture content of the chips collected in March was measured in Halden in April. The measurements was made in the building of Norsk Virkesmåling, and made after the size classifier analyses. After running the chips in the size classifier, the sawdust fraction was collected to measure the amount of sand in that fraction. Some collected sawdust fractions were burned in an incinerator (Muffel oven). The sawdust was put into ceramic pots, and then put into a special fumigate oven to make sure that the sawdust did not burn later on in the incinerator. The pots were in the smoke oven for 2 hours and then put into the muffle oven at a temperature of 925 degrees. The muffle oven burns all organic material and leaves behind the inorganic matter. After the muffle oven the pots were put into the exicator. Here the pots cooled down in an airtight environment and were not affected by the humidity of the surrounding air. The pots were measured before the fumigate oven and after the exicator to measure the amount of inorganic matter according to SCAN – standard.
Source of error The interview section was semi structural, the questions can have been asked in a different way or a different order, which can affect the results. In some cases I had an interpreter with me, for translating my questions and their answers to English. This can cause some biases. The first chip samples collected were accidentally thrown away. Only results in moisture content were collected the first week. The bags with chips collected were stored in a cooling-room in Pisa. The first samples collected that were sent to Norway were collected February 12th. The first samples were analysed April 12th on the ScanChip. Visually in April the chips looked to be in good condition and well preserved apart from some mould. Since the chips had been preserved in closed bags during this time, stored in cooling-room in Brazil, then treated with methyl bromide before being sent to Norway, the chips looked intact. Dry matter content that was measured in Halden on the samples collected in March. Although the dry matter content was measured a long time after the chips were collected the results should be reliable since the chips were stored in plastic bags. Apparently comparisons with results between ScanChip and the size classifier should be better if running the size classifier first. The reason for this is when shaking the chips in the size classifier, there can be some damages to the chips, making some fractions of the chips get loose. If you compare the results from the ScanChip and the size classifier, the ScanChip will then have a higher amount of smaller chips since they got loose when run through the size classifier. This is why it is better to do the comparison with already slightly damaged chips. Since I did measurements on the dust fraction as well, I chose to do my analyses the most efficient way - starting with the optical scanning and then doing the mechanical screening.
21

Although there was condensation inside of the bags, there were some problems with getting the small fractions out of the bags. Sand and sawdust were especially stuck, which may result in an underestimation of sand in the sawdust fraction analysis. The comparison of amount of sand with chips from Halden (which was run through the size classifier, burned within one day, and not stored in a plastic bag) was to give something to relate the results from the amount of sand from Brazil to a Norwegian mill. The outcome of this is that the Brazilian samples in my study should show a lower amount of sand than they do in reality. The amount of sand in Saugbrugs chips in Halden should be correct.
22
4. Norske Skog’s operations in Brazil 4.1 Norske Skog The following presentation of Norske Skog is based on information from the web site (www.norskeskog, 2007). Norske Skog is a world leading producer of newsprint and magazine paper, with 18 paper mills around the world. The group has about 13 percent of the world market for newsprint paper and 8 percent of the world market for magazine paper, the world market for newsprint and magazine paper is about 60 million tonnes. Norske Skogs’ goal is to ”deliver the best shareholder value in the industry”. To reach this goal, the company has ”opted to be a low-cost producer, pursue profitable growth and focus on its core business, newsprint and magazine paper”. The accessability of cheap raw materials and favourably-priced energy makes this goal attainable. Norske Skog has made a number of acquisitions, mainly between 1990 - 2001, which have secured a global production base. The 18 mills of Norske Skog are located in 14 countries. In Europe the mills are located in Austria, France, the Czech Republic, Netherlands, Germany and Norway. In Australasia, they are in it is New South Wales (Australia) and New Zealand. In PanAsia mills are in China, Korea, and Thailand. They also have two mills in South America: Norske Skog Bio Bio in Chile and Norske Skog Pisa in Brazil, the latter being the focus of this study.
The annual earnings of Norske Skog in South America are good, with a gross operating margin on average of 32 percent. Newsprint consumption in South America shows a healthy growth, and the Brazilian consumption has risen by five percent annually since 2003. About two-thirds of newsprint paper is imported.
4.2 Norske Skog Pisa The Pisa mill was commissioned in 1984 and was bought by Norske Skog in year 2000 from Fletcher Challenge. The mill is located in Jaguariaíva in the state of Paraná. The annual production capacity is currently 185 000 tonnes, with capacity expected to increase to 385 000 tonnes in 2009 after installing the PM 2 from Union. The capacity of the new machine is 200 000 tonnes. The primary products of this mill include newsprint and improved quality newsprint paper (www, norskeskog, 2007). Norske Skog in Pisa owns 20 000 hectares of forest land, of which 10 500 are productive forest land. At the pulp mill the company mainly uses loblolly pine (Pinus taeda), and some slash pine (Pinus elliottii). On their forest lands Norske Skog is planting thinleaf pine (Pinus maximinoi) which will be used in the future. The forests Norske Skog owns are located in areas close to the forests belonging to Vale Do Corisco. Norske Skog is outsourcing the silviculture to Florestal Vale Do Corisco. How Norske Skog will use the wood in the future is not really decided yet. One option is to use it all in the mill, the second; to undertake the silviculture, with the objectives to improve timber quality and sell the sawn timber to sawmills. In both cases it is possible to do some swaps with other forest owners like Stora Enso or Florestal Vale Do Corisco.
23
The forests of Norske Skog are situated within an area of 75 km. Pisa bought new land to be able to support the new PM 2 with pulp. There have also been new negotiations with Vale Do Corisco to increase the amount of roundwood to secure the increasing amount of chips required. The previous agreement with Vale Do Corisco provides Pisa 300 000 m3 each year for 50 years. This agreement started in 2002 when Norske Skog sold their forests and prior to the purchase of new land. When the PM 2 starts in 2009, the demand for chips will increase and the agreement will provide Pisa 750 000 m3 per year.
4.3 Wood Supply General supply of wood
Norske Skog buys slab wood chips from five sawmills and the mill are also producing their own roundwood chips. The mill uses 25 % sawmill chips in their production and 75 % are roundwood chips. Braspine is the biggest supplier of sawmill chips and Linea the second biggest. All chip suppliers, except StoraEnso get their logs from the forestry company Florestal Vale Do Corisco, and Norske Skog also get their pulpwood from the same company. Florestal Vale Do Corisco is FSC certified and is owned by Global Forest Partners (GFP) an American global timberland investment company (www, gfplp.com. 2007). Florestal Vale Do Corisco has about 100 000 hectares of which 60 000 hectares are planted. The homepage for the company that manages Florestal Vale Do Corisco’s forest is: http://www.valorflorestal.com.br/main.htm. Stora Enso obtains their logs from their own forest. The Wood Supply Agreement (WSA) between Norske Skog and Vale Do Corisco gives Norske Skog preference on buying the chips from the sawmills that buy wood from Florestal Vale Do Corisco and there are annual negotiations between Norske Skog and their suppliers. The WSA is valid for 50 years. The mill in Pisa also buys roundwood and sawmill chips on the market. There are agreements between Norske Skog and their suppliers regarding the quantity of chips to buy each month. The exception is Stora Enso where the mill in Pisa only buys specific amounts needed at that time. All suppliers get the same price for their chips, independent of the quality. Per month, Pisa receives (in green tonnes): Braspine 2 800 tonnes Linea 1 800 tonnes Embalatec 1 200 tonnes Benazzi 500 tonnes Stora Enso 1 000 tonnes Total 7 300 tonnes The price for the chips per ton is approximately the same as the price for logs per ton.
Mill operation The standard time the pulpwood is stored at the yard in Pisa is five days. During summertime there are big problems with fungus that forms blue stains in the wood and makes the wood darker, so the need for bleaching is increasing. In the chip yard, the average storage time is
24
four days and at most it is seven days. Similarly there are problems with fungus on the chips, especially during summer.
When making pulp into paper, the mill adds about four percent of Kraft pulp to improve the quality. Kraft pulp is mainly cellulose without lignin, and it increases the quality of the paper. Wood handling: Debarker: Andritz, dimention 4 200 * 18 000 mm Chipper: Kamyr type Disc model SH 501, chipper knives: Local supplier, mainly Demuth. Screening: Ingersoll Rand First stage model is 110b, second stage model is also 110b. Chipper and chip classifier: Kamyr Refiners: Main Line Andritz Sprout Bauer Reject Line Bauer
4.4 Suppliers of sawmill chips Braspine Braspine is Norske Skog´s main supplier of chips. The mill saws, dries and industrialises wood. The mill uses pine species for sawing, mainly P. taeda (about 80 %) and some P. elliottii (about 20 %). The wood comes from Florestal Vale Do Corisco. Braspine was founded in 1996 and production started in 1997. They are located just outside of the Norske Skog mill in Jaguariaiva. Braspine has 962 employees and is owned by two brothers. The company saws about 37 000 m3 per month and it supplies Pisa with 4 000 m3 chips, which is about 20 % of their volume. Braspine also sell chips to Arauco, which has a mill that makes MDF boards (Medium Density Fibreboard) in the area. The sawn wood is exported to USA. Braspine are FSC certified. Their homepage is: http://www.braspine.com.br/. The sawlogs are stored at the yard for a maximum of five days; the average is 2-3 days. They pay a bit extra to Florestal Vale Do Corisco to get the sawlogs fresh. They use band saws from the Peneira brand. Braspine separates three sizes of chips, and the biggest ones are chipped again. The sawmill stores the chips in containers. Machinery for chip production: Debarker: Demuth model DDF 600, production capacity of 210 000 logs per month. Chipper: Demuth model 100 (disc chipper). Screening: Demuth.
Línea The company was established in 2001. Linea also receives their sawlogs from the Florestal Vale Do Corisco Company. The sawmill produce 17 000 tonnes per month. Linea sells all chips to Norske Skog. Linea are traditionally the sawmill that has the highest chips quality. Their hompage is: http://www.linea.com.br/linea/parana.html. They use two band saws in their production. Linea export their products to USA and Europe. Their machines are all made in Brazil. Machinery for chip production: Debarker: Demuth model DDF 600.
25

Chipper: Bruno model PDI 320 * 520 (disc chipper). Screening: Bruno model PVBK 4,5 / 3. (Two stages of screening, between 40 mm and 6 mm in diameter.)
Embalatec This company produces stools from Pine and Eucalyptus and they have 8 mills in Brazil. The production is 3 000 units per hour. The company also produce briquettes that are sold in Brazil. Embalatec gets their lumber from Vale Do Corisco. Their products are sold in the USA and Europe, and supply products to high profile consumers of International Paper, Mercedes Benz and Volkswagen. In total the company has 1 000 employees, and the mill in Itararé, in the state of Paraná employs 300 people. Embalatec in Itararé produces 2 400 m3 of lumber and 1 200 tonnes of chips per month. Their machines are made in Brazil. Machinery for chip production: Debarker: Mase model ma 650. Chipper: Bruno model pbh 220 * 620. Screening: Bruno model pboc 4/5 m2.
Madeireira Benazzi This sawmill is located in Jaguariaiva as well. The sawmill stores their logs for five days on average. Benazzi use 4 300 green tonnes of sawlogs per month, it becomes: - 2 000 m3 lumber per month, all are sold to Braspine. - 200 tonnes per month is sawdust that they use themselves. Pisa receives 500 tonnes of chips per month, and Benazzi only sell their chips to them. The diameters being sawn are between a maximum of 700 mm and a minimum of 150 mm. The company has one owner, Mr Benazzi. He gets the wood from Florestal Vale Do Corisco. Benazzi has bought some forest now, and are planting trees there, but it will probably not be enough to support the mill. They have an old debarker machine that they use. It is from the state of Santa Catarina in Brazil where it is common to use this equipment. The chip quality from Benazzi is good except for a high amount of bark. Machinery: Debarker: Mendes model DST/30, production capacity 20 550 m3 per hour. Chipper: Bruno model PBH 150 * 520, production capacity 21 m per hour.
Screening: Bruno model PVBC 2,5 m2, production capacity 15 m per hour.
26

StoraEnso StoraEnso in Arapoti has an integrated saw and pulp mill. The company has forestlands in the surroundings areas, which are made up of about 50 % Eucalyptus and 50% loblolly pine. The pulp mill makes LWC paper (Light Weight Coated paper) for magazine production. StoraEnso import pulp from Chile and Argentina. The pulp mill, which started in August 2004, is 2.5 years old. They have one line. The sawmill of StoraEnso saws about 450 000 m3 each year, which is approximately 140 000 m3 per month. StoraEnso previously exported lumber to the USA, but now focuses on both Europe and Asia that are their primary markets. The StoraEnso sawmill in Arapoti is the biggest sawmill with one line in Brazil. Arauco is bigger but has two lines. The chips the mill produces are sold to different costumers. Today StoraEnso is not a big supplier of chips to Norske Skog, but this will increase in the future. The average distance from the harvesting area to the mill is 30 km, and the maximum distance is 60 km. The storage time is on average 2 days, and at maximum 4 days. StoraEnso is certified with ISO and Cerflor. Cerflor, like FSC, has three types of goals; environmental, economic and social. Their machines are Austrian but made in Brazil. They have a Moosmaiyer chipper, which is a European model.
4.5 Wood products utilized The main tree used in Norske Skog’s mill is loblolly pine, Pinus taeda, but the mill also utilizes slash pine, Pinus elliotti. Norske Skog have planted Pinus maximinoi in their forests to utilize in the future. All three of them are in the pine family, Pinaceae.
Table 1. Information about wood properties in different species (Norske Skog Pisa information, 2007)
Species Age Fiber length (mm)
Wall thickness (micro m)
Width
(micro m)
Lumen diameter (micro m)
Density
Kg/ m3
P. elliotti 23 3.8 8.4 49.4 32.6
P. maximnoi 12 3.2 6.1 45.0 33.0 430-490 P. taeda (log diameter > 8cm) 9 3.0 7.1 49.0 34.0 P. taeda (diameter > 8 cm) 16 3.4 7.5 50.0 33.0 P. taeda (diameter > 8 cm) 20 3.6 9.7 44.0 23.0 329-461
average 419 in Pisa
Norway spruce (juvenil) 2.0 2.8 22.0 16.0 Norway spruce (adult) 3.3 5.0 34.0 24.0 Pinus taeda Loblolly pine, Pinus taeda, is originally from the southeast of the USA. It is widely planted across the world. The pine fibres are used in a variety of paper products (Lundqvist et al. 2004) and is the primary tree used in paper production in Pisa.
Pinus elliotti The common name for Pinus elliotti is slash pine. The tree is native to the southeastern coastal area of the United States down to Florida. The normal habitat is on sandy,
27

poorly drained soils. The tree has been planted widely outside its native range as a timber tree for the forest products trade. Slash pine has a great economic value as a timber tree for lumber, pulp and paper.
Pinus maximinoi Thinleaf pine, Pinus maximinoi, is widely distributed on the Pacific Coast states of Mexico and Central America ( Lopez-Upton & Donahue, 2003).The species grows in climates varying from temperate-warmer to subtropical humid. This pine grows at elevations of 600 to 2400 meters and annual rainfall on these sites ranges from approximately 1000 to 2100 mm. Pinus maximinoi does not appear to tolerate freezing temperatures ( Lopez-Upton & Donahue, 2003). The wood of Pinus maximinoi is soft and light. Its potential uses include paper, firewood, resin extracts and timber production ( Lopez-Upton & Donahue, 2003).
28

5. Results / Findings The interview section is to describe the sawmill chips producers and the Pisa mill, this is presented in chapter 4 and will be comment upon in chapter 5.8. Also presented in this chapter are the results from my measurements.
5.1 Dry matter content The following diagram shows how the dry matter content varies over the period of time.
Dry matter content
0,00
10,00
20,00
30,00
40,00
50,00
60,00
70,00
02.07
02.07
02.12
02.13
02.14
02.14
02.15
02.15
02.28
02.28
03.06
03.07
03.08
03.09
03.15
03.15
Date
Per
cent
Braspine Linea Pisa
Diagram 1. Dry matter content.
These results show the dry matter content varying around 50 percent for the two sawmills Braspine and Linea, with Pisa being a bit lower. The first two samples were taken on February 2, a rainy day, so that could be the explanation for the difference that day. The other days on which samples were taken were not rainy. The mean value in Braspine during this period is 50.51 percent. In Linea the mean value is 50.95 percent. In Norske Skog’s mill the mean value is much lower; 45.20 percent.
5.2 Length, width and thickness distribution between the three chip producers
Tabel 2. Length, width and thickness distribution between the three chip producers
Length Width Thickness Mean(mm) Stand.dev Mean(mm) Stand.dev Mean(mm) Stand.devBraspine 19,5 6,0 16,7 7,9 4,7 1,4 Linea 16,7 5,4 16,4 8,9 4,2 1,2 Pisa 19,1 5,2 17,4 7,6 3,8 0,9
29

Table 2 shows the mean values and standard deviations from the two suppliers of sawmill chips and from the roundwood chips produced at Pisa. Pisa has lower standard deviation values in all three variables, which means that their chips are more homogeneous than the other ones. More information on length, width and thickness is shown in the following nine diagrams.
5.2.1 Length distribution of the three chips producers
Braspine
0
2,0
4,0
6,0
8,0
1 4 7 10 13 16 19 22 25 28 31 34 37 40 43
Length mm
Leng
th d
istr
ibut
ion
/ wei
ght %
Length, mm
Diagram 2. Length distribution in Braspine.
Linea
0
2,0
4,0
6,0
8,0
10,0
12,0
1 4 7 10 13 16 19 22 25 28 31 34 37 40 43
Length mm
Leng
th d
istr
ibut
ion
/ wei
ght %
Length, mm
Diagram 3. Length distribution in Linea.
30

Pisa
0
2,0
4,0
6,0
8,0
10,0
1 4 7 10 13 16 19 22 25 28 31 34 37 40 43
Length mm
Leng
th d
istri
butio
n / w
eigh
t %
Length, mm
Diagram 4. Length distribution in Pisa.
Diagrams 2,3 and 4 show that the length distribution varies between the three chip producers. In Braspine the length is varying mainly between 13 and 28 mm. In Linea the length distribution is different; the tip is from 13 mm and the scale is decreasing from there. The length distribution in Norske Skog’s mill in Pisa has a peak at 20 mm and has a more normal distribution curve.
5.2.2 Width distribution of the three chips producers
Braspine
0
2,0
4,0
6,0
8,0
1 4 7 10 13 16 19 22 25 28 31 34 37 40 43
Width mm
Wid
th d
istri
butio
n / w
eigh
t %
Width, mm
Diagram 5. Width distribution in Braspine.
31
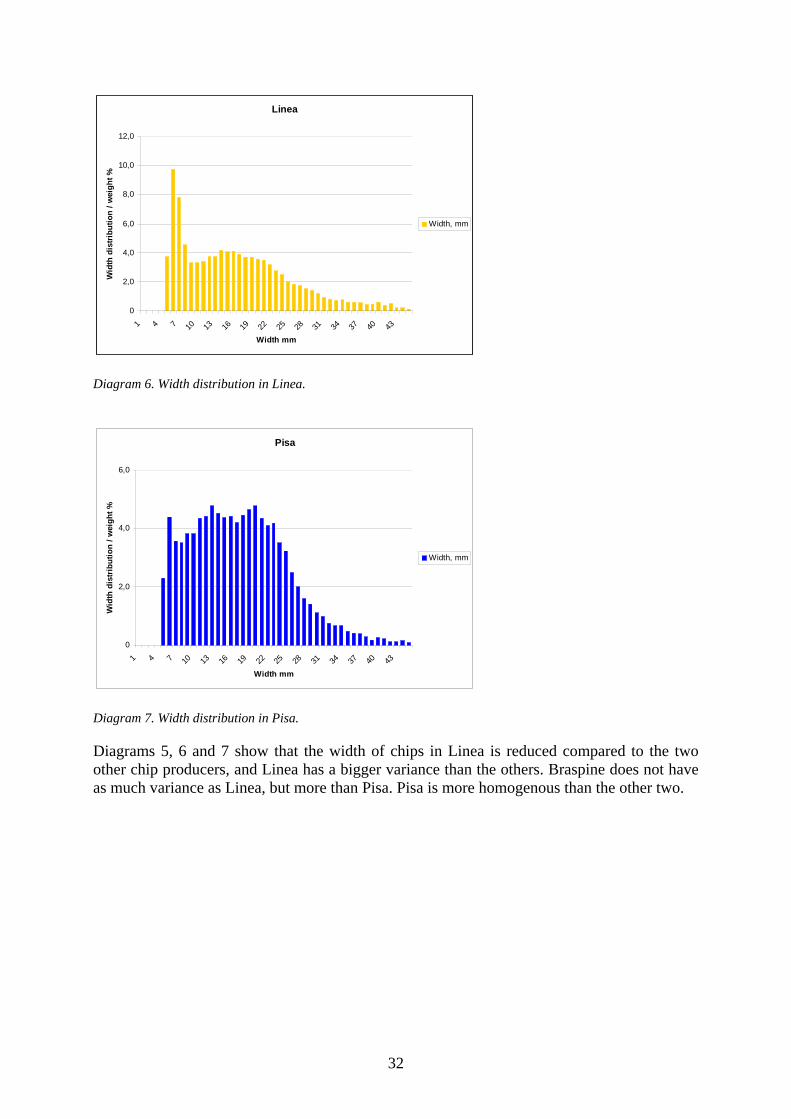
Linea
0
2,0
4,0
6,0
8,0
10,0
12,0
1 4 7 10 13 16 19 22 25 28 31 34 37 40 43
Width mm
Wid
th d
istri
butio
n / w
eigh
t %
Width, mm
Diagram 6. Width distribution in Linea.
Pisa
0
2,0
4,0
6,0
1 4 7 10 13 16 19 22 25 28 31 34 37 40 43
Width mm
Wid
th d
istr
ibut
ion
/ wei
ght %
Width, mm
Diagram 7. Width distribution in Pisa.
Diagrams 5, 6 and 7 show that the width of chips in Linea is reduced compared to the two other chip producers, and Linea has a bigger variance than the others. Braspine does not have as much variance as Linea, but more than Pisa. Pisa is more homogenous than the other two.
32

5.2.3 Thickness distribution of the three chip producers
Braspine
0
5,0
10,0
15,0
20,0
25,0
0,5 1,5 2,5 3,5 4,5 5,5 6,5 7,5 8,5 9,5 10,5
11,5
Thickness mm
Thic
knes
s di
stri
butio
n / w
eigh
t %
Thickness, mm
Diagram 8. Thickness distribution in Braspine.
Linea
0
5,0
10,0
15,0
20,0
25,0
30,0
0,5 1,5 2,5 3,5 4,5 5,5 6,5 7,5 8,5 9,5 10,5
11,5
Thickness mm
Thic
knes
s di
stri
butio
n / w
eigh
t %
Thickness, mm
Diagram 9. Thickness distribution in Linea.
33

Pisa
0
5,0
10,0
15,0
20,0
25,0
0,5 1,5 2,5 3,5 4,5 5,5 6,5 7,5 8,5 9,5 10,5
11,5
Thickness mm
Thic
knes
s di
strib
utio
n / w
eigh
t %
Thickness, mm
Diagram 10. Thickness distribution in Pisa.
Diagrams 8, 9 and 10 show that the thickness distribution varies between the three chip producers. The sawmill chips from Braspine and Linea are thicker than those from Pisa.
5.3 Comparison between SCAN and ScanChip results In the three following diagrams the results are given on the chips from the two sawmills and on the roundwood chips. In the size classifier, the measurement that I have called SCAN CM 40 is a measurement on the amount of bark. The ScanChip machine is unable to differentiate the properties of the piece being measured, whether it is wood or bark. Therefore, the volume of bark can only be seen in the results of the size classifier.
Braspine
0,0
10,0
20,0
30,0
40,0
50,0
60,0
F1 Oversize
F2 Overthick
F3aLarge
accept
F3bSmallaccept
F4 Pinchips
F5Sawdust
Bark
Per
cent SCAN-CM 40
ScanChip
Diagram 11. Comparison between SCAN and ScanChip results; Braspine.
34

Diagram 11 shows that the measurements from the size classifier and how it the ScanChip vary. The biggest variation between the two analyses is in the chip fractions F3a and F3b.
Linea
0,0
10,0
20,0
30,0
40,0
50,0
60,0
F1 Oversize
F2 Overthick
F3aLarge
accept
F3bSmallaccept
F4 Pinchips
F5Sawdust
Bark
Perc
ent
SCAN-CM 40ScanChip
Diagram 12. Comparison between SCAN and ScanChip results; Linea.
In Diagram 12 we see the same trend as in Diagram 11. The biggest difference is in large accept chips and small accept chips.
Pisa
0,0
10,0
20,0
30,0
40,0
50,0
60,0
70,0
F1 Oversize
F2 Overthick
F3aLarge
accept
F3bSmallaccept
F4 Pinchips
F5Sawdust
Bark
Perc
ent
SCAN-CM 40ScanChip
Diagram 13. Comparison between SCAN and ScanChip results; Pisa.
Diagram 13 shows a bigger difference between the size classifier (SCAN-CM 40) and the ScanChip results in the different fractions, compared to Diagram 11 and Diagram 12.
35
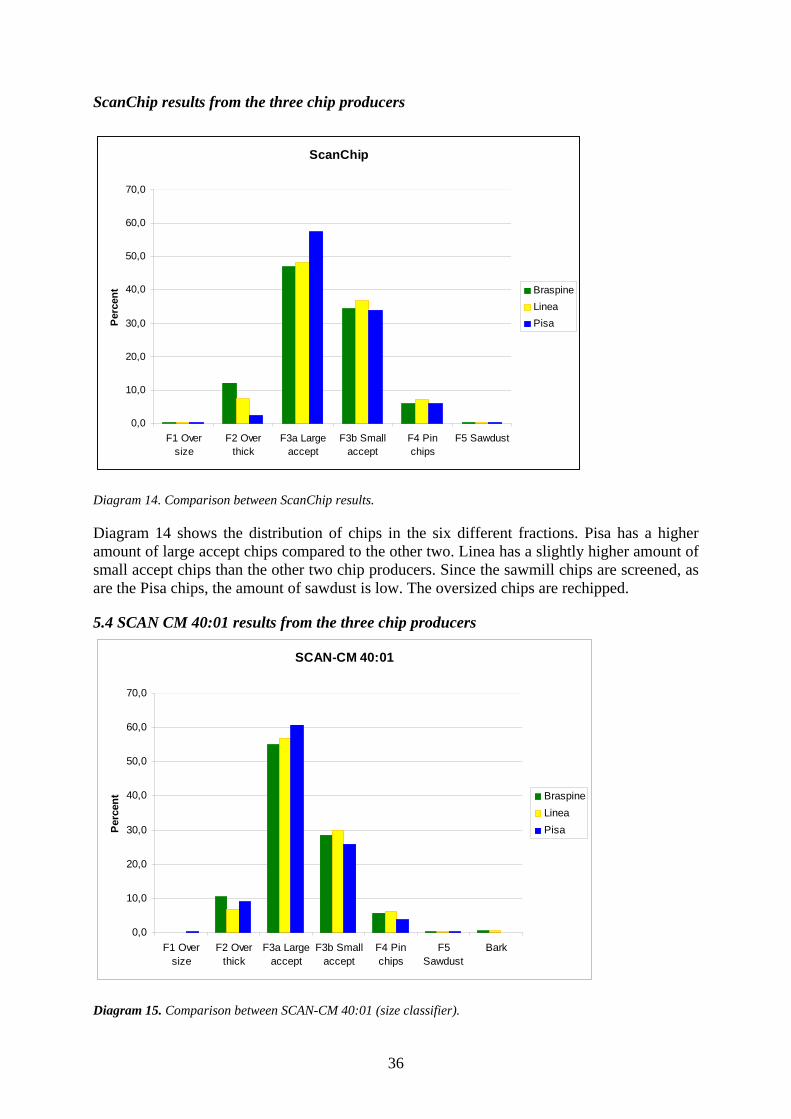
ScanChip results from the three chip producers
ScanChip
0,0
10,0
20,0
30,0
40,0
50,0
60,0
70,0
F1 Oversize
F2 Overthick
F3a Largeaccept
F3b Smallaccept
F4 Pinchips
F5 Sawdust
Perc
ent Braspine
LineaPisa
Diagram 14. Comparison between ScanChip results.
Diagram 14 shows the distribution of chips in the six different fractions. Pisa has a higher amount of large accept chips compared to the other two. Linea has a slightly higher amount of small accept chips than the other two chip producers. Since the sawmill chips are screened, as are the Pisa chips, the amount of sawdust is low. The oversized chips are rechipped.
5.4 SCAN CM 40:01 results from the three chip producers
SCAN-CM 40:01
0,0
10,0
20,0
30,0
40,0
50,0
60,0
70,0
F1 Oversize
F2 Overthick
F3a Largeaccept
F3b Smallaccept
F4 Pinchips
F5Sawdust
Bark
Perc
ent Braspine
LineaPisa
Diagram 15. Comparison between SCAN-CM 40:01 (size classifier).
36

Diagram 14 shows the results from the size classifier from the two sawmills and the roundwood chips. Pisa has a higher amount of large accept chips compared to the sawmill chips. Linea is slightly higher in the F3b fraction. The amount of bark is small in the sawmill chips and the amount of bark in the Pisa chips is so small that it’s not visible on this diagram.
5.5 Comparison between SCAN results made in Pisa and in Norway The following six diagrams show comparisons between the results from the tests that are performed daily in Norske Skog’s mill in Pisa and the results from the samples being analysed in Halden, Norway. The diagrams compare the results between the mill in February and in March. Results labelled Cavaco, (which means “chips” in Portuguese) are those coming from Pisa, and the ones with just the mill’s name are those being analysed in Norway. The analyses have been made on two different size classifiers, but both machines are according to SCAN 40:01.
Braspine Comparison February
0,00
10,00
20,00
30,00
40,00
50,00
60,00
F1 F2 F3a F3b F4 F5 Bark
perc
ent
Braspine
CAVACO BRASPINE
Diagram 16. Comparison between SCAN-CM 40:01 results made in Pisa and in Norway on Braspine chips collected in February.
37
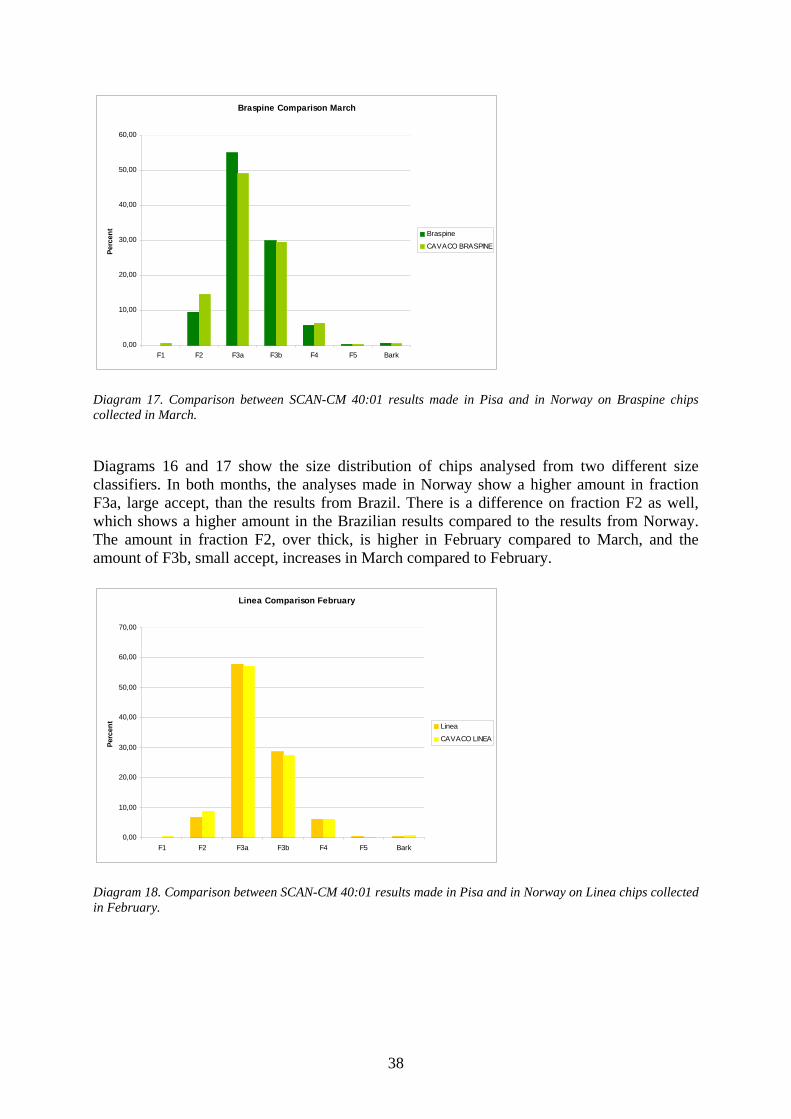
Braspine Comparison March
0,00
10,00
20,00
30,00
40,00
50,00
60,00
F1 F2 F3a F3b F4 F5 Bark
Perc
ent
Braspine
CAVACO BRASPINE
Diagram 17. Comparison between SCAN-CM 40:01 results made in Pisa and in Norway on Braspine chips collected in March.
Diagrams 16 and 17 show the size distribution of chips analysed from two different size classifiers. In both months, the analyses made in Norway show a higher amount in fraction F3a, large accept, than the results from Brazil. There is a difference on fraction F2 as well, which shows a higher amount in the Brazilian results compared to the results from Norway. The amount in fraction F2, over thick, is higher in February compared to March, and the amount of F3b, small accept, increases in March compared to February.
Linea Comparison February
0,00
10,00
20,00
30,00
40,00
50,00
60,00
70,00
F1 F2 F3a F3b F4 F5 Bark
Perc
ent
Linea
CAVACO LINEA
Diagram 18. Comparison between SCAN-CM 40:01 results made in Pisa and in Norway on Linea chips collected in February.
38

Linea Comparison March
0,00
10,00
20,00
30,00
40,00
50,00
60,00
F1 F2 F3a F3b F4 F5 Bark
Perc
ent
Linea
CAVACO LINEA
Diagram 19. Comparison between SCAN-CM 40:01 results made in Pisa and in Norway on Linea chips collected in March.
Diagrams 18 and 19 show the results from chip samples taken from the Linea mill. The biggest difference in results from Pisa and from Norway are in March, in fraction F2, over thick, and F3b, small accept. In fraction F2 the amount of over thick chips is higher in analyses made in Pisa, and in fraction F3b the amount of small accept chips is higher in analyses made in Norway. Large accept chips are decreasing in volume from February to March.
Pisa Comparison February
0,00
10,00
20,00
30,00
40,00
50,00
60,00
70,00
F1 F2 F3a F3b F4 F5 Bark
Perc
ent
Pisa
CAVACO PISA
Diagram 20. Comparison between SCAN-CM 40:01 results made in Pisa and in Norway on Pisa chips collected in February.
39

Pisa Comparison March
0,00
10,00
20,00
30,00
40,00
50,00
60,00
70,00
F1 F2 F3a F3b F4 F5 Bark
Perc
ent
Pisa
CAVACO PISA
Diagram 21. Comparison between SCAN-CM 40:01 results made in Pisa and in Norway on Pisa chips collected in March.
Diagrams 20 and 21 show a comparison between measurements from roundwood chips cut at Norske Skog’s mill in Pisa. The analyses made in Pisa are lower in F3a and higher in F3b compared to the analyses made in Norway. The difference between February and March is that F3a increases in amount and F3b decreases in amount during this period.
5.6 Contamination/ pollution The following diagram shows the amount of sand in the sawdust fraction. For extra information, this measurement was also made on Norske Skog’s mill in Halden.
Sand
Halden
BraspineLinea
Pisa
0
0,001
0,002
0,003
0,004
0,005
0,006
0,007
0,008
Mills
Per
cent
Diagram 22. Amount of sand in the sawdust fraction from four different chip producers. Diagram 22 shows the amount of sand in the sawdust fraction. The amount is much higher in the sawdust from Brazil, compared to the results from the chips used at Norske Skog’s mill in Saugsbruk, Norway. The highest amount is found in the samples from the two sawmills, although when the samples were being analysed there was condensation on the plastic bags
40
and material was stuck inside the plastic bags. The amount of inorganic material should therefore be higher.
5.7 Relation between chip properties and cost for pulpwood production Cost for chips at the refinery: The price for sawmill chips is about 74 percent of the price of roundwood chips (Graeml. 2007). The log price depends on exchange rates as well. The supplier of the sawmill chips pays the transportation costs. The transportation costs for pulpwood vary depending on the distance. Since the storage time for both pulpwood and sawmill chips is only for a few days, the interest cost is small. There are also costs for wood yard handling; this cost is usually higher for round wood. Cost for acquisition and administration is assumed to be equal for both assortments since it is mainly an agreement between the mill and their supplier(s) (Nylinder, 2007). A big difference between roundwood and sawmill chips is the cost for debarking and chipping (Nylinder, 2007). Whereas the sawmill chips arrive as a finished product, after purchasing the roundwood logs, the mill has a chip-production cost to include in the pricing of the costs of the roundwood chips. When getting the logs, the mill has a refinery cost to include in the final costing. There are also losses when drum debarking the logs and according to Scandinavian conditions this is normally assumed to be 3 percent. The sawmill chips are not screened at the pulpmill, the losses associated with sawmill chips occur when filtering and washing the chips prior to the refinery and is mainly a result of sawdust and pin chips being removed.
Impact of chip quality on paper production when using sawmill chips are fibre length, lower brightness, light scattering, opacity, increased kraft pulp consumption, and sand, to mention a few (Axelsson, 2007). The amount of sawdust, pin chips, sand and bark is higher in sawmill chips compare to chips from pulpwood.
All factors except for that of fibre length seem to be negative for sawmill chips (Axelsson, 2007). The slabwood chips have longer fibres that have a positive effect on the pulp and paper strength. The amount of sawdust, pin chips, sand and bark is several times higher in sawmill chips. Taking these different aspects into account this indicates that the cost for sawmill chips seems to be low and it may be of value to keep sawmill chips as a raw material resource, although there are indirect costs to take into account.
5.8 Observations The interview results are describing the sawmills that Pisa mill gets their slab chips from, and are showed in chapter 4. When comparing the visits made in Sweden to the once made in Brazil, one striking difference is the distinction in employees and more manually production. The chip analyses shows there is a difference in chip properties, the chips produced by Norske Skog in Pisa are more homogenous compared to the sawmill chips. The amount of pollution is also higher in the sawmill chips, which gives higher indirect costs. Taking this factor into account when looking at the pulp production, the company should use only the chips produced by them. But using only roundwood chips, the company has costs of producing the chips, the sawmill chips come as a ready made product.
41

5.9 Summary
Length Width Thickness Contamination Mean(mm) Stand.dev Mean(mm) Stand.dev Mean(mm) Stand.dev Percent Braspine 19,5 6 16,7 7,9 4,7 1,4 0,0075 Linea 16,7 5,4 16,4 8,9 4,2 1,2 0,0071 Pisa 19,1 5,2 17,4 7,6 3,8 0,9 0,0042 Halden 0,0011 - From a production view it is better having homogenous chips for having an even flow. The Standard deviation should therefore be low. The sawmill chips are having higher standard deviations which makes the production more complex, and are both affecting the quality and the price. - The contamination are higher in general in the Brazilian mills, the sawmill chips are having the highest amount. The contaminations are affection the production costs in an extensive way.
42
6. Analysis Today Norske Skog buys 25 percent of their chips and produces 75 percent of the chips in the pulp mill. The company are mainly using long-term agreements for the purchase of chips and logs. Earlier studies made by Norske Skog have shown that using sawmill chips results in negative effects on the quality of the pulp. Norske Skog has to think of which of following options will be most beneficial; to produce more themselves or to improve the quality of the chips they buy. Since the company changed their input of chips from 20 percent to 25 percent in the beginning of year 2007, the option to produce all chips themselves does not look like the option they have chosen. The technology of the firm being used when producing the chips provides the frames of the company’s production. The technology of the suppliers can be seen as a link to the facilities of the producers. Since Norske Skog is using 25 percent of the chips input from their suppliers the technology utilised is important for the pulp production. This is Norske Skogs own technology. It is important that the chips are similar for getting an even production and an even quality of the pulp. The chip result showed that the roundwood chip are more homogenous in size than the sawmill chips, they are not varying as much as the sawmill chips which are preferred when producing making the pulp for having an even production. Roundwood has better chip fractions according to my studies.
6.1 Make or buy Having long term agreements means that the firm is able to have a competitive advantage of competence build on a variety of foundational resources. Buy having long term agreements the access to valuable resources and relationships the company are more competitive. Negative effects can be that participating in them can lead to loss of power in their own decision making. Also the allocation of power can be uneven when having long term agreements, which makes an asymmetrical dependence. The technology the firm got is deciding the flexibility of the production. The results show that the chips produced in the pulp and paper mill in Pisa have are more homogenous than the chips produced at their two biggest suppliers. Homogenous chips are to prefer since the production then are easier to adapt to the chips. Norske Skog has chosen to increase the input amount of sawmill chips from 20 to 25 percent, although the pulp mill can produce chips of better quality themselves. When the company is buying chips, they buy one produced product which means that they do not have the costs of produce the chips themselves. The price of sawmill chips is about 74 percent of the price of the roundwood chips. Flexibility increases when a company does not integrate backwards. Norske Skog has long term agreements for most of their chip suppliers, which makes the company less flexible. In recent years they started buying forest areas again, but the strategy of how to use the lumber does not seem to be decided. The company can sell the lumber to sawmills or chipping all at once. Although the trend of buying forest lands stoped after just a short time and are no longer taking place.
43

Other aspects to take into account are the costs for chips at the refinery. The price for sawmill chips is about 74 percent of the price of roundwood chips, as mentioned earlier. A big difference between roundwood and sawmill chips is the cost for debarking and chipping. When getting the logs, the mill has a refinery cost to include in the final costing. Other factors affecting the pulp when using sawmill chips are fibre length, lower brightness, light scattering, opacity, increased kraft pulp consumption, and sand, to mention a few (Axelsson, 2006). The amount of sawdust, pin chips, sand and bark is higher in sawmill chips compare to chips from pulpwood. All factors except for that of fibre length seem to be negative for slabwood chips. The slabwood chips have longer fibres that have a positive effect on the pulp and paper strength. The amount of sawdust, pin chips, sand and bark is several times higher in sawmill chips. The cost for sawmill chips are lower and it may be of value to keep sawmill chips as a raw material resource, although there are negative affects for pulp production using sawmill chips.
6.2 Purchasing The processing industry is dependent on raw material to keep the production running. Each firm has different conditions to take into account and have their unique way of doing the purchasing; there is not just one way of doing that. Norske Skog has chosen the strategy to just produce pulp and paper, selecting not to own any forested land from which they obtain product from. Norske Skog has chosen not to integrate backwards. They are not a vertical integrated company. To be sure about supply of raw material, they have made long term agreements with only a small amount purchased on the market. Norske Skog has shown changes in the way they are cooperating with their suppliers. One new employee is focusing on getting a better chip quality from their suppliers, explaining why it is important to improve the quality of the chips. Now Norske Skog is still paying the same price for the chip, the future will show if there will be some incentives, some benefits for improving the quality. Purchasing and sales involves search costs, cost of negotiating and drawing up contract. There are also other types of transaction costs to take into account. If the costs related with organizing across markets are greater than the administrative costs of organizing within firms, then the company are likely to keep the production within the firm. When having vertical relationships the risks involved usually decreasing. Long term agreements are decreasing these risks for Norske Skog, and having agreements are the best promise for future business. The positive affects of having long term agreements include that there can be adjustments for getting the best solutions for each of the specific companies, although the dependence on each other will also then increase. The collaboration can lead to savings in indirect costs, by adjusting the good a more suitable way for the producer. If the producers are having a close collaboration, the collaborations are also stable, although close collaborations are increasing the dependence between the supplier and the buyer. It is necessary to take resources into account when developing the cooperation; it takes time and money for adjusting the good to a more adjusted product. Norske Skog are engaging their suppliers in improving chip quality and are putting resources in this, and in return are hopefully receiving chips of improved quality.
6.3 Sawmill chips improvements To improve the chip quality there are several factors to keep in mind. Pisa is already doing daily measurements for getting statistics about their suppliers. All sawmills except one, Benazzi, have the same price for the chips. The price is based on annual negotiations. When getting information of the chip input, the possibility of improving the production increases.
44

One way to improve the chips is to base the price on the quality of the chips. The pulpmill should negotiate the price with individual suppliers based on their chip quality. Another way of improving the sawmill chips is for Norske Skog to have incentives when having a big amount accepted chips, fraction F3a and F3b. This system is used in Scandinavia, for example. “Good chips” are being rewarded and bad chips are being penalized. An example of rewarding better chip quality is the system being used at VMF Qbera in Sweden, where the limits for different fractions are set to (Thyberg, Lars-Olof. Published: 2006-04-26): Fraction Wrack when more than (percent): Bark 1.5 F1 over size 3.0 F2 over thick 15.0 F3a large accept - F3b small accept - F4 Pin chips 15.0 F5 sawdust 3.0 Rot chips 1.0 Pisa can be responsible for the chip screening at the sawmills. The pulp mill is the party with the greatest interest in having good chip quality. If Pisa buys the chips at the sawmill and then does the screening there, the sawmill chips should be of good quality. The mill in Pisa can invest in good screening equipment, so the chips are also screened when arriving at the pulpmill.
6.4 Suppliers Most important when taking into account in relationship-based resources is the resources needed from the gained through marketing relationships, the suitability of various partners from economic, strategic, and social perspectives, and the sustainability of advantages that arise when relationship marketing focuses on portions of this second component (Morgan & Hunt. 1999). Information is easy to access, which makes both buyer and producer more demanding. Norske Skog´s Pisa mill are having the advantageous to improve their chip quality since they have a dialogue between their suppliers and the mill. Overall it is important to have a good relation with the suppliers. When having agreements the company are getting some of the benefits of integrating backwards. Having an agreement makes the dialogue between the supplier and the buyer easier. These relationships are making their suppliers adjusting their chips which are improving the pulp quality. Using sawmill chips for production has both positive and negative affects, and there are much to improve in the sawmill production. One company can have one or many suppliers, the number of suppliers that are chosen often affecting the company both in the short and long term. Instead of doing the measurements of the chips themselves, another way to record these statistics is to have an independent association conducting the measurements
45

7. Discussion In general The aim for my study was to develop better knowledge of the chips used in the pulp and paper production at Norske Skog’s facility in Brazil and to use these results when looking at which strategy Norske Skog´s has chosen for their supply of chips. I did this by analysing the chip fractions according to SCAN standards and on a ScanChip. Studies were also done on dry matter content and on pollutants (amount of sand) in the chips. Since Norske Skog performs daily measurements of the chips some comparisons were done between my results and the results from Brazil. My study was done on the two biggest suppliers of sawmill chips and on the roundwood chips produced at Pisa. These results were taken into account when looking at the firm’s strategy. As the sawmill chips are 25 percent of the raw material used in the production there is great value in improving the chip quality. Norske Skog has chosen to produce most of their chips themselves and mainly use long term agreements for securing their chip supply. By using long term agreements the firm almost has the same benefits of integrating backwards with vertical integration. The use of management control measures is a good way to improve this. There are also negative side effects of using sawmill chips including the amount of sand and the inefficient allocation of the chips. The sawmill chips have different qualities of their fibres compared to the roundwood chips. Sawmill chips have thicker walls of the fibres, which have a negative effect on sheet structure, surfaces and optics. These increases the production costs and is negative for quality, and therefore are increasing the indirect costs. Norske Skog has increased the use of sawmill chips in their production that indicates that there are benefits of increasing the amount of sawmill chips instead of doing the opposite. The price of sawmill chips are much lower compared to roundwood chips, and there are minimal costs added when using the sawmill chips. When buying roundwood chips the costs of producing the chips has to be taken into account. The purchasing role is of big importance since Norske Skog are buying both roundwood and sawmill chips for pulp production. By using long term agreements Norske Skog are getting positive effects by integrating backwards. The positive effects are the benefits of having a collaboration between supplier and buyer which thereby has a positive impact on the goods produced. Although by having long term agreements the company is decreasing their flexibility. The chip results show some variation in the dry matter content, and also a variation in chip size between the three chip producers. The optimal result would be homogenous chips from the three different suppliers, this is giving a lower production cost. The results are being compared to Scandinavian chips. The dimension of chips from a single sawmill are almost as uniform as those of chips made by a pulp mill, and the geometry is relatively consistent over time. But since the geometry differs among sawmills, the resulting mix has low uniformity. Therefore it is possible to improve the resulting mix by adjusting chip dimensions from different sawmills towards target values. Possitive results have been shown for Norske Skog in Norway where the sawmills adjusted the equipment to increase similarities between sawmill chips to those of roundwood chips.
46

To improve the resulting mix in Pisa, things to take into account is if the speed of the chipper is increased in Braspine, the chips should be more similar to the chips produced in Linea. If the goal is to have bigger chips, the changes should be the opposite, the speed on the chippers should be decreased in Linea to obtain a size more similar to those produced at Braspine.
Dry matter content The results in diagram 2 show that dry matter content in general is lower in the roundwood compared to the two sawmill chip producers. These results are unexpected, since the sawmill chips come from sapwood. Sapwood is the outer parts of the tree where the transportation of water occurs, resulting in higher moisture content. This can be compared to the roundwood chips, which are from the dryer heartwood and would be expected to have lower moisture content. Reasons for this may be that the heartwood in the fast growing pine trees does not have the time to develop. The density in the top of the tree can be low related to the rest of the tree. There seems to be a correlation between high density and low moisture content (Nylinder, 2007).
Size distribution The length distributions from the three chip producers in diagrams 2, 3 and 4 show different size distributions when analyzed in the ScanChip. The allocations of the chips show that the over sized chips are being cut again. The two peaks in diagram 2 shows that the chips are being cut on two sources. The reason for this may be that there is more then one source for chipping. The rechipper could for example be trimmed differently compared to the main disc chipper. Compared to Scandinavian results, the lengths are generally shorter at the three Brazilian chip producers. The peak on Braspine around 13 mm suggests that the settings should be changed so the chips from that cutter will be longer. Linea, which has the highest weight percent amount of about 13 mm, is very short as well. This can be compared to the standard length in Sweden which is about 22 mm. The problem is that when the chips are too short, more fibres are being cut off (Bergman, 2007). It is easier, though, to get a homogenous input if the lengths of the chips are a bit smaller. To change the size of chips the chipper should be adjusted. If you increase the length, the width and thickness are increasing as well and this may be undesirable. In general the widths from all three chips producers are thin compared to Scandinavian chips. The chips in Scandinavia are more square-shaped. The thickness distribution shown in diagrams 8, 9 and 10 shows the chips are quite thick compared to Scandinavian ones. The distribution is similar for all three chip producers. If the chippers are changed to increase the length, the thickness will also increase. Since the chips from all three chips producers are quite thick already, this might not be the best choice. It seems that the relation between length, thickness and width is not the same for Norway spruce in Scandinavia as it is for pine in Brazil.
47

Comparisons SCAN and ScanChip The results from analysing chips in SCAN compared to ScanChip show quite uniform results. The size classifier, SCAN, has in general a slightly higher amount of large accept chips, and ScanChip has in general a higher amount in fraction of small accept chips. The results are different between the two methods, but the relationship between the two methods is about the same. For fraction F2 Pisa shows a different result, having a smaller amount of over thick chips in results from ScanChip compared to the SCAN size classifier. Diagram 14 shows that the over thick fraction from Pisa is much lower than from the two sawmills. On the other hand, the results from the size classifier (SCAN) show a higher amount of over thick chips. The biggest difference in that fraction is the chips from Pisa. Diagrams 14 and 15 indicate that the relation between the mills will be the same for both fraction analyses. The results from the size classifier in Brazil compared to the size classifier from Norway should be similar, but in all six cases (Diagram 17-21) there are variations between the fractions. The size classifiers are two different brands. The Brazilian one is a Marconi, which is a Brazilian brand. The different brands of the size classifiers or the possibility of small defects in one of them could be the reason for the different results. In Pisa mill samples are taken every working day, which means that their collections are made on more samples than mine. The difference between February and March do not seem to vary substantially. There are a number reasons why my results differ from the analyses made in Brazil. Factors having effects on this difference could be the storage of the chips in plastic bags, the transportation to Norway, and the handling of the bags during this time. I started to do my analyses on the ScanChip first, then the size classifier which could have affected the results. Since the chips were stored in bags before both analyses maybe the moisture inside the bags affected the chips in a way that they did not separate efficiently. Since the size classifiers are different mills, differences in the machines could have affected my results. This, though, should not be a significant source of error in my results. The difference between measurements is about the same for all the producers, which indicates that in relative terms the results are the same for measurements made in Brazil and Norway. Contamination/ Pollution The amount of sand from the four chip producers shows a much higher amount of contamination in all three Brazilian mills compared to the Norwegian one. The highest amounts of sand are the ones from the two sawmills. In Norske Skog’s mill in Pisa, the discs in the refiner are changed every 1-2 weeks. Normally in other mills the discs are changed every 6-8 weeks (Axelsson, 2007).
48
8. Conclusions The prices for purchased chips are much lower compared to the own produced chips, there can be benefits of using this wood especially when improving the quality. As sawmill chips represent 25 percent of the rawmaterial supply, the quality of this material is of great importance, although sawmill chips and roundwood chips has different attributes to take into account. Roundwood has better chip fraction according to my studies. By using long term agreements Norske Skog are getting positive effects by integrating backwards. The positive effects are the benefits of having a collaboration is that supplier and buyer has impact on the goods. Althought by having long term agreements the company is decreasing their flexibility as well. The purchasing roll is of big importance since Norske Skog is buying both roundwood and chips for producing pulp. The overall result of this investigation indicates that there is much potential to improve the quality of the sawmill chips delivered to Pisa. The sawmill chips are having a greater variance compared to the roundwood chips. To improve the pulp production the chip input should be changed to be more homogenous. The sawmill chips have a lower moisture content than chips from pulpwood. When having a greater variance in chip size, the indirect costs of producing chips are increasing. In general the chips from Pisa are short and thin. To increase the uniformity of the resulting mix of chips, the chipper can be changed at the sawmills. If the length of the chips increases then the chips get bigger in total. However, since the chips are already thick, this might not be the best solution. It seems that the relationship between length, width and thickness is not the same for Norwegian spruce in Scandinavia as it is for pine in Brazil. This factor should be researched further before adjusting the chippers. The size distribution of the chips is better for the chips made of roundwood at Pisa compared to the two sawmills being studied. This indicates that the sawmill chips can be improved. The results from the length distribution at Braspine show that improvements should be made. The chip size distribution from mechanical screening and optical scanning gives different results. As the difference seems to be the same for all chip sizes, it is independent of which system is being used as long as the method employed is stated when results are compared. The quantity of sand is much higher in the Brazilian mills compared to the Norwegian one. The mill in Brazil has to change the discs in the refiner every 1-2 weeks, which is a big expense. Normally in other mills the discs are changed every 6-8 weeks.
49

9. References Books Christensen L. Marknadsundersökning, Studentlitteratur, Lund,1998. David Farmer & David Jessop. 2005. Purchasing Principles and Management. Prentice Hall. Lars-Erik Gadde & Håkan Håkansson. 1998. Professionellt inköp. Andra upplagan, Studentlitteratur, Lund. Robert M. Grant. 1999. Contemporary Strategy Analysis. 1-4051-1999-3. I.M. Holme & B.K. Solvang. 1997. Forskningsmetodik - Om kvalitativa och kvantitativa metoder. Studentlitteratur, Lund. Olsson, H & Sörensson S. Forskningsprocessen- kvantitativa och kvalitativa perspektiv, Liber,
Stockholm, 2001.
Svante Körner, Lars Wahlgren. 2000. Statistisk dataanalys. Studentlitteratur. Svante Körner, Lars Wahlgren. 1998. Statistiska metoder. Studentlitteratur Kenneth Lyson. 1999. Purchasing. Edition: 4. Bell and Bain Ltd, Glasgow. Ulf Skoog & Conny Wiklund. 2001. Proffs i inköp. ProjektBolaget Ögren-Skoog AB. Articles Jay Barney. 1991. Firm Resources and Sustained Competitive Advantage. Journal of Management 1991, Vol. 17, No 1, 99-120. Robert M. Morgan & Shelby Hunt. 1999. Relationship-Based Competitive Advantage: The Role of Relationship Marketing Strategy. Journal of Business Research 46, 281-290. C.K. Prahalad & Venkatram Ramaswamy. 1999. Co-opting Customer Competence. Harward Business Review. January-February 2000. Reports Magnus Berg, Anders Bjurulf, Isabelle Duchesne, Örjan Hedenberg, Mattias Löfgren. 1995. Vad är färskhet? Skogforsk Resultat. Nr 5 1995. Magnus Berg, Anders Bjurulf and Mattias Löfgren. 1995. Uppdelning av granmassaved efter egenskaper. Skogforsk Resultat. Nr 6 1995. Anders Bjurulf. 2006. Chip Geometry. Methods to impact the geometry of market chips. Doctoral Thesis No. 2006:61. Faculty of Forest Sciences.
50

Örjan Hedenberg & Sven-Olof Lundqvist. 1998. Processkrav på flis. Forskningsprogram 1997-1999, STFI – Rapport P 14. April 1998. Örjan Hedenberg, Sven-Olof Lundqvist and Tord Bergman. 1998. Storlek hos flis från olika huggar och reducerare. STFI – Rapport P 16. September 1998. Forskningsprogram 1997-1999. Thyberg, Lars-Olof. Published: 2006-04-26. VMF Qbera in Sweden. Javier Lopez-Upton & Jeffrey Donahue. 2003. Tropical Tree Seed Manual. Published 2003-01-01. Internet links: http://www.norskeskog.com/IFrame.aspx?m=253 2007-08-30. http://www.fao.org/docrep/p5520e/p5520e04.htm 2007-09-14. http://www.vmfqbera.com/default.asp 2007-09-14 Interviews: Patrik Axelsson, Norske Skog. 2007 Tord Bergman, Iggesund Tools. 2007 Henrique Graeml, Norske Skog. 2007 Mats Nylinder, Skogens produkter och marknader, SLU. 2007 Study visits to Brazil: Benazzi- Mr Benazzi. 2007-02-12 Braspine 2007-02-06 Embalatec 2007-02-07 Linea 2007-02-07 StoraEnso 2007-02-09 Valorflorestal 2007-02-06.
51
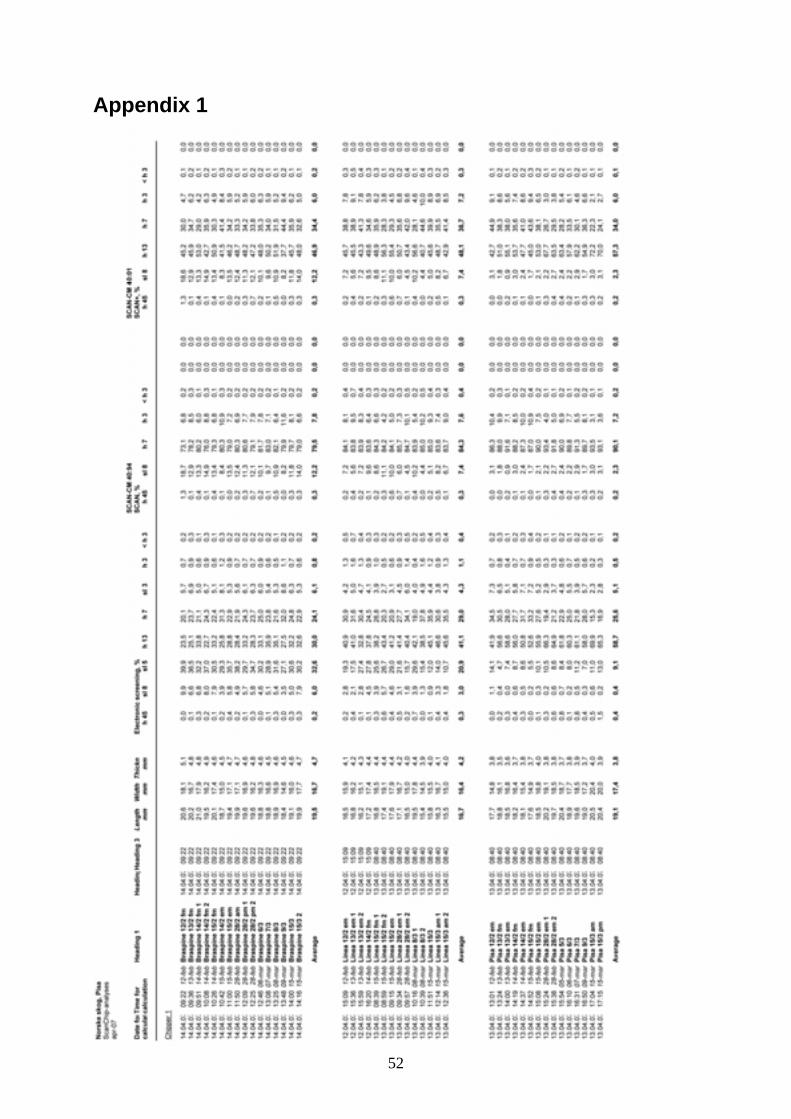
Appendix 1
52

53
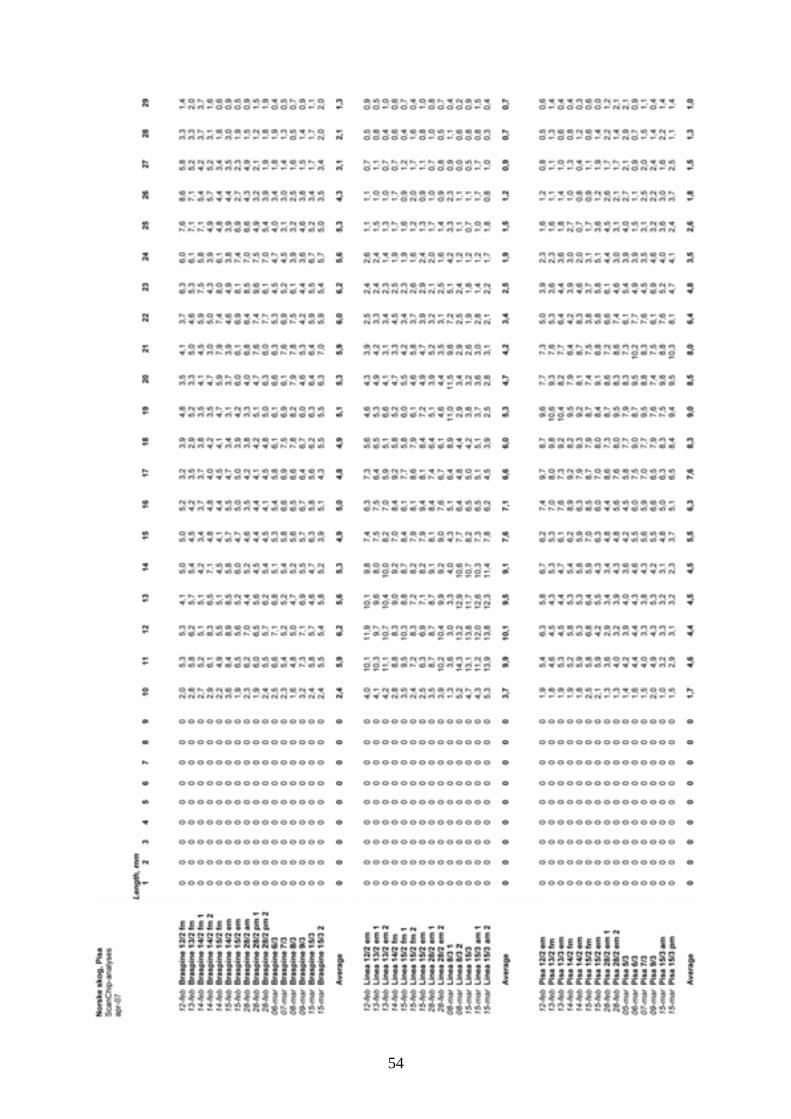
54

55

56
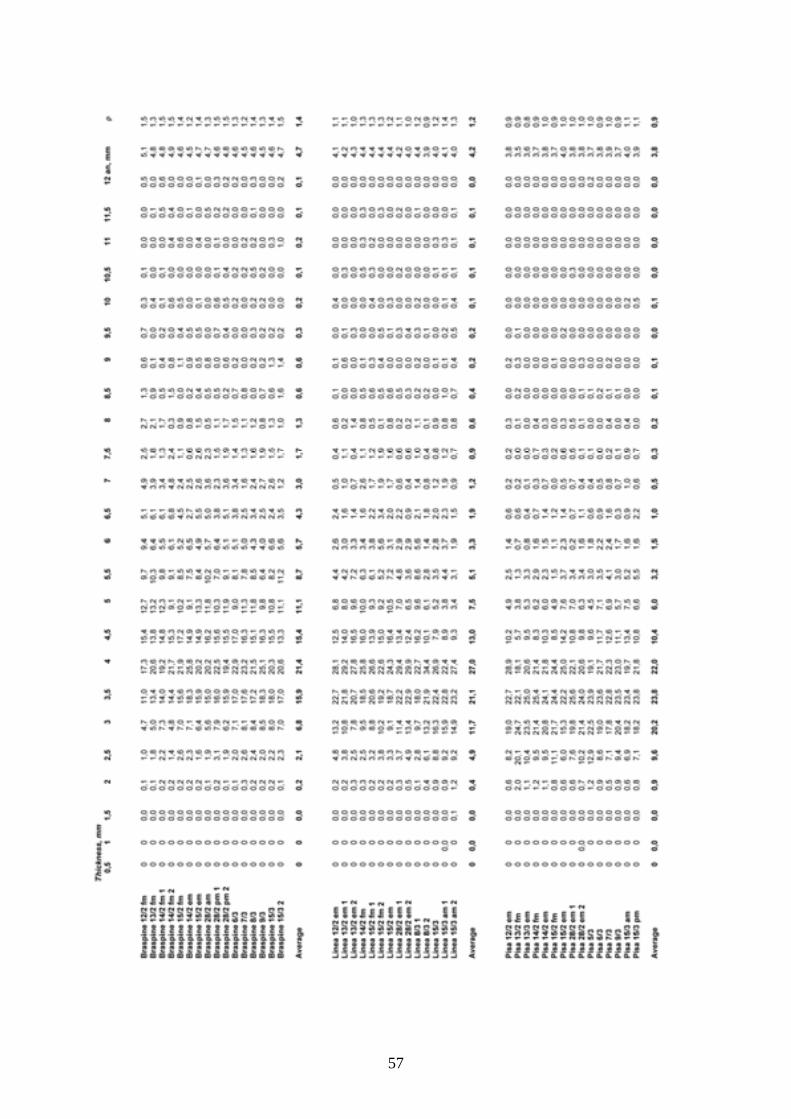
57

58 58

Publikationer från Institutionen för skogens produkter, Sveriges lantbruksuniversitet (SLU)
Rapporter 1. Ingemarson, F. 2007. De skogliga tjänstemännens syn på arbetet i Gudruns spår. Institutionen för skogens
produkter, SLU, Uppsala 2. Lönnstedt, L. 2007. Financial analysis of the U.S. based forest industry. Department of Forest Products, SLU,
Uppsala 4. Stendahl, M. 2007. Product development in the Swedish and Finnish wood industry. Department of Forest Products,
SLU, Uppsala 5. Nylund, J-E. & Ingemarson, F. 2007. Forest tenure in Sweden – a historical perspective. Department of Forest
Products, SLU, Uppsala 6. Lönnstedt, L. 2008. Forest industrial product companies – A comparison between Japan, Sweden and the U.S.
Department of Forest Products, SLU, Uppsala
Examensarbeten 1. Stangebye, J. 2007. Inventering och klassificering av kvarlämnad virkesvolym vid slutavverkning. Inventory
and classification of non-cut volumes at final cut operations. Institutionen för skogens produkter, SLU, Uppsala 2. Rosenquist, B. 2007. Bidragsanalys av dimensioner och postningar – En studie vid Vida Alvesta. Financial
analysis of economic contribution from dimensions and sawing patterns – A study at Vida Alvesta. Institutionen för skogens produkter, SLU, Uppsala
3. Ericsson, M. 2007. En lyckad affärsrelation? – Två fallstudier. A successful business relation? – Two case studies. Institutionen för skogens produkter, SLU, Uppsala
4. Ståhl, G. 2007. Distribution och försäljning av kvalitetsfuru – En fallstudie. Distribution and sales of high quality pine lumber – A case study. Institutionen för skogens produkter, SLU, Uppsala
5. Ekholm, A. 2007. Aspekter på flyttkostnader, fastighetsbildning och fastighetstorlekar. Aspects on fixed harvest costs and the size and dividing up of forest estates. Institutionen för skogens produkter, SLU, Uppsala
6. Gustafsson, F. 2007. Postningsoptimering vid sönderdelning av fura vid Säters Ångsåg. Saw pattern optimising for sawing Scots pine at Säters Ångsåg. Institutionen för skogens produkter, SLU, Uppsala
7. Götherström, M. 2007. Följdeffekter av olika användningssätt för vedråvara – en ekonomisk studie. Consequences of different ways to utilize raw wood – an economic study. Institutionen för skogens produkter, SLU, Uppsala
8. Nashr, F. 2007. Profiling the strategies of Swedish sawmilling firms. Department of Forest Products, SLU, Uppsala 9. Högsborn, G. 2007. Sveriges producenter och leverantörer av limträ – En studie om deras marknader och
kundrelationer. Swedish producers and suppliers of glulam – A study about their markets and customer relations. Institutionen för skogens produkter, SLU, Uppsala 10. Andersson, H. 2007. Establishment of pulp and paper production in Russia – Assessment of obstacles. Etablering av
pappers- och massaproduktion i Ryssland – bedömning av möjliga hinder. Department of Forest Products, SLU, Uppsala
11. Persson, F. 2007. Exponering av trägolv och lister i butik och på mässor – En jämförande studie mellan sport- och bygghandeln. Institutionen för skogens produkter, SLU, Uppsala
12. Lindström, E. 2008. En studie av utvecklingen av drivningsnettot i skogsbruket. A study of the net conversion contribution in forestry. Institutionen för skogens produkter, SLU, Uppsala
13. Karlhager, J. 2008. The Swedish market for wood briquettes – Production and market development. Department of Forest Products, SLU, Uppsala
14. Höglund, J. 2008. The Swedish fuel pellets industry: Production, market and standardization. Den Svenska bränslepelletsindustrin: Produktion, marknad och standardisering. Department of Forest Products, SLU, Uppsala
15. Trulson, M. 2008. Värmebehandlat trä – att inhämta synpunkter i produktutvecklingens tidiga fas. Heat-treated wood – to obtain opinions in the early phase of product development. Institutionen för skogens produkter, SLU, Uppsala

16. Nordlund, J. 2008. Beräkning av optimal batchstorlek på gavelspikningslinjer hos Vida Packaging i Hestra. Calculation of optimal batch size on cable drum flanges lines at Vida Packaging in Hestra. Institutionen för skogens produkter, SLU, Uppsala
17. Norberg, D. & Gustafsson, E. 2008. Organizational exposure to risk of unethical behaviour – In Eastern European timber purchasing organizations. Department of Forest Products, SLU, Uppsala
18. Bäckman, J. 2008. Kundrelationer – mellan Setragroup AB och bygghandeln. Customer Relationsship – between Setragroup AB and the DIY-sector. Institutionen för skogens produkter, SLU, Uppsala
19. Richnau, G. 2008. Landscape approach to implement sustainability policies? - value profiles of forest owner groups in the Helgeå river basin, South Sweden. Department of Forest Products, SLU, Uppsala
20. Sokolov, S. 2008. Financial analysis of the Russian forest product companies. Department of Forest Products, SLU, Uppsala
21. Färlin, A. 2008. Analysis of chip quality and value at Norske Skog Pisa Mill, Brazil. Department of Forest Products, SLU, Uppsala


