University of Iowa Iowa Research Online eses and Dissertations 2012 Analysis of chronic obstructive pulmonary disease (COPD) using CT images Sandeep Bodduluri University of Iowa Copyright 2012 Sandeep Bodduluri is thesis is available at Iowa Research Online: hp://ir.uiowa.edu/etd/2441 Follow this and additional works at: hp://ir.uiowa.edu/etd Part of the Biomedical Engineering and Bioengineering Commons Recommended Citation Bodduluri, Sandeep. "Analysis of chronic obstructive pulmonary disease (COPD) using CT images." MS (Master of Science) thesis, University of Iowa, 2012. hp://ir.uiowa.edu/etd/2441.
Transcript
University of IowaIowa Research Online
Theses and Dissertations
2012
Analysis of chronic obstructive pulmonary disease(COPD) using CT imagesSandeep BodduluriUniversity of Iowa
Copyright 2012 Sandeep Bodduluri
This thesis is available at Iowa Research Online: http://ir.uiowa.edu/etd/2441
Follow this and additional works at: http://ir.uiowa.edu/etd
Part of the Biomedical Engineering and Bioengineering Commons
Recommended CitationBodduluri, Sandeep. "Analysis of chronic obstructive pulmonary disease (COPD) using CT images." MS (Master of Science) thesis,University of Iowa, 2012.http://ir.uiowa.edu/etd/2441.
ANALYSIS OF CHRONIC OBSTRUCTIVE PULMONARY DISEASE (COPD)
USING CT IMAGES
by
Sandeep Bodduluri
A thesis submitted in partial fulfillment of the requirements for the Master of
Science degree in Biomedical Engineering in the Graduate College of
The University of Iowa
May 2012
Thesis Supervisor: Professor Joseph M. Reinhardt
Graduate College
The University of Iowa Iowa City, Iowa
CERTIFICATE OF APPROVAL
_______________________
MASTER'S THESIS
_______________
This is to certify that the Master's thesis of
Sandeep Bodduluri
has been approved by the Examining Committee for the thesis requirement for the Master of Science degree in Biomedical Engineering at the May 2012 graduation.
Thesis Committee: ___________________________________ Joseph M. Reinhardt, Thesis Supervisor
___________________________________ John D. Newell
___________________________________ Jessica C. Sieren
___________________________________ Gary E. Christensen
___________________________________ Mona K. Garvin
ii
2
To my family and friends.
iii
3
Failure is simply the opportunity to begin again, this time more intelligently.
Henry Ford
iv
4
ACKNOWLEDGMENTS
First of all, I would like to thank my parents and my GRE mentor Dr. Raju for
their unconditional love and support. Without them, I would never have the chance to
study here at the University of Iowa.
I would like to express my sincere gratitude to Professor Joseph M. Reinhardt for
giving me the opportunity to work on this project. I am greatly indebted for his
confidence in me and for his patience in all my miscues throughout this project. He
inspired me to pursue research with a vision and provided me an excellent platform to
communicate ideas. This dissertation would not have been possible without his mentoring
and support. I am also grateful to Professor John D. Newell for his invaluable advice and
guidance throughout my research. This project would not have proceeded so efficiently
without discussing and consulting with him. I would like to thank Prof. Gary E.
Christensen and his student Kunlin Cao for their help on image registration. My special
thanks to Douglas Stinson from National Jewish Health for providing lobar masks of
COPDGene subjects. Thanks to Kaifang Du, Ryan Amelon and Kai Ding for their help
on feature calculations. I would also like to thank Abhilash for his tips on machine
learning. Thanks to my lab mates Vinayak, Xiayu, Richie, Kim and Salma for giving me
the most productive time in the lab.
Of course, none of this would have been possible without friends. I would like to
thank Deva, Sai, Ashish, Harsha, Gaurav, Prashant, Sahaj, Uma, Srikant and Ashok for
being there in all the tough times. I would like to thank Katha and Hari for their time and
support in all the sporting activities. I would also like to thank Abhilash, Renu, Sucheta,
Meenakshi, Maya and Manasi for their help in making a difference through AID
organization. Finally, a special thanks to Sai, Shivangi, Sampada and Vivek for all the
times we spent and we are going to spend. The contributions of all these people are
greatly appreciated.
v
ABSTRACT
Chronic Obstructive Pulmonary Disease (COPD), a growing health concern, is the
fourth leading cause of death in the United States. While people habituated to smoking
constitute the highest COPD susceptible population, people exposed to air pollution or
other lung irritants also form a major group of potential COPD patients. COPD is a
progressive disease that is characterized by the combination of chronic bronchitis, small
airway obstruction, and emphysema that causes an overall decrease in the lung elasticity
affecting the lung tissue. The current gold standard method to diagnose COPD is by
pulmonary function tests (PFT) which measures the extent of COPD based on the lung
volumes and is further classified into five severity stages. PFT measurements are
insensitive to early stages of COPD and also its lack of reproducibility makes it hard to
rely on, in assessing the disease progression. Alternatively, Pulmonary CT scans are
considered as a major diagnostic tool in analyzing the COPD and CT measures are also
closely related to the pathological extent of the disease. Quantification of COPD using
features derived from CT images has been proven effective. The most common features
are density based and texture based. We propose a new set of features called lung
biomechanical features which capture the regional lung tissue deformation patterns
during the respiratory cycle. We have tested these features on 75 COPD subjects and 15
normal subjects. We have done classification of COPD/Non COPD on the dataset using
the three feature sets and also performed the classification all these subjects to their
corresponding severity stage. It is shown that the lung biomechanical features were also
able to classify COPD subjects with a good AUC. It is also shown that, by combining the
best features from each feature set, there is an improvement in the classifier performance.
Multiple regression analysis is performed to find the correlation between the CT derived
features and PFT measurements.
vi
6
TABLE OF CONTENTS
LIST OF TABLES .............................................................................................................. viii
LIST OF FIGURES ................................................................................................................x
1.1. Motivation .....................................................................................................1 1.2. State of the Art ..............................................................................................2 1.3. New Approach ..............................................................................................4
3.4.1. Basics of Image Registration ..............................................16 3.4.2. Registration Process ...........................................................18
3.5. Feature Calculation .....................................................................................19 3.5.1. Density Based Feature Set ..................................................21 3.5.2. Texture Based Feature Set ..................................................21 3.5.3. Lung Biomechanical Feature Set ........................................23
4. EXPERIMENTS AND RESULTS .....................................................................31
4.1. Feature Calculation Results and Correlations with Pulmonary Function
Test Measures ..............................................................................................31 4.2. Classification ..............................................................................................35
4.2.1. Severe COPD vs. Normal (Whole Lung) ..........................37 4.2.2. Mild to Severe COPD vs. Non-COPD (Whole Lung) ......40 4.2.3. Mild to Severe COPD vs. Non-COPD (Lobar Level) .......45 4.2.4. GOLD Category Classification (Whole Lung) ..................50 4.2.5. GOLD Category Classification (Lobar Level) ..................58
Table 1: COPD severity stages according to GOLD guidelines. .........................................9
Table 2: Demographic information and PFT measures of the dataset used. .....................14
Table 3: Complete feature calculation information ...........................................................20
Table 4: Gaussian filter bank calculated at 3 different scales used to form texture based feature set with the corresponding equations assuming λ1 ≥ λ2 ≥ λ3 ..............22
Table 5: Number of features per feature set with a correlation coefficient of either (-0.5 to -1) or (0.5 to 1) with clinical PFT measures showing a statistical significance p < 0.05 .................................................................................................35
Table 6: Material and Methods for experiment 4.2.1 ........................................................38
Table 7: Area under the ROC curve and correlation results from multiple regression analysis for each feature set and all the reported correlations are statistically significant with p < 0.0001 .......................................................................................38
Table 8: Optimal set of features selected for severe vs. normal classification where ADI represents anisotropic deformation index .........................................................39
Table 9: Dataset and algorithm information for experiment 4.2.2 ....................................40
Table 10: Area under the ROC curve for the whole lung COPD/Non-COPD classification and correlations with PFT measures from multiple regression analysis......................................................................................................................42
Table 11: Optimal set of features selected for COPD/Non-COPD classification. ............43
Table 12: Material and Methods for Experiment 4.2.3 ......................................................46
Table 13: Area under the ROC curve for the lower lobes and correlation results from multiple regression analysis for each feature set. ............................................47
Table 14: Area under the ROC curve for the upper lobes and correlation results from multiple regression analysis for each feature set. ............................................49
Table 15: Optimal set of features selected for lobar level COPD/Non-COPD classification. ............................................................................................................49
Table 16: Material and Methods for Experiment 4.2.4. .....................................................51
Table 17: Area under the ROC curve and correlation results from multiple regression analysis for each feature set. ..................................................................52
Table 18: Optimal features selected for GOLD severity classification. ............................55
Table 19: Confusion matrix of density based feature set from the GOLD category classification of whole lung. .....................................................................................55
ix
9
Table 20: Confusion matrix of texture based feature set from the GOLD category classification of whole lung. .....................................................................................56
Table 21: Confusion matrix of lung biomechanical feature set from the GOLD category classification of whole lung. ......................................................................56
Table 22: Material and Methods for Experiment 4.2.5 ......................................................59
Table 23: Area under the ROC curve for the upper lobes and correlation results from multiple regression analysis for each feature set. ............................................59
Table 24: Area under the ROC curve for the lower lobes and correlation results from multiple regression analysis for each feature set. ............................................60
Table A1: Demographic and spirometry information per subject (Continued) .................68
x
10
LIST OF FIGURES
Figure 1: Emphysema and Chronic Bronchitis in COPD, Adapted from 32
. .......................7
Figure 2: Graph showing the COPD subject information according to GOLD severity and PFT measurements. ..............................................................................13
Figure 4 : Image registration is the task of spatial transformation mapping on one image to another. This figure is the schematic representation of this concept with a point p in the left image is mapped to a point q in the right image using transformation T. Adapted from
Figure 5: The basic components of the registration framework are two input images, a transform, a cost function, an interpolator, and an optimizer. Adapted from
Figure 6: Linear forward selection algorithm. The first column in figure (a) and (b) shows the ranking of attributes represented by different colors. In the second column of (a) and (b), the features are arranged according to their rank. In the third column, fixed set technique, fig (a), selects the top k features and only these k attributes are used for subsequent selection process reducing the number of evaluations and eliminating irrelevant features at each step. In the third column, Fixed width technique, fig (b), selects the top k features and replaces with the next best attribute in the subsequent selection process. It maintains a fixed width in all the steps by taking low ranked attributes also into account. Adapted from
Figure 7: KNN classifier example .....................................................................................29
Figure 8: Boxplots showing the percentage distribution of emphysema and air trapping of all the subjects according to the GOLD stage. The two whiskers at both ends represent high and low values of the data. The box represents 50% of the values with 75
th percentile as the top value and 25
th percentile as
the bottom value. The division in the middle represents median value (50th
Figure 9: Axial slices of the original images (first row) with their corresponding gradient magnitude of gaussian filtered image (second row) and the laplacian of the gaussian image (third row) at 2.4mm standard deviation. First column represents nonsmoker subject and second column represents GOLD4 COPD subject .......................................................................................................................33
Figure 10: The Jacobian (second row) and Strain maps (third row) on the sagittal slice of the original FRC image (first row). First column represents GOLD0 COPD subject and the second column represents GOLD4 COPD subject. .............34
Figure 11: ROC curves showing the performance of the feature set in classifying healthy subjects .........................................................................................................41
xi
11
Figure 12: ROC curves showing the performance of the feature set in classifying COPD subjects ..........................................................................................................41
Figure 13: Graph showing the false negative rate in COPD/Non-COPD classification. ............................................................................................................44
Figure 14: ROC curves showing the performance of the feature sets in classifying lower lobes of Non – COPD subjects .......................................................................46
Figure 15: ROC curves showing the performance of the feature sets in classifying lower lobes of COPD subjects ..................................................................................47
Figure 16: ROC curves showing the performance of the feature set in classifying upper lobes of non-COPD subjects ...........................................................................48
Figure 17: ROC curves showing the performance of the feature set in classifying upper lobes of COPD subjects ..................................................................................48
Figure 18: ROC curves showing the performance of the feature sets in classifying GOLD0 COPD subjects ............................................................................................52
Figure 19: ROC curves showing the performance of the feature sets in classifying GOLD1 COPD subjects ............................................................................................53
Figure 20: ROC curves showing the performance of the feature sets in classifying GOLD0 COPD subjects ............................................................................................53
Figure 21: ROC curves showing the performance of the feature sets in classifying GOLD3 COPD subjects ............................................................................................54
Figure 22: ROC curves showing the performance of the feature sets in classifying GOLD4 subjects. ......................................................................................................54
Figure 23: Chart showing the percentage of correctly classified instances at initial stages of the disease versus later stages of the disease. G0-G1 represents classification of GOLD0, GOLD1 subjects and G2-G4 for GOLD2, GOLD3, and GOLD4...............................................................................................................57
1
1
CHAPTER 1
INTRODUCTION
1.1. Motivation
Chronic Obstructive Pulmonary Disease (COPD), a growing health concern, is the
fourth leading cause of death in the United States1, 2
. While people habituated to smoking
constitute the highest COPD susceptible population, people exposed to air pollution or
other lung irritants also form a major group of potential COPD patients. COPD is a
progressive disease that is characterized by the combination of chronic bronchitis, small
airway obstruction, and emphysema that causes an overall decrease in the lung elasticity
affecting the lung tissue. The current gold standard method to diagnose COPD is by
pulmonary function tests (PFT) which measures the extent of COPD based on the lung
volumes. The insensitivity of PFT to the early stages of the disease, its evaluation based
on global lung function and also its lack of reproducibility makes it hard to rely on, in
assessing the disease progression 3, 4
. These tests are also labor intensive and time
consuming. Alternatively, Pulmonary CT scans are considered as a major diagnostic tool
in analyzing COPD and CT measures are also closely related to the pathological extent of
the disease 5, 6
. CT imaging of the lungs provides important information about airflow
patterns in the COPD subjects. Densitometry analysis of CT images has been
successfully used to distinguish COPD subjects from normal7-11
. Recently, textural
patterns on the CT images showed significant difference in the disease progression and
are proved useful in detecting COPD subjects12-16
. Quantification of COPD based on the
features derived from CT images has been recognized effective and these features are
correlated well with PFT measurements13-15
. There are several other features of CT that
are closely related to the lung function17-20
. By the use of machine learning, the capability
of various features in diagnosing and staging COPD can be evaluated and the best
2
2
combination of features can be extracted. These features may result in better diagnosis of
COPD and the evaluation of its progression at different stages.
1.2. The State of the Art
Several methods are proposed to diagnose COPD using CT images. Gould et al.
proposed a lowest fifth percentile method based on CT attenuation values to calculate the
pathological extent of emphysema17-22
. Later, Muller et al. proposed ‘Density Mask’
method based on the relative area of low attenuation values in CT to detect emphysema.
This method calculates the percentage of voxels below a certain threshold which gives
the extent of emphysema. A threshold range of -910HU to -960HU was shown capable of
providing the emphysema extent 8. Genevois et al. compared density measurements with
the pathological extent of emphysema and found significant correlations with the extent
of emphysema at a threshold of -950HU7. Shaker et al. and other groups used these
density based measurements and showed lowest 15th percentile of the frequency
distribution provided the estimate of emphysema in alpha1 antitrypsin-deficient
individuals23, 24
. In addition to the emphysema scores from CT, Newman et al. calculated
the extent of air trapping in asthma patients using expiratory CT images. This method
calculates the percentage of low attenuation values in expiratory CT below a threshold of
-900HU 11
. Matsuoka et al. calculated the air trapping measure in COPD subjects and
found the decreased attenuation values below -860HU in the expiratory CT is
significantly correlated with the airway dysfunction regardless of emphysema25
. The ratio
of mean lung density on expiration and inspiration is also used to estimate air trapping.
Lee et al. evaluated the correlation between the emphysema, air trapping scores of COPD
subjects with the clinical parameters. They have shown that the CT parameters are well
correlated with the PFT, body mass index scores 26
. Murphy et al. performed the
classification at each severity stage of COPD using 3D registration of inspiration and
3
3
expiration images. Registration based features are shown working better than the normal
density based features of CT 27
. Lederman et al. compared the density based metrics with
the lung function and showed the higher density lung regions also provide clinical
information regarding the COPD severity 28
. Although the density based measurements
are proved to be effective in detecting emphysema and airway obstruction, textural
patterns on CT images of COPD patients are also found to be valuable. Uppaluri et al.
proposed the adaptive multiple feature method (AMFM) to classify emphysema using
textural patterns on pulmonary CT images. First order and second order statistical
features of texture patterns were used to classify emphysematous lung tissue 15
. This
method showed good accuracy in classifying emphysema subjects and normal subjects.
Sorensen et al. also used textural features in classifying moderate to severe COPD
subjects from normal subjects. Disease probability given to the image by fusing
individual probabilities evaluated at local region of interests (ROI) in the images. The
ROI classification is based on k nearest neighbor classifier with features from a multi
scale Gaussian filter bank. All the ROI probabilities are combined to give a single
probability for the image using a posterior probability estimate13, 14
. Various authors used
the texture and density based approach to diagnose various lung pathologies and have
shown these approaches are compared well with the structural changes happening in the
lungs as the disease progresses 12, 29, 30
. The most common textural features are gray level
co-occurrence matrices (GLCM), run length matrices (RLM), Gaussian filter bank
features. Recently, Murphy et al. used regional ventilation measures from the registration
of inspiration and expiration images as a new feature set to classify COPD subjects to
their corresponding severity stage 18
. Also, features based on tracheal changes in the CT
images are used to classify COPD subjects 20
. Most of these features classified COPD
subjects with good accuracy and correlated well with PFT measurements.
4
4
1.3. New Approaches
We performed the classification of COPD using a new set of lung biomechanical
features derived by the registration of inspiratory and expiratory CT in addition to the
current texture based and density based features. The new set of features is calculated
based on the estimates of regional lung tissue expansion and contraction and are
compared well with the function of lungs17, 19, 31
. These features capture the mechanical
changes that occur in the lung from inspiration to expiration. As a part of five
classification experiments, we have tested the effectiveness of these features in
distinguishing normal subjects from the severely diseased in comparison with the texture
and density based features. We have also performed classification of normal versus
COPD subjects at all the stages (mild to very severe) using density, texture and lung
biomechanical features. As the final step of classification, we have classified COPD
subjects in to their corresponding severity stage. For all these experiments, we have
added an extra feature set which is the combination of best features from density, texture
and lung biomechanical feature sets. We have done this analysis at whole lung level and
lobar level. We compared our results to the PFT measurements.
In the following chapters of this thesis, we give background information about
COPD and quantitative analysis of COPD using pulmonary CT in chapter 2. We
described our dataset, preprocessing techniques and the methodology of calculating the
features in chapter 3. Also in chapter 3, we described the feature selection, classification
and implementation details. In chapter 4, we showed our classification results in at whole
lung level and lobar level. In chapter 5, we discussed the significance of this research and
the future work.
5
5
CHAPTER 2
BACKGROUND
2.1. CHRONIC OBSTRUCTIVE PULMONARY DISEASE (COPD)
2.1.1. Definition and Overview
COPD is an airflow obstruction disease which is caused by emphysema and/or
chronic bronchitis. It narrows the airways, leading to the progressive reduction of the
airflow in and out of the lungs. COPD is considered as a major public health problem, as
it is the fourth leading cause of death in United States 1, 2
. Smoking is the major risk
factor that causes COPD. According to Global Initiative for the Chronic Obstructive
Lung Disease (GOLD) guidelines, a general definition of COPD is
Chronic obstructive pulmonary disease (COPD) is a preventable and treatable
disease with some significant extra pulmonary effects that may contribute to the severity
in individual patients. Its pulmonary component is characterized by airflow limitation that
is not fully reversible. The airflow limitation is usually progressive and associated with
an abnormal inflammatory response of the lung to noxious particles or gases.1, 2
The interrelationship between emphysema and bronchitis makes it harder to find a
single factor that is contributing towards the disease progression. Emphysema causes the
destruction of the lung tissue that is necessary to support the physical shape and function
of the lungs. It destroys the lung tissue which leads to dyspnea. Emphysema is classified
into three subtypes; centrilobular, panlobular, and paraseptal emphysema. In
centrilobular, the respiratory bronchiole is affected and occurs more commonly in the
upper lobes. Panlobular emphysema causes the expansion of entire respiratory acinus and
occurs in lower lobes. Paraseptal occurs at lung peripheral structures. Chronic bronchitis
is the inflammation of airways. It causes cough with sputum production. There will be an
increased mucus accumulation in the airways which leads to the narrowing of the airways
and causing a cough. According to the Global Initiative for the Chronic Obstructive Lung
6
6
Disease (GOLD) guidelines, the prevalence of COPD is now almost equal in men and
women and is directly related to smoking. Tobacco smoking is the important risk factor
of COPD. The major percentage of COPD patients are smokers or have smoked.
Smoking causes the alterations of surfactant quality and also hyperplasia, hypertrophy of
mucus secreting glands. The people who have a prolonged exposure to the outdoor
environment like dust, fumes, and polluted gas surroundings are more susceptible to
COPD than the general population1. In these cases, air flow obstruction is caused by
hyper secretion of mucus with the pollutants reaching terminal bronchi and alveoli. Also,
the deficiency of alpha1 antitrypsin is a significant genetic factor that causes COPD11, 24
.
All these risk factors illustrate that the development of the disease is also related to
genetic factors and environmental exposures. It is also shown that a COPD subject may
undergo cardiac failure due to airflow obstruction and hyperinflation caused by COPD.
Some of the comorbidities associated with COPD are heart diseases, diabetes,
osteoporosis, and skeletal muscle dysfunction and lung cancer1.
2.1.2. Diagnosis
Evaluation for COPD is recommended for any patient who has dyspnea, chronic cough
and/or exposed to any of the risk factors for the disease. Dyspnea is a cardinal symptom
of the disease which increases the effort to breathe or causes gasping and it worsens over
the disease progression. Chronic cough and sputum production is also an important
symptom while diagnosing and it is intermittent at the early stages but worsens at the
severe stage of COPD.
7
7
Figure 1: Emphysema and Chronic Bronchitis in COPD, Adapted from 32
.
8
8
Additional symptoms are fatigue, weight loss which can be the signs of other
diseases associated with the COPD. Depression and anxiety are also common at the
severe stages of COPD. COPD assessment is done by performing spirometry or
Pulmonary Function Test (PFT) which is a current gold standard diagnosis of COPD.
PFT measures the lung volumes at different stages of breathing by asking the subject to
breathe into a mouthpiece connected to a spirometer. COPD is diagnosed based on two
lung volumes; the maximum volume of air that can be forcibly blown out after full
inspiration, called as forced vital capacity (FVC), and the maximum volume of air that
one can blow out in the first second of the FVC process called as forced expiratory
volume at the first second of the expiration (FEV1). If FEV1/FVC is less than 0.7, then
the subject is considered as a potential COPD subject suffering from airflow obstruction.
Normalization of FEV1 according to expected value based on age, height, sex is called
FEV1% predicted of that specific patient. This measure is used to estimate the severity of
the disease.
According to the Global Initiative for the Chronic Obstructive Lung Disease
(GOLD) guidelines, COPD is classified in to five severity stages as explained in Table 1.
GOLD0 is an asymptotic stage of the disease where subjects are likely to get COPD.
GOLD1 is a mild stage where airflow limitation is mild and usually the patient is
unaware that the lung function is not normal. GOLD2 is a moderate stage of COPD at
which patients usually feel shortness of breath and typically seek medical attention.
GOLD3 is a severe stage of the disease where the patient experiences greater shortness of
breath, fatigue and reduced exercise capacity. GOLD4 is a very severe stage of COPD
characterized by severe air flow limitation and the chronic respiratory failure. Patient’s
quality of life is severely worsens at this stage.
9
9
Table 1: COPD severity stages according to GOLD guidelines.
There are other validated questionnaires to estimate the impact of the disease on
the daily life activities of a patient. Modified British Medical Research Council (mMRC)
or COPD Assessment Test (CAT) is the common measure. It is used to assess the health
impairment caused by COPD on patient's daily life activities. It is an 8-item health status
questionnaire which has the score ranging from 0-40. St. George’s Respiratory
Questionnaire (SGRQ) is another important questionnaire which is designed to measure
health impairment in patients with asthma and COPD. The first section of SGRQ
evaluates symptoms like frequency of cough, sputum production and breathlessness. The
second section is of two components: activity and impact scores. Activity section
evaluates the activities that cause breathlessness and the impacts section covers the
impact of the diseases on several day to day activities. SGRQ score has been shown to
correlate well with established measures of symptom level, disease activity and disability.
6-minute walk test (6MWT) is also a useful measure of functional capacity, which
evaluates the exercise capacity of moderate to high severity stages of the disease. The
American Thoracic Society provided guidelines to perform the test and to measure the
response for pulmonary and cardiac diseases. Modified medical research council’s
(MMRC) dyspnea scale including body mass index, airflow obstruction and exercise
All the numbers are mean values with standard deviation in parenthesis except GOLD
stage and Gender
Table 2: Demographic information and PFT measures of the dataset used.
15
15
3.2. Overview of Methodology – Flowchart
Figure 3: Workflow
Original Images - Inspiration and Expiration
Image Preprocessing and Lung Segmentation Image Registration
Density based
features
Texture based
features
Lung biomechanical
features
Feature Selection
Classification
16
16
The flowchart in figure 3, explains the workflow implemented in this study. The
detailed description of each step is given in following sections of the chapter.
3.3. Image Preprocessing and Lung Segmentation
All volumetric CT data were converted from DICOM format and stored in 16-bit
Analyze (Mayo Clinic, Rochester, MN) format 36
. Processing of CT data requires
memory intensive tasks. Resampling of the data is done to maintain consistent spacing
and resolution in all the images. To produce binary lung masks, region growing
segmentation is carried out to segment the lungs. Region growing segmentation is a
region based segmentation procedure that segments the given image into regions based
on the discontinuities in the gray level and by the selection of initial seed points in the
region. The segmentation is carried out on Analyze image processing software.
3.4. Image Registration
3.4.1. Basics of Image Registration
In order to do the mechanical analysis of lung, we have to capture the deformation
changes happening from inspiration to the expiration image. This can be done by
mapping of one image to the other in a single coordinate system. Image registration, a
spatial transform mapping of one image into another as shown in the figure 4, is the
solution for this problem. Many image registration algorithms have been proposed and
various features were used to define the correspondences between two images37, 38
. The
basic components of the registration framework: two input images, a transform, a cost
function, an interpolator, and an optimizer. The two inputs to the registration process are
the moving or template image and fixed or target image. The transform used in the
registration defines the deformational changes between the two images. The interpolator
17
17
is used to evaluate intensities in the moving image. The cost function contains a
similarity metric measuring how well the fixed target image is matched by the
transformed moving template image. Optimizer in the registration process optimizes the
quantitative criterion formed by the similarity metric over the search space defined by the
parameters of the transform. Registration is mainly dependent on the cost function. The
spatial locations of corresponding voxels in a sequence of pulmonary scans are
determined through the registration.
Figure 4 : Image registration is the task of spatial transformation mapping on one image to another. This figure is the schematic representation of this concept with a point p in the left image is mapped to a point q in the right image using transformation T. Adapted from
39
Figure 5: The basic components of the registration framework are two input images, a transform, a cost function, an interpolator, and an optimizer. Adapted from
39
18
18
3.4.2. Registration Process
The inspiratory and expiratory CT images are registered for each subject since
this pair of images shows large volume change and tissue deformation patterns of the
lungs. We have used a lung mass preserving registration method to capture these
differences between the images. This method uses a similarity metric called the sum of
squared tissue volume difference (SSTVD), which estimates the local tissue and air
fraction by minimizing local tissue mass difference 40, 41
. This method has been shown
effective in lung image registration protocols19, 42
. The tissue volume V in a voxel at
position X can be estimated as
( ) ( ) ( )
( ) ( ( )) ( )
where (X) is the volume of voxel x [45]. Similarly, the air volume in a voxel can be
estimated as
( ) ( ) ( )
( ) ( ( )) ( )
Where the sum of ( ( )) and ( ( )) is equal to 1 and and =
-1000HU. Then
( ) ( )
( )
( )
( )
19
19
Let ( ) and ( ) be the intensity values, ( ) and ( ) be the voxel volumes, and
( ) and ( ) be the tissue volume in the voxel of images and respectively.
Then the SSTVD is defined as 19, 42
∫ [ ( ) ( ( ))]
∫ [ ( ) ( ( )) ( ( ) ( ( ( ))))]
( )
The Jacobian of a transformation J (h) estimates the local volume changes resulted from
mapping an image through the deformation. Thus, the tissue volumes in image and
are related by
( ( )) ( ) ( ( )). (3.5)
The registration process provides the displacement field information corresponding to the
tissue deformation patterns in the lung from inspiration to expiration.
3.5. Feature Calculation
In this study, we have calculated three sets of features from the CT images. The
three sets are: density based feature set which explains emphysema and air trapping
extent, textural feature set which captures textural patterns based on multi scale
derivatives of Gaussian filter bank, and the lung biomechanical feature set which captures
the mechanical changes happening in the lung from the registration process. Density
based feature set has only two features which are the direct estimates of emphysema and
air trapping. In the texture based feature set, three filters were calculated at three different
standard deviation values giving 9 filtered versions for each expiration image in the
dataset. We have calculated five first order statistical features: mean, median, skewness,
20
20
kurtosis and standard deviation for each of these 9 filtered versions. Therefore, a total of
45 features formed a texture based feature set. Similarly, in the lung biomechanical
feature set, 15 features were computed based on five statistical measures of three feature
images. The summary of 62 features from the three feature sets is shown in table 3 and
the feature calculation is described in the subsequent sections.
Feature Set Feature Image Features Calculated Number of Features
Density based 1. Inspiration
2. Expiration
Emphysema
Percentage of voxels below -950HU
Air Trapping
Percentage of voxels below -856HU
2
Textural
(filtering at three different scales/standard deviations)
1. Base gaussian
2. Gradient magnitude of gaussian
3. Laplacian of the gaussian
mean, median, skewness, kurtosis, and standard deviation
45
Lung Biomechanical
1. Jacobian
2. Strain
3. Deformation Index (ADI)
mean, median, skewness, kurtosis, and standard deviation
15
Table 3: Complete feature calculation information
21
21
3.5.1. Density Based Feature Set
Density based feature set consists of measure for the extent of emphysema and air
trapping in a COPD subject. The densitometry measures are computed from the entire
lung fields and also from the lobes. These measures correspond to the amount of voxels
below a given HU threshold relative to voxels in the whole lung. Emphysema is
calculated from the inspiration image and a threshold of -950HU is used 8. Similarly, air
trapping extent is computed from the expiration image and a threshold of -856HU is
used9-11, 43
. These thresholds have been proven effective in quantifying the extent of
emphysema and air trapping in COPD subjects.
3.5.2. Texture Based Feature Set
In order to capture the textural patterns, a set of 45 features that includes 3 local
image descriptors computed at 3 different scales, are used. The detailed information of
the filters is shown in table 4. The local image descriptors are based on the gaussian
function and its rotationally invariant derivatives. The three different scales (standard
deviation) represents the amount of smoothing for the gaussian kernel.
The following is the detailed descripiton of the filter bank,
1. Convolution with Gaussian:
The feature images are computed by convolving it with the gaussian
kernel at 3 different scales. This filtering technique blurs the images and
reduces the noise. The gaussian function uses the following equation for
the transformation.
22
22
( )
(
| | | | | |
)
Image Descriptor Feature Image Equation
Smoothing Convolution with Gaussian (L = I ∗G)
Rotationally invariant
edge descriptor
Gradient magnitude L = sqrt( Lx2
+ Ly2 + Lz
2 )
Rotationally invariant
edge descriptor
Laplacian of the Gaussian (𝜆1 + 𝜆2 + 𝜆3)
Table 4: Gaussian filter bank calculated at 3 different scales used to form texture based feature set with the corresponding equations assuming λ1 ≥ λ2 ≥ λ3
2. Gradient Magnitude of the Gaussian
This filter is used to determine the object contours and seperations, i.e.
for edge detection in the images. It is derived by computing partial
derivatives of the image,
√(
) (
) (
)
23
23
3. Laplacian of the Gaussian
Laplacian operator computes the second spatial derivative of an image. It captures
the regions of rapid intensity changes and is used in edge detection. To get the
horizontal, vertical and depth information of the edges, we take the second
derivative in x, y and z directions. Thus, the laplacian of the image is given by
( )
These three filters were calculated at three different standard deviation values
(1.2, 2.4 and 4.8mm) giving 9 filtered versions for each expiration image in the dataset.
We have calculated five first order statistical features: mean, median, skewness, kurtosis
and standard deviation for nine filtered versions of each image. Therefore, a total of 45
features were computed to form a texture based feature set.
3.5.3. Lung Biomechanical Feature Set
This feature set is comprised of features which captures the lung function by non-
rigid image registration of a pair of scans at different inflation levels. Mechanical analysis
on a regional level is done by finding out the local tissue deformation pattern from the
correspondence of each voxel between inspiration and expiration image. Three measures
are calculated from this analysis:
Jacobian
Strain information and
Anisotropic Deformation Index (ADI)
24
24
Jacobian
This feature measures the local volume change under deformation from the
inspiration to expiration registration procedure. The Jacobian determinant is a
measurement to estimate the point wise volume expansion and contraction during the
deformation19, 41
. In a three dimensional space, Let ( ) [ ( ) ( ) ( )] be
the vector transformation and ( ) [ ( ) ( ) ( )] represents the deformation
fields. The relationship between ( ) and ( ) is shown as ( ) ( ). The
Jacobian of transformation J (h(x)) at ( ) is defined as
( ( ))
|
|
( )
( )
( )
( )
( )
( )
( )
( )
( )
|
|
( )
The Jacobian at a given point gives important information about the
transformation h near that point 44, 45
. If the Jacobian value is zero at x, then the
transformation h is not invertible. If the Jacobian value is negative, then transformation
reverses orientation. A positive jacobian preserves the orientation. Using a Lagrangian
reference frame, the indications of Jacobian value are,
J > 0, preserve orientation J > 1, local expansion
J = 1, no deformation
0 < J < 1, local contraction
J = 0, non-injective
J < 0, reverse orientation
25
25
Strain Analysis
Deformation patterns are characterized by the regional distribution of a strain or
stretch tensor by the displacement fields from the registration process. A displacement
gradient tensor u can be calculated as the partial differentiation of the displacement
vector with respect to the material coordinates.
||
|| (3.10)
By applying strain tensor on the deformation gradient, the distribution of stress in the
lung can be calculated. Linear strain along axes are defined as
,
. (3.11)
Where [ ] is the 3D displacement field. The concept of the strain is used to
evaluate how much a given displacement differs locally from a rigid body displacement
46. The strain tensors are represented as orthogonal eigenvectors by single value
decomposition method. The maximum eigenvalue for each tensor is called maximum
principle strain. Strain analysis gives valuable information about the directionalities in
local tissue deformation.
Anisotropic Deformation Index (ADI)
Orientation preference also plays a role in the lung deformation in addition to the
volume change47
. Some regions may undergo no volume change with significant
deformation and vice versa due to the compensation effects of lung elasticity. Anisotropic
deformation index calculates the ratio of length in the direction of maximal extension to
26
26
the length in the direction of minimal extension. This index is calculated by decomposing
the deformation gradient tensor in to stretch and rotational component.
|
|
( )
( )
( )
( )
( )
( )
( )
( )
( )
|
|
( )
Where R is the rotational tensor and U is the stretch tensor.
The Cauchy-green deformation tensor is defined as
(3.13)
To obtain the stretch information from U, Eigen decomposition of C is done.
After taking the square root of eigenvalues of C, we get the eigenvalues of U which are
principal stretches. The ratio of maximum eigenvalue over the minimum gives the
regional stretch information, which represents anisotropic deformation index 31
. The
value of ADI is always greater than or equal to one. If the value is close to one, it means
there is an isotropic expansion and if the value is big, it represents anisotropic
deformation.
3.6. Feature Selection
Feature selection plays a major role in building robust classification models by
selecting a subset of best features. Feature selection algorithms are of two categories:
feature ranking and subset selection. Feature ranking ranks the given set of features and
eliminates the low ranked features to form an optimal set of features. Subset selection
searches for the set of optimal features through various combinations of the given
27
27
features. The elimination of irrelevant and redundant features improves the performance
of the classification. It speeds up the run time of the classification and reduces the curse
of dimensionality. In this study, 62 features were calculated from three different feature
calculation strategies. The selection of optimal features from each feature set, which can
define the disease better than the other features, is possible through the feature selection
process. Linear forward feature selection technique is used in this study to improve the
classifier performance and also to test the effectiveness of the features in different
classification experiments.
Figure 6: Linear forward selection algorithm. The first column in figure (a) and (b) shows the ranking of attributes represented by different colors. In the second column of (a) and (b), the features are arranged according to their rank. In the third column, fixed set technique, fig (a), selects the top k features and only these k attributes are used for subsequent selection process reducing the number of evaluations and eliminating irrelevant features at each step. In the third column, Fixed width technique, fig (b), selects the top k features and replaces with the next best attribute in the subsequent selection process. It maintains a fixed width in all the steps by taking low ranked attributes also into account. Adapted from
48, 49
28
28
Linear forward selection is the modified version of the standard search technique
known as sequential forward selection 48, 49
. Sequential forward selection is a hill
climbing search which adds the feature that gives the best score to the optimal subset at
each forward step. The search terminates when there is no improvement in the score with
the remaining features. In this method, there will be a reduction in the number of features
in each step of the forward search. The number of evaluations at each step is equal to the
number of remaining features. The feature dependent evaluations reduce the run time
performance of the algorithm and it can be problematic for high dimensional datasets. In
the linear forward selection, user will be able to limit the number of features that are
considered in each step and it significantly reduces the number of evaluations and run
time 48
.
There are two methods used by linear forward selection to limit the number of
features: Fixed Set and Fixed Width, shown in figure 6. In fixed set, only the given
features are ranked according to their scores by evaluating each feature individually.
Only the k best features are selected for the next forward selection step. It discards most
of irrelevant features and it reduces the number of evaluations drastically by selecting the
given features to fixed set of size k. The subset of best ranked features increases at each
forward step and the subset extension decreases with the each step. In fixed width,
similar ranking of features is done as the fixed set method. However, at each forward
step, the next best feature in the initial ranking is added to the subset by ensuring the
subset with the individually best k features that have not been selected so far. Fixed width
takes the weaker features into account as the search proceeds and the subset extension
will be fixed width throughout the search.
29
29
3.7. Classification (KNN Classifier)
We have performed five classification experiments in this study. In all the
experiments, we have used the k nearest neighbor learning algorithm 49, 50
. K nearest
neighbor algorithm is a non-parametric approach based directly on distances computed
between training and test data points. It is a supervised pattern classification algorithm. It
has been shown to work well in the classification of lung tissue13, 14, 51, 52
. This classifier
does not require any prior information about the distribution of the data points.
Figure 7: KNN classifier example
Group A
Group B
30
30
For any given test data point, KNN searches its nearest neighbors formed by the
training data sets. The classifiers return the selected number of neighbors (k) which are
closest in the distance to the given test data point. The choice of k is user defined and it
defines the smoothness of the decision boundary. The decision is made based on the
majority vote of its neighbors, with the test data point being assigned to the group most
common among its nearest neighbors. The running time of KNN grows exponentially
with n-dimensional space. As an example, in figure 7, there are 15 data points in group A
(red), 15 in group B (green) and one test data point (blue). KNN computes the Euclidean
distance to each data point in group A and group B from the test data point. In this
example, the k value is chosen as 7. It selects 7 nearest neighbors closest to it based on
the distance calculation. Since there are 4 data points from Group B out of 7 nearest
neighbors, the given test data point is labeled as group B by the classifier. In this study,
we have used instance based k nearest neighbor (IBk) learning model in WEKA machine
learning framework to perform the k nearest neighbor search 49
. Euclidean distance
method is followed to compute the distances between nearest neighbors.
31
31
CHAPTER 4
EXPERIMENTS AND RESULTS
4.1. Feature Calculation Results and Correlations with
Pulmonary Function Test Measures
A total of 62 features from the CT images were used in this study. These features
are categorized into three feature sets: Density based (2), Texture based (45) and lung
biomechanical based (15). Density based feature set comprises of emphysema (percent
below -950HU) and air trapping (percent below -856HU) measures. The emphysema and
air trapping percentages of all the subjects in this study are shown in figure 8. Texture
based feature set consists of features calculated from gaussian filtered versions of the
expiration image at multiple scales. The gradient magnitude of gaussian and laplacian of
gaussian filtered versions at scales 2.4mm for a nonsmoker subject and a GOLD4 COPD
subject is shown in figure 9. Lung biomechanical feature set consists of features
calculated from the registration of inspiration to expiration image. Three regional lung
tissue estimates are used in this feature set: Jacobian, Strain and ADI. The Jacobian and
Strain maps of a GOLD0 and a GOLD4 COPD subject are shown in figure 10.
As an initial step towards the classification of COPD subjects, correlations of CT
derived features with PFT measures and COPD GOLD stage values were calculated.
These correlation values provide the information on the relationship between CT derived
features and the clinical diagnostic measures of the disease. Density based features
showed good negative correlations, in particular, the air trapping measure (percent below
-856HU) showed correlation greater than -0.8 with all the three measures. The Jacobian
measure has the correlation of greater than 0.8 with PFT measures and -0.85 with the
GOLD stage values. The texture based features also correlated well with coefficients
ranging from 0.5 to 0.8. The number of features per feature set that showed either a
32
32
negative or positive correlation of 0.5 or high with the significance level of p<0.05 is
shown in table 5.
Figure 8: Boxplots showing the percentage distribution of emphysema and air trapping of all the subjects according to the GOLD stage. The two whiskers at both ends represent high and low values of the data. The box represents 50% of the values with 75
th percentile as the top value and 25
th percentile as the bottom
value. The division in the middle represents median value (50th
percentile)
0
0.2
0.4
0.6
0.8
1
Normal G0 G1 G2 G3 G4
Emphysema (percentage of voxels below -950HU in inspiration)
0
0.2
0.4
0.6
0.8
1
Normal G0 G1 G2 G3 G4
Air Trapping (percentage of voxels below -856HU in expiration)
33
33
Figure 9: Axial slices of the original images (first row) with their corresponding gradient magnitude of gaussian filtered image (second row) and the laplacian of the gaussian image (third row) at 2.4mm standard deviation. First column represents nonsmoker subject and second column represents GOLD4 COPD subject
34
34
Figure 10: The Jacobian (second row) and Strain maps (third row) on the sagittal slice of the original FRC image (first row). First column represents GOLD0 COPD subject and the second column represents GOLD4 COPD subject.
35
35
FEATURE SETS PFT MEASURES
FEV1/FVC FEV1% Predicted GOLD Values
Density Based (2) 2 2 2
Texture Based (45) 18
15 19
Lung Biomechanical (15) 10*
10*
10*
(*) values are statistically significant with p < 0.0001
Table 5: Number of features per feature set with a correlation coefficient of either (-0.5 to -1) or (0.5 to 1) with clinical PFT measures showing a statistical significance p < 0.05
The two density based features and ten lung biomechanical features showed good
correlations with the three clinical measures. All the lung biomechanical features are
found to be statistical significant with p < 0.0001 significance level. Out of 45 features, a
good number of texture based features also correlated well with the given measures.
These correlations prove a definite relationship between the calculated features and the
clinical diagnostic measures.
4.2. Classification Experiments
We have performed five classification experiments to classify COPD subjects
from normal subjects and also to assess the disease progression at various stages. Three
experiments are based on the features calculated from the whole lung and the remaining
two experiments are based on the features from the lobes of a lung. Whole lung level
experiments are performed to classify COPD subjects from the normal subjects and also
36
36
to classify COPD subjects to their corresponding severity stage. Lobar level experiments
are used for regional level assessment of the disease in the lungs. The five experiments
are as follows:
1. Severe COPD vs. Non COPD (Whole lung)
2. Mild to severe COPD vs. Non COPD (Whole lung)
3. Mild to severe COPD vs. Non COPD (Lobar level)
4. GOLD category classification (Whole lung)
5. GOLD category classification (Lobar level)
In addition to the three feature sets: density, texture and lung biomechanical, a
new feature set is formed which is the combination of best features from each of the three
feature sets. The fourth feature set is referred as ALL in the classification experiments.
The best subset of features is selected by linear forward feature selection approach.
Nearest neighbor algorithm is used for the classification and the optimal k value is
selected by the cross validation technique. The dataset is divided in to test and training
data using leave one out cross validation technique. In leave one out cross validation, one
subject from the data set is used as a test data every time and the remaining subjects as
the training data. The process is repeated such that every subject in the data is used as a
test data for at least once.
To estimate the classifier performance in each experiment, the area under the
receiver operator characteristic curve (ROC) measurement is used, often called AUC
measure. AUC provides a single measure showing the probability that a classifier will
rank a randomly chosen positive instance higher than a randomly chosen negative one.
AUC value range from 0 to 1 with 0 being worse and 1 being the perfect classification. In
addition to the AUC measure, a ROC curve estimating the performance of feature sets for
each class label in the classification is shown. Multiple regression analysis is done to find
37
37
the correlation between the optimal features selected in the classification and PFT
measurements (FEV1% predicted and FEV1/FVC). The adjusted R squared correlation
coefficient, is reported from the regression analysis. Adjusted R squared coefficient uses
the variances instead of variations which takes the sample size and number of predictor
variables into consideration. The results of the experiments are shown in the order of
materials and methods used for the experiment, ROC graphs for each class label in the
classification, area under the curve (AUC) results of the classification with correlations
between the PFT parameters and a table showing optimal features selected from each
feature set.
4.2.1. Severe COPD vs. Non COPD (Whole Lung)
The initial experiment is designed to estimate the effectiveness of the proposed
lung biomechanical feature set and the combination feature set (ALL) in distinguishing
severe COPD and non COPD subjects. The results are compared with the density based
and texture based features. The materials and methods followed in this experiment are
shown in table 6. Two groups of data are considered for this experiment: The non-smoker
subjects are considered as healthy cases and subjects from GOLD3, GOLD4 severity
stage are considered as the diseased cases. Classification is done on 45 subjects with 15
nonsmokers and 30 severe GOLD stage subjects as explained in table 6.
All the four feature sets achieved almost 100% classification accuracy with an
AUC of 0.99 in this experiment, as shown in table 7. Correlation between the optimal
features from the feature sets and PFT parameters is shown in table 7. Density based and
texture based features showed excellent correlations with FEV1/FVC when compared to
the correlations with FEV1% predicted. The proposed lung biomechanical features
showed correlations greater than 0.85 with both the PFT measures. When the best
features from each feature set combined together in ALL, there is a significant
38
38
improvement in the correlations by maintaining the same classification accuracy. The
optimal features selected for the classification are shown in table 8.
Classification Non COPD vs. Severe COPD classification
Dataset Non COPD, GOLD3, GOLD4 (15 subjects/case)
Total number of subjects 45 (15 Non COPD vs. 30 Diseased)
Feature sets Density, Texture, Lung Biomechanical, ALL
Feature selection algorithm Linear forward selection
Classification algorithm K nearest neighbor , leave one out cross validation
Table 6: Material and Methods for experiment 4.2.1
Feature sets AUC Correlation
FEV1%
Correlation
FEV1/FVC
Density Based 0.99 0.79
0.91
Texture Based 0.98 0.71 0.88
Lung Biomechanical 0.99 0.85 0.86
ALL 0.99 0.87 0.92
Table 7: Area under the ROC curve and correlation results from multiple regression analysis for each feature set and all the reported correlations are statistically significant with p < 0.0001
39
39
Feature Set Optimal Features
Density based emphysema, air trapping
Texture based gaussian, gradient magnitude of Gaussian
Lung biomechanical based jacobian, Strain, ADI
Table 8: Optimal set of features selected for severe vs. normal classification where ADI represents anisotropic deformation index
The following observations can be made from this experiment:
1. There is a definite scope for the proposed lung biomechanical features in
analyzing COPD. Inclusion of mechanical features to density and texture based
features improved the overall performance of the system.
2. Density based features have a high correlation of 0.91 with the FEV1/FVC, which
is a clinical measure for the presence or absence of COPD.
3. Lung biomechanical features have good correlations with both the PFT measures,
in particular, it showed excellent correlation with the severity measure FEV1%
predicted with a significance level of p < 0.001.
4. There is a significant increase in the correlation with PFT measures when all the
feature sets combined together.
40
40
4.2.2. Mild to Severe COPD VS. Non COPD
(Whole Lung)
As a next step, the performance of lung biomechanical feature set and the
combination feature set (ALL) in detecting the presence or absence of COPD is tested.
The results are compared with the density based and texture based features. The materials
and methods followed in this experiment are shown in table 9. The dataset is divided in
to two classes for this experiment: nonsmokers, GOLD0 subjects as healthy cases and
subjects from GOLD (1-4) stages are considered as diseased cases. A total of 90 subjects
are used for this experiment considering 30 healthy and 60 diseased cases. ROC curves
for normal and COPD subject classifications are shown in figure 11 and figure 12.
Classification COPD vs. Non COPD classification
Dataset Non COPD, GOLD0, GOLD1, GOLD2, GOLD3,
GOLD4
Total number of subjects 90 (30 Normal vs. 60 Diseased)
Feature sets Density, Texture, Lung Biomechanical and ALL
Feature selection algorithm Linear forward selection
Classification algorithm K nearest neighbor search, leave one out cross validation
Table 9: Dataset and algorithm information for experiment 4.2.2
41
41
Figure 11: ROC curves showing the performance of the feature set in classifying healthy subjects
Figure 12: ROC curves showing the performance of the feature set in classifying COPD subjects
0
0.1
0.2
0.3
0.4
0.5
0.6
0.7
0.8
0.9
1
0 0.1 0.2 0.3 0.4 0.5 0.6 0.7 0.8 0.9 1
Tru
e P
osi
tive
Rat
e
False Positive Rate
Density Based
Texture Based
Lung Biomechanical
ALL
Random Guess
0
0.1
0.2
0.3
0.4
0.5
0.6
0.7
0.8
0.9
1
0 0.1 0.2 0.3 0.4 0.5 0.6 0.7 0.8 0.9 1
Tru
e P
osi
tive
Rat
e
False Positive Rate
Density Based
Texture Based
Lung Biomechanical
ALL
Random Guess
42
42
Density features were successful than the other feature sets in recognizing COPD.
Density features achieved an AUC of 0.92 and correlated well with FEV1/FVC measure
as shown in table 10. Textural and mechanical features achieved an AUC of 0.86 (table
10). Textural features showed better correlation with FEV1/FVC measure whereas lung
biomechanical features correlated well with FEV1%. When the feature sets combined
together in ALL, there is a significant improvement in the classifier performance. Also,
better correlations with the PFT measures are observed.
Feature sets AUC Correlation
FEV1%
Correlation
FEV1/FVC
Density Based 0.92 0.71
0.85
Texture Based 0.86 0.66 0.77
Lung Biomechanical 0.86 0.74 0.71
ALL 0.92 0.82 0.85
All the correlations showed a statistical significance of p < 0.0001
Table 10: Area under the ROC curve for the whole lung COPD/Non-COPD classification and correlations with PFT measures from multiple regression analysis
The optimal features of each feature set from the feature selection process are
shown in table 11. Jacobian features are selected from the lung biomechanical feature set.
Both emphysema and air trapping are shown to be effective in detecting COPD presence.
Features calculated from gradient magnitude of the gaussian and the laplacian of gaussian
filters are the selected texture based features.
43
43
Feature Set Optimal Features
Density based emphysema, air trapping
Texture based gradient magnitude and laplacian of the Gaussian
Lung biomechanical based Jacobian
Table 11: Optimal set of features selected for COPD/Non-COPD classification.
Although density based features showed better classification accuracy in the
overall COPD/Non-COPD classification, the percentage of COPD subjects that are
classified as normal subjects using density features is high. Lung biomechanical features
have a comparatively less error percentage than the density and texture features. A graph
showing the true positive rate against the false negative rate for each feature set in
COPD/Non-COPD classification is shown in figure 13. Texture based and density based
features have shown higher error rate in classifying diseased subjects. Textural features
have more than 50% misclassification of COPD subjects. When lung biomechanical
features added to texture and density features, the percentage of false negatives is
significantly decreased.
This experiment shows:
1. The strength of density based features in finding the presence or absence of
COPD. This feature set achieved an AUC of 0.92 and a high correlation of 0.85
with FEV1/FVC diagnostic measure.
44
44
2. Lung biomechanical features, in particular Jacobian measure, achieved an AUC of
0.86 in detecting COPD presence. Also, it showed good correlation of 0.73 with
the severity measure FEV1% predicted.
Figure 13: Graph showing the false negative rate in COPD/Non-COPD classification.
3. When the density, texture and mechanical features combined together, it achieved
an AUC of 0.92 with significant improvement of correlation with both the PFT
measures.
4. Lung biomechanical features and the combination of all the features showed less
error percentage in classifying COPD cases.
0
0.1
0.2
0.3
0.4
0.5
0.6
0.7
0.8
0.9
1
0 0.1 0.2 0.3 0.4 0.5 0.6 0.7 0.8 0.9 1
Tru
e P
osi
tive
Rat
e
False Negatives/Total number of false cases
Density Based
Texture Based
Mechanical
ALL
45
45
4.2.3. Mild to Severe COPD VS. Non-COPD
(Lobar Level)
A two-class classification experiment is performed to detect COPD presence in
lobes of the lung. Classification is performed using the features calculated from upper
lobes and lower lobes separately. The disease label is assigned to a lobe from the label of
the whole lung for training purposes. If the subject falls into a GOLD category, then all
the lobes of the lung are assigned with same GOLD label. The dataset is divided into 30
normal cases and 60 diseased cases. The classification is performed to check how well
the proposed feature sets can classify lobes into a disease or a normal class. The three
feature sets: density based, texture based and lung biomechanical based are extracted
from upper lobes and lower lobes separately. The methods and materials used in this
experiment are shown in table 12. The area under the curve results of classification are
shown in table 13 and 14. The ROC plots for lower lobe and upper lobe classification of
COPD/Non-COPD are shown in figure 14, 15, 16 and 17. The optimal features selected
from each feature set in the lobar classification are shown in table 15.
Similar to the whole lung results, the combination feature set is the best of all
feature sets in both upper lobe and lower lobe classification in detecting COPD presence.
All the feature sets achieved better classification results in the lower lobe classification
than the upper lobes. Density based features achieved an AUC of 0.92 at lower lobes by
showing good correlation with the FEV1/FVC measure, shown in table 13. Lung
biomechanical features achieved an AUC of 0.85 at lower lobes and correlated well with
both the PFT measures. All the feature sets have a poor correlation with FEV1%
predicted in the upper lobe classification, shown in table 14. Texture based features
performed well with an AUC of 0.86 at upper lobes. The classification accuracy is
46
46
significantly increased at upper lobes when all the features combined together. Also, the
combination feature set showed better correlations with the PFT measures in the upper
Feature selection algorithm Linear forward selection
Classification algorithm K nearest neighbor , leave one out fold cross validation
Table 16: Material and Methods for Experiment 4.2.4.
52
52
Feature sets AUC Correlation
FEV1%
Correlation
FEV1/FVC
Density Based 0.78 0.69
0.83
Texture Based 0.77 0.63 0.72
Lung Biomechanical 0.80 0.72 0.66
ALL 0.86 0.84 0.84
All the correlations showed a statistical significance of p < 0.0001
Table 17: Area under the ROC curve and correlation results from multiple regression analysis for each feature set.
Figure 18: ROC curves showing the performance of the feature sets in classifying GOLD0 COPD subjects
0
0.1
0.2
0.3
0.4
0.5
0.6
0.7
0.8
0.9
1
0 0.1 0.2 0.3 0.4 0.5 0.6 0.7 0.8 0.9 1
Tru
e P
osi
tive
Rat
e
False Positive Rate
Density Based
Texture Based
Lung Biomechanical
ALL
53
53
Figure 19: ROC curves showing the performance of the feature sets in classifying GOLD1 COPD subjects
Figure 20: ROC curves showing the performance of the feature sets in classifying GOLD0 COPD subjects
0
0.1
0.2
0.3
0.4
0.5
0.6
0.7
0.8
0.9
1
0 0.1 0.2 0.3 0.4 0.5 0.6 0.7 0.8 0.9 1
Tru
e P
osi
tive
Rat
e
False Positive Rate
Density Based
Texture Based
ALL
Lung Biomechanical
0
0.1
0.2
0.3
0.4
0.5
0.6
0.7
0.8
0.9
1
0 0.1 0.2 0.3 0.4 0.5 0.6 0.7 0.8 0.9 1
Tru
e P
osi
tive
Rat
e
False Positive Rate
Density Based
Texture Based
Lung Biomechanical
ALL
54
54
Figure 21: ROC curves showing the performance of the feature sets in classifying GOLD3 COPD subjects
Figure 22: ROC curves showing the performance of the feature sets in classifying GOLD4 subjects.
0
0.1
0.2
0.3
0.4
0.5
0.6
0.7
0.8
0.9
1
0 0.1 0.2 0.3 0.4 0.5 0.6 0.7 0.8 0.9 1
Tru
e P
osi
tive
Rat
e
False Positive Rate
Density Based
Texture Based
Lung Biomechanical
ALL
0
0.1
0.2
0.3
0.4
0.5
0.6
0.7
0.8
0.9
1
0 0.1 0.2 0.3 0.4 0.5 0.6 0.7 0.8 0.9 1
Tru
e P
osi
tive
Rat
e
False Positive Rate
Density Based
Texture Based
Lung Biomechanical
ALL
55
55
Feature Set Optimal Features
Density based air trapping
Texture based gaussian, gradient magnitude and laplacian of the gaussian
Lung biomechanical based jacobian, Strain, ADI
Table 18: Optimal features selected for GOLD severity classification.
Lung biomechanical features have a higher rate of classification at the later stages
of the disease than at the initial stages. In particular, at GOLD2 stage, density features
and texture features failed to perform (figure 20). The confusion matrix of density,
texture and mechanical feature sets in GOLD category classification is shown in table 19,
20 and 21.
GOLD0 GOLD1 GOLD2 GOLD3 GOLD4
GOLD0 11 4 0 0 0
GOLD1 5 4 3 3 0
GOLD2 6 7 0 2 0
GOLD3 1 1 0 9 4
GOLD4 0 0 0 7 8
Table 19: Confusion matrix of density based feature set from the GOLD category classification of whole lung.
56
56
GOLD0 GOLD1 GOLD2 GOLD3 GOLD4
GOLD0 8 2 3 1 0
GOLD1 2 10 3 0 0
GOLD2 4 7 1 3 0
GOLD3 1 2 1 11 0
GOLD4 0 0 0 6 9
Table 20: Confusion matrix of texture based feature set from the GOLD category classification of whole lung.
GOLD0 GOLD1 GOLD2 GOLD3 GOLD4
GOLD0 11 4 0 0 0
GOLD1 11 2 1 1 0
GOLD2 3 1 9 1 1
GOLD3 0 1 2 9 3
GOLD4 0 1 0 5 9
Table 21: Confusion matrix of lung biomechanical feature set from the GOLD category classification of whole lung.
57
57
Figure 23: Chart showing the percentage of correctly classified instances at initial stages of the disease versus later stages of the disease. G0-G1 represents classification of GOLD0, GOLD1 subjects and G2-G4 for GOLD2, GOLD3, and GOLD4.
Density and texture based features together classified one GOLD2 subject
correctly whereas 9 out of 15 GOLD2 subjects are identified by the lung biomechanical
features, shown in table 19, 20 and 21. Density and texture based features have a better
classification results at GOLD0 and GOLD1 stage. Lung biomechanical features showed
difficulties in classifying GOLD1 stage subjects as most of them classified as GOLD0
stage. This suggests a possible onset of major mechanical changes in COPD subjects at
GOLD2 stage. The classification accuracies of the three feature sets at the initial stages
and later stages are shown in figure 23. Lung biomechanical features achieved higher
accuracies from GOLD2 to GOLD4 stage where as texture based features have high
classification rates at the initial stages.
50
37
60
46 43
60
G0-G1 G2-G4
Tru
e P
osi
tive
Rat
e
Severity Stages
DENSITY TEXTURE LUNG BIOMECHANICAL
58
58
This experiment shows:
1. The significant performance of the combination feature set with an AUC of 0.86
than the individual feature sets in the GOLD category classification.
2. Lung biomechanical feature performance with an AUC of 0.8, which is higher
than the density based and texture based features. It also showed good correlation
with FEV1% predicted measure.
3. Lung biomechanical feature classification accuracy is significantly higher at
GOLD2 stage than the density and texture based features.
4. Density and texture based features higher correlations with FEV1/FVC whereas
lung biomechanical features have a good correlation with FEV1% predicted.
5. Lung biomechanical features have higher classification accuracy at the later
stages of the disease starting at GOLD2, which shows the onset of mechanical
changes at that particular stage.
4.2.5. GOLD Category Classification (Lobar Level)
The progression of COPD at a regional level is estimated in this classification
experiment. GOLD severity classification is done for upper lobes and lower lobes. The
severity labels for lobes are assigned from the global label of the lung. The materials and
methods used in this experiment are shown in table 22. AUC results for the classification
of upper lobes and lower lobes are shown in table 23 and table 24.
Lung biomechanical features showed better classification results in assessing
severity stage of the lobes. Higher classification accuracies and better correlations
observed at the lower lobe classification than at the upper lobes. The combination feature
set, ALL is the best of all with significant AUC of 0.75 and 0.84 at upper lobes and lower
lobes. Also, there is a significant increase in the correlation with the PFT measures when
all the feature sets combined. Lung biomechanical features showed better correlations
59
59
with the PFT measures at the lower lobes. Density based and texture based features have
better correlation with FEV1/FVC than the FEV1 % predicted measure.
into upper lobes, lower lobes and the right middle lobe
Total number of subjects 75(15 subjects/class)
Feature sets Density, Texture-based, Lung Biomechanical, All
Feature selection algorithm Linear forward selection
Classification algorithm K nearest neighbor, leave one out cross validation
Table 22: Material and Methods for Experiment 4.2.5
Feature sets AUC Correlation
FEV1%
Correlation
FEV1/FVC
Density Based 0.69 0.59
0.66
Texture Based 0.72 0.58 0.69
Lung Biomechanical 0.74 0.55 0.57
ALL 0.75 0.62 0.70
All the correlations showed a statistical significance of p < 0.0001
Table 23: Area under the ROC curve for the upper lobes and correlation results from multiple regression analysis for each feature set.
60
60
Feature sets AUC Correlation
FEV1%
Correlation
FEV1/FVC
Density Based 0.75 0.59
0.69
Texture Based 0.73 0.57 0.70
Lung Biomechanical 0.76 0.75 0.75
ALL 0.84 0.77 0.79
All the correlations showed a statistical significance of p < 0.0001 Table 24: Area under the ROC curve for the lower lobes and correlation results from
multiple regression analysis for each feature set.
61
61
CHAPTER 5
DISCUSSION
The conducted experiments in this study shows that the estimates of regional
lung tissue expansion and contraction can be used to recognize COPD in pulmonary CT
scans using supervised machine learning techniques. Density based features has been
previously shown to be effective in COPD diagnosis3, 7-9, 22, 23, 29, 53
. It also has been
previously demonstrated that the textural patterns on CT images are useful in COPD
classification13-16, 33, 34
. In this study, the proposed lung biomechanical features are tested
against these existing features for the classification of COPD. It is shown that the
inclusion of mechanical features to the existing density based and texture based feature
improves the detection of COPD presence and severity to a significant extent.
As an initial step in validating our proposed features, correlation of these features
with the clinical pulmonary function test measures is checked. It is clear that all the lung
biomechanical features are correlated to a good degree with the PFT measures. The
jacobian measure showed excellent correlations of 0.83 and 0.84 with FEV1/FVC,
FEV1% predicted values. However, jacobian measures comes after air trapping measure
(percent -856) of the density based features, which showed high correlations of 0.83 and
0.91 with FEV1/FVC, FEV1% predicted values. All the correlation coefficients of the
lung biomechanical features are found to be significant using t-tests with significance
level p < 0.0001. This correlation with the PFT measures suggests a definite relationship
between mechanical features and pulmonary function.
As a first classification experiment, a two-class problem was defined by the two
subject groups, healthy (No COPD) and COPD (mild to severe) to estimate the
performance of lung biomechanical features in recognizing COPD. The results of the
classification are shown in table 10. The obtained lung biomechanical features compare
well to previous methods in discriminating subjects with and without COPD, by
62
62
achieving an AUC of 0.86. Also, there is a good correlation of mechanical features with
FEV1% predicted values whereas density and textural features correlates best with
FEV1/FVC values. This suggests the sensitivity of mechanical features to the level of
severity of the COPD, which is determined by FEV1% predicted measure. When the
proposed features combined with density and textural features, there is a significant
increase in the classification accuracy and also in the correlation with FEV1% predicted.
Also, density based features achieved a better AUC of 0.92 in this experiment and
showed good correlation of 0.85 with the FEV1/FVC and 0.71 with FEV1% predicted
values. Despite of this good classification accuracy, density and textural features showed
high misclassifications of COPD subjects as normal. On the other hand, lung
biomechanical features have less misclassification rate resulting in overall rise of the
classifier performance when all the feature sets combined together. This suggests that the
mechanical features add important value in detecting COPD presence.
To assess COPD presence at a regional level, the same two-class problem was
defined using the features calculated from upper lobes and lower lobes. We estimated the
performance of proposed features in detecting COPD presence at the lobar level. The
results from table 13 and 14 shows that all the features sets performed better at lower
lobes than at upper lobes. Lung biomechanical features showed high correlations with
PFT measures at lower lobes, showing its sensitivity to disease presence. Also, there is a
significant improvement in the classification accuracy at upper lobes when all the
features combined together. The combinations of features are observed to be more
effective than the individual set of features in assessing COPD presence in upper lobes of
the lung. Similarly, the combination resulted in better classification results at lower lobes.
In these experiments at whole lung and lobar level, ten different mechanical features were
selected for the classification. The jacobian measures are selected in both the whole lung
and lobar classification whereas strain and ADI measures were selected for only lobar
classification. This wide selection of different mechanical features shows the influence of
63
63
lung tissue deformational changes in regional assessment of COPD using pulmonary CT
scans.
A five class problem was defined to categorize COPD subjects into their
corresponding GOLD severity using the proposed mechanical features. Fifteen subjects
from each GOLD severity were used. Lung biomechanical features are more effective
than the density and texture based features in severity classification of COPD and
correlated best with the severity measure, FEV1% predicted values. Also, the inclusion of
mechanical features to density and texture features resulted in a significant classification
of COPD severity showing good correlations with the PFT measures. This shows the
sensitivity of mechanical features to the COPD severity. One interesting observation from
the severity classification results is the poor performance of density and texture features
at GOLD2 stage of the disease. On the other hand, lung biomechanical features were able
to classify nine out of 15 GOLD2 subjects compared to one subject with both density and
texture combined. This suggests the possibility of major lung functional changes at
GOLD2 stage, which were captured by lung biomechanical features. However,
mechanical features were not able to differentiate GOLD0 and GOLD1 subjects. This is a
possible indication of less mechanical changes in the lungs at initial stages of the disease.
On the other hand, textural features were able to distinguish subjects better at the initial
stages. These observations lead to a better classification accuracy at all stages of COPD
when both textural and mechanical features combined together. The lobe by lobe analysis
of COPD severity shows the higher classification accuracies at lower lobe. Lung
biomechanical features achieved better AUC than the density and textural features and
also significantly correlated with PFT measures. All the features calculated at upper lobes
were poorly correlated with the PFT measures. With the combination of all the features,
there is a significant increase in the classifier performance at both whole lung and lobar
level severity classification. Also, the combination of features showed better correlations
with the PFT measures. These results highlight the importance of adding mechanical
64
64
features to existing features for more accurate assessment of COPD severity. It is also
important that these features can be measured at regional level of the lung, as opposed to
PFT diagnosis based on whole lung function.
From the COPD/Non-COPD classification at both whole lung and lobar level, it
must be noted, density and texture based features performed reasonably better than the
lung biomechanical features. In particular, air trapping measure is proved to be a
significant measure in detecting COPD presence. Since, the subject range in this
classification is from GOLD1 to GOLD4 (mild to severe); there is a possibility of less
lung functional changes happening at the initial stages. This leads to a higher number of
misclassifications of GOLD1 as normal with lung biomechanical features, resulting in
overall reduction of the classifier performance. However, in the classification of normal
and severe COPD, the classification accuracy is same as density based and texture based
features. This also suggests the effective performance of mechanical features at later
stages of the disease. In addition to the density and texture based features that were used
in this study, there are several other CT derived features which can be useful in more
robust quantification of COPD. The number of features used in this study is less. There is
a definite scope in testing the effectiveness of several other features either individually or
in combination with the proposed features. The texture based feature set consists of three
basic gaussian filtered versions of the image at multiple scales. There are other textural
features which have been proven to be effective in COPD quantification13-16
. Some of
them are entropy, grey level non uniformities, co-occurrence matrices, run length
matrices and other gaussian derivative filters. A complete system consisting of all the CT
derived features related to both emphysema and small airway disease may result in more
accurate measures of COPD.
The proposed features performed comparatively well with the previous methods
of COPD diagnosis and severity classifications. The adaptive multiple feature method
65
65
(AMFM), proposed by Uppaluri et al., based on textural patterns of 2D CT images
achieved an accuracy of 100% in classifying normal and severe emphysema subjects but
with no significant correlation with PFT measures of emphysema15
. The extension of 2D
AMFM to 3D AMFM proposed by Xu et al. showed better results in discriminating
normal smoker and nonsmoker lung parenchyma16
. The combination feature set, ALL,
also achieved significant classification rate at early stage discrimination of subjects.
Another texture based approach proposed by Sorensen et al. based on gaussian filter
versions of CT, achieved an AUC of 0.713 in classifying COPD and Non-COPD
subjects13
. The combination of registration based features with the density based features,
proposed by Murphy et al. achieved an AUC of 0.92 in COPD diagnosis27
. Recently, the
combination of tracheal morphologic changes and emphysema features achieved an
accuracy of 80% in GOLD0 versus GOLD1-4 classification20
. In COPD diagnosis
experiments, the combination feature set, ALL, achieved an AUC of 0.99 in normal
versus severe COPD classification, an AUC of 0.92 in mild to severe COPD versus non-
COPD classification showing significant correlations with PFT measures. In COPD
severity classification, registration based ventilation measures proposed by Murphy et al.
achieved 67% classification accuracy. The combination of tracheal changes with
emphysema features achieved 51% accuracy18, 20
. The proposed feature set, ALL,
achieved an AUC of 0.86 in classifying COPD severity showing a significant correlation
of 0.84 with both the PFT measures.
Accurate severity classification of COPD is difficult, due to many drawbacks
associated with the PFT diagnosis, which is the sole measurement of severity. The major
drawback is its reproducibility, which relies on the subject’s ability to follow the given
instructions on the day of diagnosis. A small error during the test may result in assigning
different severity for the subject. There is a need to find the correlations of the proposed
features with the diagnostic measures other than PFT. Some of them are St. George’s
Respiratory Questionnaire (SGRQ), modified Medical Research Council questionnaire
66
66
(mMRC), bode index of the subject, other measures of lung volumes and so on. Also, the
size of the data used in this experiment is small (90 subjects) to conclusively state the
results of this experiment. In the future, a larger number of subjects will be investigated.
COPD is a heterogeneous disease characterized by two components: chronic
bronchitis and emphysema1. There are many other independent predictors of the disease
and that COPD cannot be defined by a single measure. This results in different phenotype
characteristics in subjects with COPD54-56
. The identification of COPD phenotypes
appears as one of the current major challenges in subjects with COPD. Many statistical
methods have been proposed to examine phenotypic heterogeneity of COPD55, 56
.
Clustering analysis is a statistical method which transforms heterogeneous groups of
variables into relatively homogenous groups with the use of advanced machine learning
capabilities. In the future, we will use this cluster analysis on the larger dataset to test the
hypothesis that the lung biomechanical features with other CT derived features could lead
to grouping of COPD subjects according to phenotypic characteristics.
67
67
CHAPTER 6
CONCLUSION
This study demonstrates the effectiveness of the registration based estimates of
lung tissue expansion and contraction in recognizing COPD and its severity. Three
measures were extracted from the registered scans and the features based on these three
measures showed good correlations with the pulmonary function. All the experiments
illustrated that the classification is improved at both COPD/Non-COPD and severity
stage classification with the inclusion of proposed lung biomechanical features to the
existing density and texture based features. With further testing on larger databases, the
proposed approach may be used for accurate measure of the pulmonary function and
disease.
68
68
APPENDIX
The demographic information of all the subjects used in this study collected from
COPDGene database.
COPDGENE
UIA #ID
AGE GENDER BMI FEV1/FVC FEV1%
PRED
GOLD
STAGE
18666W 61 F 25 0.88 1.16 Normal
18747W 60 F 26 0.78 0.92 Normal
18749A 76 F 41.7 0.82 0.85 Normal
18757Z 71 F 28.5 0.77 1.01 Normal
18765Y 70 M 25.8 0.87 1.20 Normal
18825Q 76 F 29.1 0.87 1.39 Normal
19020F 58 F 24.3 0.72 1.00 Normal
18826S 74 M 25.3 0.86 1.13 Normal
18763U 72 M 26.4 0.81 1.25 Normal
18734N 74 F 30.5 0.8 0.82 Normal
18782Y 65 M 28.1 0.84 0.91 Normal
18810D 79 F 35.2 0.84 0.96 Normal
Table A1: Demographic and spirometry information per subject (Continued)
69
69
COPDGENE
UIA #ID
AGE GENDER BMI FEV1/FVC FEV1%
PRED
GOLD
STAGE
18977N 71 M 28.7 0.74 0.87 Normal
10233D 61 M 27.4 0.72 0.95 GOLD0
10223A 67 M 32 0.79 0.89 GOLD0
10263M 61 F 27.7 0.76 1.00 GOLD0
10252H 63 F 31.2 0.79 1.07 GOLD0
10396F 67 M 23 0.72 0.90 GOLD0
10265Q 66 F 27.2 0.78 0.90 GOLD0
10443O 55 M 34.8 0.84 0.90 GOLD0
10101M 61 F 24.2 0.74 0.93 GOLD0
10123W 58 M 26.8 0.8 0.92 GOLD0
10124Y 65 M 31.8 0.8 0.9 GOLD0
10127E 61 F 22.6 0.83 0.91 GOLD0
10151B 76 M 25 0.76 0.92 GOLD0
10153F 66 M 29.4 0.74 0.91 GOLD0
10155J 64 F 27 0.7 0.95 GOLD0
10189A 80 M 29.3 0.71 0.96 GOLD0
10305C 76 M 23.7 0.56 0.93 GOLD1
Table A1 continued
70
70
COPDGENE
UIA #ID
AGE GENDER BMI FEV1/FVC FEV1%
PRED
GOLD
STAGE
10736D 78 F 39.9 0.56 0.81 GOLD1
10921Y 63 M 24.9 0.6 0.88 GOLD1
11506R 69 F 23.1 0.55 0.91 GOLD1
11113Y 70 F 22 0.65 1.05 GOLD1
11558K 68 F 22.9 0.58 0.80 GOLD1
11570A 77 F 22.5 0.66 1.04 GOLD1
10312Z 68 F 21.9 0.64 0.98 GOLD1
10313B 71 M 30.1 0.63 0.90 GOLD1
10569K 69 M 27.8 0.66 1.12 GOLD1
10598R 64 M 23.7 0.65 0.82 GOLD1
10603K 65 F 22.1 0.59 0.91 GOLD1
10307G 67 F 20.2 0.53 0.81 GOLD1
10190L 78 F 29.1 0.47 0.86 GOLD1
10253J 73 M 28.1 0.66 0.94 GOLD1
10192P 63 F 32.5 0.69 0.65 GOLD2
10457Z 68 F 26.3 0.68 0.74 GOLD2
10601G 65 M 40.5 0.66 0.71 GOLD2
Table A1 continued
71
71
COPDGENE
UIA #ID
AGE GENDER BMI FEV1/FVC FEV1%
PRED
GOLD
STAGE
10624S 70 M 31.8 0.48 0.61 GOLD2
10691H 69 M 23.3 0.63 0.78 GOLD2
10641S 76 M 24.1 0.57 0.65 GOLD2
10704Q 69 F 22.7 0.65 0.61 GOLD2
10125A 63 M 33.3 0.63 0.65 GOLD2
10126C 72 F 26.9 0.53 0.74 GOLD2
10130T 64 F 32.4 0.57 0.77 GOLD2
10141Y 65 F 28.7 0.51 0.56 GOLD2
10160C 68 M 20.6 0.55 0.54 GOLD2
10164K 65 F 40.8 0.66 0.62 GOLD2
10179X 70 F 32.5 0.59 0.59 GOLD2
10205Y 62 F 25.7 0.6 0.69 GOLD2
11875W 70 M 25.4 0.36 0.33 GOLD3
12001S 62 M 31 0.33 0.41 GOLD3
12250N 68 F 19 0.35 0.30 GOLD3
12608E 64 M 27.4 0.39 0.35 GOLD3
13042L 76 M 30.3 0.32 0.45 GOLD3
Table A1 continued
72
72
COPDGENE
UIA #ID
AGE GENDER BMI FEV1/FVC FEV1%
PRED
GOLD
STAGE
13059C 56 F 42.8 0.64 0.43 GOLD3
13145V 73 M 33 0.45 0.49 GOLD3
10719D 72 M 30.3 0.41 0.42 GOLD3
11201V 72 M 27.8 0.31 0.39 GOLD3
11703T 76 M 31.6 0.39 0.39 GOLD3
11750C 71 F 25.8 0.52 0.40 GOLD3
11754K 64 F 34.8 0.26 0.31 GOLD3
10503G 75 M 27.2 0.33 0.33 GOLD3
10708Y 69 M 28.1 0.4 0.44 GOLD3
10571X 68 F 27 0.36 0.40 GOLD3
14192J 63 F 20.1 0.17 0.12 GOLD4
16104W 64 M 21.3 0.26 0.10 GOLD4
15690E 64 F 25.9 0.3 0.28 GOLD4
15284T 45 F 20.6 0.28 0.22 GOLD4
17173U 61 M 33.5 0.33 0.24 GOLD4
16294B 68 M 46.1 0.39 0.24 GOLD4
21700T 62 M 25.5 0.22 0.24 GOLD4
Table A1 continued
73
73
COPDGENE
UIA #ID
AGE GENDER BMI FEV1/FVC FEV1%
PRED
GOLD
STAGE
13344B 69 F 25.7 0.35 0.22 GOLD4
13383L 63 F 25.7 0.31 0.22 GOLD4
14197T 70 M 39.2 0.24 0.28 GOLD4
14538T 71 M 27.4 0.25 0.23 GOLD4
14880F 67 M 33.7 0.24 0.28 GOLD4
24383W 67 F 15.4 0.35 0.29 GOLD4
15861F 55 F 26 0.32 0.26 GOLD4
15811Q 71 M 28.4 0.23 0.23 GOLD4
Table A1 continued
74
74
REFERENCES
1. Rabe KF, Hurd S, Anzueto A, Barnes PJ, Buist SA, Calverley P, Fukuchi Y,
Jenkins C, Rodriguez-Roisin R, van Weel C, Zielinski J, Global Initiative for Chronic Obstructive Lung D. Global strategy for the diagnosis, management, and prevention of chronic obstructive pulmonary disease: Gold executive summary. American journal of respiratory and critical care medicine. 2007;176:532-555
2. GOLDCOPD. From the global strategy for the diagnosis, management and
prevention of copd, global initiative for chronic obstructive lung disease (gold) 2011. . 2011
3. Gurney JW, Jones KK, Robbins RA, Gossman GL, Nelson KJ, Daughton D,
Spurzem JR, Rennard SI. Regional distribution of emphysema: Correlation of high-resolution ct with pulmonary function tests in unselected smokers. Radiology. 1992;183:457-463
T, Kok-Jensen A. Long-range correlations of serial fev1 measurements in emphysematous patients and normal subjects. Journal of applied physiology. 1998;85:259-265
5. Bafadhel M, Umar I, Gupta S, Raj JV, Vara DD, Entwisle JJ, Pavord ID,
Brightling CE, Siddiqui S. The role of ct scanning in multidimensional phenotyping of copd. Chest. 2011;140:634-642
6. Lynch DA, Newell JD. Quantitative imaging of copd. Journal of thoracic
imaging. 2009;24:189-194 7. Gevenois PA, de Maertelaer V, De Vuyst P, Zanen J, Yernault JC. Comparison of
computed density and macroscopic morphometry in pulmonary emphysema. American journal of respiratory and critical care medicine. 1995;152:653-657
8. Muller NL, Staples CA, Miller RR, Abboud RT. "Density mask". An objective
method to quantitate emphysema using computed tomography. Chest. 1988;94:782-787
9. Muller NL, Thurlbeck WM. Thin-section ct, emphysema, air trapping, and airway
obstruction. Radiology. 1996;199:621-622 10. Busacker A, Newell JD, Jr., Keefe T, Hoffman EA, Granroth JC, Castro M, Fain
S, Wenzel S. A multivariate analysis of risk factors for the air-trapping asthmatic phenotype as measured by quantitative ct analysis. Chest. 2009;135:48-56
11. Newman KB, Lynch DA, Newman LS, Ellegood D, Newell JD, Jr. Quantitative
computed tomography detects air trapping due to asthma. Chest. 1994;106:105-109
75
75
12. Hoffman EA, Reinhardt JM, Sonka M, Simon BA, Guo J, Saba O, Chon D, Samrah S, Shikata H, Tschirren J, Palagyi K, Beck KC, McLennan G. Characterization of the interstitial lung diseases via density-based and texture-based analysis of computed tomography images of lung structure and function. Academic radiology. 2003;10:1104-1118
13. Sorensen L, Nielsen M, Lo P, Ashraf H, Pedersen JH, de Bruijne M. Texture-
based analysis of copd: A data-driven approach. IEEE transactions on medical imaging. 2012;31:70-78
14. Sorensen L, Shaker SB, de Bruijne M. Quantitative analysis of pulmonary
emphysema using local binary patterns. IEEE transactions on medical imaging. 2010;29:559-569
15. Uppaluri R, Mitsa T, Sonka M, Hoffman EA, McLennan G. Quantification of
pulmonary emphysema from lung computed tomography images. American journal of respiratory and critical care medicine. 1997;156:248-254
16. Xu Y, Sonka M, McLennan G, Guo J, Hoffman EA. Mdct-based 3-d texture
classification of emphysema and early smoking related lung pathologies. IEEE transactions on medical imaging. 2006;25:464-475
17. Ding K, Yin Y, Cao K, Christensen GE, Lin CL, Hoffman EA, Reinhardt JM.
Evaluation of lobar biomechanics during respiration using image registration. Medical image computing and computer-assisted intervention : MICCAI ... International Conference on Medical Image Computing and Computer-Assisted Intervention. 2009;12:739-746
18. Murphy K, Pluim JP, van Rikxoort EM, de Jong PA, de Hoop B, Gietema HA,
Mets O, de Bruijne M, Lo P, Prokop M, Ginneken B. Toward automatic regional analysis of pulmonary function using inspiration and expiration thoracic ct. Medical physics. 2012;39:1650-1662
19. Reinhardt JM, Ding K, Cao K, Christensen GE, Hoffman EA, Bodas SV.
Registration-based estimates of local lung tissue expansion compared to xenon ct measures of specific ventilation. Medical image analysis. 2008;12:752-763
20. Van Rikxoort EM DJP, Mets OM and Van Ginneken B. Automatic classification
of pulmonary function in copd patients using trachea analysis in chest ct scans. . SPIE. 2012
21. Gould GA, MacNee W, McLean A, Warren PM, Redpath A, Best JJ, Lamb D,
Flenley DC. Ct measurements of lung density in life can quantitate distal airspace enlargement--an essential defining feature of human emphysema. The American review of respiratory disease. 1988;137:380-392
22. Gould GA, Redpath AT, Ryan M, Warren PM, Best JJ, Flenley DC, MacNee W.
Lung ct density correlates with measurements of airflow limitation and the diffusing capacity. The European respiratory journal : official journal of the European Society for Clinical Respiratory Physiology. 1991;4:141-146
76
76
23. Newell JD, Jr., Hogg JC, Snider GL. Report of a workshop: Quantitative computed tomography scanning in longitudinal studies of emphysema. The European respiratory journal : official journal of the European Society for Clinical Respiratory Physiology. 2004;23:769-775
24. Shaker SB, Dirksen A, Laursen LC, Maltbaek N, Christensen L, Sander U,
Seersholm N, Skovgaard LT, Nielsen L, Kok-Jensen A. Short-term reproducibility of computed tomography-based lung density measurements in alpha-1 antitrypsin deficiency and smokers with emphysema. Acta radiologica. 2004;45:424-430
25. Matsuoka S, Kurihara Y, Yagihashi K, Hoshino M, Watanabe N, Nakajima Y.
Quantitative assessment of air trapping in chronic obstructive pulmonary disease using inspiratory and expiratory volumetric mdct. AJR. American journal of roentgenology. 2008;190:762-769
26. Lee TA, Bartle B, Weiss KB. Spirometry use in clinical practice following
diagnosis of copd. Chest. 2006;129:1509-1515 27. Murphy k, van Ginneken B, Van Rikxoort EM, de Hoop BJ, Prokop M, Lo P, de
Bruijne M and Pluim JPW. . Obstructive pulmonary function: Patient classification using 3d registration of inspiration and expiration ct images.
28. Lederman D LJ, Zheng B, Sciurba FB, Tan J and Gur D. Quantitative computed
tomography of lung parenchyma in patients with emphysema: Analysis of higher density lung regions. SPIE. 2011
29. Park YS, Seo JB, Kim N, Chae EJ, Oh YM, Lee SD, Lee Y, Kang SH. Texture-
based quantification of pulmonary emphysema on high-resolution computed tomography: Comparison with density-based quantification and correlation with pulmonary function test. Investigative radiology. 2008;43:395-402
30. Sakai N, Mishima M, Nishimura K, Itoh H, Kuno K. An automated method to
assess the distribution of low attenuation areas on chest ct scans in chronic pulmonary emphysema patients. Chest. 1994;106:1319-1325
dimensional characterization of regional lung deformation. Journal of biomechanics. 2011;44:2489-2495
32. National Institute of Health. NIH. COPD. 2010 33. Xu Y, van Beek EJ, Hwanjo Y, Guo J, McLennan G, Hoffman EA. Computer-
aided classification of interstitial lung diseases via mdct: 3d adaptive multiple feature method (3d amfm). Academic radiology. 2006;13:969-978
34. Xu YS, M. McLennan, G. Guo J and Hoffman EA. Sensitivity and specificity of
3d texture analysis of lung parenchyma is better than 2d for discrimination of lung pathology in stage 0 copd. SPIE. 2005
35. Hoffman EA, McLennan G. Assessment of the pulmonary structure-function
relationship and clinical outcomes measures: Quantitative volumetric ct of the lung. Academic radiology. 1997;4:758-776
77
77
36. Analyze Image Processing Software. Mayo Clinic. Rochester. NY. 37. Galvin I, Drummond GB, Nirmalan M. Distribution of blood flow and ventilation
in the lung: Gravity is not the only factor. British journal of anaesthesia. 2007;98:420-428
38. Gee J, Sundaram T, Hasegawa I, Uematsu H, Hatabu H. Characterization of
regional pulmonary mechanics from serial magnetic resonance imaging data. Academic radiology. 2003;10:1147-1152
39. Luis Ib´a˜nez WS, Lydia Ng, Josh Cates, and the Insight Software Consortium.
The itk software guide, second edition, updated for itk version 2.4. 2005 40. Cao K, Christensen, G.E., Ding, K., Reinhardt, J.M. Intensity-and-landmark-
driven, inverse consistent, b-spline registration and analysis forlung imagery. Second International Workshop on Pulmonary Image Analysis. 2009
41. Yin Y, Hoffman EA, Lin CL. Mass preserving nonrigid registration of ct lung
images using cubic b-spline. Medical physics. 2009;36:4213-4222 42. Cao K. Local lung tissue expansion analysis based on inverse consistent image
determinants of exacerbations in severe, early-onset copd. The European respiratory journal : official journal of the European Society for Clinical Respiratory Physiology. 2007;30:1124-1130
Essen, D.V. Topological properties of smooth anatomic maps. Information Proceedings in Medical Imaging. 1995;3
45. RC B. Advanced calculus. St. Louis: McGraw-Hill Book Company; 1978. 46. Lubliner J. Plasiticity theory. Mineola, NY: Dover Publication; 2008. 47. Pellegrino R, Viegi G, Brusasco V, Crapo RO, Burgos F, Casaburi R, Coates A,
van der Grinten CP, Gustafsson P, Hankinson J, Jensen R, Johnson DC, MacIntyre N, McKay R, Miller MR, Navajas D, Pedersen OF, Wanger J. Interpretative strategies for lung function tests. The European respiratory journal : official journal of the European Society for Clinical Respiratory Physiology. 2005;26:948-968
48. Gutlein M FE, Hall M, and Karwath A. Large-scale attribute selection using
wrappers. . 2009 49. Mark Hall EF, Geoffrey Holmes, Bernhard Pfahringer, Peter Reutemann, Ian H.
Witten. The weka data mining software: An update; sigkdd explorations,. 2009 50. Aha D.W. KD, and Albert M.K. Instance-based learning algorithms. Machine
Learning. 1991 51. Sluimer IC, van Waes PF, Viergever MA, van Ginneken B. Computer-aided
diagnosis in high resolution ct of the lungs. Medical physics. 2003;30:3081-3090
78
78
52. Yavarna T. Airway segmentation of the ex-vivo mouse lung volume using voxel based classification. Biomedical Engineering. 2011;Masters of Science
53. Newell JD, Jr. Quantitative computed tomography of lung parenchyma in chronic
obstructive pulmonary disease: An overview. Proceedings of the American Thoracic Society. 2008;5:915-918
54. Bourdin A, Burgel PR, Chanez P, Garcia G, Perez T, Roche N. Recent advances
in copd: Pathophysiology, respiratory physiology and clinical aspects, including comorbidities. European respiratory review : an official journal of the European Respiratory Society. 2009;18:198-212
Court-Fortune I, Perez T, Carre P, Roche N, Initiatives BSC. Clinical copd phenotypes: A novel approach using principal component and cluster analyses. The European respiratory journal : official journal of the European Society for Clinical Respiratory Physiology. 2010;36:531-539
56. Weatherall M, Travers J, Shirtcliffe PM, Marsh SE, Williams MV, Nowitz MR,
Aldington S, Beasley R. Distinct clinical phenotypes of airways disease defined by cluster analysis. The European respiratory journal : official journal of the European Society for Clinical Respiratory Physiology. 2009;34:812-818


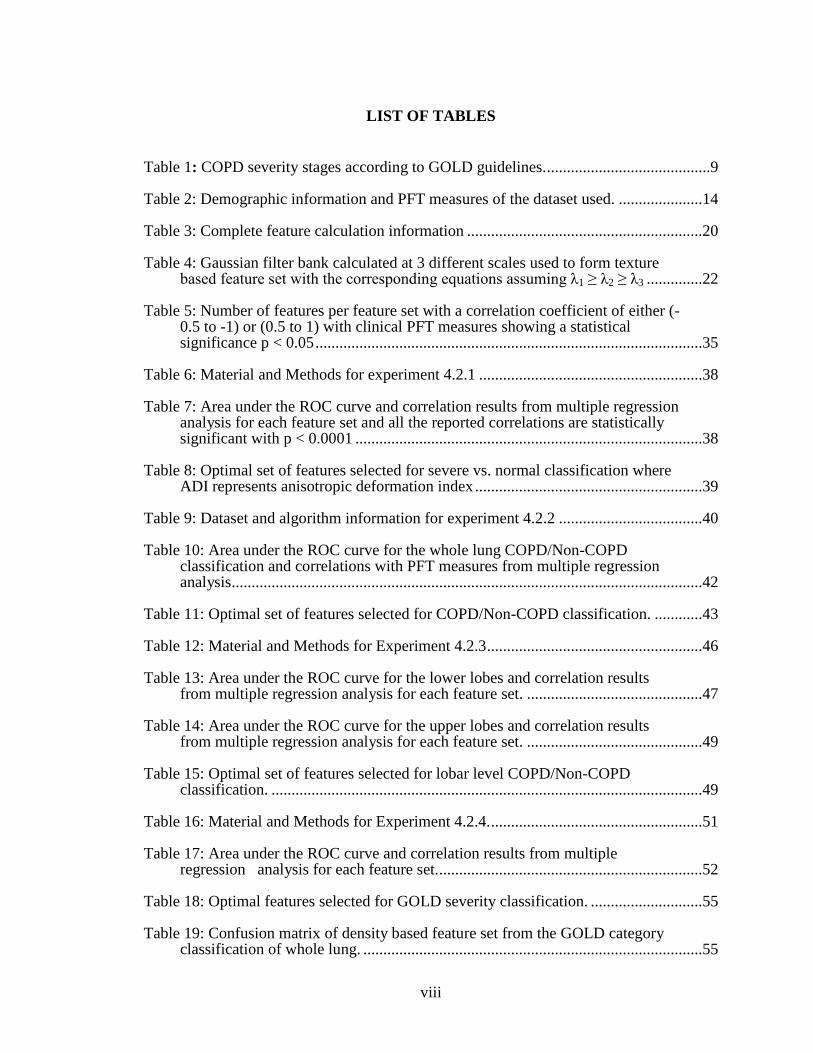
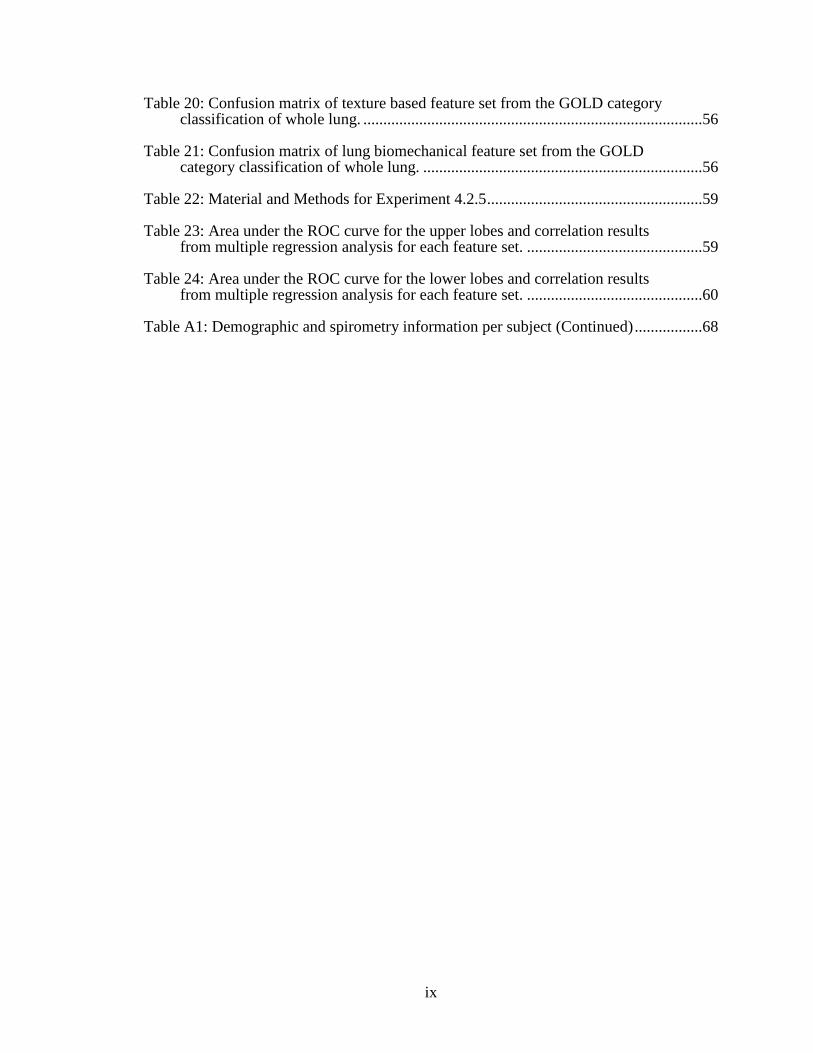
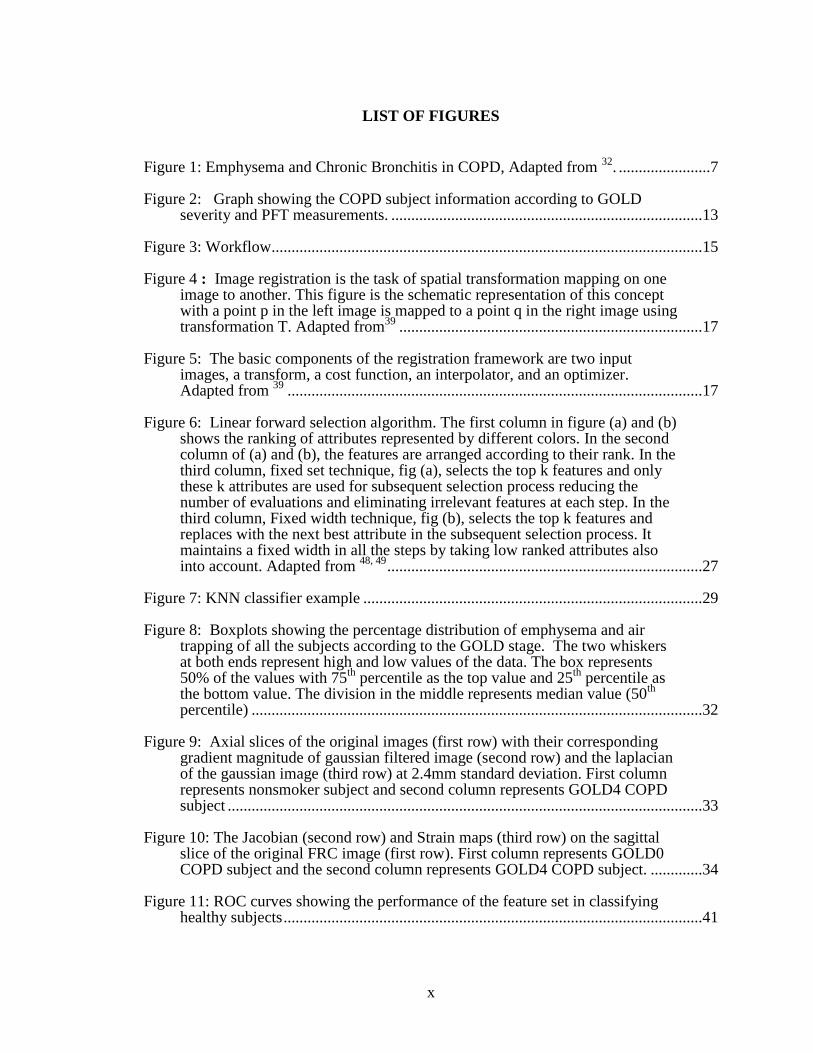
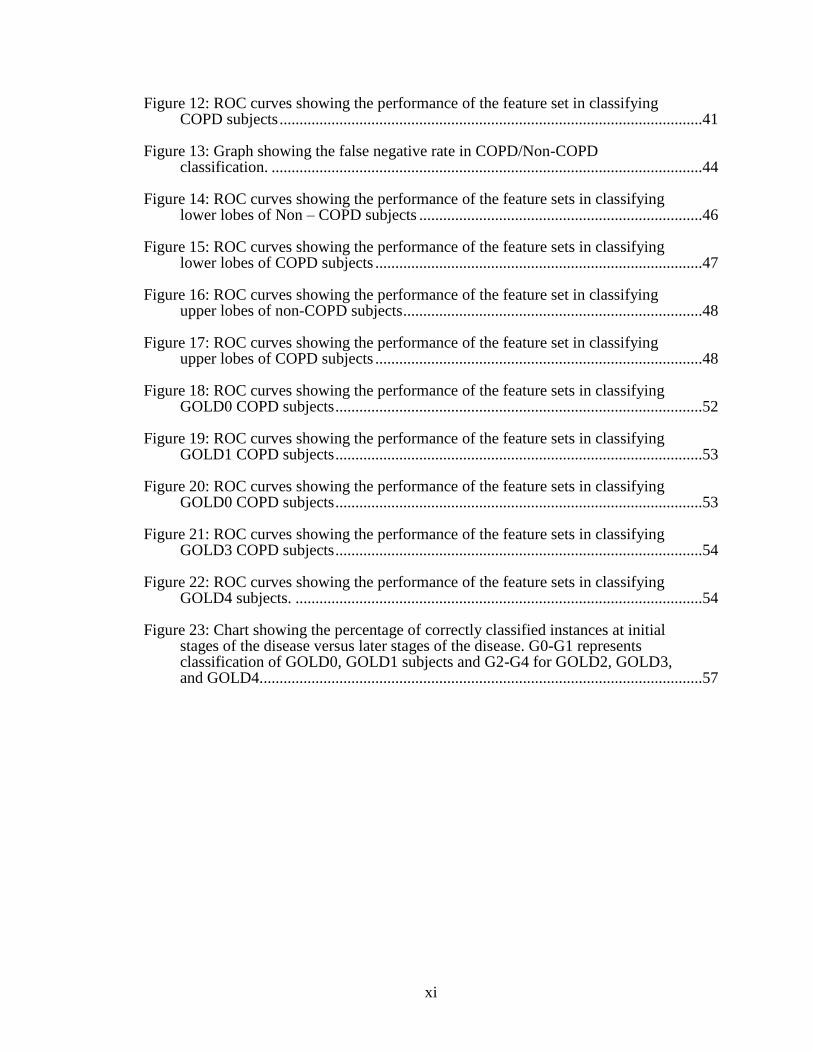
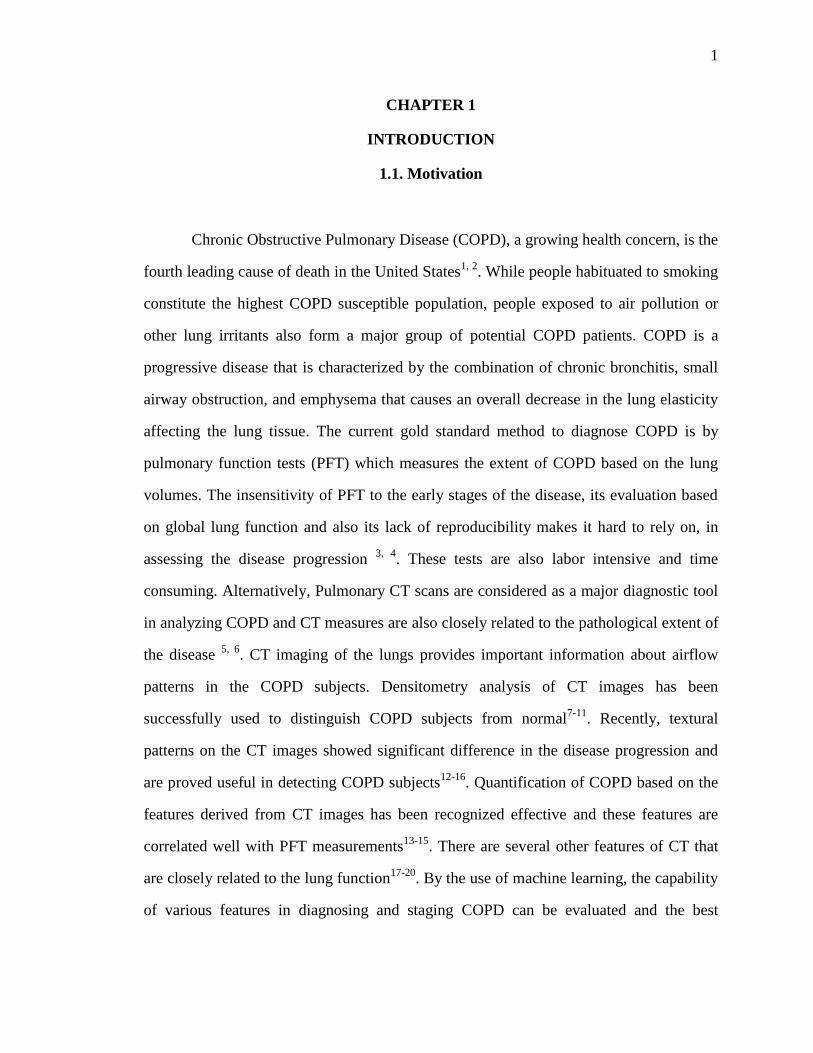
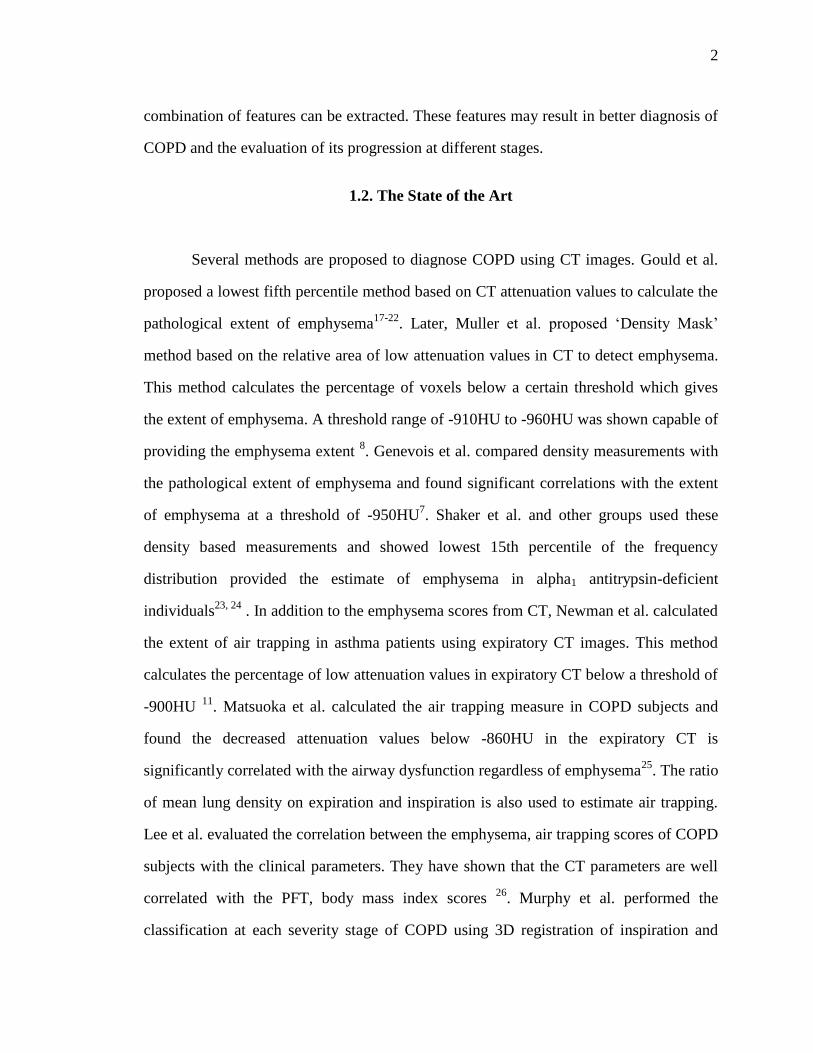
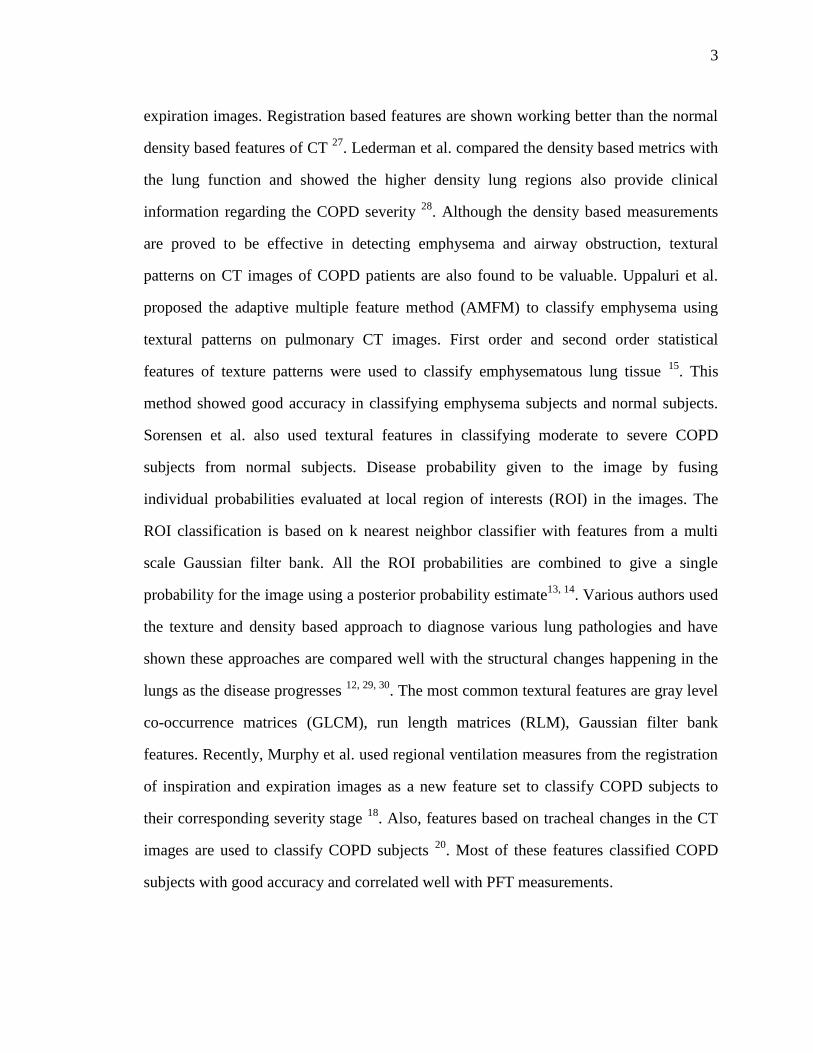
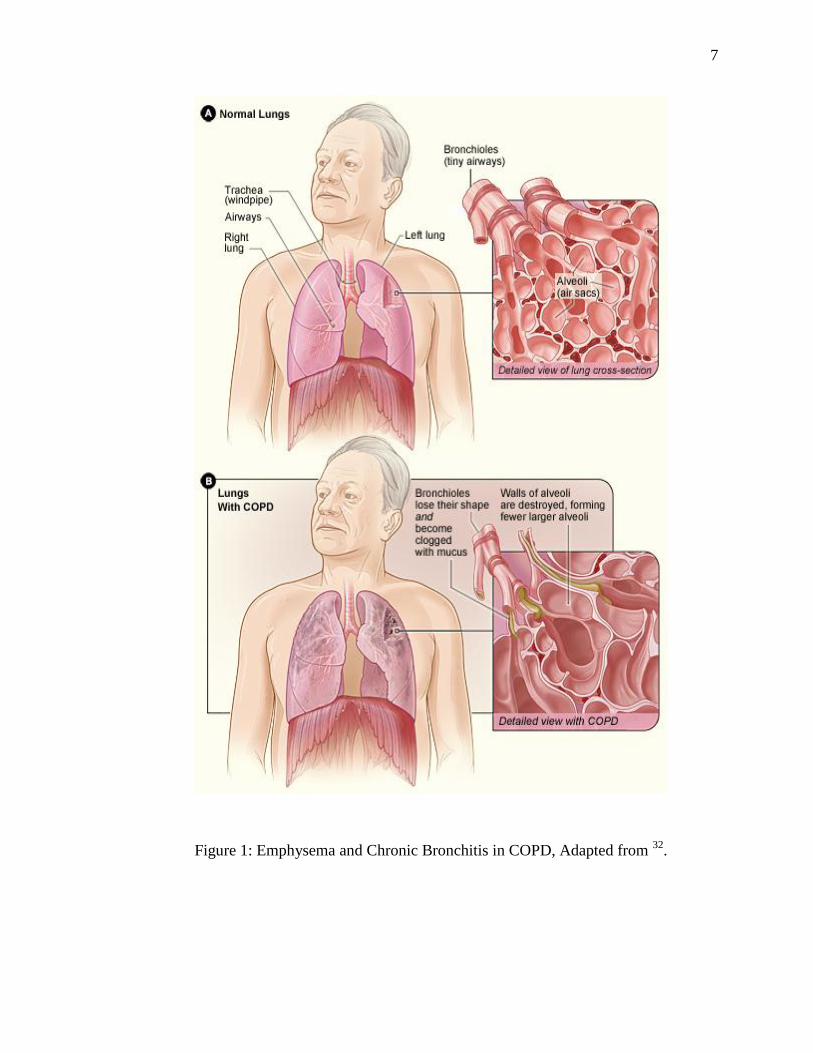
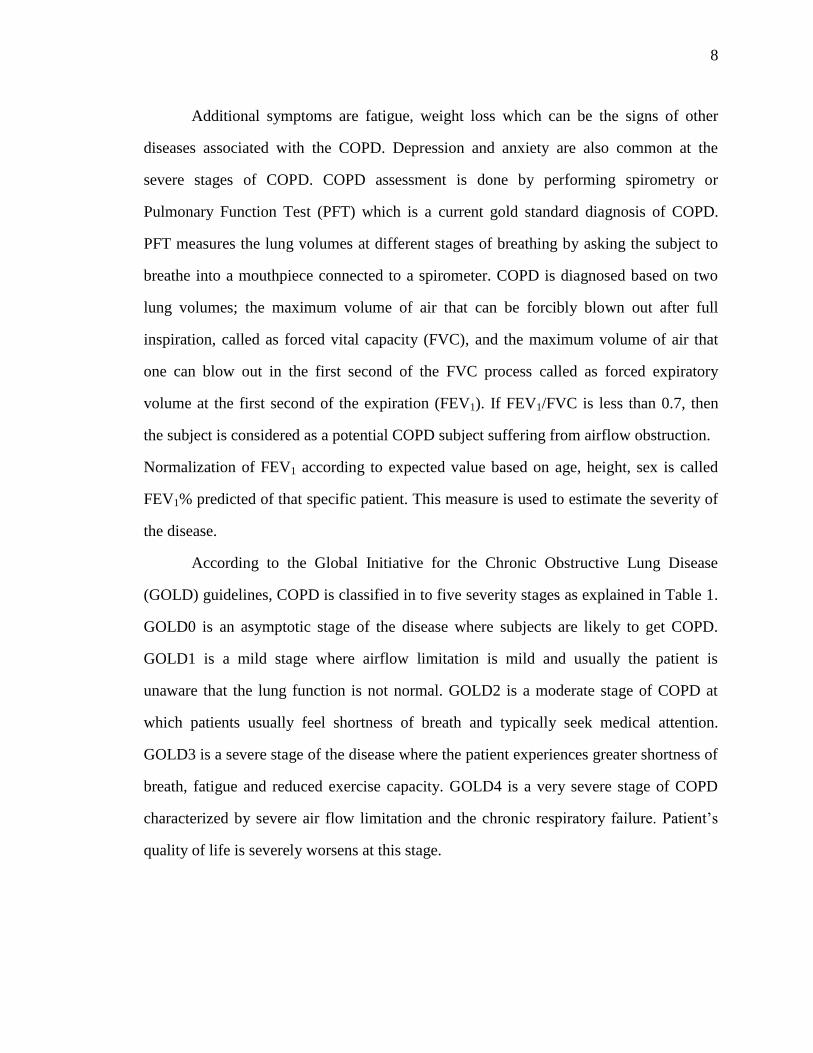
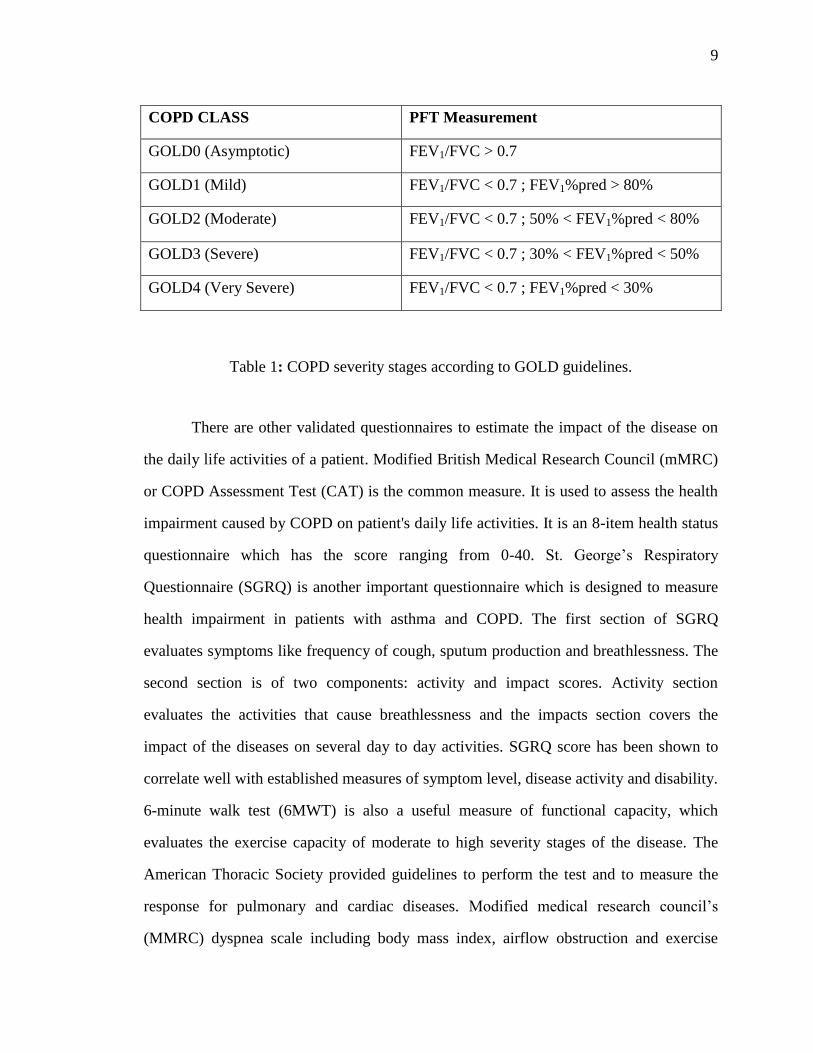
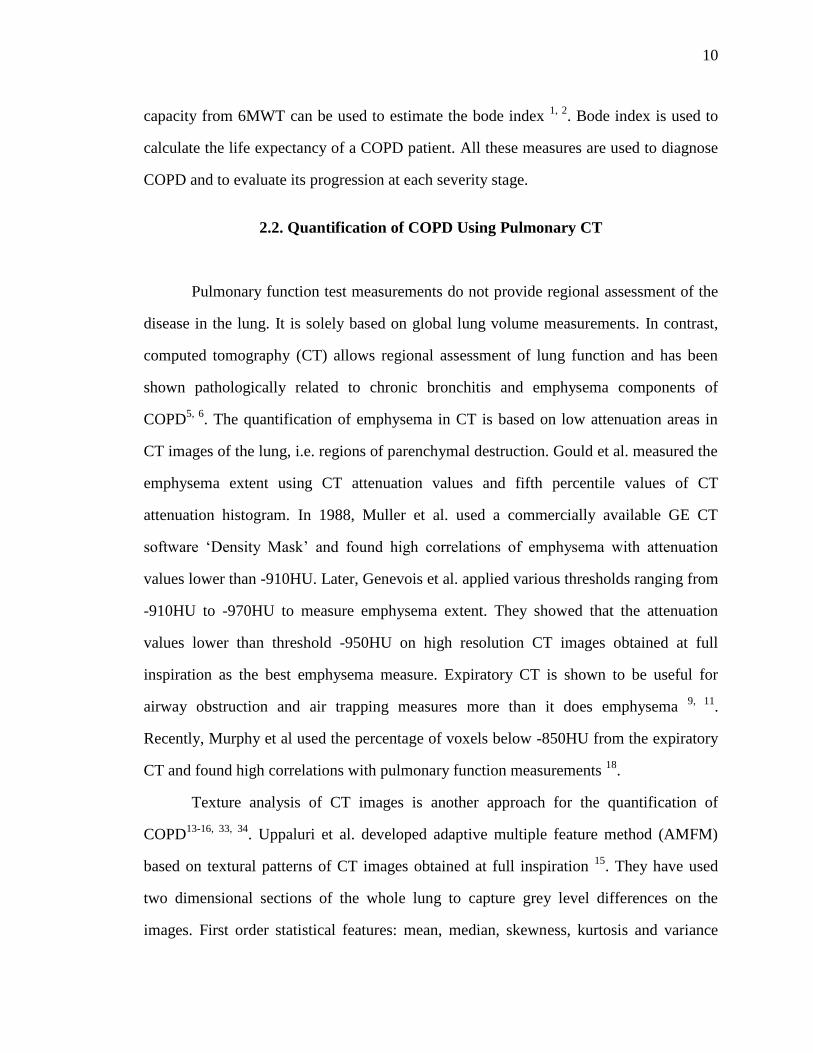
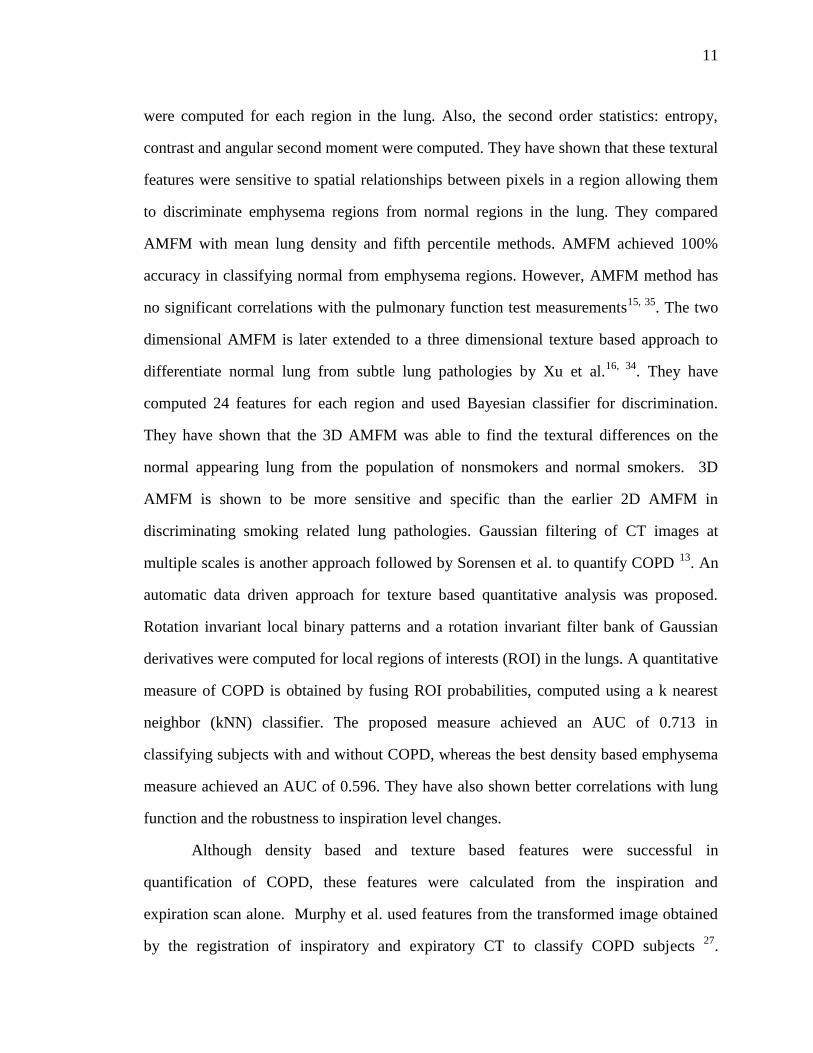
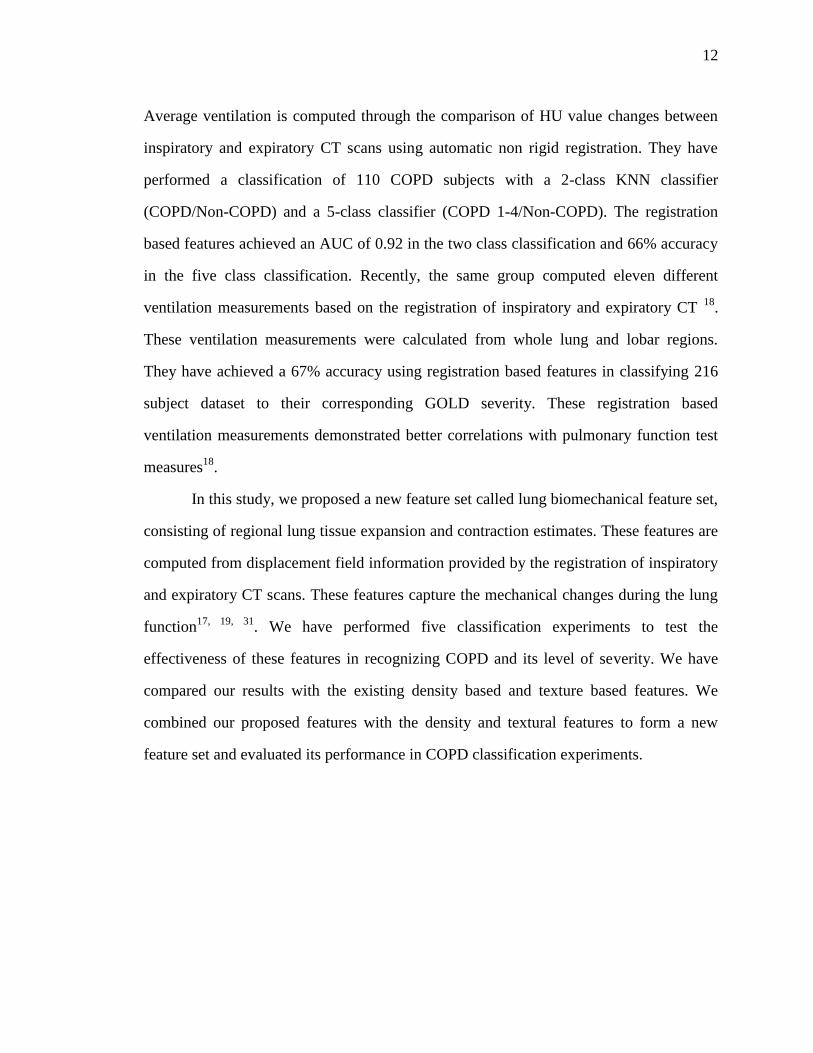
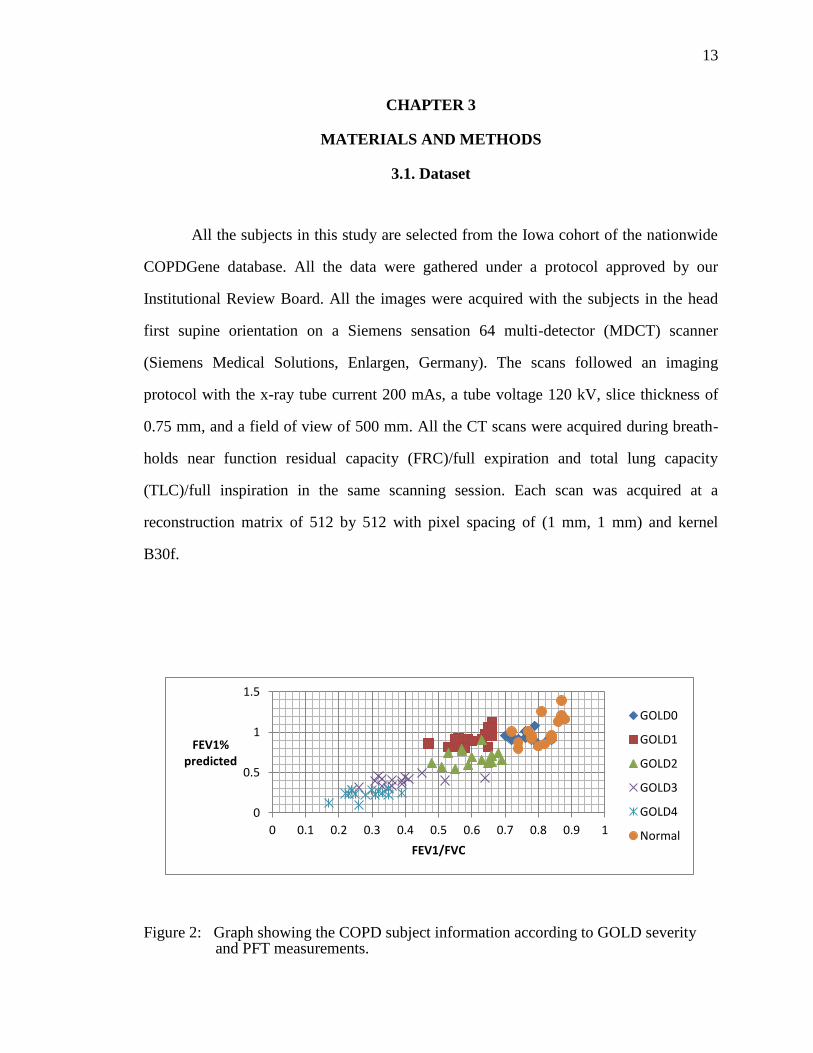
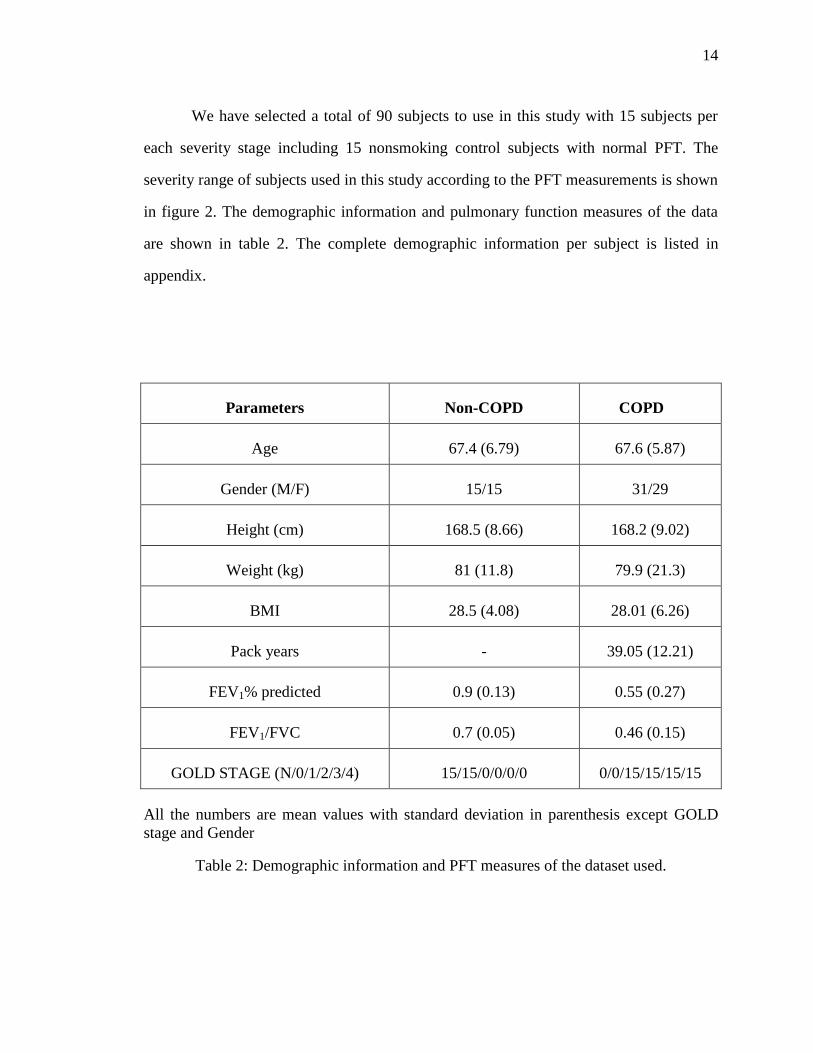
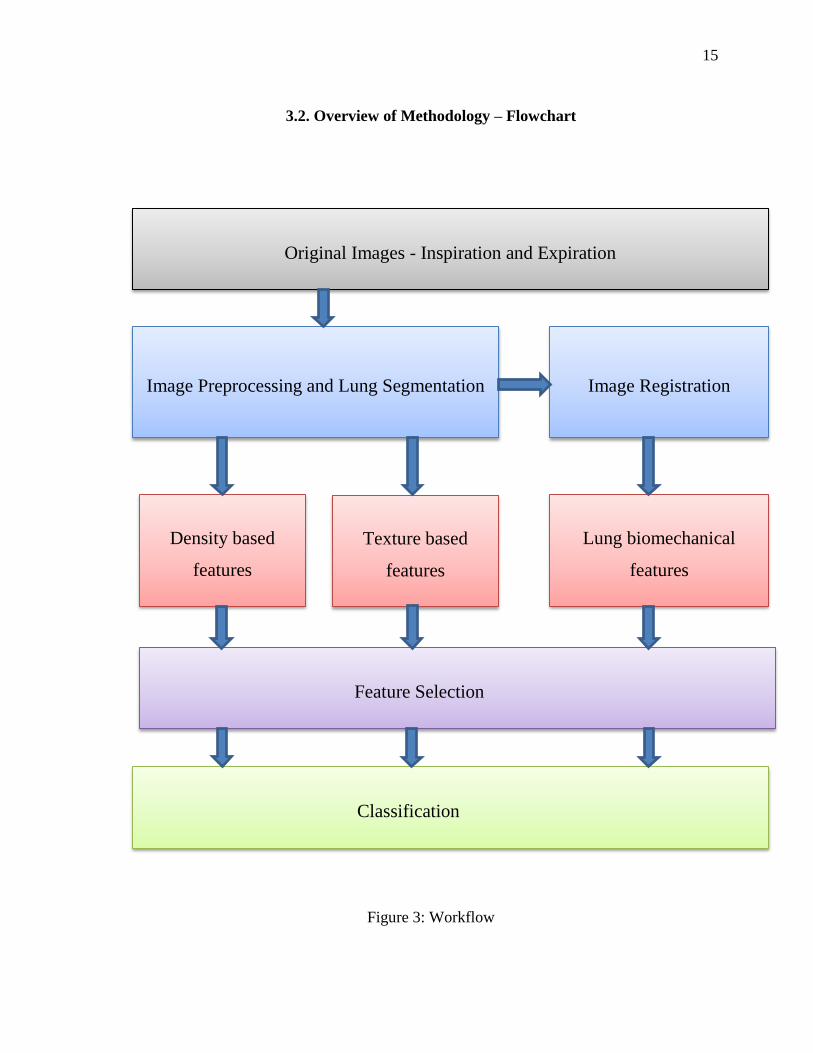
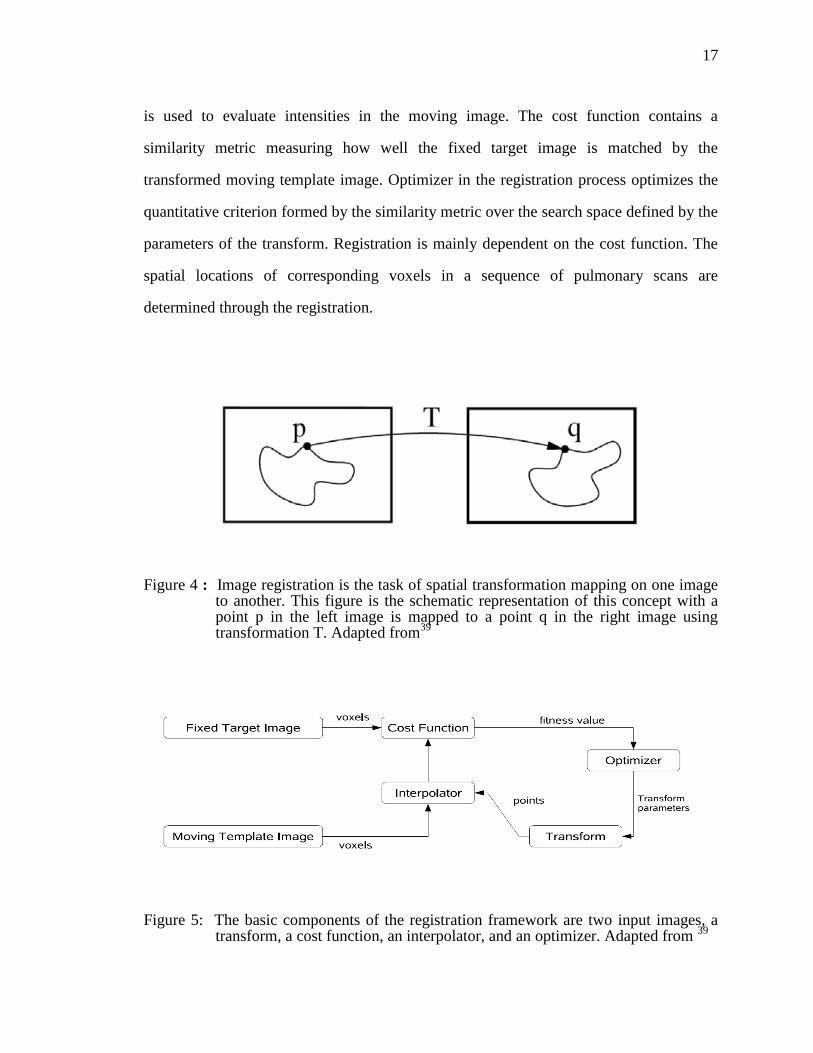
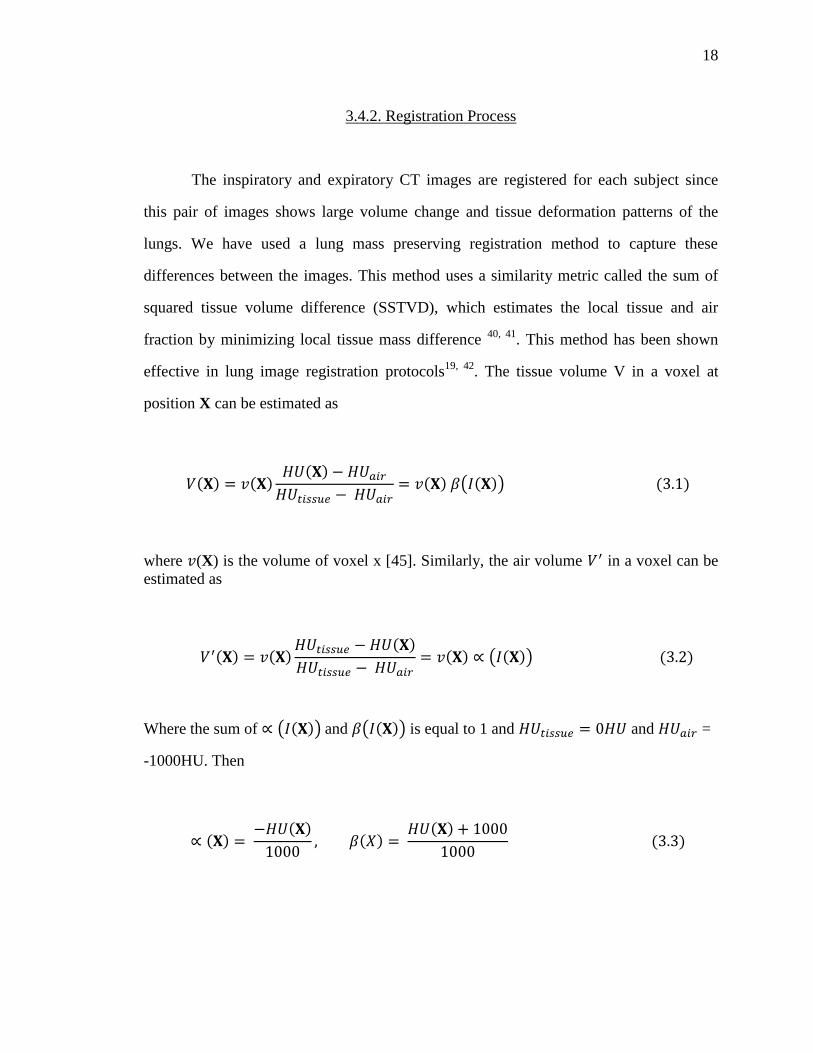
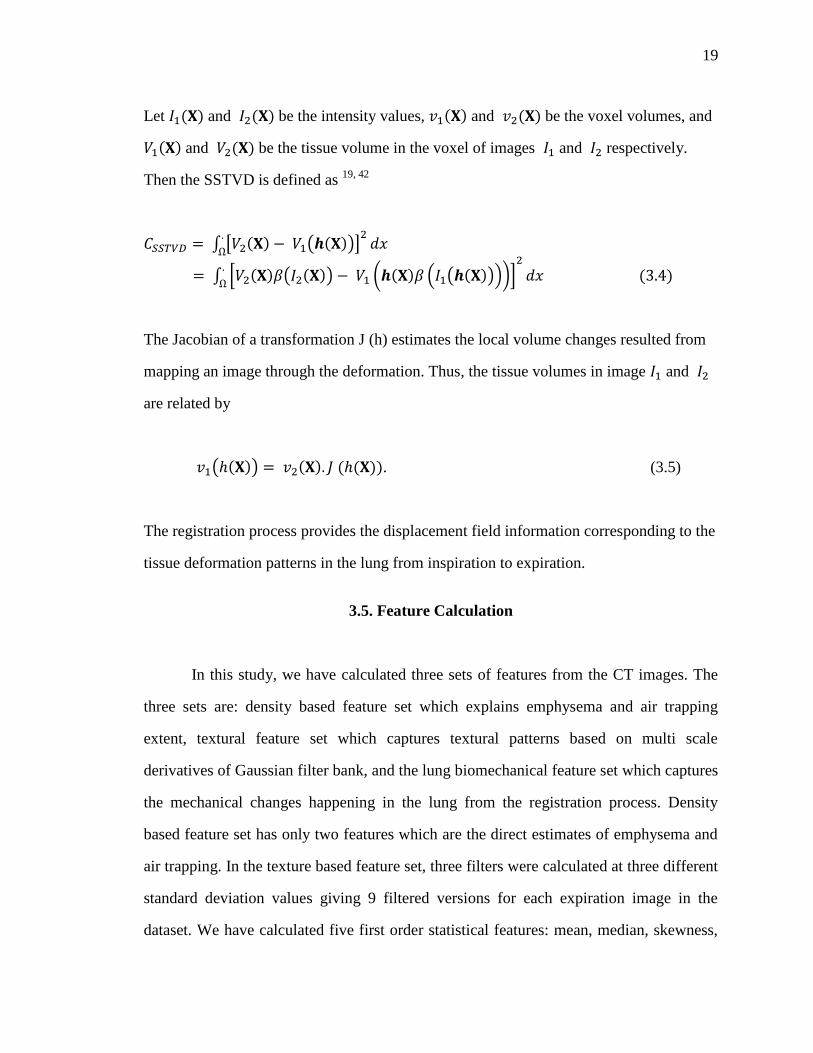
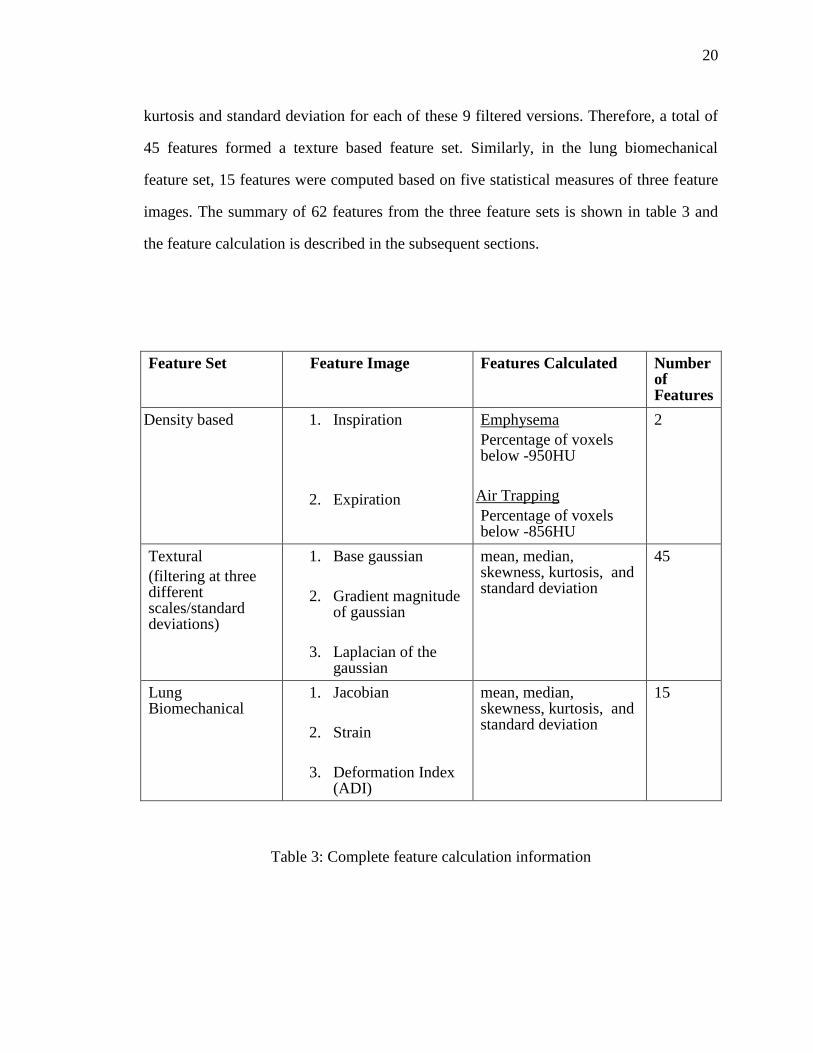
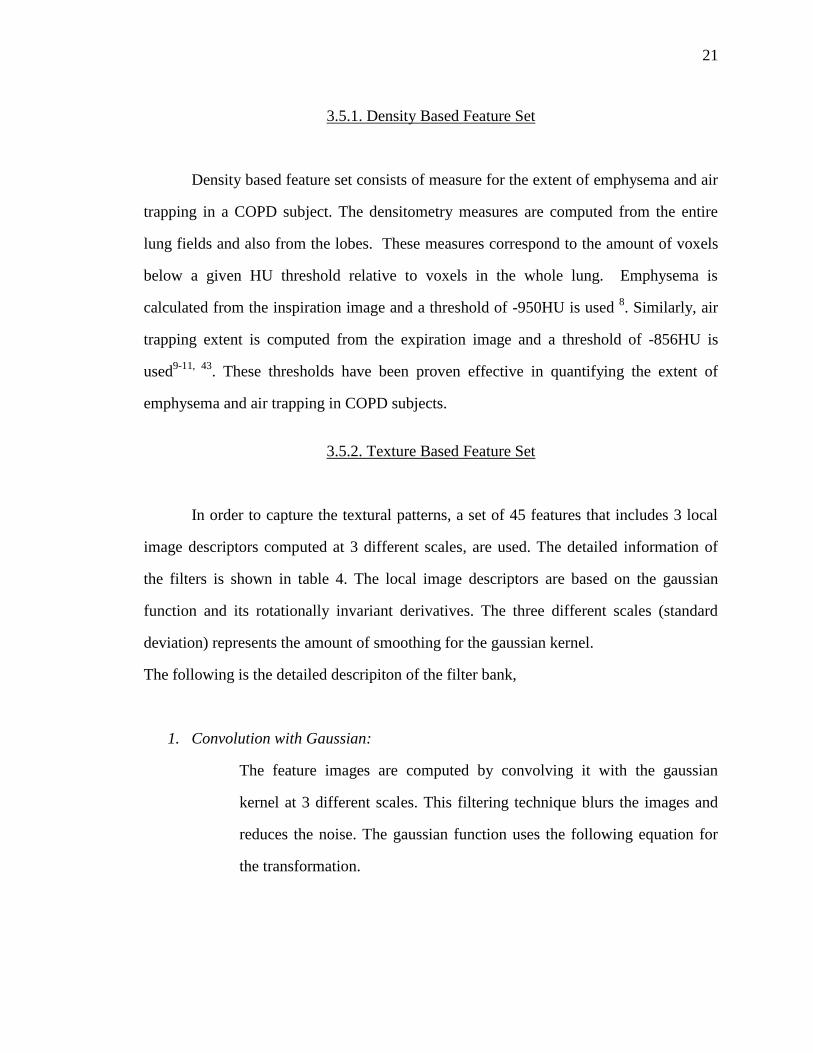

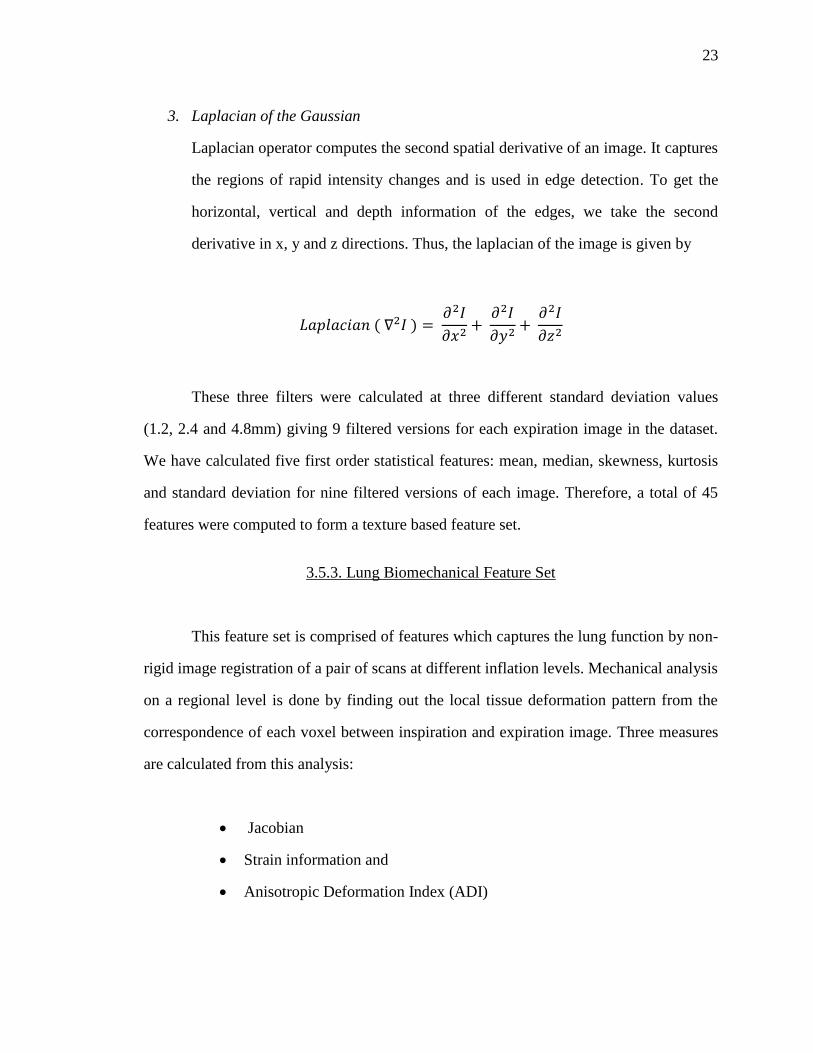
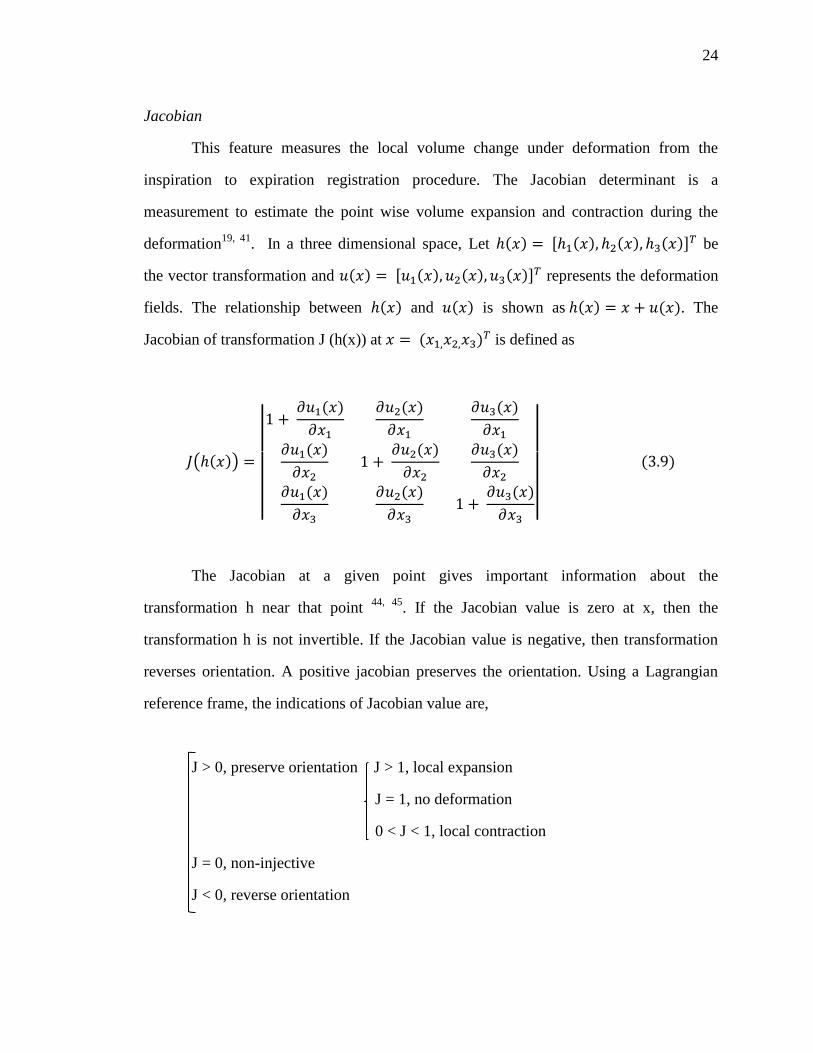
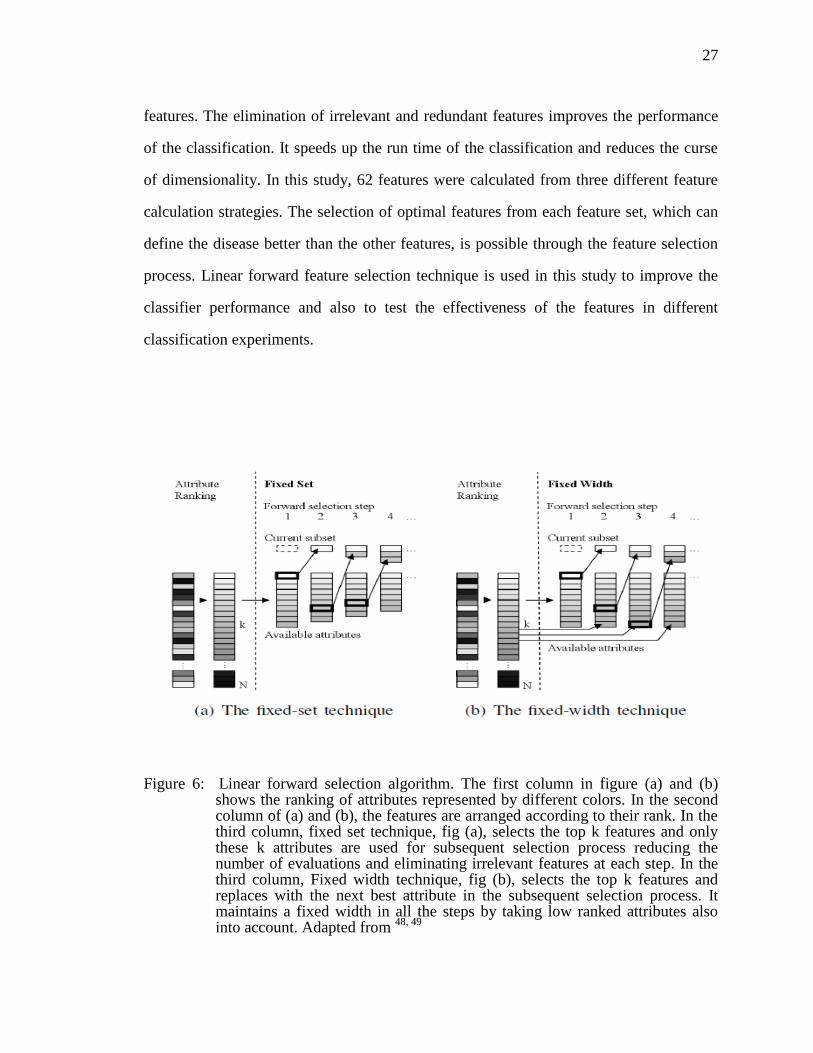
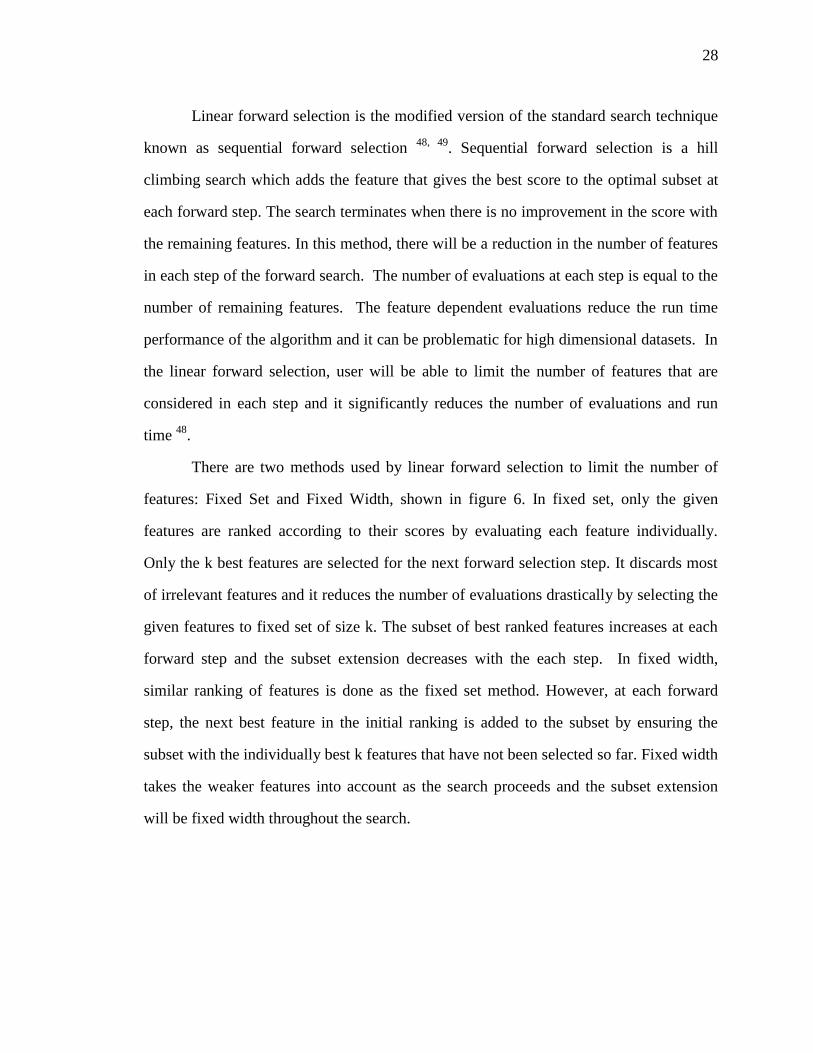
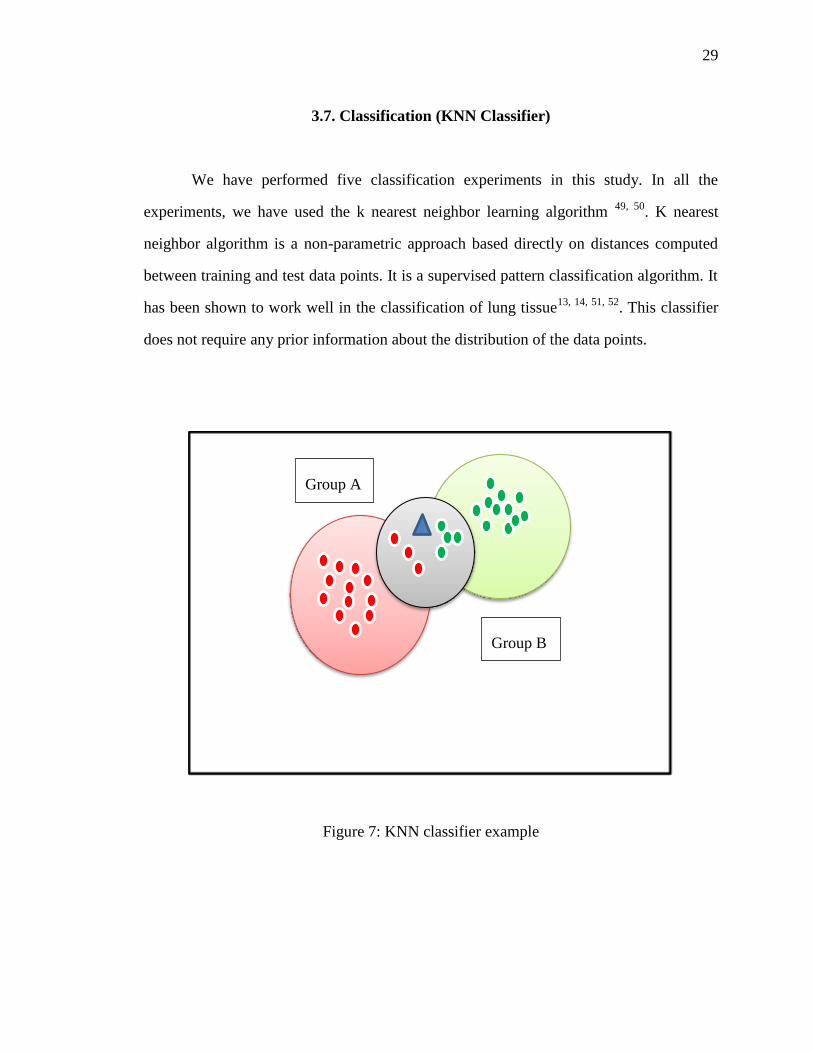
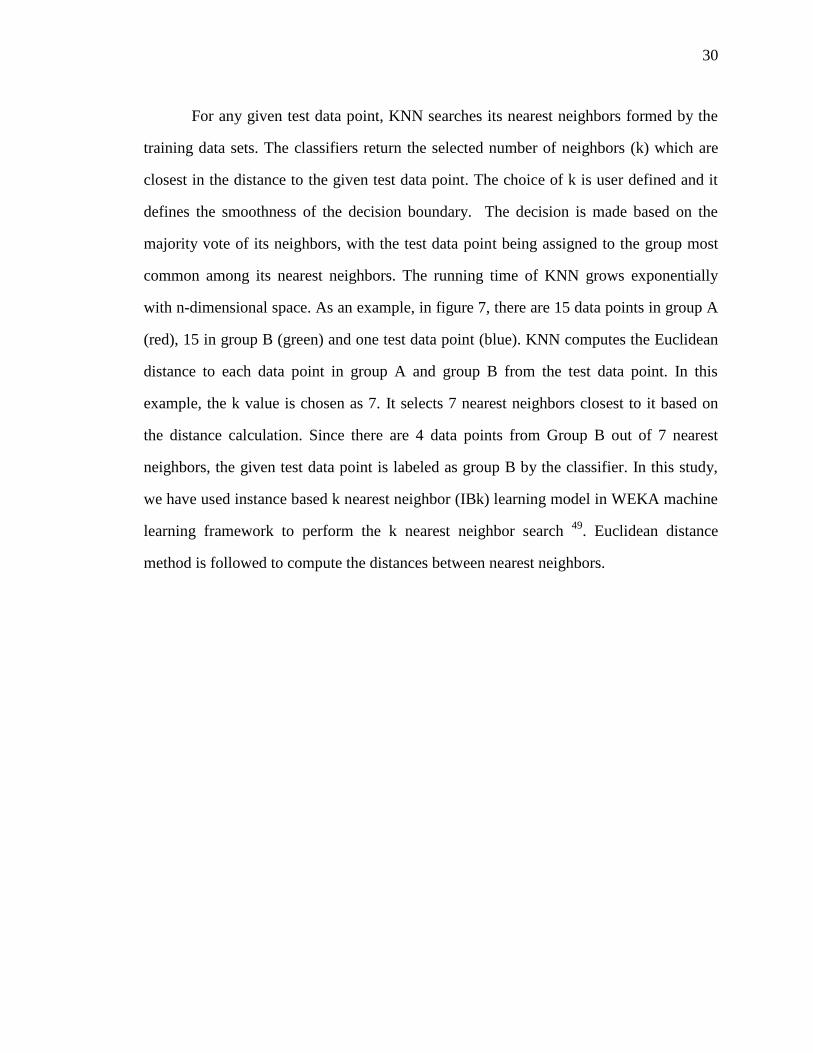
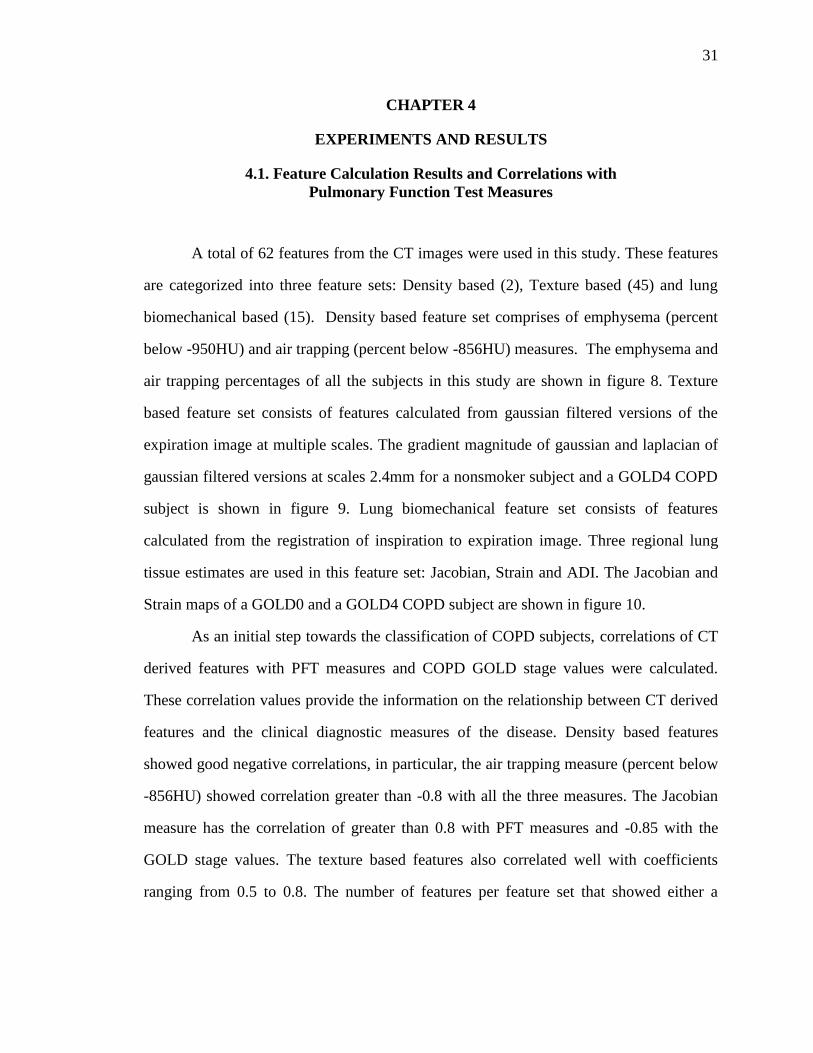
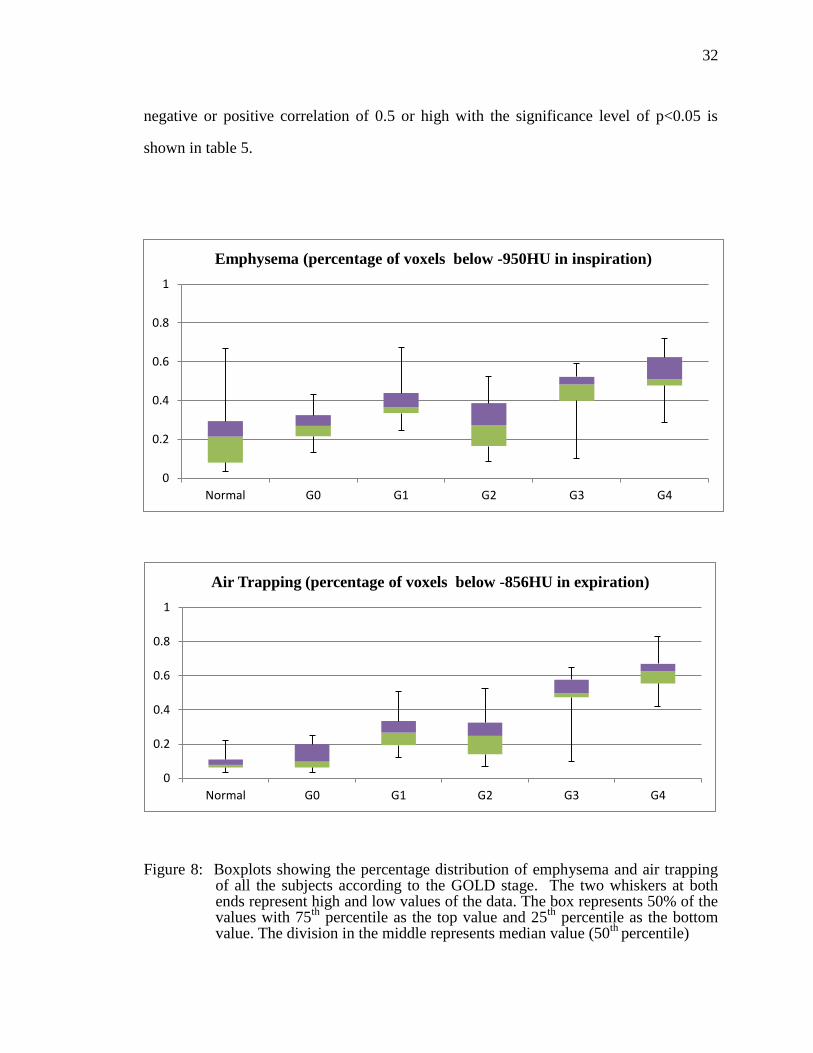
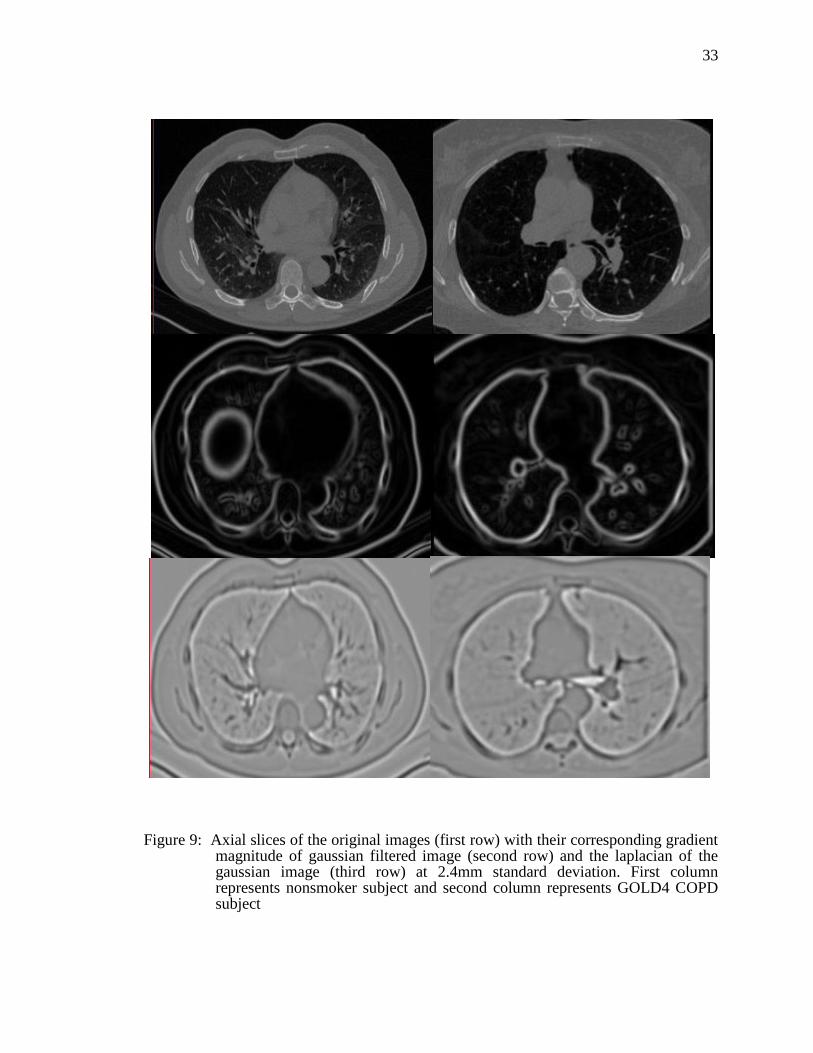
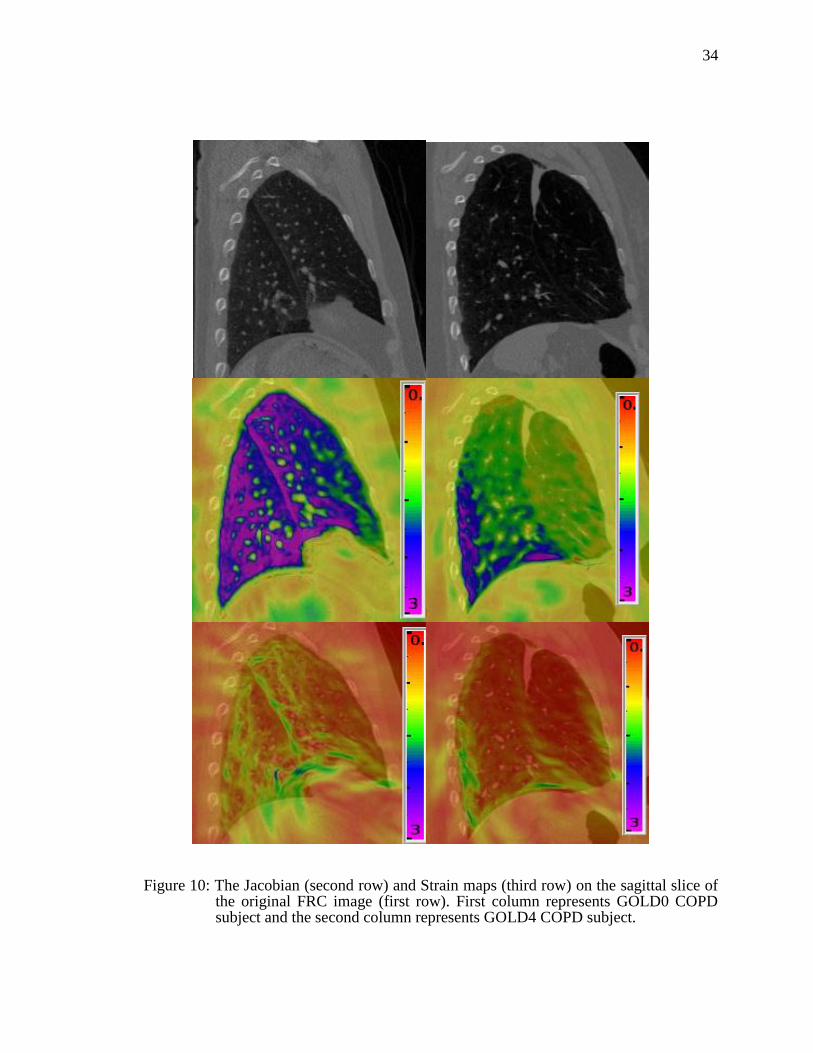
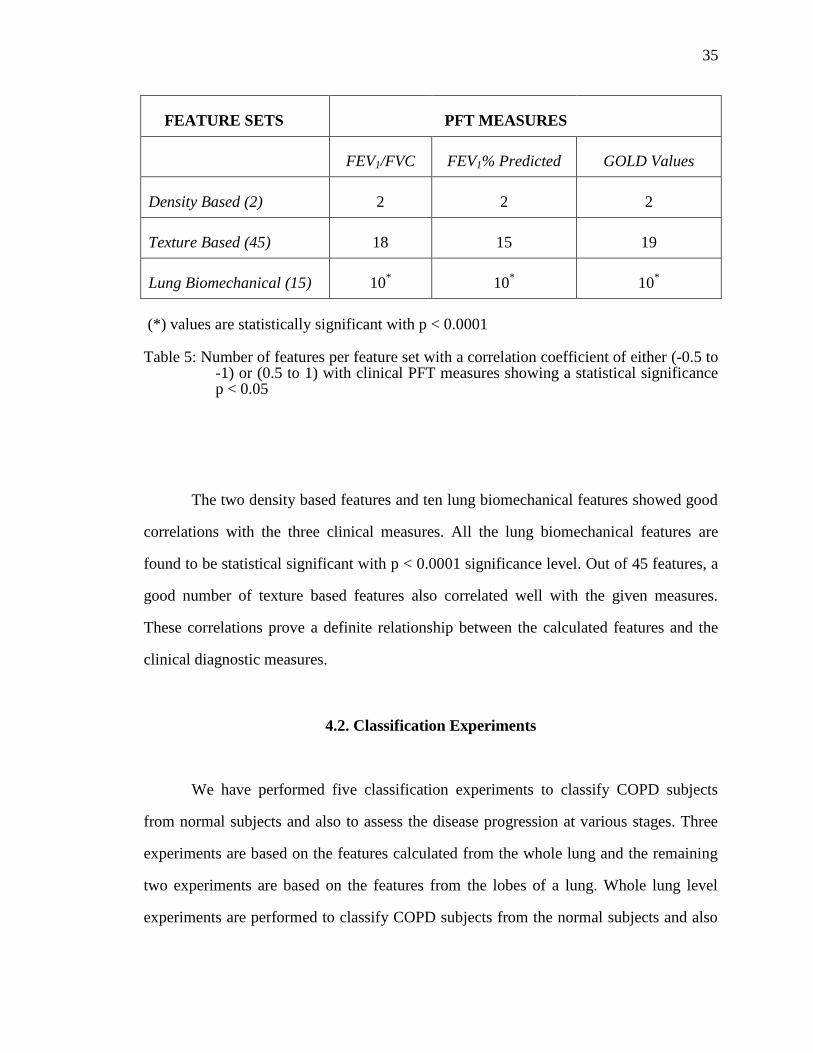
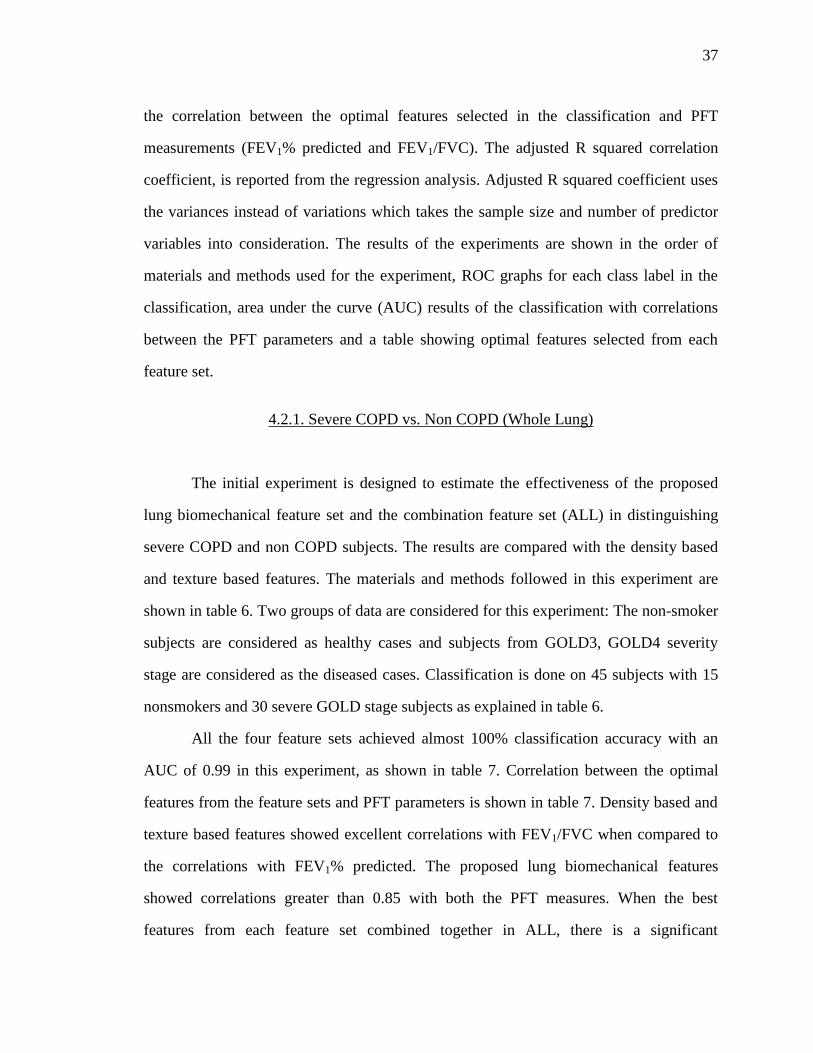
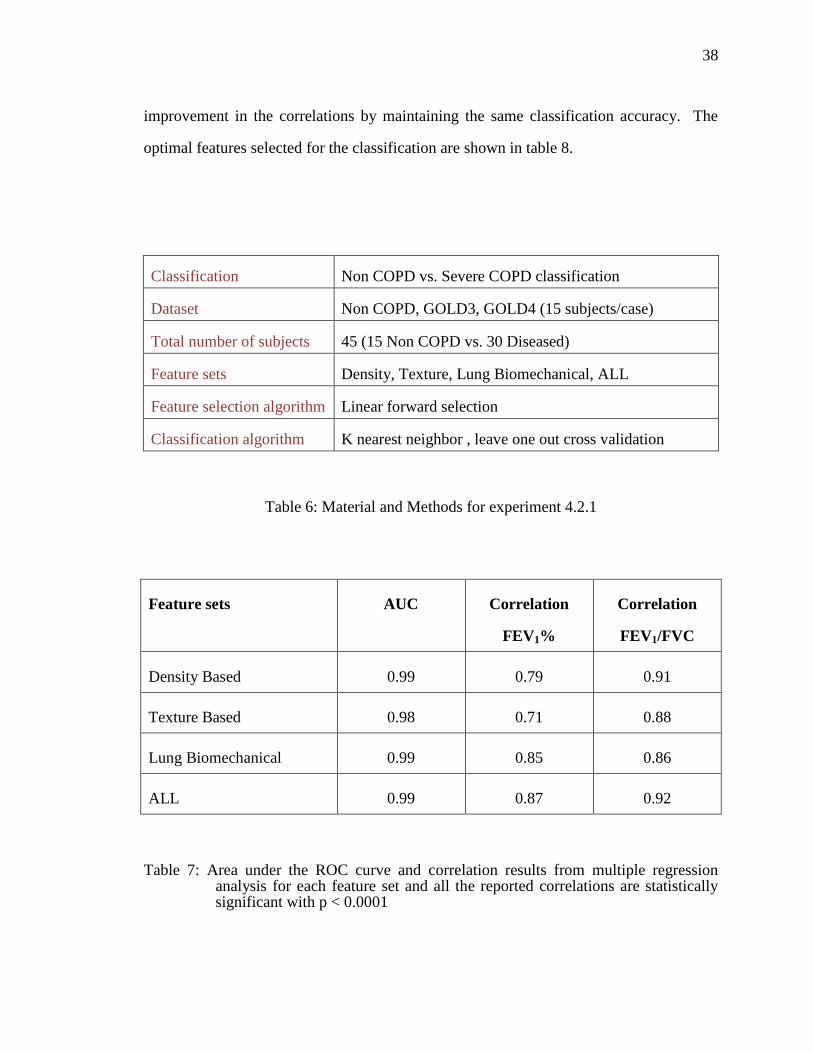

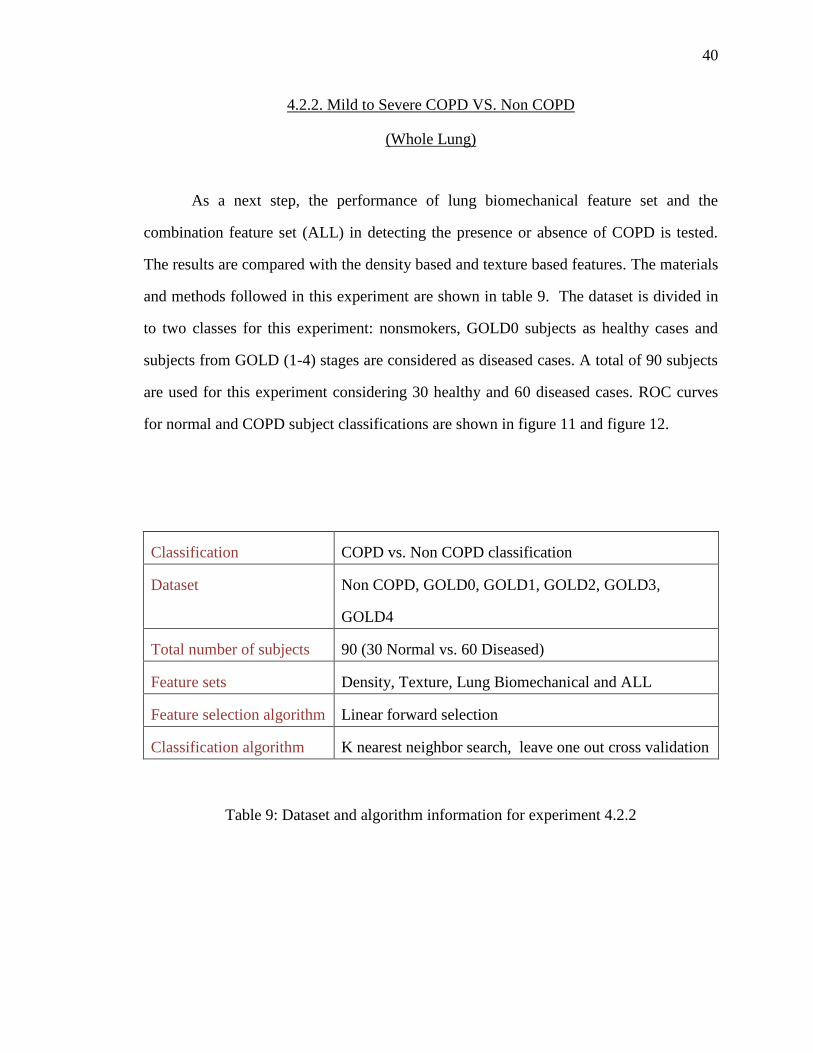
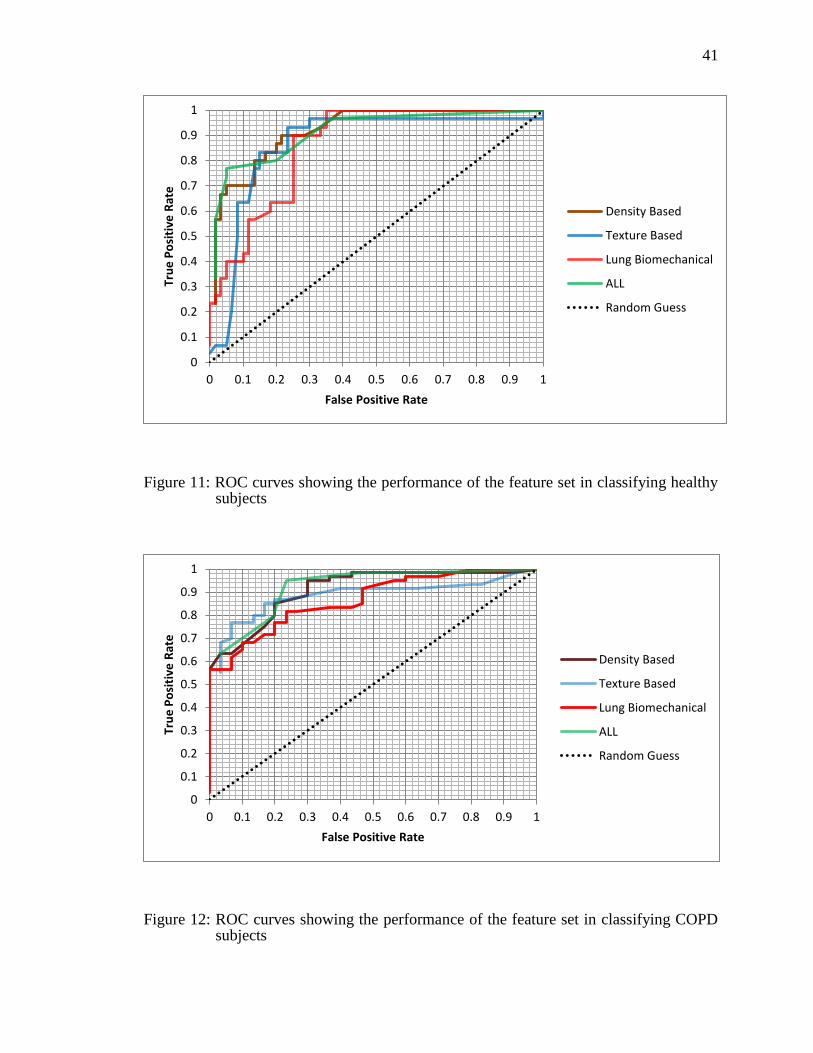
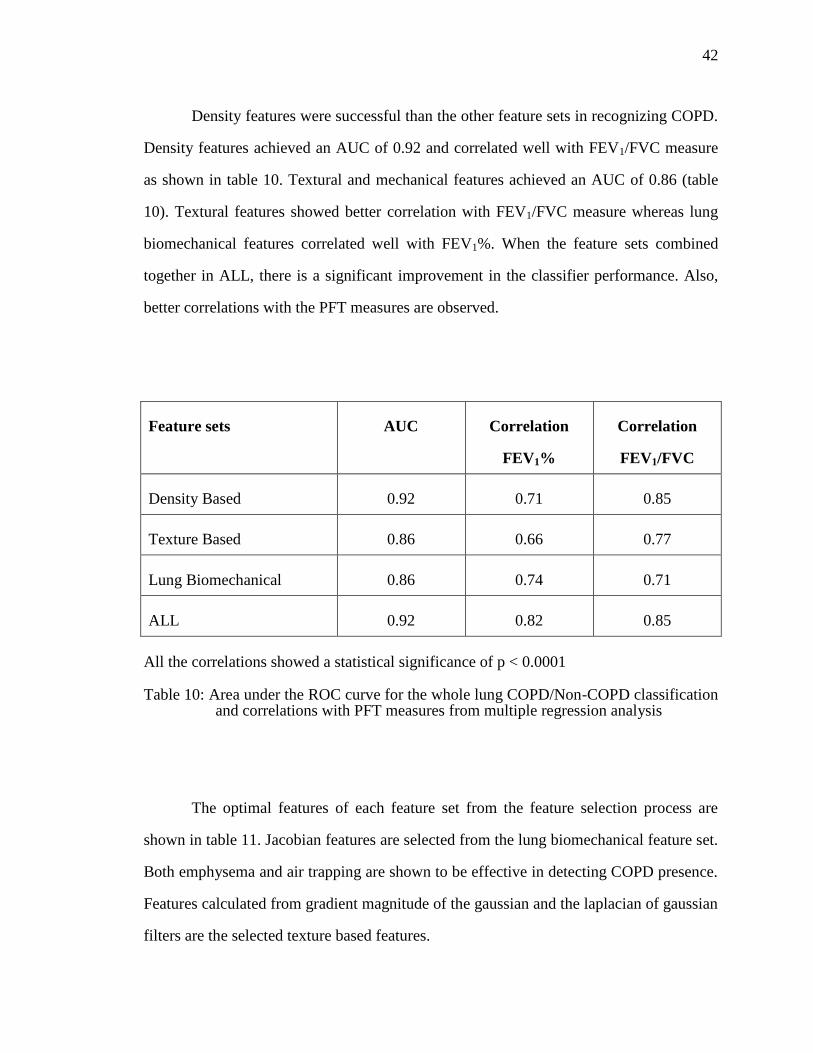
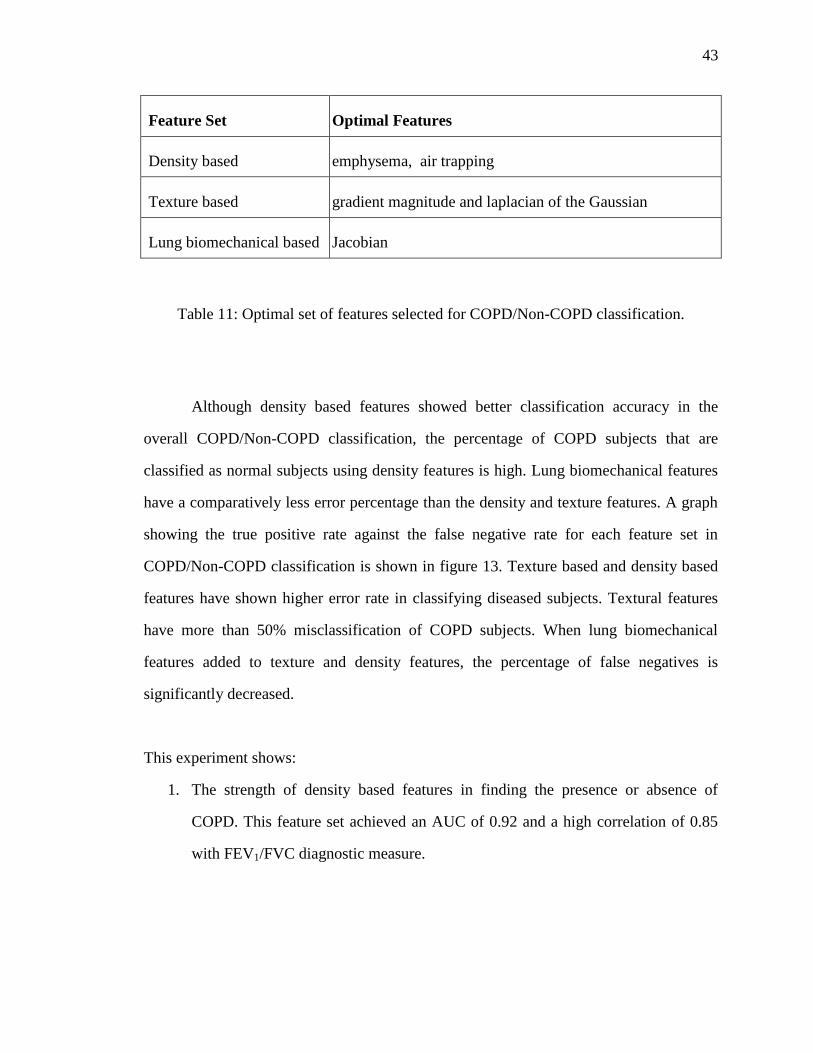
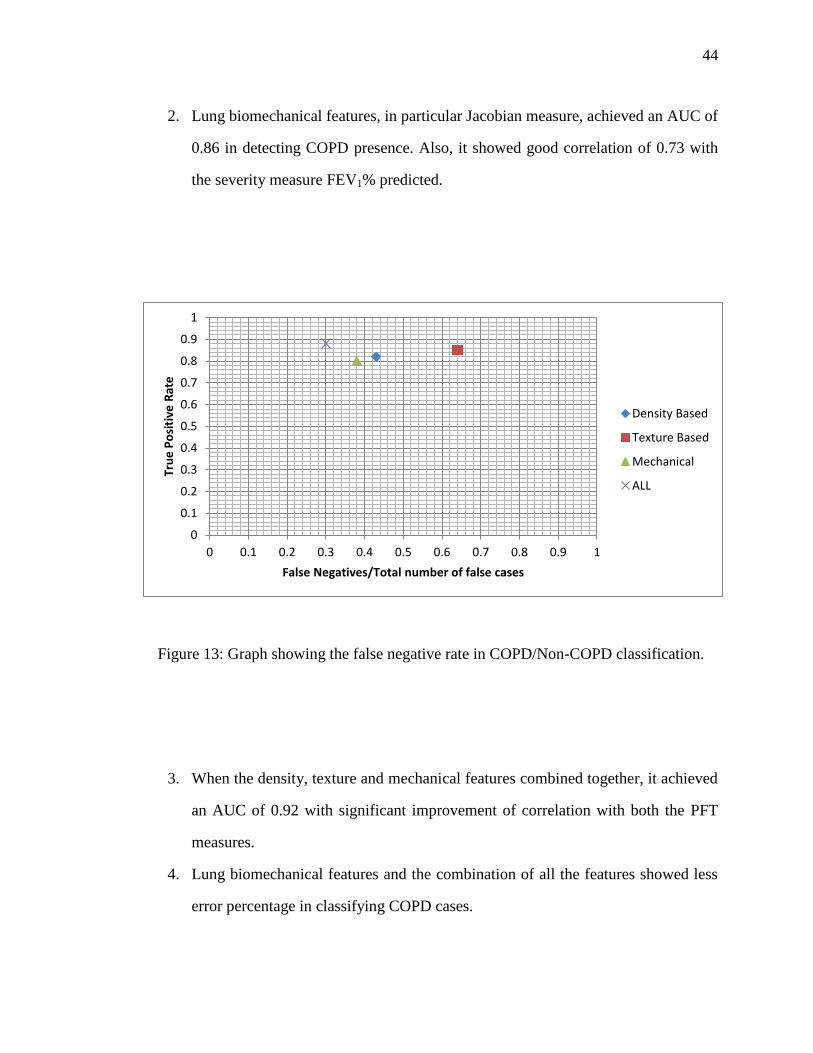
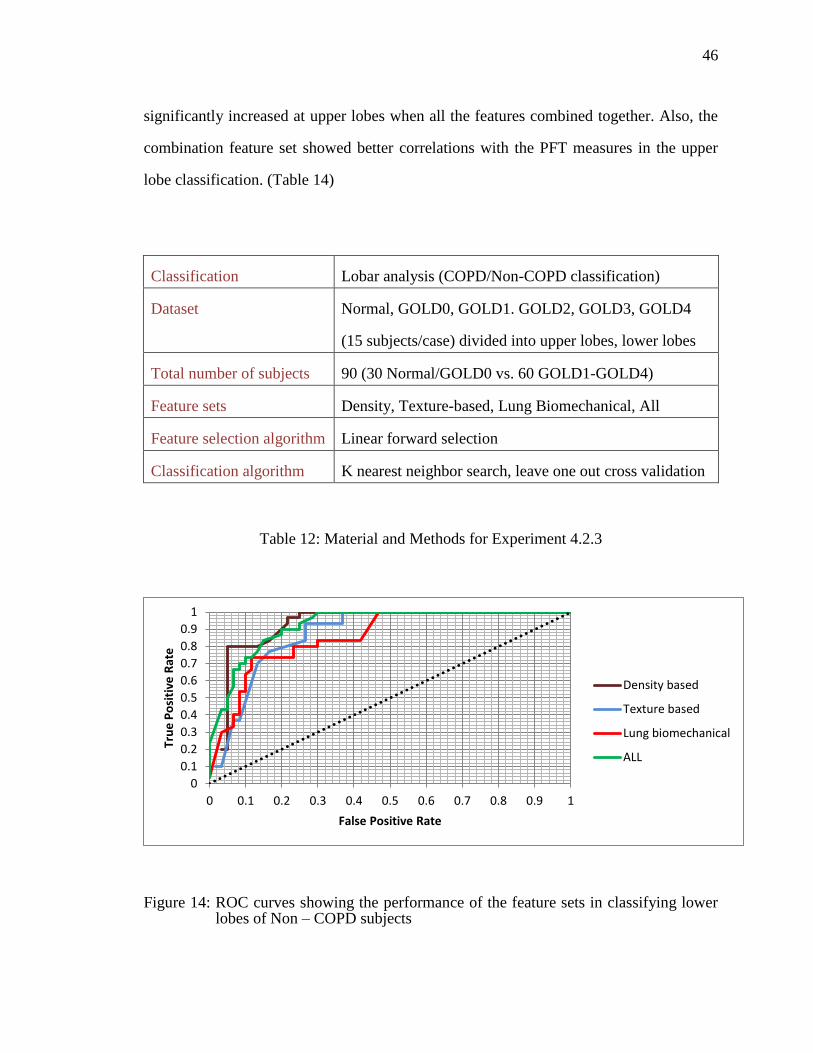
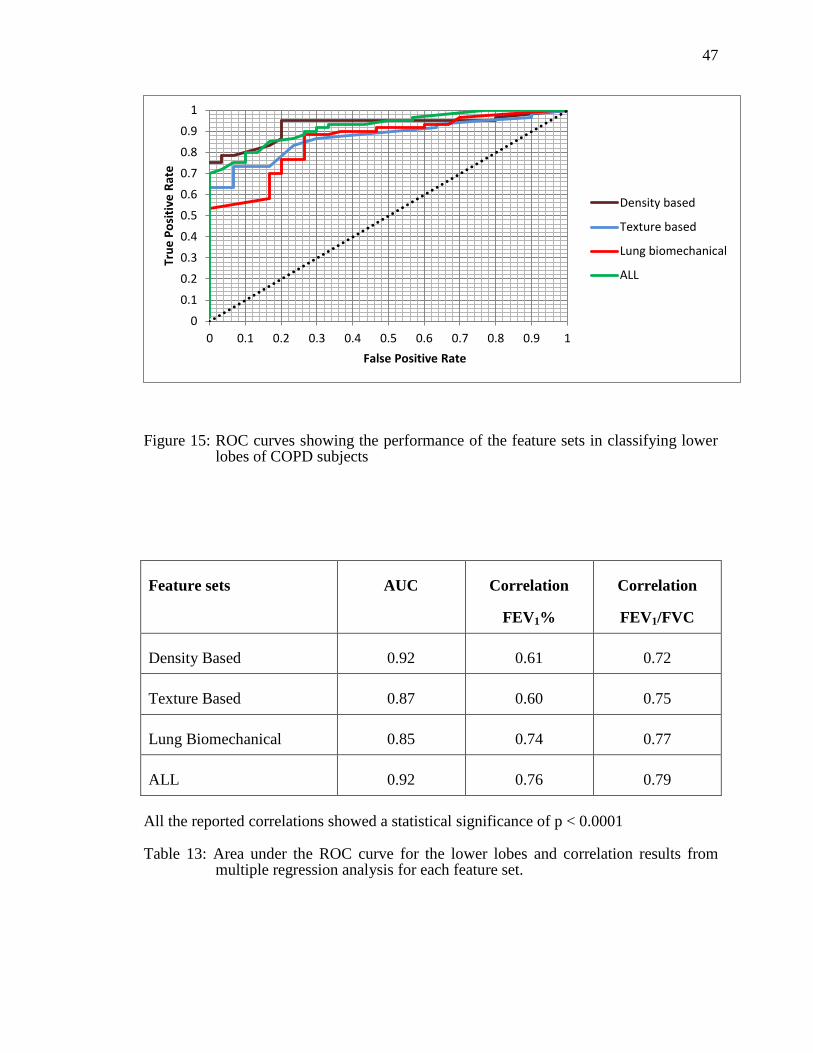
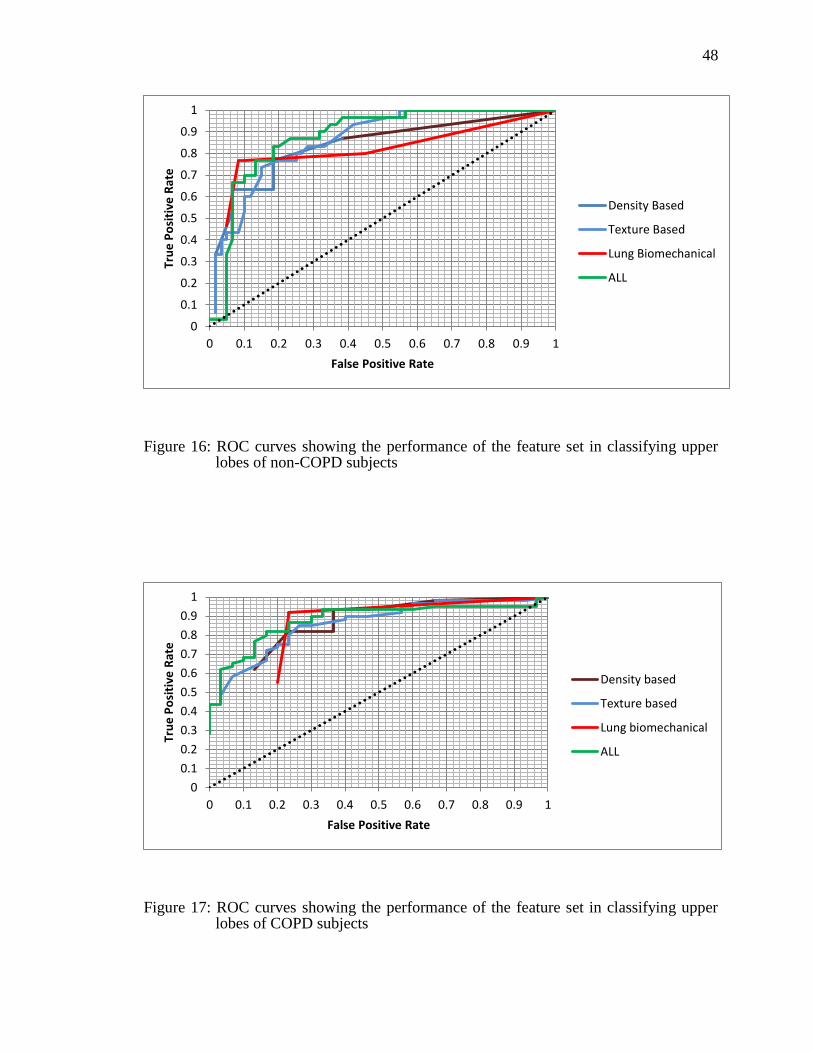
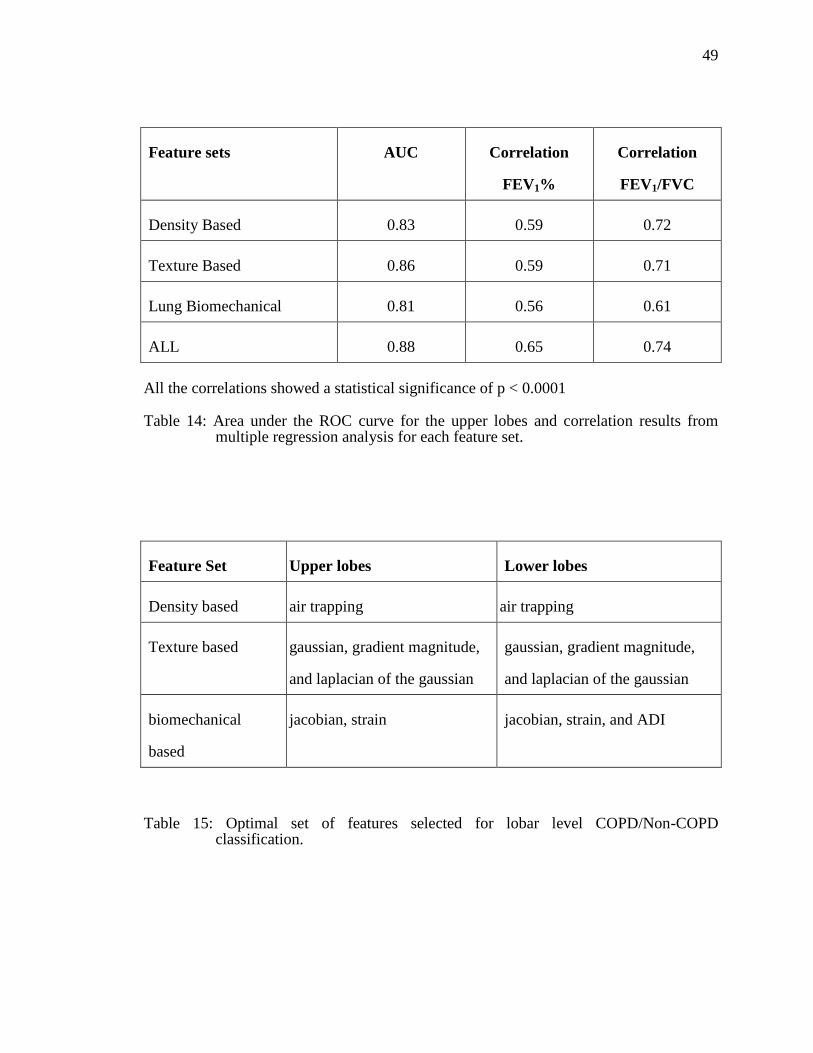
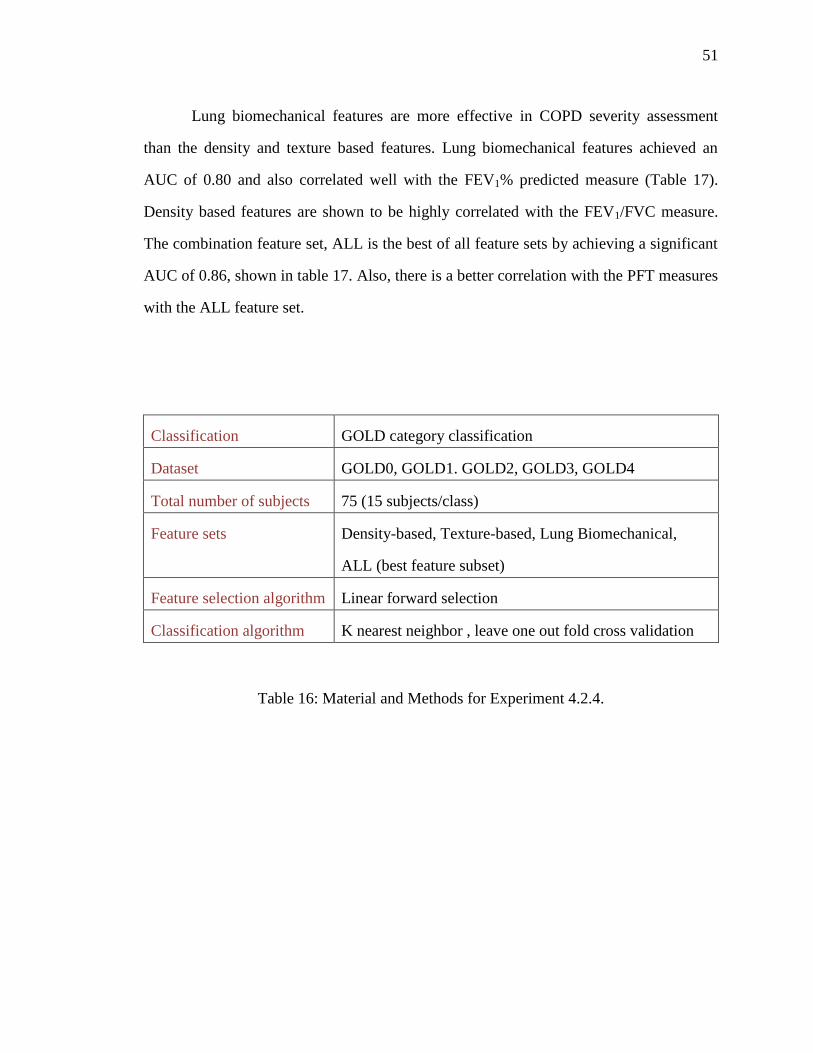
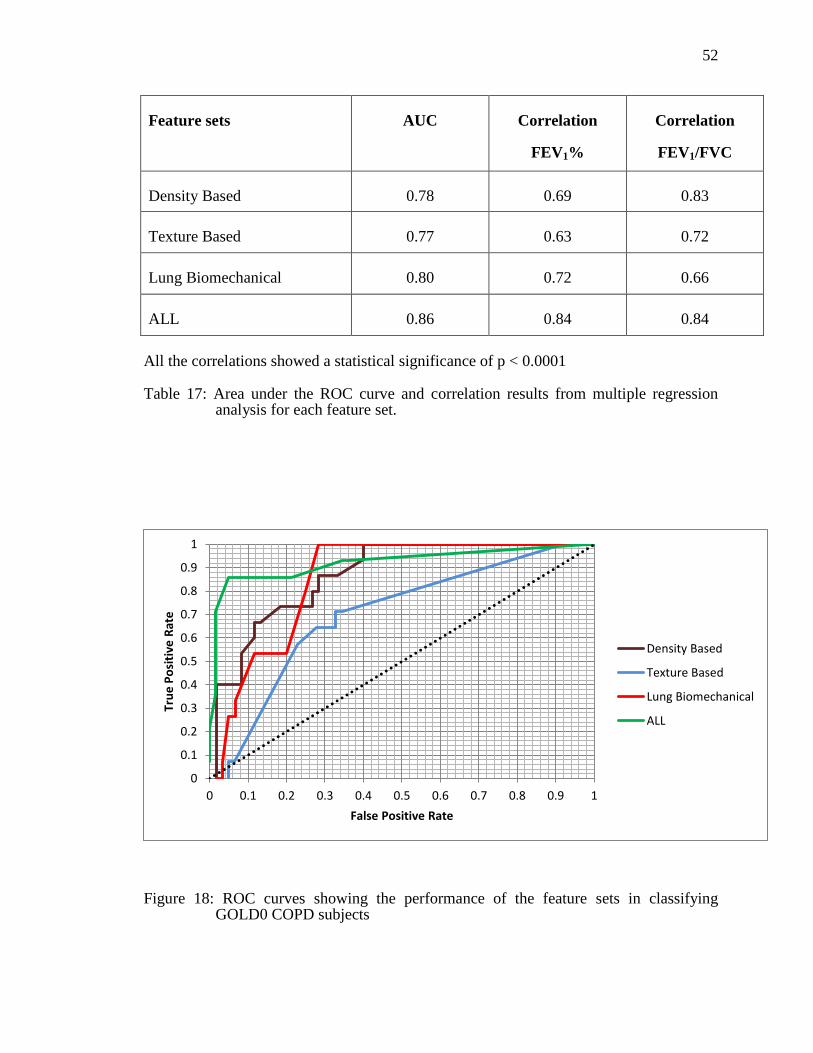
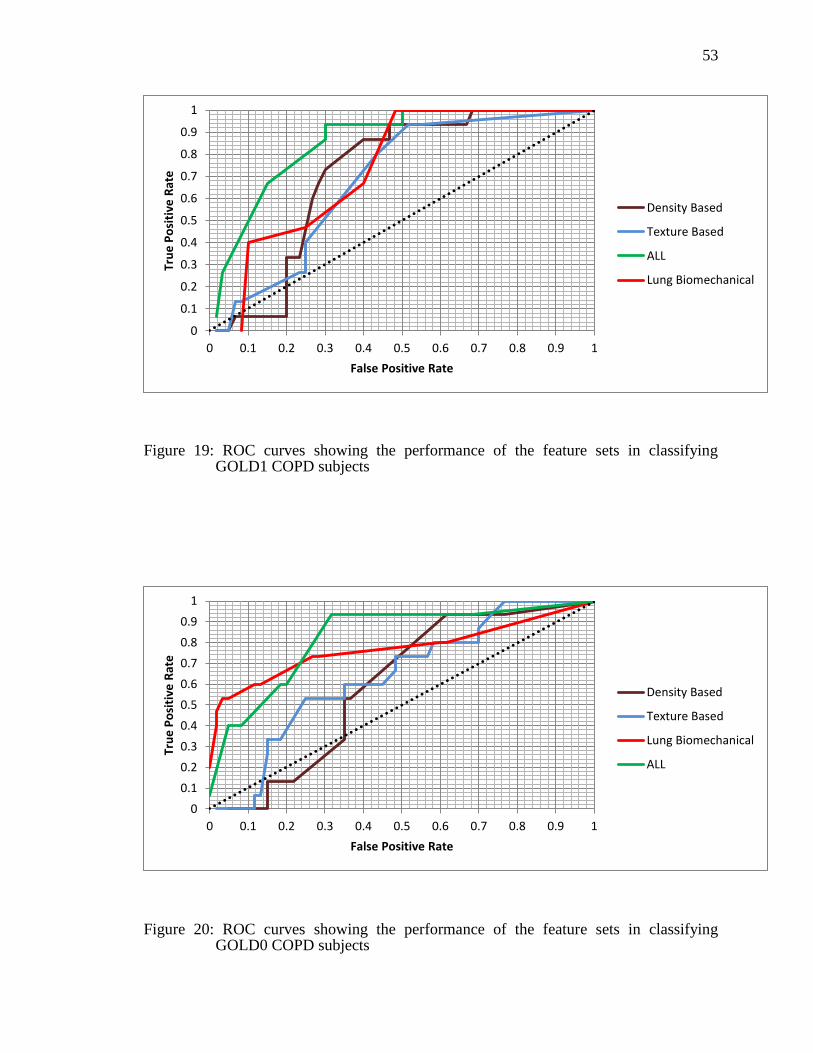
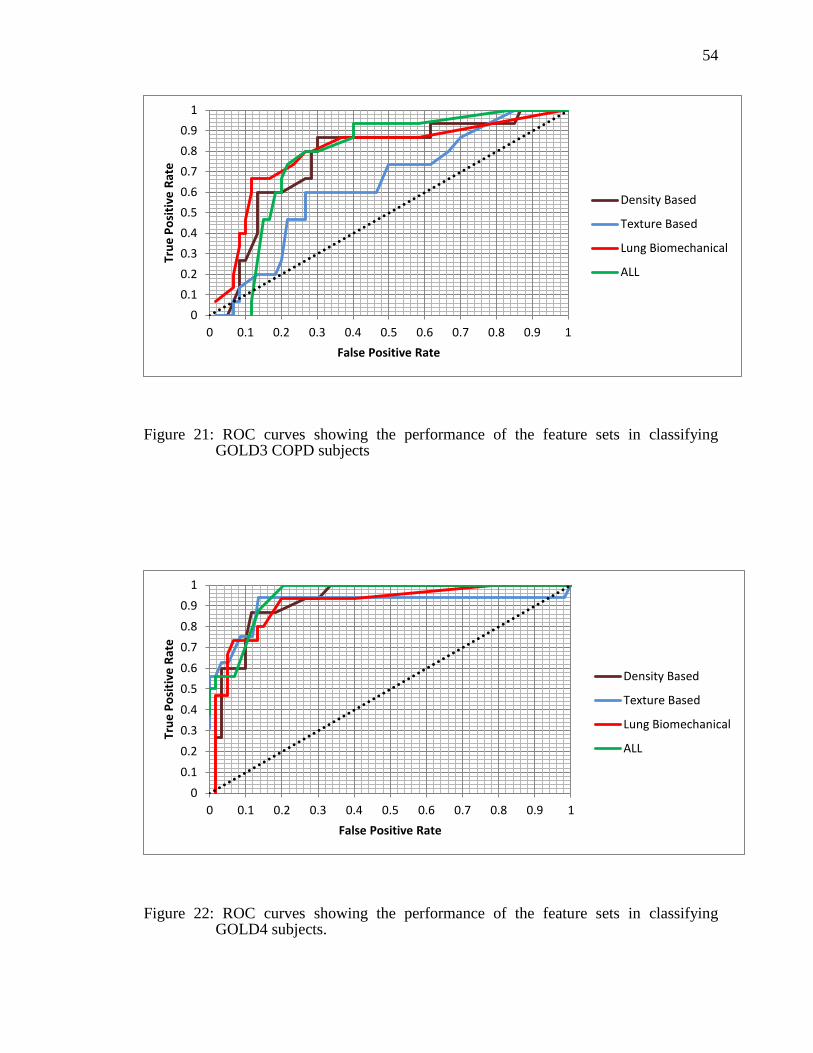
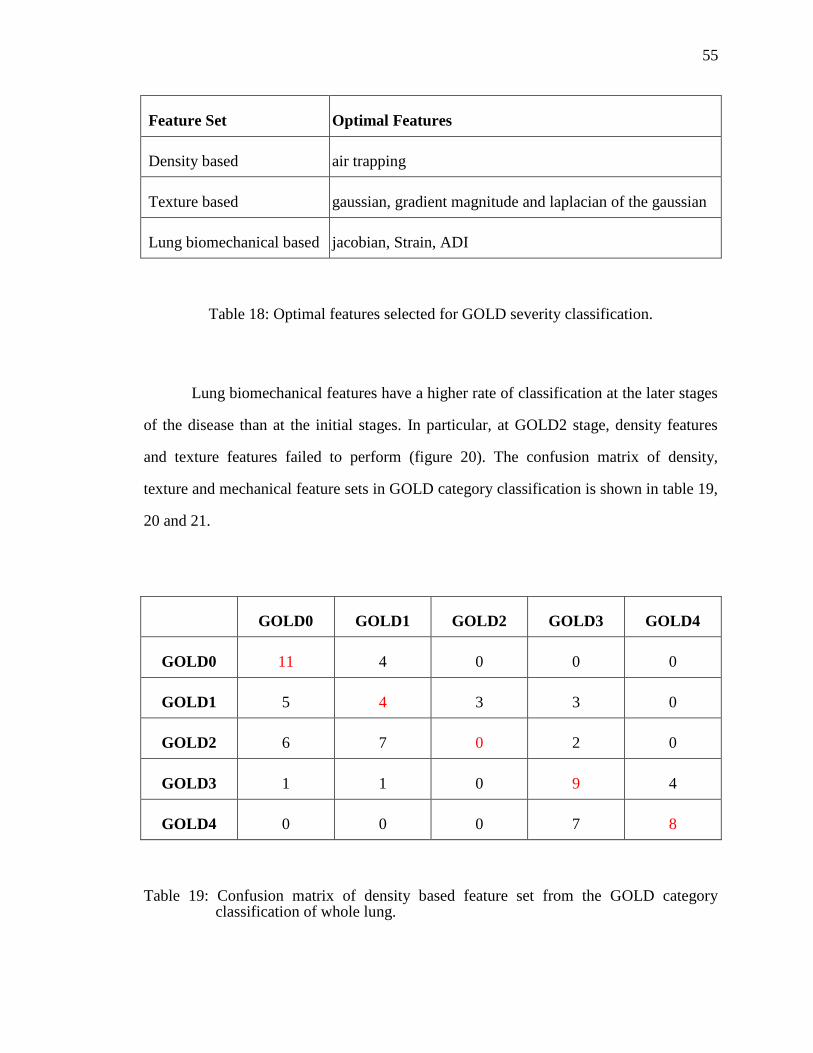
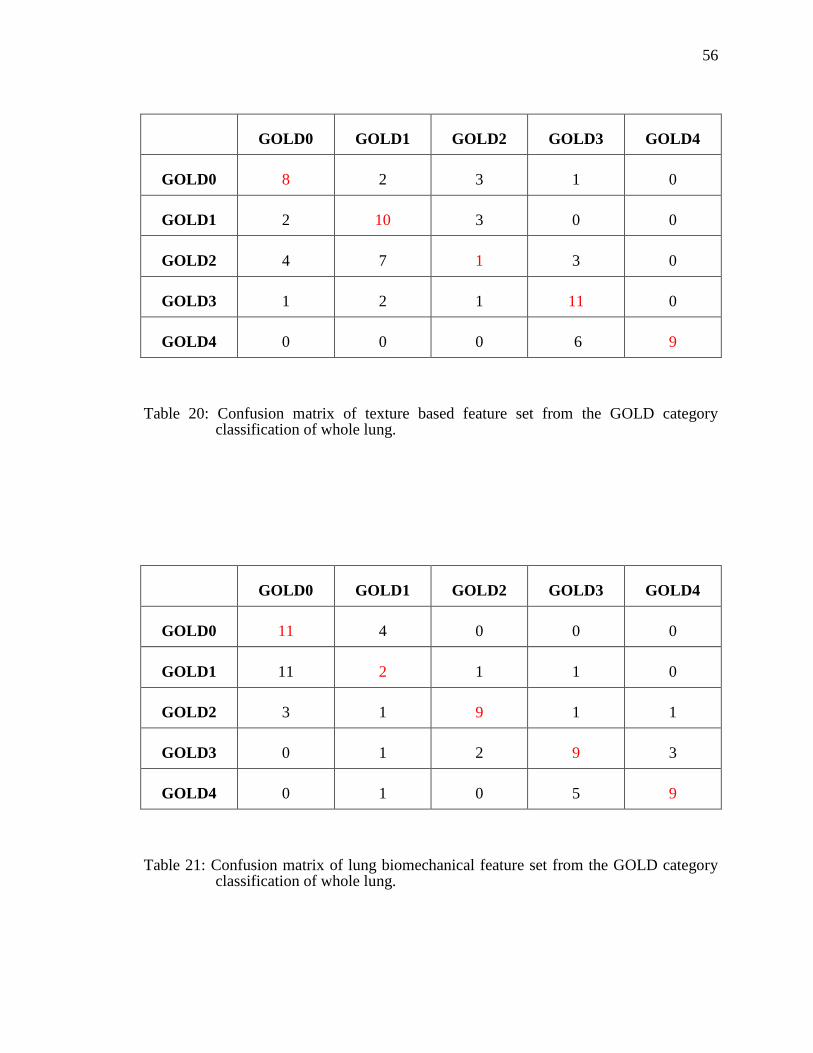
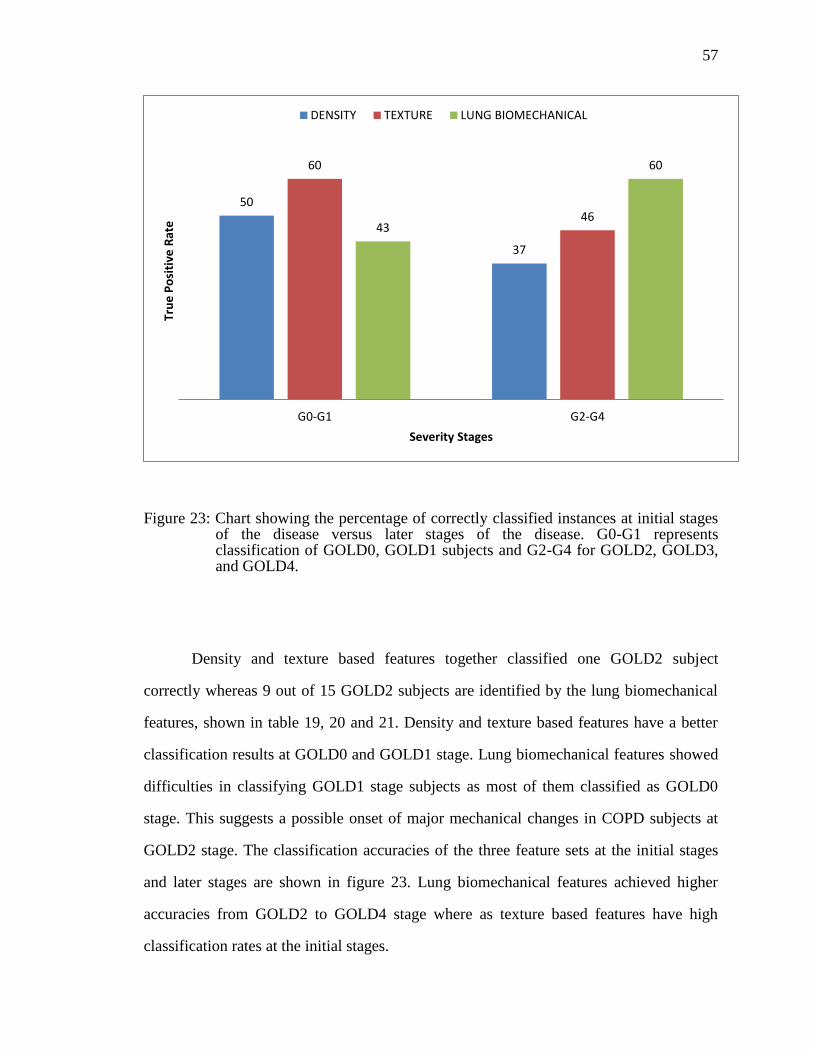
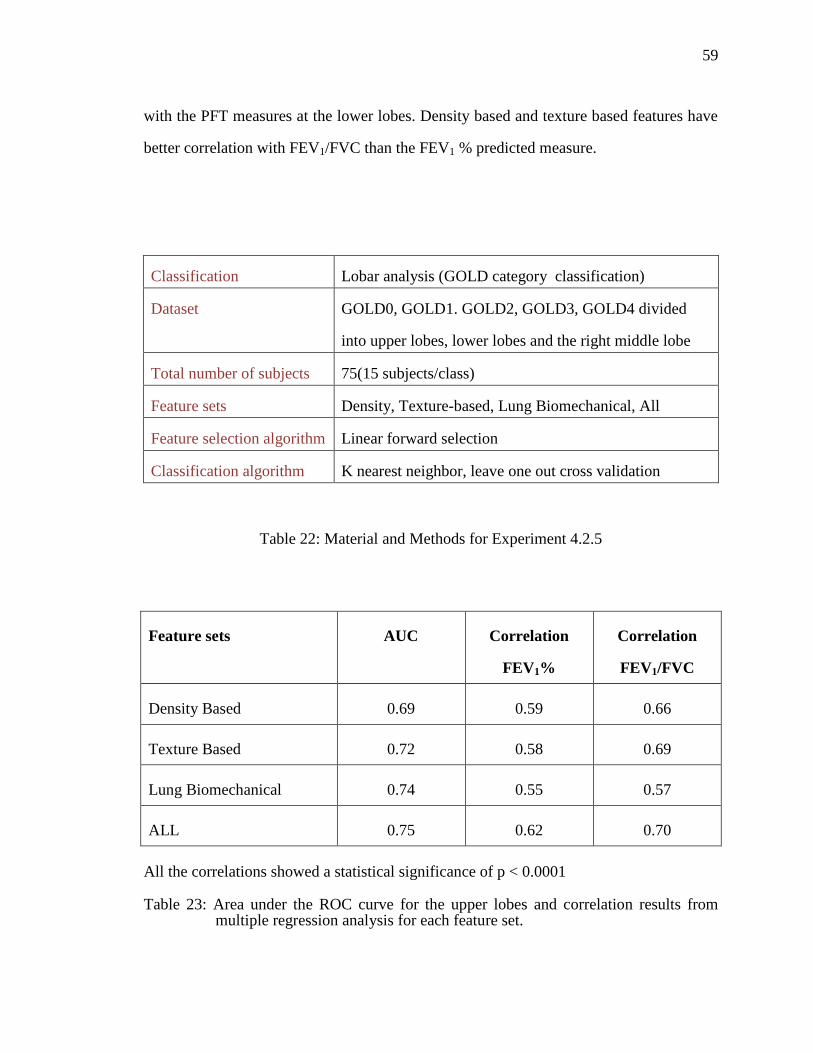
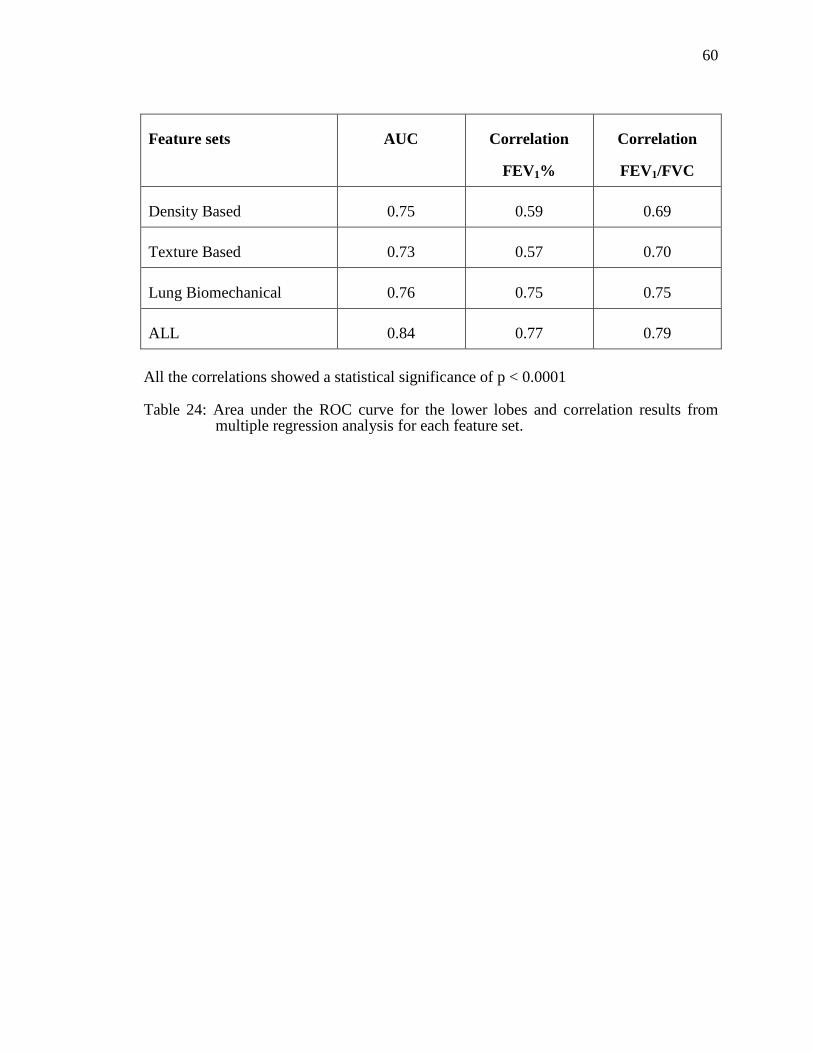
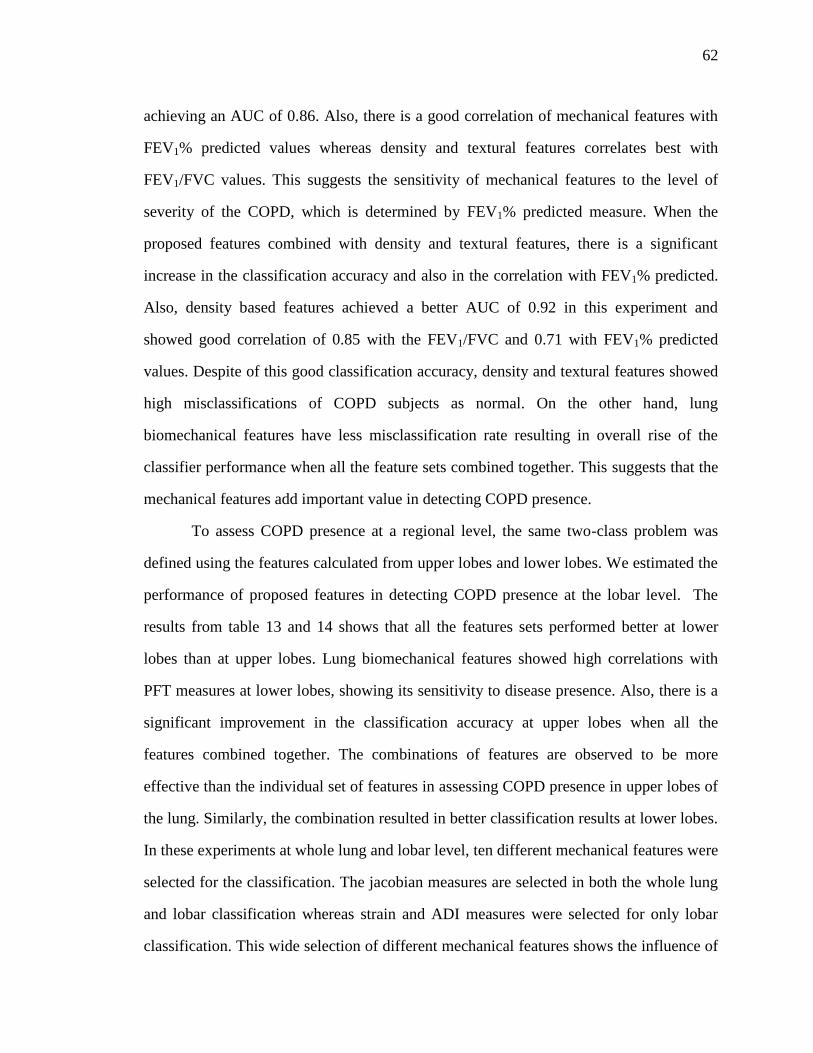
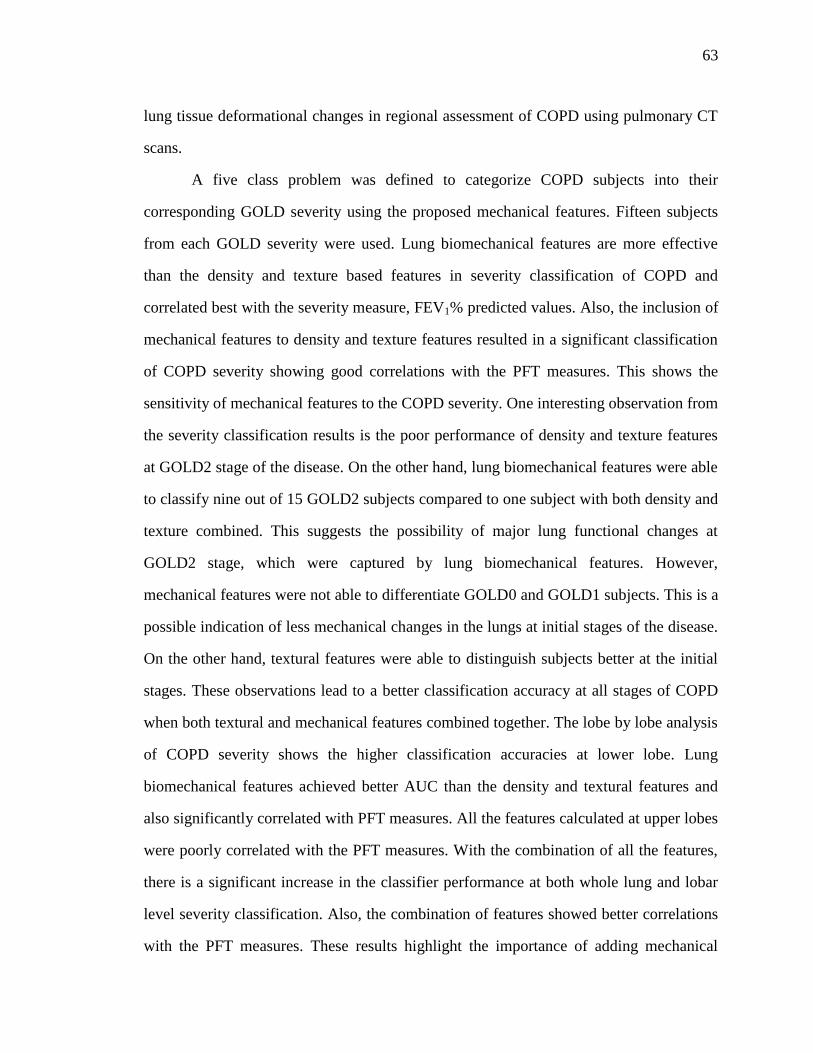
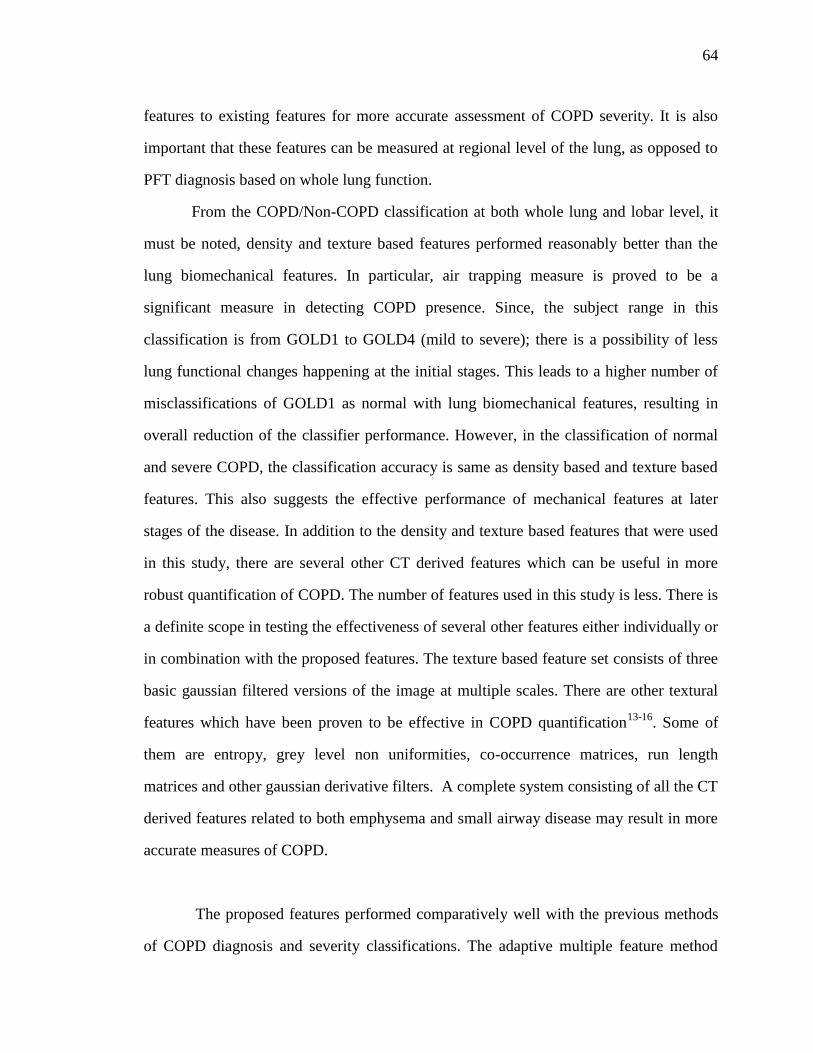
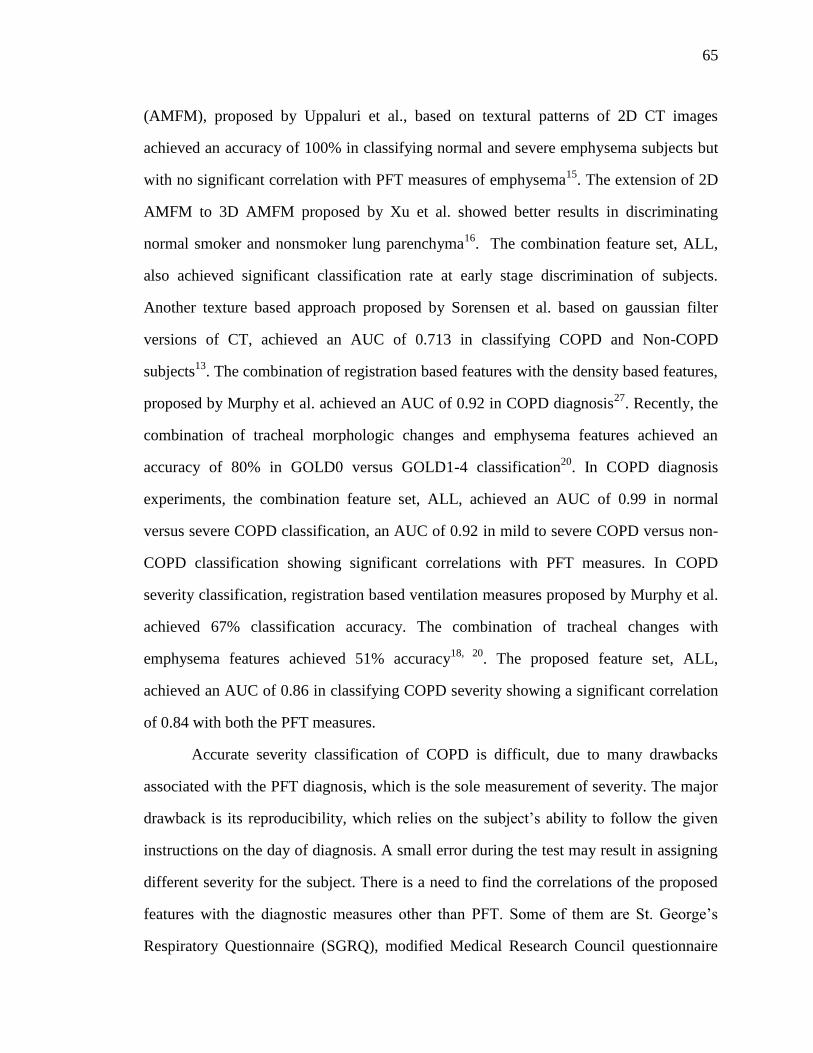
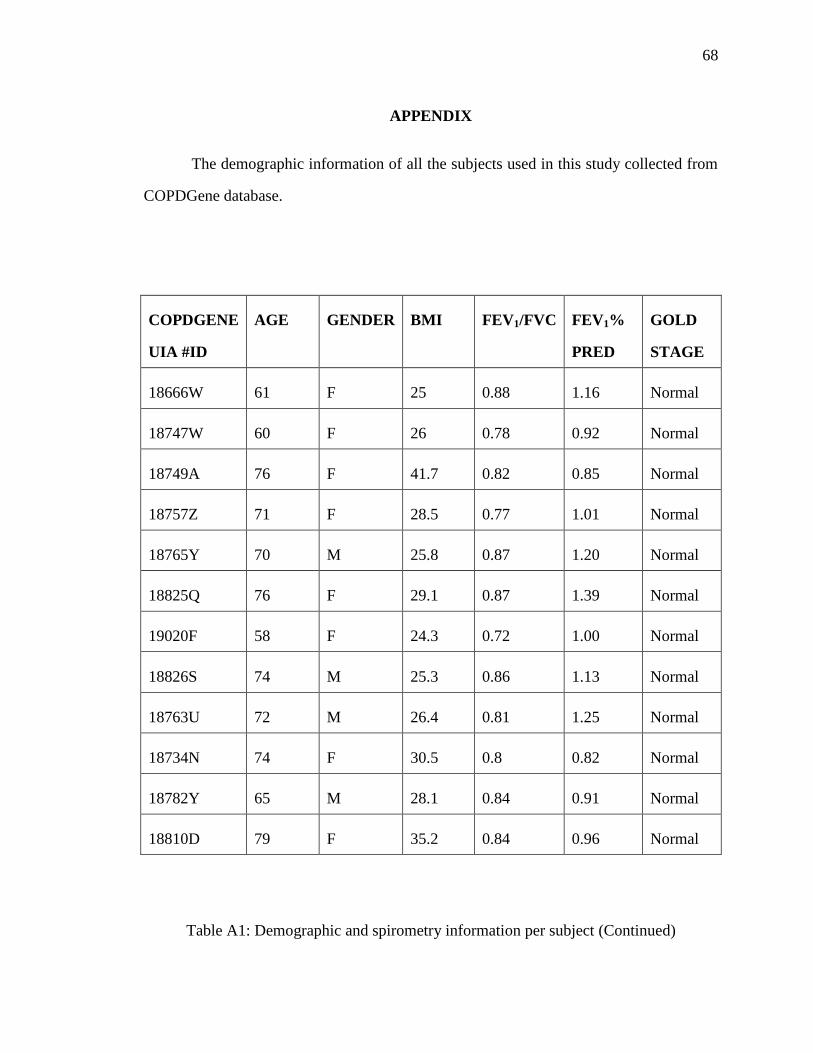
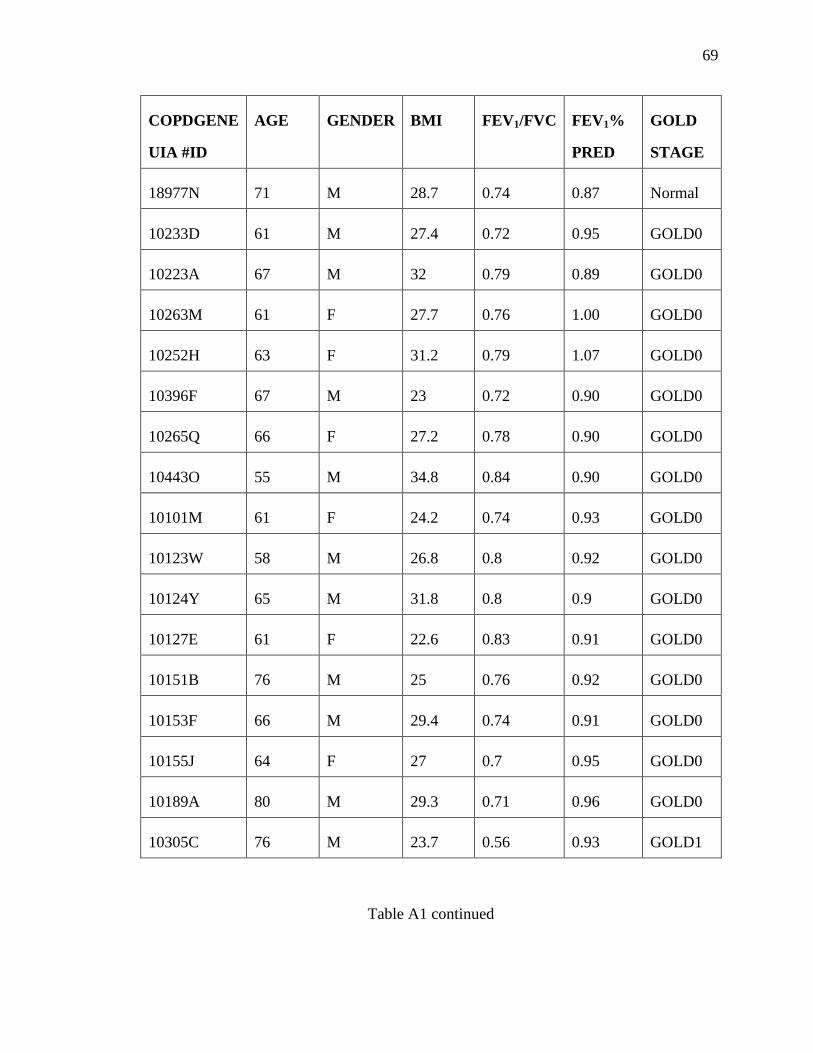
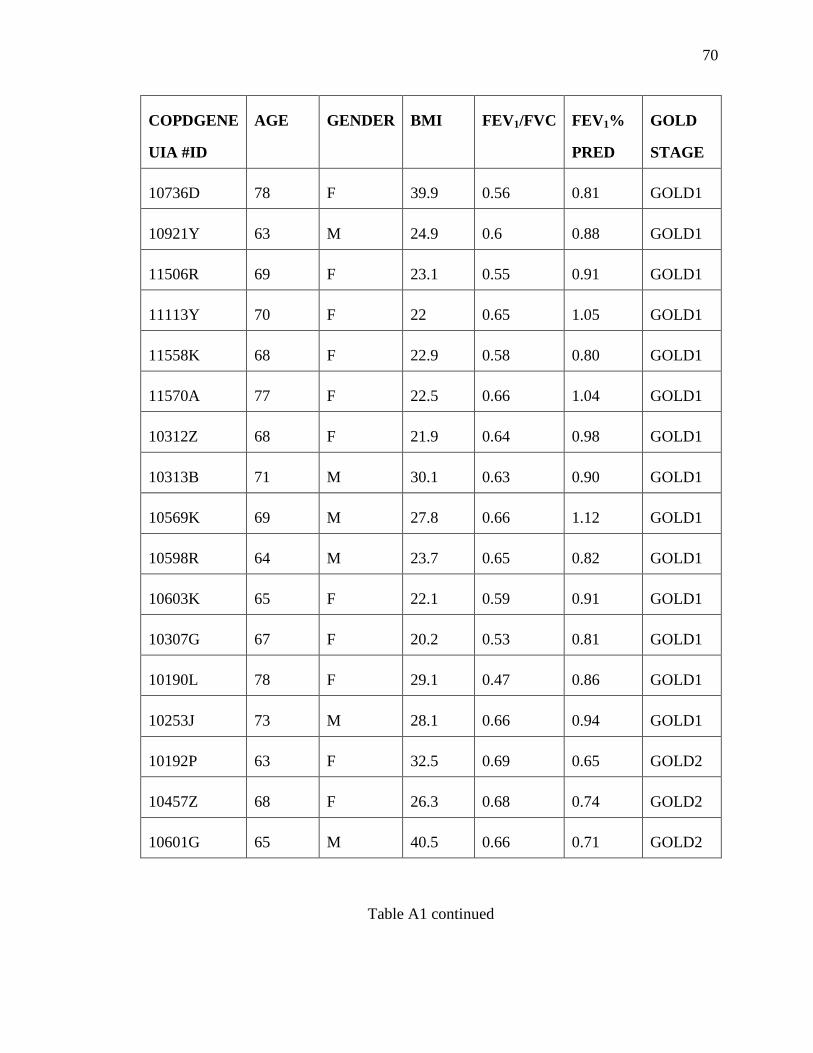
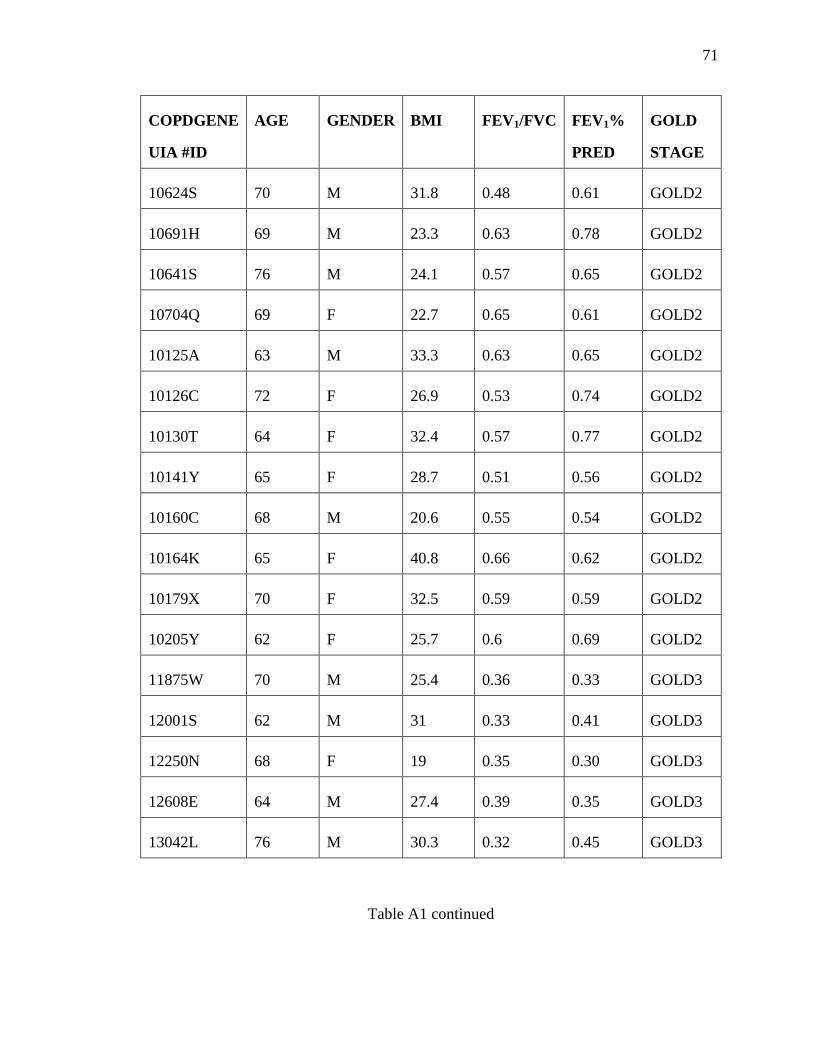
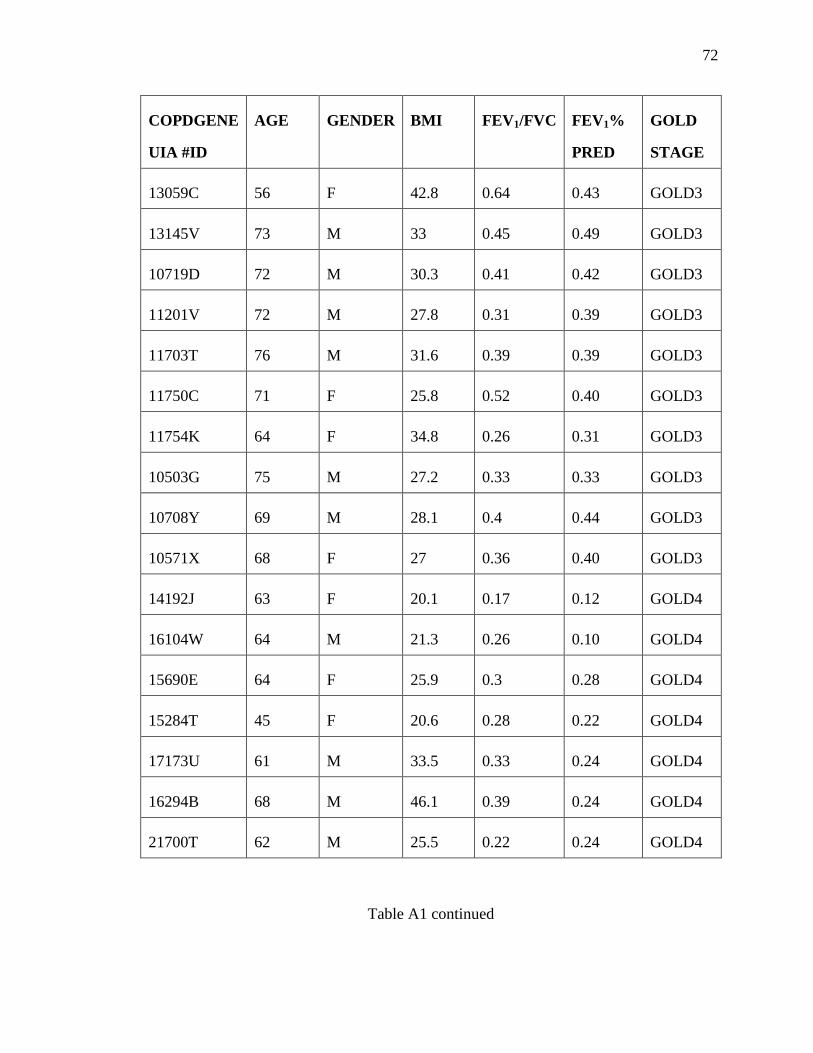
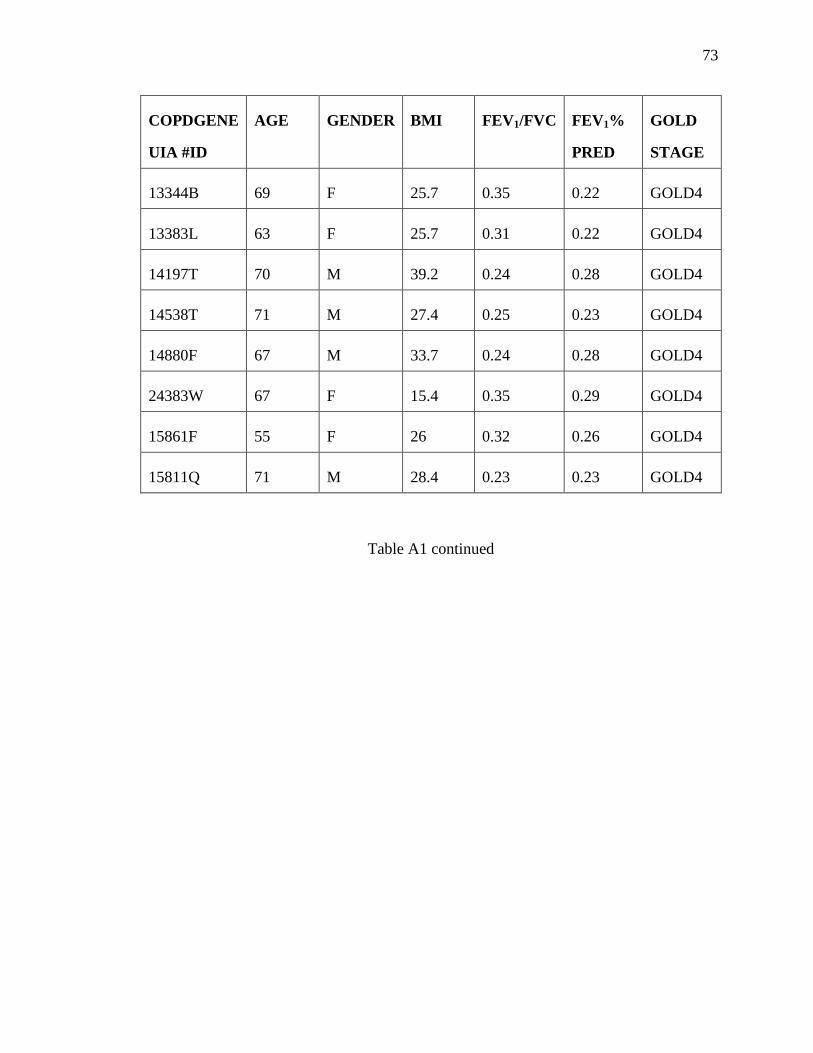


![Chronic Obstructive Pulmonary Diseaseopenaccessebooks.com/chronic-obstructive-pulmonary...Chronic Obstructive Pulmonary Disease 5 a-MCI is made [32]. COPD patients without significant](https://static.documents.pub/doc/80x56/5f853ccf82a2412fd65b9e28/chronic-obstructive-pulmonary-dis-chronic-obstructive-pulmonary-disease-5-a-mci.jpg)


