26
CBSE Result 2013 Analysis of Class-X Performance

Analysis of Class-XPerformance
CBSE Result 2013
Analysis of Class-XPerformance
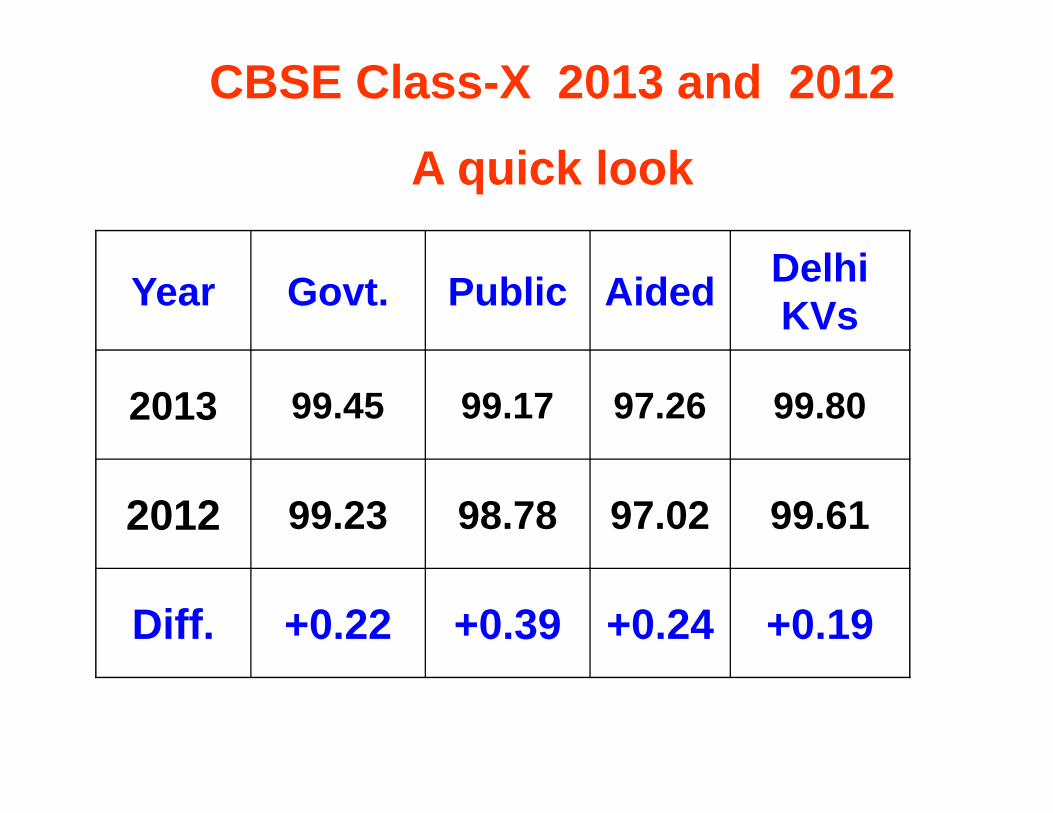
CBSE Class-X 2013 and 2012
A quick look
Year Govt. Public Aided DelhiKVs
2013 99.45 99.17 97.26 99.802013 99.45 99.17 97.26 99.80
2012 99.23 98.78 97.02 99.61
Diff. +0.22 +0.39 +0.24 +0.19

Overall Government School Results
Year APP PASS PP%
2013 197934 196839 99.45
CBSE 2013 Class X
2012 228415 226652 99.23
Difference -30481 -29813 +0.22

Year Gap%2001-02 -45.402002-03 -43.002003-04 -40.602004-05 -38.332005-06 -28.59
Gap between Government and Private Schools – a glance
Class-X CBSE 2013
2005-06 -28.592006-07 -13.932007-08 -07.422008-09 -1.272009-10 -0.842010-11 +1.172011-12 +0.452012-13 +0.28

Highest Ever Performance
This year our result has increased by0.22% from 99.23% of 2011-12 to99.45% in 2012-13.
The result has been increasing for thelast five years by 5.75%, 1.55%, 8.04%,0.14% and by 0.22% respectively.
Highest Ever Performance
This year our result has increased by0.22% from 99.23% of 2011-12 to99.45% in 2012-13.
The result has been increasing for thelast five years by 5.75%, 1.55%, 8.04%,0.14% and by 0.22% respectively.

CBSE Result for Class-X for the last 10 YearsYear No. of students appeared Pass percentage (%)
2001-02 83086 46.14
2002-03 79069 48.87
2003-04 79330 50.77
2004-05 85479 48.03
2005-06 96551 59.73
2006-07 95309 77.122006-07 95309 77.12
2007-08 105332 83.69
2008-09 116054 89.44
2009-10 132020 90.99
2010-11 175023 99.09
2011-12 228415 99.23
2012-13 197934 99.45

Highest everPass Percentage
99.45%
CBSE CLASS – X RESULT 2012-2013
Appeared candidates 197934

Number of students qualified in Class-X,2012-2013
• 2005 = 41056• 2006 = 57667• 2007 = 73497• 2008 = 88151• 2009 = 103804• 2010 = 120120• 2011 = 173429• 2012 = 226652• 2013 = 196839
Number of students qualified in Class-X,2012-2013
• 2005 = 41056• 2006 = 57667• 2007 = 73497• 2008 = 88151• 2009 = 103804• 2010 = 120120• 2011 = 173429• 2012 = 226652• 2013 = 196839

Gender-wise comparison with 2012
YearBoys Schools Girls Schools Co-ed. Schools
PP PP PP
2013 99.13 99.73 99.412013 99.13 99.73 99.41
2012 98.89 99.51 99.29
Diff. +0.24 +0.22 0.12

Shift wise Performance CBSE 2013Class-X
Shift APP PASS PP
Morning 133805 133179 99.53
Evening 64129 63660 99.27
Total 197934 196839 99.45

GOVERNMENT SCHOOLS - 100% RESULT
Year No. of Schools
2013 597
2012 400
2011 326
2010 1662010 166
2009 130
2008 100
2007 41
2006 9

Class – X 2013
No. of Schools with Qualified Percentage –A comparison between 2013 & 2012
YEAR 100% >=90%&<100%
<=80%&<90%
<=70%&<80%
<=60%&<70%
<60%
TOTAL
2013 597 924 10 0 0 0 9342013 597 924 10 0 0 0 934
2012 400 505 9 0 0 0 914
Diff. +197 +419 +1 0 0 0 -
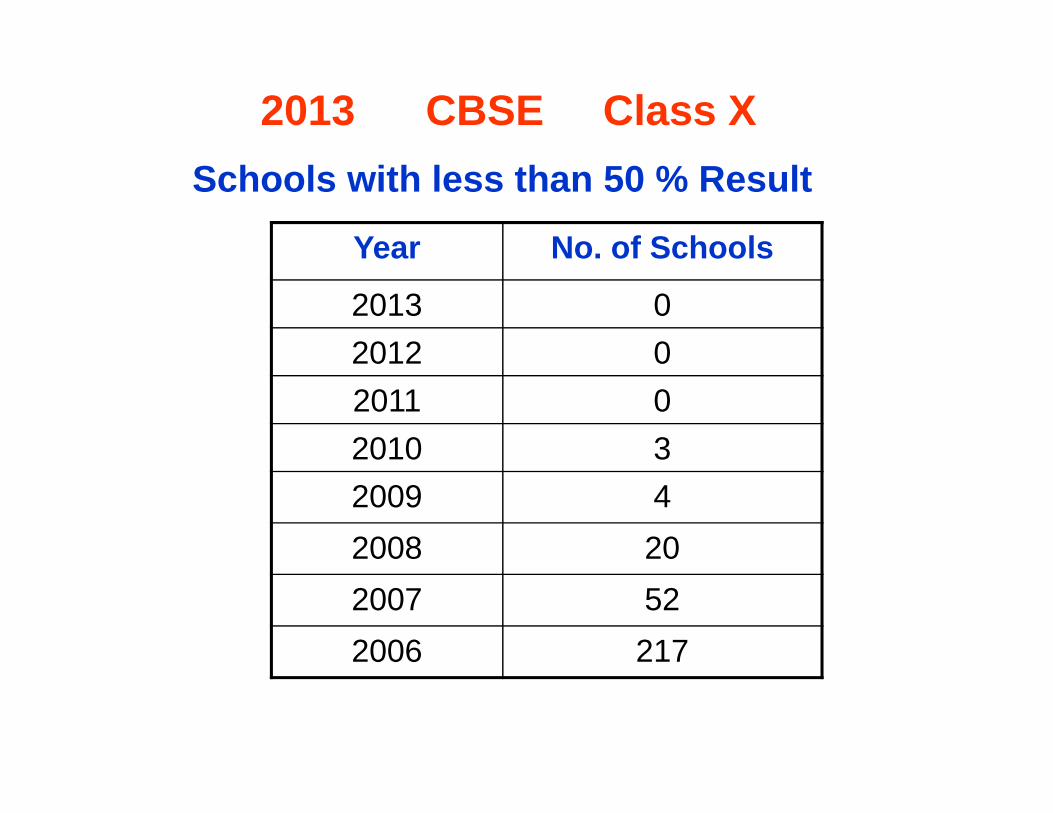
2013 CBSE Class X
Year No. of Schools
2013 02012 02011 0
Schools with less than 50 % Result
2011 02010 32009 42008 202007 522006 217

Dist wise Rank on CGPA & PP – CBSE 2013 Class X
DISTT. NAME APP PASS PP CGPARank on
PPRank on
CGPA
NORTH WEST A 18575 18523 99.72 6.28 2 1SOUTH 34844 34747 99.72 6.16 1 2EAST 21206 21056 99.29 6.13 7 3
NORTH-WEST-B 25101 24969 99.47 6.01 6 7NORTH EAST 35627 35472 99.56 6.04 4 6
SOUTH-WEST-B 13491 13423 99.49 5.94 5 8SOUTH-WEST-B 13491 13423 99.49 5.94 5 8WEST-B 19508 19449 99.69 6.07 3 5WEST-A 10515 10371 98.63 5.73 11 11NORTH 7724 7637 98.87 6.12 8 4
SOUTH-WEST-A 7258 7166 98.73 5.88 10 10CENTRAL 3587 3534 98.52 5.68 12 12NEW-DELHI 498 492 98.79 5.90 9 9
TOTAL 197934 196839 99.45 5.99___ ___

CBSE Class – X 2013
Number of Schools whose PP
Year Increased DeclinedNo
changeFirstTime TotalYear Increased Declined
Nochange
FirstTime
2013 401 221 292 20 934
2012 476 236 182 20 914
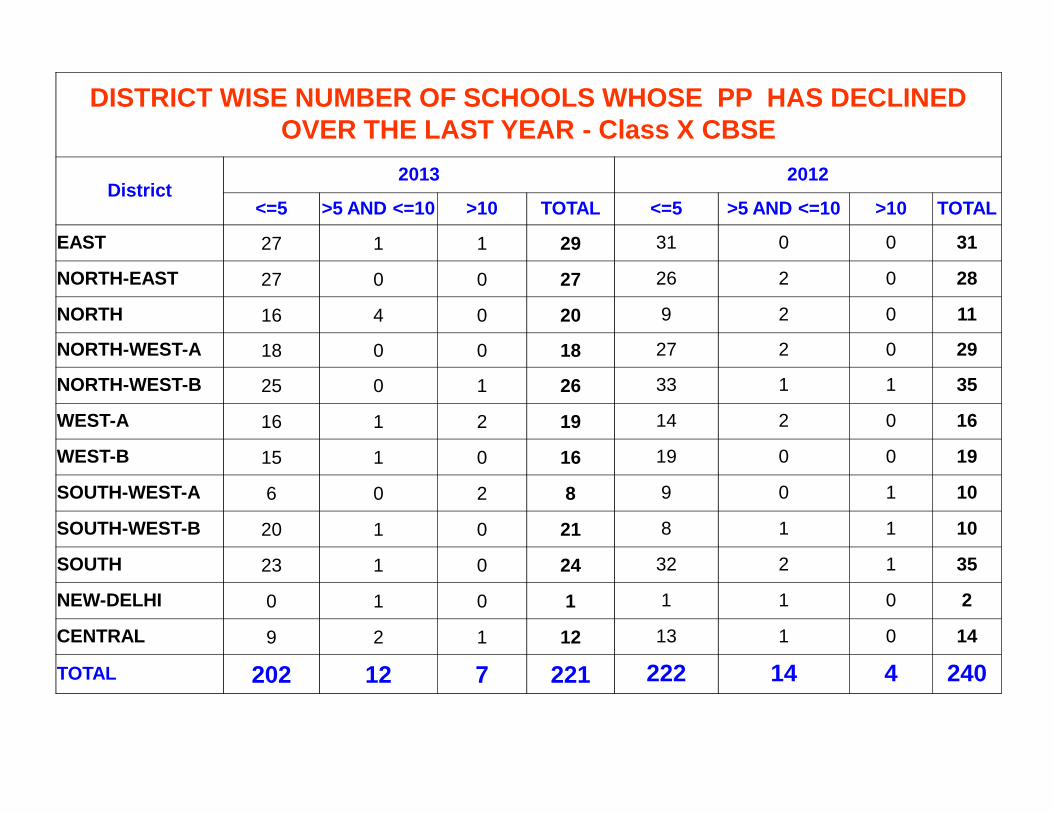
DISTRICT WISE NUMBER OF SCHOOLS WHOSE PP HAS DECLINEDOVER THE LAST YEAR - Class X CBSE
District2013 2012
<=5 >5 AND <=10 >10 TOTAL <=5 >5 AND <=10 >10 TOTAL
EAST 27 1 1 29 31 0 0 31
NORTH-EAST 27 0 0 27 26 2 0 28
NORTH 16 4 0 20 9 2 0 11
NORTH-WEST-A 18 0 0 18 27 2 0 29
NORTH-WEST-B 25 0 1 26 33 1 1 35
WEST-A 16 1 2 19 14 2 0 16WEST-A 16 1 2 19 14 2 0 16
WEST-B 15 1 0 16 19 0 0 19
SOUTH-WEST-A 6 0 2 8 9 0 1 10
SOUTH-WEST-B 20 1 0 21 8 1 1 10
SOUTH 23 1 0 24 32 2 1 35
NEW-DELHI 0 1 0 1 1 1 0 2
CENTRAL 9 2 1 12 13 1 0 14
TOTAL 202 12 7 221 222 14 4 240

An overall view of 2013 Result (within Directorate) whencompared to 2012’s
SchoolCategory
2013 2012
Diff.PPAPP Pass PP APP Pass PP
RPVV 1566 1566 100.00 1837 1836 99.95 +0.05
Sarvodaya 8465 83506 99.34 95709 94999 99.26 +0.08
Non-Sarvodaya 112303 111767 99.52 130869 129817 99.20 +0.32
Total 197934 196839 99.45 228415 226652 99.23 ___

An overall view of 2013 Result (within Directorate) whencompared to 2012’s

48.03
59.73
77.12
83.69
89.4490.99
99.09 99.45
85.1087.47
90.11 90.14 90.71 91.83 97.92 99.17
45
55
65
75
85
95
105
2005 2006 2007 2008 2009 2010 2011 2012Government Private
Government Schools Performed Better Than Private Schools
48.03
59.73
77.12
83.69
89.4490.99
99.09 99.45
85.1087.47
90.11 90.14 90.71 91.83 97.92 99.17
45
55
65
75
85
95
105
2005 2006 2007 2008 2009 2010 2011 2012Government Private

Zone wise Rank on CGPA & PP – CBSE 2013 Class X
S. No. Zone APP Pass PP CGPARank on
PPRank on
CGPA
1 Zone-10 7145 7123 99.69 6.39 4 12 Zone-25 18493 18463 99.84 6.25 1 23 Zone-09 11430 11400 99.74 6.21 3 34 Zone-02 13272 13230 99.68 6.18 5 45 Zone-01 4060 4013 98.84 6.15 21 56 Zone-04 16493 16423 99.58 6.13 11 66 Zone-04 16493 16423 99.58 6.13 11 67 Zone-07 5841 5763 98.66 6.12 23 78 Zone-08 1883 1874 99.52 6.11 13 89 Zone-20 4300 4284 99.63 6.10 7 910 Zone-17 9269 9230 99.58 6.09 10 1011 Zone-12 12161 12097 99.47 6.09 15 1112 Zone-05 6995 6966 99.59 6.09 9 1213 Zone-22 5407 5389 99.67 6.08 6 1314 Zone-23 13330 13279 99.62 6.06 8 14
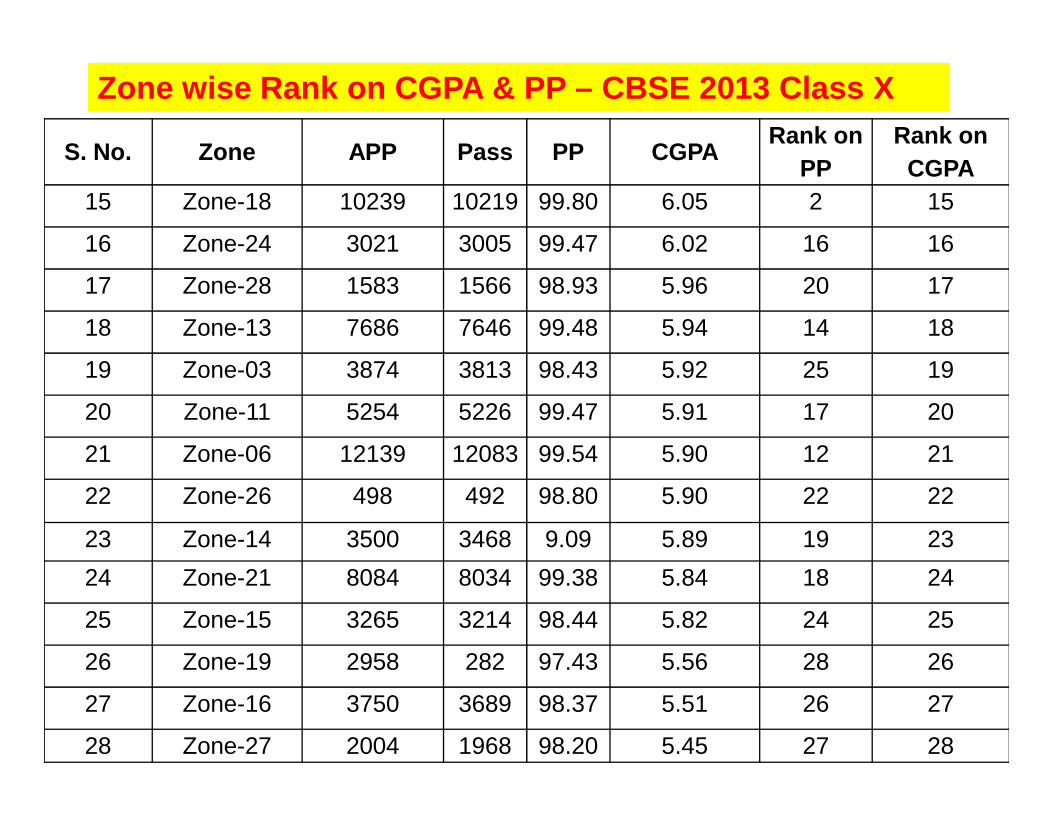
Zone wise Rank on CGPA & PP – CBSE 2013 Class X
S. No. Zone APP Pass PP CGPA Rank onPP
Rank onCGPA
15 Zone-18 10239 10219 99.80 6.05 2 15
16 Zone-24 3021 3005 99.47 6.02 16 16
17 Zone-28 1583 1566 98.93 5.96 20 17
18 Zone-13 7686 7646 99.48 5.94 14 18
19 Zone-03 3874 3813 98.43 5.92 25 19
20 Zone-11 5254 5226 99.47 5.91 17 2020 Zone-11 5254 5226 99.47 5.91 17 20
21 Zone-06 12139 12083 99.54 5.90 12 21
22 Zone-26 498 492 98.80 5.90 22 22
23 Zone-14 3500 3468 9.09 5.89 19 2324 Zone-21 8084 8034 99.38 5.84 18 24
25 Zone-15 3265 3214 98.44 5.82 24 25
26 Zone-19 2958 282 97.43 5.56 28 26
27 Zone-16 3750 3689 98.37 5.51 26 27
28 Zone-27 2004 1968 98.20 5.45 27 28

Class X – Session -2012-13List of Topper Students (Girls) with A1 Grade in SAs &
FAs & CGPA 10S. No Name of the
StudentsFather’s Name Name of the Schools
1 Anshika Gupta Pradeep Kumar Gupta RPVV Surajmal Vihar, Delhi
2 Vidhi Arun Kumar Mishra RPVV Nand Nagri, Delhi
3 Rashmi Satyavir Singh Tomar RPVV Nand Nagri, Delhi3 Rashmi Satyavir Singh Tomar RPVV Nand Nagri, Delhi
4 Shaifali Jagbir Singh RPVV Shalimar Bagh, Delhi
5 Manisha Gupta Dinesh Gupta RPVV Sec-10, Dwarka, Delhi
6 Ojasvy Gaur Late. Subodh Kumar Sharma GGSSS, Narang Colony, Tri Nagar,Delhi

Class X – Session -2012-13List of Topper Students (Boys) with A1 Grade in SAs &
FAs & CGPA 10
S. No Name of theStudents
Father’s Name Name of the Schools
1 UmeshSaraswat
Uma Shankar RPVV Nand Nagri, Delhi
2 Tarun Gupta Pradeep kumar Gupta RPVV Shalimar Bagh, Delhi
3 Jatin Jain Neeraj Jain SV Saraswati Vihar, Delhi

RPVV CBSE Result 2013 of class 10thSchool ID School Name App Pass PP QI Rank on QI
1821137 Dwarka Sector-10, RPVV 66 66 100.00 8.95 1
1104149 Yamuna Vihar, Block B-RPVV 100 100 100.00 8.61 2
1106252 Nand Nagri, Block D-RPVV 103 103 100.00 8.46 3
1309124 Shalimar Bagh, Block BT-RPVV 99 99 100.00 8.43 4
1413076 Rohini, Sector 11-RPVV 96 96 100.00 8.26 51001104 Surajmal Vihar-RPVV 99 99 100.00 8.20 6
1003261 Gandhi Nagar-RPVV 66 66 100.00 7.99 7
1310409 Narela, A-10 Pocket-5, RPVV 60 60 100.00 7.96 81310409 Narela, A-10 Pocket-5, RPVV 60 60 100.00 7.96 8
1617009 Paschim Vihar, A 6-RPVV 98 98 100.00 7.96 9
1924038 Lodhi Road, Tyagraj Nagar-RPVV 95 95 100.00 7.66 10
1208092 Kishan Ganj-RPVV 102 102 100.00 7.54 11
1720031 Vasant Kunj, B1-RPVV 90 90 100.00 7.47 12
2128031 Karol Bagh, Link Road, Plot No.1-RPVV 67 67 100.00 7.41 13
1514023 Hari Nagar, Block BE-RPVV 97 97 100.00 7.35 14
1207113 Civil Lines, RPVV 134 134 100.00 7.31 15
1925334 Lajpat Nagar-RPVV 57 57 100.00 7.11 16
1207108 Raj Niwas Marg, RPVV 137 137 100.00 6.47 17
TOTAL 1566 1566 100.00 7.79

Urdu Medium CBSE Result 2013 of class 10thS No. School ID School Name APP Pass CGPA PP QI1 1105008 Jafrabad-GBSSS 303 302 1770 99.66 5.84
2 1105018 Jafrabad, Zeenat Mahal(Urdu Medium)-SKV 645 645 4125.8 100.00 6.40
3 1208027 Quresh Nagar(Urdu Medium)-GGSS 31 30 208.4 96.77 6.72
4 1208090 Inder Lok-SKV 99 99 599 100.00 6.05
5 1925002 Noor Nagar-GBSSS 452 451 2700.6 99.77 5.97
6 1925035 Noor Nagar-SKV 290 289 1689 99.65 5.82
2127180 Lal Kuan, No.1-GGSS 29 29 195 100.00 6.72
Total 3334 3310 19575 99.28 5.87
6 1925035 Noor Nagar-SKV 290 289 1689 99.65 5.82
7 1925049 Joga Bai-GGSSS 331 331 2073.6 100.00 6.26
8 1925052 Joga Bai-GBSSS 222 222 1238.6 100.00 5.58
9 2127002 Jama Masjid, No.1(Urdu Medium)-SBV 140 139 751.6 99.28 5.37
10 2127003 Darya Ganj, Pataudi House-SBV 192 190 948.4 98.95 4.94
11 2127017 Jama Masjid, No.2-SKV 89 89 561.6 100.00 6.31
12 2127021 Bulbuli Khana-SKV 145 141 807.2 97.24 5.57
13 2127022 Haweli Azam Khan-SKV 38 36 198.2 94.73 5.22
14 2127025 Chashma Building(Urdu Medium)-GGSSS 99 95 484.2 95.95 4.89
15 2127027 Kalan Mahal-GGSSS 67 60 313 89.55 4.67
2127180 Lal Kuan, No.1-GGSS 29 29 195 100.00 6.72
Total 3334 3310 19575 99.28 5.87

THANKS


![nIRQ RK3128 spi[127:0] cfgdisable Chapter 9 Generic ...rockchip.fr/RK312X TRM/chapter-09-generic-interrupt-controller-(gic).pdfhighest priority active interrupt from a CPU interface](https://static.documents.pub/doc/80x56/5f0aeef77e708231d42e0e37/nirq-rk3128-spi1270-cfgdisable-chapter-9-generic-trmchapter-09-generic-interrupt-controller-gicpdf.jpg)


