76 Transportation Research Record: Journal of the Transportation Research Board, No. 2410, Transportation Research Board of the National Academies, Washington, D.C., 2014, pp. 76–84. DOI: 10.3141/2410-09 Department of Civil and Environmental Engineering, Portland State University, P.O. Box 751, Portland, OR 97207. Corresponding author: M. Figliozzi, figliozzi@ pdx.edu. Limitations are also associated with freight tricycles, chiefly their limited cargo capacity and relatively low operating speed. From the viewpoint of shippers and truck companies, total logistics cost is a crucial factor when making decisions or thinking about any changes to their supply chains. With publicly available data from an existing freight tricycle delivery company in Portland, Oregon, key factors that affect tricycles’ cost competitiveness are analyzed. The goal is to com- pare the competitiveness of freight tricycles against diesel-powered delivery vans. Because the freight that is delivered by tricycle is often light and small, diesel vans are the natural competitor—single-unit trucks, the other dominant urban delivery vehicles, are more expensive than vans and would have a high percentage of underutilized capacity. Efforts are made to present a realistic case study. However, the goal of this research is not to represent the costs of one company but to study the key factors that affect tricycle competitiveness by analyzing cost elasticity values and the sensitivity of breakeven values. The ultimate goal is to derive insights that are applicable to cities and companies outside Portland. For comparison of tricycle and van costs, a model was developed that incorporated vehicle ownership and operation models, logistics constraints such as time windows and cargo capacity, and fuel con- sumption and energy use. The next section presents a brief literature review, and the following sections present the cost and logistics model, case study assumptions, and results. LITERATURE REVIEW There are many bodies of literature that are relevant to the topic of freight tricycle delivery. Because of the high number of relevant papers and to facilitate the review of key factors, three subsections are introduced: freight tricycle characteristics, last-mile deliveries in urban areas, and urban delivery cost models. Characteristics of Freight Tricycles Most freight tricycles are electric-assisted. Tricycle payloads are typi- cally between 330 and 600 lb, and their volume capacities are typi- cally between 42 and 55 ft 3 . Their speed is approximately 10 mph (3). Although most freight tricycles are electronically assisted, the riders still have to pedal (4). The specifications of a typical freight tricycle and van are shown in Table 1. Wilson et al. state that an average fit man or woman could pedal a bicycle with the power output of 75 watts without suf- fering fatigue for 7 h (9). The human contribution is not negli- gible because human power could reduce necessary battery size by roughly 500 watt-hours during a 7-h day, and the battery capacity is approximately 850 watt-hours. Compared with a diesel delivery van, a freight tricycle has many advantages. First, a tricycle is relatively small, requires a small park- Analysis of Competitiveness of Freight Tricycle Delivery Services in Urban Areas Chawalit Tipagornwong and Miguel Figliozzi This research analyzed the competitiveness of freight tricycles, low- capacity freight delivery vehicles, as compared with diesel vans in urban areas. Freight tricycles, also known as electric-assisted trikes, are low- emission vehicles powered by a combination of human effort and an elec- tric engine. This research developed a cost model that incorporated vehicle ownership and operation models as well as logistics constraints such as time windows, cargo capacity, fuel consumption, and energy use. Unlike previous research efforts, the model was tailored to the unique characteris- tics of freight tricycles and diesel van deliveries in urban areas. The model was used to analyze the competitiveness of freight tricycles against diesel- powered delivery vans. Cost breakeven points and elasticity for several vehicles and route-related variables were estimated. Results provided new insights on the last-mile delivery characteristics and logistical constraints that could affect tricycle competitiveness. Freight tricycle competitive- ness was sensitive to urban policies and design variables such as on-street speed limits and parking policies. Tricycle competitiveness was also greatly affected by drivers’ costs but barely affected by electricity or diesel costs. In contrast with the use of electric trucks, the competitiveness of tricycles was not driven by the value of the vehicles and their use. There is a growing awareness of problems associated with urban freight deliveries in congested urban areas. Efforts to increase down- town or neighborhood livability can pose severe limitations for urban freight deliveries. Typical restrictions include a ban at certain times of the day, a reduction of parking and loading and unloading zones, noise level and pollution constraints, and vehicle size limits. For example, there are some restrictions on heavy goods vehicles on weekends in the European Union (1), and truck size, routes, and parking are restricted in New York City (2). In that context, despite their limitations, freight tricycles are increasingly appealing. Freight tricycles are ideal vehicles for congested and dense urban areas because of their small size and smaller carbon footprint, lack of tailpipe emissions, and relatively easy access to congested areas with limited parking facilities. In many urban areas freight tricycles can legally use bicycle paths and lanes allowing for faster access to con- gested downtowns or pedestrian areas. In addition, customer service times can be reduced because tricycles can be parked inside businesses or at nearby bicycle parking racks during deliveries. Besides practical considerations, the political environment in many states and countries encourages the use of environmentally friendly vehicles through tax credits or policies that aim to reduce greenhouse gas emissions.
Transcript
76
Transportation Research Record: Journal of the Transportation Research Board, No. 2410, Transportation Research Board of the National Academies, Washington, D.C., 2014, pp. 76–84.DOI: 10.3141/2410-09
Department of Civil and Environmental Engineering, Portland State University, P.O. Box 751, Portland, OR 97207. Corresponding author: M. Figliozzi, [email protected].
Limitations are also associated with freight tricycles, chiefly their limited cargo capacity and relatively low operating speed. From the viewpoint of shippers and truck companies, total logistics cost is a crucial factor when making decisions or thinking about any changes to their supply chains. With publicly available data from an existing freight tricycle delivery company in Portland, Oregon, key factors that affect tricycles’ cost competitiveness are analyzed. The goal is to com-pare the competitiveness of freight tricycles against diesel-powered delivery vans. Because the freight that is delivered by tricycle is often light and small, diesel vans are the natural competitor—single-unit trucks, the other dominant urban delivery vehicles, are more expensive than vans and would have a high percentage of underutilized capacity. Efforts are made to present a realistic case study. However, the goal of this research is not to represent the costs of one company but to study the key factors that affect tricycle competitiveness by analyzing cost elasticity values and the sensitivity of breakeven values. The ultimate goal is to derive insights that are applicable to cities and companies outside Portland.
For comparison of tricycle and van costs, a model was developed that incorporated vehicle ownership and operation models, logistics constraints such as time windows and cargo capacity, and fuel con-sumption and energy use. The next section presents a brief literature review, and the following sections present the cost and logistics model, case study assumptions, and results.
Literature review
There are many bodies of literature that are relevant to the topic of freight tricycle delivery. Because of the high number of relevant papers and to facilitate the review of key factors, three subsections are introduced: freight tricycle characteristics, last-mile deliveries in urban areas, and urban delivery cost models.
Characteristics of Freight tricycles
Most freight tricycles are electric-assisted. Tricycle payloads are typi-cally between 330 and 600 lb, and their volume capacities are typi-cally between 42 and 55 ft3. Their speed is approximately 10 mph (3). Although most freight tricycles are electronically assisted, the riders still have to pedal (4). The specifications of a typical freight tricycle and van are shown in Table 1.
Wilson et al. state that an average fit man or woman could pedal a bicycle with the power output of 75 watts without suf-fering fatigue for 7 h (9). The human contribution is not negli-gible because human power could reduce necessary battery size by roughly 500 watt-hours during a 7-h day, and the battery capacity is approximately 850 watt-hours.
Compared with a diesel delivery van, a freight tricycle has many advantages. First, a tricycle is relatively small, requires a small park-
Analysis of Competitiveness of Freight Tricycle Delivery Services in Urban Areas
Chawalit Tipagornwong and Miguel Figliozzi
This research analyzed the competitiveness of freight tricycles, low- capacity freight delivery vehicles, as compared with diesel vans in urban areas. Freight tricycles, also known as electric-assisted trikes, are low-emission vehicles powered by a combination of human effort and an elec-tric engine. This research developed a cost model that incorporated vehicle ownership and operation models as well as logistics constraints such as time windows, cargo capacity, fuel consumption, and energy use. Unlike previous research efforts, the model was tailored to the unique characteris-tics of freight tricycles and diesel van deliveries in urban areas. The model was used to analyze the competitiveness of freight tricycles against diesel-powered delivery vans. Cost breakeven points and elasticity for several vehicles and route-related variables were estimated. Results provided new insights on the last-mile delivery characteristics and logistical constraints that could affect tricycle competitiveness. Freight tricycle competitive-ness was sensitive to urban policies and design variables such as on-street speed limits and parking policies. Tricycle competitiveness was also greatly affected by drivers’ costs but barely affected by electricity or diesel costs. In contrast with the use of electric trucks, the competitiveness of tricycles was not driven by the value of the vehicles and their use.
There is a growing awareness of problems associated with urban freight deliveries in congested urban areas. Efforts to increase down-town or neighborhood livability can pose severe limitations for urban freight deliveries. Typical restrictions include a ban at certain times of the day, a reduction of parking and loading and unloading zones, noise level and pollution constraints, and vehicle size limits. For example, there are some restrictions on heavy goods vehicles on weekends in the European Union (1), and truck size, routes, and parking are restricted in New York City (2). In that context, despite their limitations, freight tricycles are increasingly appealing.
Freight tricycles are ideal vehicles for congested and dense urban areas because of their small size and smaller carbon footprint, lack of tailpipe emissions, and relatively easy access to congested areas with limited parking facilities. In many urban areas freight tricycles can legally use bicycle paths and lanes allowing for faster access to con-gested downtowns or pedestrian areas. In addition, customer service times can be reduced because tricycles can be parked inside businesses or at nearby bicycle parking racks during deliveries. Besides practical considerations, the political environment in many states and countries encourages the use of environmentally friendly vehicles through tax credits or policies that aim to reduce greenhouse gas emissions.
Tipagornwong and Figliozzi 77
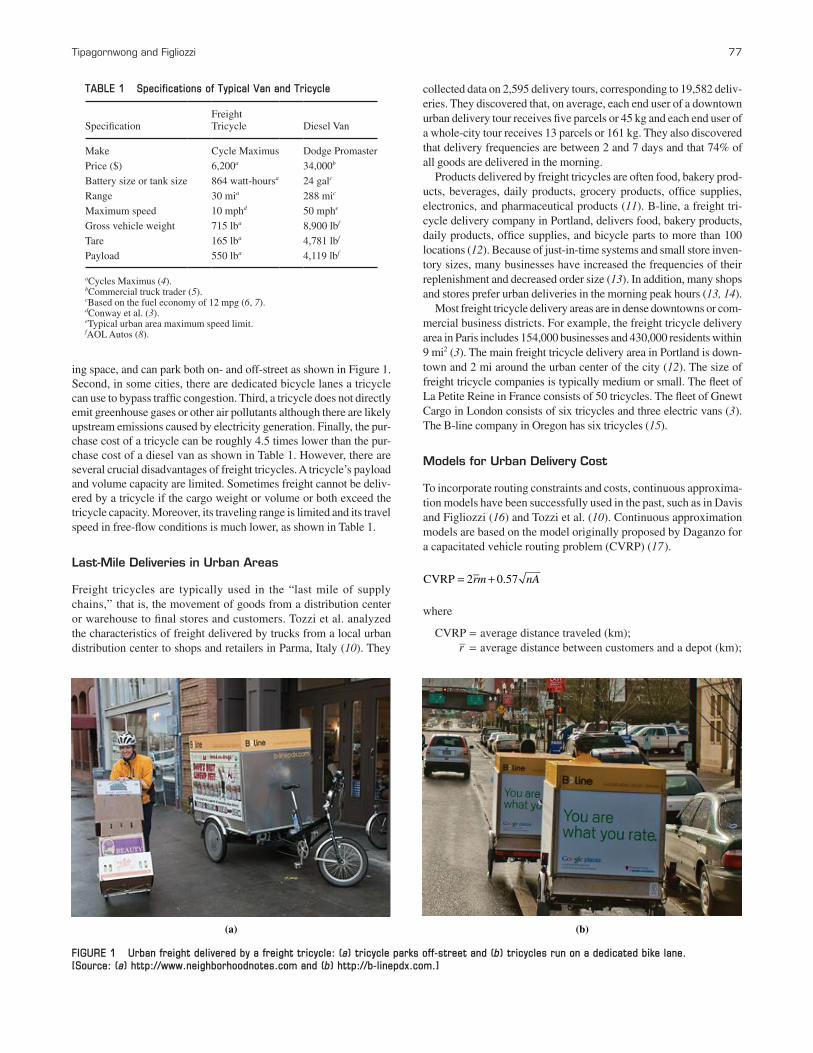
ing space, and can park both on- and off-street as shown in Figure 1. Second, in some cities, there are dedicated bicycle lanes a tricycle can use to bypass traffic congestion. Third, a tricycle does not directly emit greenhouse gases or other air pollutants although there are likely upstream emissions caused by electricity generation. Finally, the pur-chase cost of a tricycle can be roughly 4.5 times lower than the pur-chase cost of a diesel van as shown in Table 1. However, there are several crucial disadvantages of freight tricycles. A tricycle’s payload and volume capacity are limited. Sometimes freight cannot be deliv-ered by a tricycle if the cargo weight or volume or both exceed the tricycle capacity. Moreover, its traveling range is limited and its travel speed in free-flow conditions is much lower, as shown in Table 1.
Last-Mile Deliveries in Urban Areas
Freight tricycles are typically used in the “last mile of supply chains,” that is, the movement of goods from a distribution center or warehouse to final stores and customers. Tozzi et al. analyzed the characteristics of freight delivered by trucks from a local urban distribution center to shops and retailers in Parma, Italy (10). They
collected data on 2,595 delivery tours, corresponding to 19,582 deliv-eries. They discovered that, on average, each end user of a downtown urban delivery tour receives five parcels or 45 kg and each end user of a whole-city tour receives 13 parcels or 161 kg. They also discovered that delivery frequencies are between 2 and 7 days and that 74% of all goods are delivered in the morning.
Products delivered by freight tricycles are often food, bakery prod-ucts, beverages, daily products, grocery products, office supplies, electronics, and pharmaceutical products (11). B-line, a freight tri-cycle delivery company in Portland, delivers food, bakery products, daily products, office supplies, and bicycle parts to more than 100 locations (12). Because of just-in-time systems and small store inven-tory sizes, many businesses have increased the frequencies of their replenishment and decreased order size (13). In addition, many shops and stores prefer urban deliveries in the morning peak hours (13, 14).
Most freight tricycle delivery areas are in dense downtowns or com-mercial business districts. For example, the freight tricycle delivery area in Paris includes 154,000 businesses and 430,000 residents within 9 mi2 (3). The main freight tricycle delivery area in Portland is down-town and 2 mi around the urban center of the city (12). The size of freight tricycle companies is typically medium or small. The fleet of La Petite Reine in France consists of 50 tricycles. The fleet of Gnewt Cargo in London consists of six tricycles and three electric vans (3). The B-line company in Oregon has six tricycles (15).
Models for Urban Delivery Cost
To incorporate routing constraints and costs, continuous approxima-tion models have been successfully used in the past, such as in Davis and Figliozzi (16) and Tozzi et al. (10). Continuous approximation models are based on the model originally proposed by Daganzo for a capacitated vehicle routing problem (CVRP) (17).
rm nA= +CVRP 2 0.57
where
CVRP = average distance traveled (km); r– = average distance between customers and a depot (km);
TABLE 1 Specifications of Typical Van and Tricycle
SpecificationFreight Tricycle Diesel Van
Make Cycle Maximus Dodge Promaster
Price ($) 6,200a 34,000b
Battery size or tank size 864 watt-hoursa 24 galc
Range 30 mia 288 mic
Maximum speed 10 mphd 50 mphe
Gross vehicle weight 715 lba 8,900 lbf
Tare 165 lba 4,781 lbf
Payload 550 lba 4,119 lbf
aCycles Maximus (4).bCommercial truck trader (5).cBased on the fuel economy of 12 mpg (6, 7).dConway et al. (3).eTypical urban area maximum speed limit.fAOL Autos (8).
(a) (b)
FIGURE 1 Urban freight delivered by a freight tricycle: (a) tricycle parks off-street and (b) tricycles run on a dedicated bike lane. [Source: (a) http://www.neighborhoodnotes.com and (b) http://b-linepdx.com.]
78 Transportation Research Record 2410
n = number of customers; C = capacity of a vehicle, that is, number of customer visits
per vehicle; m = number of vehicles, that is, ratio of n to C or m = n/C; and A = size of service area (km2).
Vehicle capacity is assumed to be equal to the demand of at least six customers (C ≥ 6). The number of customers is assumed to be at least 24 (n ≥ 24). Daganzo’s approximation works better in elongated areas as the routes were formed following the strip strategy (17).
Figliozzi proposes a modification of the approximation model to deal with fewer customers per route, the vehicle routing problem (VRP) (18):
V kn m
nnA rml( ) = − +VRP 2
where VRP (V) is the average distance traveled for a fleet of V vehicles (km) and kl is the local service area coefficients.
The equation above can be used for distribution areas with ran-dom (R), clustered (C), and mixed random and clustered (RC) customers and time windows. Values of the kl coefficients can be calibrated empirically by using regression analysis (18).
Davis and Figliozzi propose a cost minimization model to compare electric and diesel trucks (16). The model includes the delivery distance, power consumption rate, and cost minimiza-tion model. The distances are estimated with the approximation vehicle routing problem model proposed by Figliozzi (18). A total of 243 scenarios are analyzed; these scenarios are a combina-tion of average distance from factories to customers, number of customers, customer service time, per customer demand weight, and service area size. The circumstances that make electric trucks viable are high annual utilization, low traffic speeds, numerous customer stops, reduced purchase price (tax subsidies), long plan-ning horizon, and more assistance on roadways such as high grade. Feng and Figliozzi examine the economic and technological factors affecting the cost competitiveness of electric commercial vehicles (19). They analyze emissions costs assuming a carbon dioxide (CO2) cost of $18/ton and find that CO2 emissions costs represent a small percentage of delivery costs.
Compared with delivery diesel or electric trucks, tricycles have unique characteristics. For example, tricycles can deliver and park faster than conventional vehicles. In addition, the minimum number of required vehicles and drivers is unlikely to be the same for tricycles and vans. To incorporate the unique characteristics of tricycles, it is necessary to introduce changes to the previous models used to compare vehicles with different engine and drivetrain types. The next section describes the cost and logistics model developed in this research.
Cost anD LogistiCs MoDeL
As in previous continuous approximation models the delivery tour is segmented into three legs: Leg A (a vehicle going from a depot to a service area), Leg B (the vehicle delivering goods in the service area), and Leg C (the vehicle returning to the depot).
Unlike in previous modeling efforts, a term has been added to account for time spent searching for and finding parking. In dense and congested commercial and downtown areas trucks sometimes cannot find available parking spaces when they reach their delivery
point; even if loading zones are provided, the available parking space(s) may be already taken. In that case, trucks may have to cir-cumnavigate delivery points to find available parking or wait until a loading zone is vacant. As a result, there is a penalty associated with the time and average distance traveled to find an available (empty) parking space. This penalty is directly added to the distance formula because the average extra parking distance to find an empty parking space is not dependent on the route itself.
ikn m
nnA rm n li
l
ii i= − + +Leg B 2 park
where lipark equals the average distance to find an available parking
space for vehicle type i. Similarly, a time penalty tipark associated with
parking a motorized vehicle and loading and unloading its cargo is included as a part of the average customer service time ti
serv in the tour duration equation (3).
Unlike previous cost comparisons, the model presented in this research includes driver costs. A previous research effort (e.g., comparing electric and diesel vehicles) assumed that the same number of vehicles and drivers were necessary. That is not the case in the present research because, for example, in some cases two vans may be replaced by three tricycles. The cost minimization model is shown below.
set
I = set of type i vehicles {van, tricycle}.
Decision variables
mi = number of vehicles of type i to serve all average daily customer demands.
Parameters
Cost
Citot = total cost for vehicle i ($),
cip = unit purchase cost for vehicle i ($/vehicle),
cir = unit resale cost for vehicle i ($/vehicle),
cie = unit energy cost for vehicle i [$/gal or $/kilowatt-hour
(kW-h)], ci
m = per mile maintenance cost for vehicle i ($/mi), ci
l = unit labor cost for vehicle i ($/h), and cCO2
= unit CO2 emissions cost ($/ton).
Inflation Factors
fd = discount factor (%) and fe = rate of inflation for diesel fuel (%).
Other Parameters
ei = per tour fuel or electricity consumed by vehicles of type i (gal/tour or kW-h/tour),
eicap = battery capacity for vehicle type i (kW-h),
Tipagornwong and Figliozzi 79
dyear = days of service per year, li = per tour distance traveled to serve route of vehicle i
(mi/tour), wd = average unit customer demand (lb), wi
cap = payload capacity for vehicle i (lb), vi
a = average speed of vehicle i going to service area (Leg A)(mph),
vib = average speed of vehicle i running inside service area
(Leg B) (mph), vi
c = average speed of vehicle i returning to depot (Leg C)(mph), eri = per mile fuel or electricity consumption rate of type i
vehicles (gal/mi or kW-h/mi), ri
CO2 = CO2 emission rate of vehicle type i (kg/gal or kg/kW-h),
tiserv = average time needed to serve customer from vehicle i (h),
ti = total tour time of vehicle i (h), tmax = maximum tour time window (h), and K = years in planning horizon.
objective
= − + +
+ +
minimize total cost purchase resale energy emission
maintenance labor (1)
C c m f c m f f c d m e
f c d m l r
f c d m l f c d m t
ipi i
dk
ri i
dk
ek
ei
k
Ki i
dk
k
Ki i i i
dk
k
K
mi i i
dk
k
K
li i i
∑
∑
∑ ∑
[ ]
[ ]
[ ] [ ]
[ ]
)
) )
(
( (
) ) )
)
) )
( ( (
(
( (
= − + + + +
+ +
+ + + +
− −
=
−
=
−
=
−
=
1 1 1
1 er
1 1
tot year1
1CO year CO
1year
1year
2 2
where k signifies the kth year in the planning horizon and K is the planning horizon length (years).
i
l rk
n m
nnA n
mr
li
l
ii
i= +
− ++ (2)
park
i
(3)park
servtr
v
kn m
nnA n
m v
r
vnt
li
ai
l
ii
ibi
ci
i= +
− ++ +
e li i i= er (4)
subject to
mnw
wi Ii d
i≥ ∀ ∈ (5)
cap
e e i Ii i≥ ∀ ∈ (6)cap
t t i Ii≥ ∀ ∈ (7)max
v i
v i
v i
v i
ai
ci
bi
i
{ }
{ }
{ }
{ }
≤ ∈
≤ ∈
≤ ∈
≤ ∈
60 mph truck
60 mph truck
30 mph truck
10 mph tricycle (8)
m i Ii ≥ ∀ ∈0 (9)
set of integers (10)mi ∈
Equation 1 is the objective function. Equation 2 is the length of a vehicle tour, starting from a depot, serving customers, and return-ing to the depot. Equations 3 and 4 are the time spent and the energy consumed for the whole vehicle tour. Equation 5 is the vehicle weight capacity. Equation 6 is the energy constraint. Equation 7 is the driver time constraint. Equation 8 sets the speed limits. Equations 9 and 10 restrict the number of vehicles to the set of positive integers.
Case stuDy
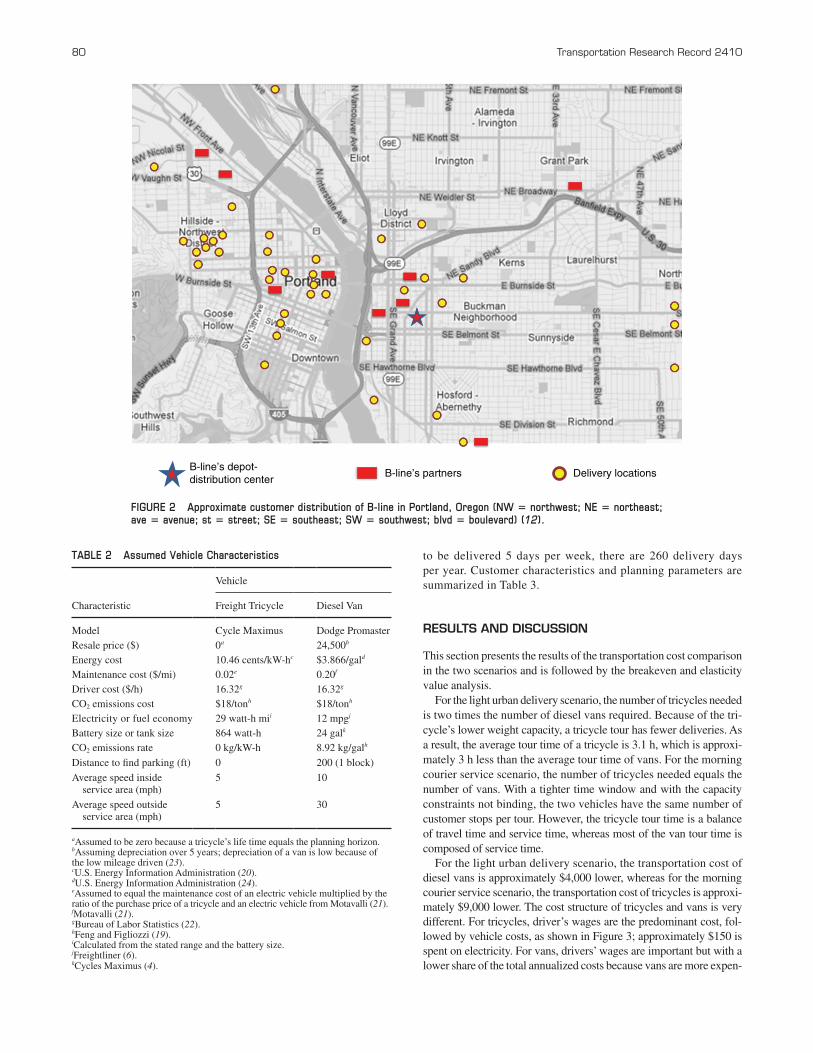
For a better understanding of the trade-offs between tricycles and vans, an attempt was made to use real-world data from Portland. The case study is based on the delivery area and customers of an existing tricycle delivery company, B-line (http://b-linepdx.com/). Most of the customers are located in or close to downtown Portland, as shown in Figure 2. The goal is to understand the key trade-offs and factors that affect competition between tricycles and delivery vans. Breakeven points and cost elasticity are then studied by using data from public data sources associated with B-line delivery such as B-line (12) and Martin (15). This modeling exercise is not meant to represent the variability of customer demand or routes or more complex route structures such as combined delivery and pickup.
Only goods delivered from the distribution center to shops and retail stores are modeled. According to the spatial distribution of the delivery locations, the locations could be segmented into three sub-service areas: Hillside–Northwest Portland, downtown Portland, and East Portland. B-line averages 80 deliveries per day, and it is further assumed that the average number of deliveries is proportional to the number of the delivery locations in each subservice area (15).
The products of B-line’s partners are assumed to arrive at B-line’s depot and then tricycles or vans deliver the cargo. As discussed previ-ously, the service time per customer using a tricycle is likely to be less than that of a van because of parking availability and the ability of the tricycle to get closer to the customer delivery area. The assumed char-acteristics of the two vehicle types are summarized in Table 2. These characteristics are meant to represent a typical base case scenario; in a later section the characteristics will be varied and their elasticity stud-ied. On average, eight to 10 tricycle tours are used to deliver goods to 80 customers per day (15).
Two distinct base case scenarios are analyzed: (a) a cargo capacity– constrained scenario and (b) a time window–constrained scenario; the two scenarios require the same number of tours and tricycles. In the former scenario the average customer demand weight is 50 lb; in the latter the maximum time window is 2 to 4 h. The first sce-nario, light urban delivery, is meant to represent food and office supplies delivery. The second scenario, morning courier service, is meant to represent delivery in the morning of more time-sensitive but smaller packages.
Other parameters used for comparing diesel vans and tricy-cles are planning horizon and delivery days per year. The owner-ship time of delivery vehicles is approximately 12 years (25, 26). However, the ownership time of freight tricycles is usually much shorter and assumed to be 5 years. As a result, the plan-ning horizon is set to equal 5 years, but the resale value of the diesel van after 5 years of relatively low utilization and mileage is taken into account. In addition, because goods are assumed
80 Transportation Research Record 2410
to be delivered 5 days per week, there are 260 delivery days per year. Customer characteristics and planning parameters are summarized in Table 3.
Results and discussion
This section presents the results of the transportation cost comparison in the two scenarios and is followed by the breakeven and elasticity value analysis.
For the light urban delivery scenario, the number of tricycles needed is two times the number of diesel vans required. Because of the tri-cycle’s lower weight capacity, a tricycle tour has fewer deliveries. As a result, the average tour time of a tricycle is 3.1 h, which is approxi-mately 3 h less than the average tour time of vans. For the morning courier service scenario, the number of tricycles needed equals the number of vans. With a tighter time window and with the capacity constraints not binding, the two vehicles have the same number of customer stops per tour. However, the tricycle tour time is a balance of travel time and service time, whereas most of the van tour time is composed of service time.
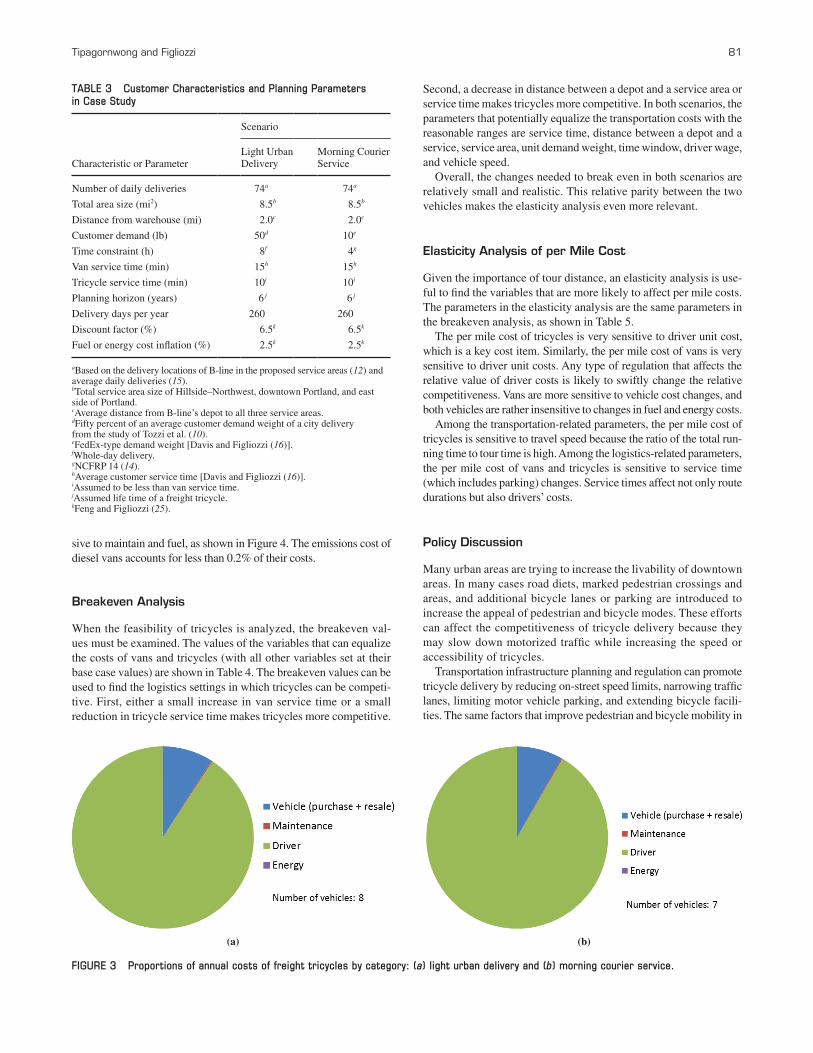
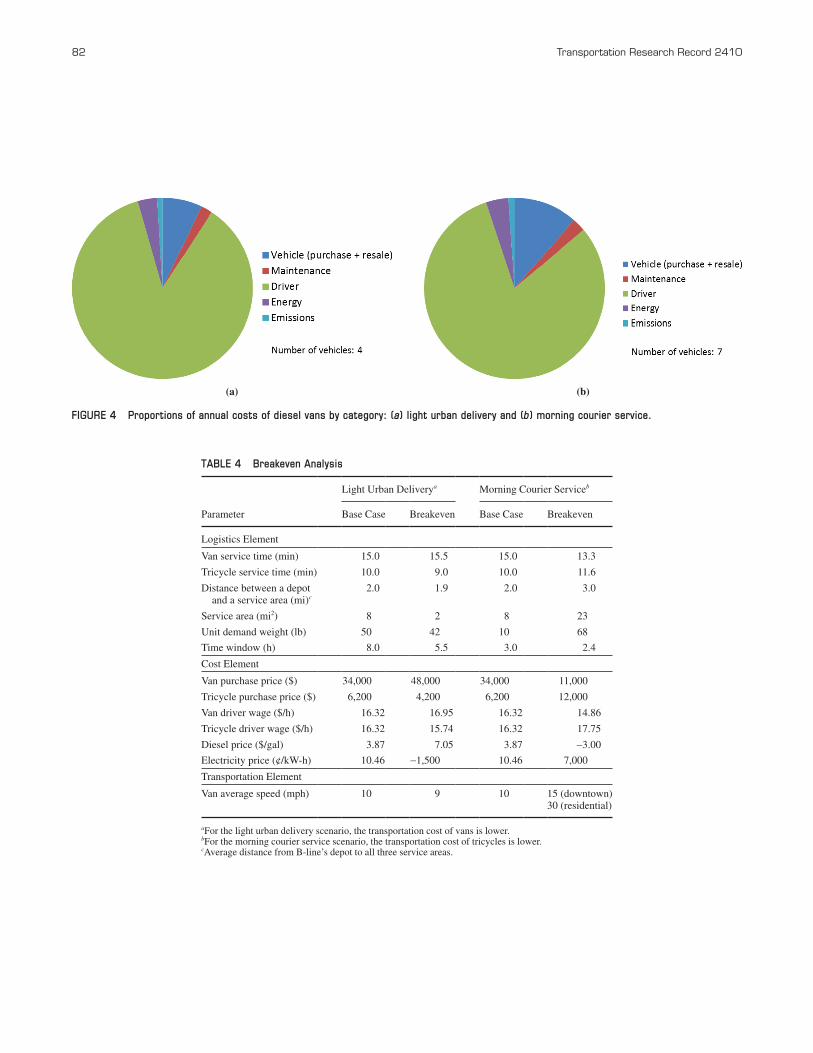
For the light urban delivery scenario, the transportation cost of diesel vans is approximately $4,000 lower, whereas for the morning courier service scenario, the transportation cost of tricycles is approxi-mately $9,000 lower. The cost structure of tricycles and vans is very different. For tricycles, driver’s wages are the predominant cost, fol-lowed by vehicle costs, as shown in Figure 3; approximately $150 is spent on electricity. For vans, drivers’ wages are important but with a lower share of the total annualized costs because vans are more expen-
B-line’s depot-distribution center
B-line’s partners Delivery locations
FIGURE 2 Approximate customer distribution of B-line in Portland, Oregon (NW 5 northwest; NE 5 northeast; ave 5 avenue; st 5 street; SE 5 southeast; SW 5 southwest; blvd 5 boulevard) (12).
TABLE 2 Assumed Vehicle Characteristics
Vehicle
Characteristic Freight Tricycle Diesel Van
Model Cycle Maximus Dodge PromasterResale price ($) 0a 24,500b
Energy cost 10.46 cents/kW-hc $3.866/gald
Maintenance cost ($/mi) 0.02e 0.20f
Driver cost ($/h) 16.32g 16.32g
CO2 emissions cost $18/tonh $18/tonh
Electricity or fuel economy 29 watt-h mii 12 mpgj
Battery size or tank size 864 watt-h 24 galk
CO2 emissions rate 0 kg/kW-h 8.92 kg/galh
Distance to find parking (ft) 0 200 (1 block)
Average speed inside service area (mph)
5 10
Average speed outside service area (mph)
5 30
aAssumed to be zero because a tricycle’s life time equals the planning horizon.bAssuming depreciation over 5 years; depreciation of a van is low because of the low mileage driven (23).cU.S. Energy Information Administration (20).dU.S. Energy Information Administration (24).eAssumed to equal the maintenance cost of an electric vehicle multiplied by the ratio of the purchase price of a tricycle and an electric vehicle from Motavalli (21).fMotavalli (21).gBureau of Labor Statistics (22).hFeng and Figliozzi (19).iCalculated from the stated range and the battery size.jFreightliner (6).kCycles Maximus (4).
Tipagornwong and Figliozzi 81
sive to maintain and fuel, as shown in Figure 4. The emissions cost of diesel vans accounts for less than 0.2% of their costs.
Breakeven Analysis
When the feasibility of tricycles is analyzed, the breakeven val-ues must be examined. The values of the variables that can equalize the costs of vans and tricycles (with all other variables set at their base case values) are shown in Table 4. The breakeven values can be used to find the logistics settings in which tricycles can be competi-tive. First, either a small increase in van service time or a small reduction in tricycle service time makes tricycles more competitive.
Second, a decrease in distance between a depot and a service area or service time makes tricycles more competitive. In both scenarios, the parameters that potentially equalize the transportation costs with the reasonable ranges are service time, distance between a depot and a service, service area, unit demand weight, time window, driver wage, and vehicle speed.
Overall, the changes needed to break even in both scenarios are relatively small and realistic. This relative parity between the two vehicles makes the elasticity analysis even more relevant.
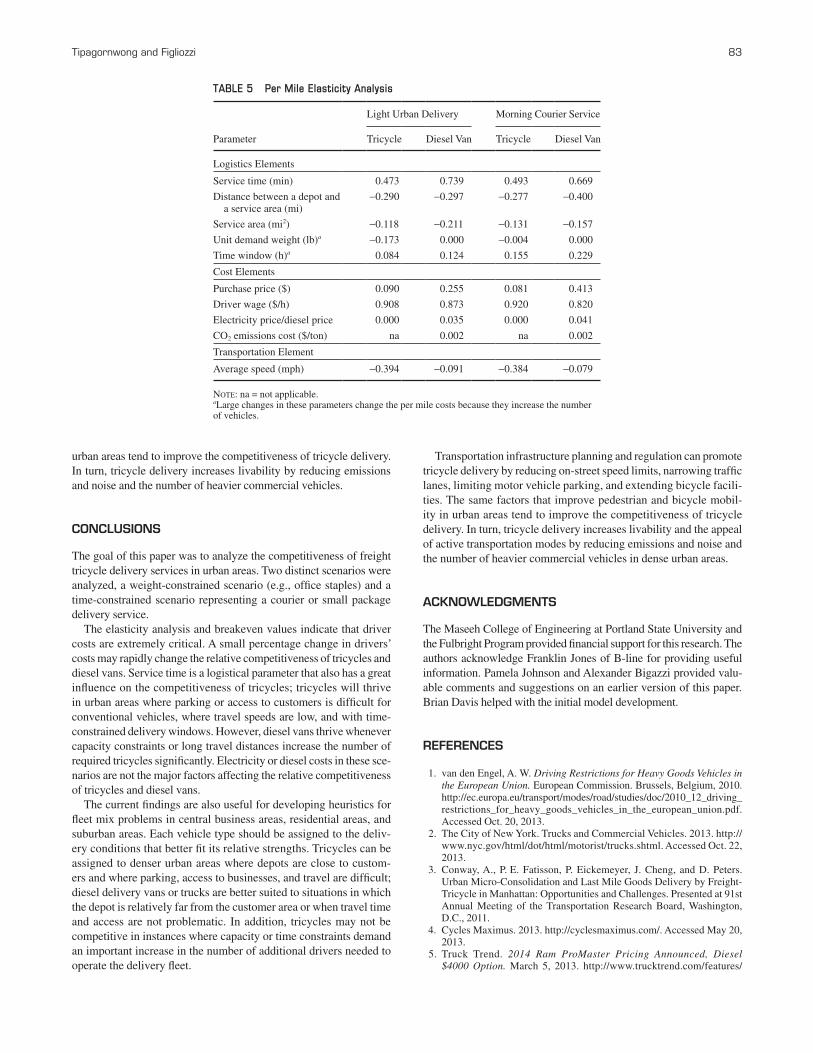
Elasticity Analysis of per Mile Cost
Given the importance of tour distance, an elasticity analysis is use-ful to find the variables that are more likely to affect per mile costs. The parameters in the elasticity analysis are the same parameters in the breakeven analysis, as shown in Table 5.
The per mile cost of tricycles is very sensitive to driver unit cost, which is a key cost item. Similarly, the per mile cost of vans is very sensitive to driver unit costs. Any type of regulation that affects the relative value of driver costs is likely to swiftly change the relative competitiveness. Vans are more sensitive to vehicle cost changes, and both vehicles are rather insensitive to changes in fuel and energy costs.
Among the transportation-related parameters, the per mile cost of tricycles is sensitive to travel speed because the ratio of the total run-ning time to tour time is high. Among the logistics-related parameters, the per mile cost of vans and tricycles is sensitive to service time (which includes parking) changes. Service times affect not only route durations but also drivers’ costs.
Policy Discussion
Many urban areas are trying to increase the livability of downtown areas. In many cases road diets, marked pedestrian crossings and areas, and additional bicycle lanes or parking are introduced to increase the appeal of pedestrian and bicycle modes. These efforts can affect the competitiveness of tricycle delivery because they may slow down motorized traffic while increasing the speed or accessibility of tricycles.
Transportation infrastructure planning and regulation can promote tricycle delivery by reducing on-street speed limits, narrowing traffic lanes, limiting motor vehicle parking, and extending bicycle facili-ties. The same factors that improve pedestrian and bicycle mobility in
TABLE 3 Customer Characteristics and Planning Parameters in Case Study
Scenario
Characteristic or ParameterLight Urban Delivery
Morning Courier Service
Number of daily deliveries 74a 74a
Total area size (mi2) 8.5b 8.5b
Distance from warehouse (mi) 2.0c 2.0c
Customer demand (lb) 50d 10e
Time constraint (h) 8f 4g
Van service time (min) 15h 15h
Tricycle service time (min) 10i 10i
Planning horizon (years) 6 j 6 j
Delivery days per year 260 260
Discount factor (%) 6.5k 6.5k
Fuel or energy cost inflation (%) 2.5k 2.5k
aBased on the delivery locations of B-line in the proposed service areas (12) and average daily deliveries (15).bTotal service area size of Hillside–Northwest, downtown Portland, and east side of Portland.cAverage distance from B-line’s depot to all three service areas.dFifty percent of an average customer demand weight of a city delivery from the study of Tozzi et al. (10).eFedEx-type demand weight [Davis and Figliozzi (16)].fWhole-day delivery.gNCFRP 14 (14).hAverage customer service time [Davis and Figliozzi (16)].iAssumed to be less than van service time.jAssumed life time of a freight tricycle.kFeng and Figliozzi (25).
(a) (b)
FIGURE 3 Proportions of annual costs of freight tricycles by category: (a) light urban delivery and (b) morning courier service.
82 Transportation Research Record 2410
(a) (b)
FIGURE 4 Proportions of annual costs of diesel vans by category: (a) light urban delivery and (b) morning courier service.
TABLE 4 Breakeven Analysis
Light Urban Deliverya Morning Courier Serviceb
Parameter Base Case Breakeven Base Case Breakeven
Logistics Element
Van service time (min) 15.0 15.5 15.0 13.3
Tricycle service time (min) 10.0 9.0 10.0 11.6
Distance between a depot and a service area (mi)c
2.0 1.9 2.0 3.0
Service area (mi2) 8 2 8 23
Unit demand weight (lb) 50 42 10 68
Time window (h) 8.0 5.5 3.0 2.4
Cost Element
Van purchase price ($) 34,000 48,000 34,000 11,000
Van average speed (mph) 10 9 10 15 (downtown)30 (residential)
aFor the light urban delivery scenario, the transportation cost of vans is lower.bFor the morning courier service scenario, the transportation cost of tricycles is lower.cAverage distance from B-line’s depot to all three service areas.
Tipagornwong and Figliozzi 83
urban areas tend to improve the competitiveness of tricycle delivery. In turn, tricycle delivery increases livability by reducing emissions and noise and the number of heavier commercial vehicles.
ConCLusions
The goal of this paper was to analyze the competitiveness of freight tricycle delivery services in urban areas. Two distinct scenarios were analyzed, a weight-constrained scenario (e.g., office staples) and a time-constrained scenario representing a courier or small package delivery service.
The elasticity analysis and breakeven values indicate that driver costs are extremely critical. A small percentage change in drivers’ costs may rapidly change the relative competitiveness of tricycles and diesel vans. Service time is a logistical parameter that also has a great influence on the competitiveness of tricycles; tricycles will thrive in urban areas where parking or access to customers is difficult for conventional vehicles, where travel speeds are low, and with time-constrained delivery windows. However, diesel vans thrive whenever capacity constraints or long travel distances increase the number of required tricycles significantly. Electricity or diesel costs in these sce-narios are not the major factors affecting the relative competitiveness of tricycles and diesel vans.
The current findings are also useful for developing heuristics for fleet mix problems in central business areas, residential areas, and suburban areas. Each vehicle type should be assigned to the deliv-ery conditions that better fit its relative strengths. Tricycles can be assigned to denser urban areas where depots are close to custom-ers and where parking, access to businesses, and travel are difficult; diesel delivery vans or trucks are better suited to situations in which the depot is relatively far from the customer area or when travel time and access are not problematic. In addition, tricycles may not be competitive in instances where capacity or time constraints demand an important increase in the number of additional drivers needed to operate the delivery fleet.
Transportation infrastructure planning and regulation can promote tricycle delivery by reducing on-street speed limits, narrowing traffic lanes, limiting motor vehicle parking, and extending bicycle facili-ties. The same factors that improve pedestrian and bicycle mobil-ity in urban areas tend to improve the competitiveness of tricycle delivery. In turn, tricycle delivery increases livability and the appeal of active transportation modes by reducing emissions and noise and the number of heavier commercial vehicles in dense urban areas.
aCknowLeDgMents
The Maseeh College of Engineering at Portland State University and the Fulbright Program provided financial support for this research. The authors acknowledge Franklin Jones of B-line for providing useful information. Pamela Johnson and Alexander Bigazzi provided valu-able comments and suggestions on an earlier version of this paper. Brian Davis helped with the initial model development.
reFerenCes
1. van den Engel, A. W. Driving Restrictions for Heavy Goods Vehicles in the European Union. European Commission. Brussels, Belgium, 2010. http://ec.europa.eu/transport/modes/road/studies/doc/2010_12_driving_ restrictions_for_heavy_goods_vehicles_in_the_european_union.pdf. Accessed Oct. 20, 2013.
2. The City of New York. Trucks and Commercial Vehicles. 2013. http://www.nyc.gov/html/dot/html/motorist/trucks.shtml. Accessed Oct. 22, 2013.
3. Conway, A., P. E. Fatisson, P. Eickemeyer, J. Cheng, and D. Peters. Urban Micro-Consolidation and Last Mile Goods Delivery by Freight-Tricycle in Manhattan: Opportunities and Challenges. Presented at 91st Annual Meeting of the Transportation Research Board, Washington, D.C., 2011.
4. Cycles Maximus. 2013. http://cyclesmaximus.com/. Accessed May 20, 2013.
9. Wilson, D., J. Papadopoulos, and F. R. Whitt. Bicycling Science. MIT Press, Cambridge, Mass., 2004.
10. Tozzi, M., M. V. Corazza, and A. Musso. Recurring Patterns of Com-mercial Vehicles Movements in Urban Areas: The Parma Case Study. Procedia—Social and Behavioral Sciences, Vol. 87, 2013, pp. 306–320.
11. Maes, J., and T. Vanelslander. The Use of Bicycle Messengers in the Logis-tics Chain, Concepts Further Revised. Procedia—Social and Behavioral Sciences, Vol. 39, 2012, pp. 409–423.
12. B-line. http://b-linepdx.com/. Accessed Nov. 18, 2012.13. Figliozzi, M. A. Planning Approximations to the Average Length of
Vehicle Routing Problems with Time Window Constraints. Transporta-tion Research Part B, Vol. 43, No. 4, 2009, pp. 438–447.
14. NCFRP Report 14: Guidebook for Understanding Urban Goods Move-ment. Transportation Research Board of the National Academies, Wash-ington, D.C., 2012. http://www.onlinepubs.trb.org/onlinepubs/ncfrp/ncfrp_rpt_014.pdf. Accessed Sept. 21, 2012.
15. Martin, C. In Cargo Delivery, the Three-Wheelers That Could. New York Times, July 6, 2013.
16. Davis, B. A., and M. A. Figliozzi. A Methodology to Evaluate the Com-petitiveness of Electric Delivery Trucks. Transportation Research Part E, Vol. 49, No. 1, 2013, pp. 8–49.
17. Daganzo, C. F. The Distance Traveled to Visit N Points with a Maximum of C Stops per Vehicle: An Analytical Model and an Application. Trans-portation Science, Vol. 18, No. 4, 1984, pp. 331–350.
18. Figliozzi, M. A. Planning Approximations to the Average Length of Vehicle Routing Problems with Varying Customer Demands and Routing Constraints. In Transportation Research Record: Journal of the Transpor-
tation Research Board, No. 2089, Transportation Research Board of the National Academies, Washington, D.C., 2008, pp. 1–8.
19. Feng, W., and M. Figliozzi. An Economic and Technological Analysis of the Key Factors Affecting the Competitiveness of Electric Commercial Vehicles: A Case Study from the USA Market. Transportation Research Part C, Vol. 26, 2013, pp. 135–145.
20. U.S. Energy Information Administration. Electric Sales, Revenue, and Average Price. Sept. 27, 2012. http://www.eia.gov/electricity/sales_revenue_price/pdf/table4.pdf. Accessed May 14, 2013.
21. Motavalli, J. Frito-Lay Adds Electric Trucks to Its Fleet. New York Times, Sept. 8, 2010.
22. Bureau of Labor Statistics, U.S. Department of Labor. Occupational Employment and Wages. 2013. http://www.bls.gov/oes/current/oes533 033.htm. Accessed May 14, 2013.
23. Commercial Truck Trader. Dodge Sprinter Van for Sale. http://www.commercialtrucktrader.com/Dodge-Sprinter-Van-For-Sale/search-results?category=Sprinter+Van|644245440&make=DODGE|2310048&type=light. Accessed July 15, 2013.
24. U.S. Energy Information Administration. Gasoline and Diesel Fuel Update. 2013. http://www.eia.doe.gov/petroleum/gasdiesel/. Accessed May 14, 2013.
25. Feng, W., and M. A. Figliozzi. Conventional vs Electric Commercial Vehi-cle Fleets: A Case Study of Economic and Technological Factors Affecting the Competitiveness of Electric Vehicles in the USA. Procedia—Social and Behavioral Sciences, Vol. 39, 2012, pp. 702–711.
26. Union of Concerned Scientists. Saving Fuel, Saving Money: An Assess-ment of Fleet Cost Savings from High Efficiency Trucks. Cambridge, Mass., 2010. http://www.ucsusa.org/assets/documents/clean_vehicles/Saving-Fuel-Saving-Money-Assessment-of-Fleet-Cost-Savings-from-High-Efficiency-Trucks.pdf. Accessed July 19, 2013.
Any omissions or mistakes are the responsibility of the authors.
The Freight Transportation Planning and Logistics Committee peer-reviewed this paper.