Journal of Industrial Engineering, Scientific Journal on Research and Application of Industrial System, Vol. 2, No.1, Maret 2017: 44-55 44 Analysis of Customer Satisfaction in PT. X Using Service Quality Method and Importance-Performance Analysis Rai N. Kodrat 1 , Burhan Primanintyo 2 1,2) Industrial Engineering Department, Faculty of Engineering, President University Jl. Ki Hajar Dewantara Kota Jababeka,Cikarang, Bekasi - Indonesia 17550 Email: [email protected], [email protected]ABSTRACT PT. X is a service company that focus on logistic and transportation. Fleet department is the department that responsible to handle, arrange, and monitor the delivery service in PT. X. It means that Fleet department is also responsible if there is any customer complaint. Increasing number in customer complaint means that the customer is not satisfy with the delivery service provided by the company. This research is conducted in order to determine what are the factors that influence customer satisfaction. By using Service Quality method, Gap Analysis, and Importance-Performance Analysis, the result will be in a form of conclusion and recommendation. The result for improvements are driver and truck safety appearance, easiness of contacting the company when there is a complaint, and information regarding with the delivery service. After determining the factors that most influencing customer satisfaction, Service Blueprint and Check List is made in order to improve and control the factors occurred. Keywords: Fleet, Service Quality, Gap Analysis, Importance-Performance Analysis, Service Blueprint, Check List ABSTRAK PT. X merupakan perusahaan jasa yang bergerak dalam bidang logistik dan trasnportasi. Salah satu departemen yang dimiliki adalah Fleet department yang bertanggung jawab untuk menangani, mengatur dan memonitor pengiriman, termasuk juga mengangani keluhan pelanggan. Saat ini, terjadi masalah dengan tingginya keluhan pelanggan dan hal ini menunjukkan abahwa pelanggan tidak puas dengan layanan pengiriman. Oleh karena itu, penelitian ini bertujuan untuk menentukan faktor-faktor yang mempengaruhi kepuasan pelanggan. Pada penelitian ini akan digunakan Service Quality, Gap Analysis, dan Importance-Performance Analysis. Adapun hasilnya menunjukkan bahwa ada beberapa faktor yang harus ditingkatkan yaitu sopir dan keselamatan truk , kemudahaan dalam menghubungi perusahaan jika terjadi keluhan, ketersediaan informasi pengiriman. Selanjuntnya Service Blueprint dan Check List disusun untuk perbaikan dan pengontrolan. Kata Kunci: Fleet, Service Quality, Gap Analysis, Importance-Performance Analysis, Service Blueprint, Check List 1. Introduction PT. X is one of the service company which focuses on logistic and transportation. Like other companies, PT. X needs to determine whether their service has already met customer expectation and thus resulting in customer satisfaction. In PT. X, Fleet Division is the one who handle, arrange, and monitor the truck and the driver that in charge in delivery. Sometimes, there was a complaint that mostly about delayed delivery. The cause of the delayed delivery is truck breakdown that influenced customer satisfactory towards the company’s service. Beside truck breakdown, there are also some factors that affect customer satisfaction which are incomplete delivery documents, truck appearance that is not as promised, and any other reasons. In 2015, there were 7 months that the number of complaints exceed the maximum number of complaints that were set by company. This highlights that there should be an improvement which can satisfy the customer. To identify what improvement that can be done, a research should be conducted to know what are the factors that affect the customer satisfactory most. In the end of this research, it is hoped that after the factors have been identified, the improvement can be made and implemented therefore there will be no further exceeding number of complaints.
Transcript
Journal of Industrial Engineering, Scientific Journal on Research and Application of Industrial System, Vol. 2, No.1, Maret 2017: 44-55
44
Analysis of Customer Satisfaction in PT. X Using Service Quality Method and Importance-Performance Analysis
Rai N. Kodrat1, Burhan Primanintyo2
1,2) Industrial Engineering Department, Faculty of Engineering, President University Jl. Ki Hajar Dewantara
PT. X is a service company that focus on logistic and transportation. Fleet department is the department that responsible to handle, arrange, and monitor the delivery service in PT. X. It means that Fleet department is also responsible if there is any customer complaint. Increasing number in customer complaint means that the customer is not satisfy with the delivery service provided by the company. This research is conducted in order to determine what are the factors that influence customer satisfaction. By using Service Quality method, Gap Analysis, and Importance-Performance Analysis, the result will be in a form of conclusion and recommendation. The result for improvements are driver and truck safety appearance, easiness of contacting the company when there is a complaint, and information regarding with the delivery service. After determining the factors that most influencing customer satisfaction, Service Blueprint and Check List is made in order to improve and control the factors occurred.
Keywords: Fleet, Service Quality, Gap Analysis, Importance-Performance Analysis, Service Blueprint, Check List
ABSTRAK
PT. X merupakan perusahaan jasa yang bergerak dalam bidang logistik dan trasnportasi. Salah satu departemen yang dimiliki adalah Fleet department yang bertanggung jawab untuk menangani, mengatur dan memonitor pengiriman, termasuk juga mengangani keluhan pelanggan. Saat ini, terjadi masalah dengan tingginya keluhan pelanggan dan hal ini menunjukkan abahwa pelanggan tidak puas dengan layanan pengiriman. Oleh karena itu, penelitian ini bertujuan untuk menentukan faktor-faktor yang mempengaruhi kepuasan pelanggan. Pada penelitian ini akan digunakan Service Quality, Gap Analysis, dan Importance-Performance Analysis. Adapun hasilnya menunjukkan bahwa ada beberapa faktor yang harus ditingkatkan yaitu sopir dan keselamatan truk , kemudahaan dalam menghubungi perusahaan jika terjadi keluhan, ketersediaan informasi pengiriman. Selanjuntnya Service Blueprint dan Check List disusun untuk perbaikan dan pengontrolan.
Kata Kunci: Fleet, Service Quality, Gap Analysis, Importance-Performance Analysis, Service Blueprint, Check List
1. Introduction
PT. X is one of the service company which focuses on logistic and transportation. Like other companies, PT. X needs to determine whether their service has already met customer expectation and thus resulting in customer satisfaction. In PT. X, Fleet Division is the one who handle, arrange, and monitor the truck and the driver that in charge in delivery. Sometimes, there was a complaint that mostly about delayed delivery. The cause of the delayed delivery is truck breakdown that influenced customer satisfactory towards the company’s service. Beside truck breakdown, there are also some factors that affect customer satisfaction which are incomplete delivery documents, truck appearance that is not as promised, and any other reasons. In 2015, there were 7 months that the number of complaints exceed the maximum number of complaints that were set by company. This highlights that there should be an improvement which can satisfy the customer. To identify what improvement that can be done, a research should be conducted to know what are the factors that affect the customer satisfactory most. In the end of this research, it is hoped that after the factors have been identified, the improvement can be made and implemented therefore there will be no further exceeding number of complaints.
The methods that used in this research are Population and Sample, Validity and Reliability Test, Service Quality, Gap Analysis, and Importance-Performance Analysis. 2.1 Population and Sample
Population is commonly defined as an area consisting of objects with qualities and characteristics that become the object of research, to be studied and concluded. Sample is a part of observed population. Slovian’s formula is used to calculate appropriate sample size from a population, while resulting to determine whether the sample is taken or not and appropriate size and diversity of the sample, where:
(1)
N = Total Population n = Total Sample e = Error Tolerance 2.2 Validity and Reliability Test 2.2.1 Validity Test
Validity is the extent to which a test measures what it is supposed to measure. Testing the validity of these items can be done by using Pearson Product Moment Correlation test where:
( ) ( )( )
√* ( ) * ( ) (2)
= Correlation Coefficient
= Total Sample = Total Score X = Total Score Y 2.2.2 Reliability Test
Dependable measurement is required to do a research. Due to its reliability, the measurements are repeatable. Random influence which tends to distract the measurements affecting the occasions or circumstances, however, is an error source (Nunnally, 1978). Reliability is the degree to which a test consistently measures whatever it measures (Gay, 1987). In this study, reliability is implemented by using Cronbach’s alpha where:
(
) (
) (3)
= Cronbach’s alpha = Total Question Item = Question Item Variance = Total Score Variance
2.3 Service Quality
Service Quality was developed by Parasuraman with 10 dimensions which are tangibles, reliability, responsiveness, communication, credibility, security, competence, courtesy, understanding the customer, and access, (Parasuraman et al., 1985) but later these dimensions were reduced to 5 because some dimensions were overlapped (communication, credibility, security, competence, courtesy, understanding customers and access) and they included (Parasuraman et al., 1988,: tangible, reliability, responsiveness, assurance, and empathy. 2.4 Gap Analysis
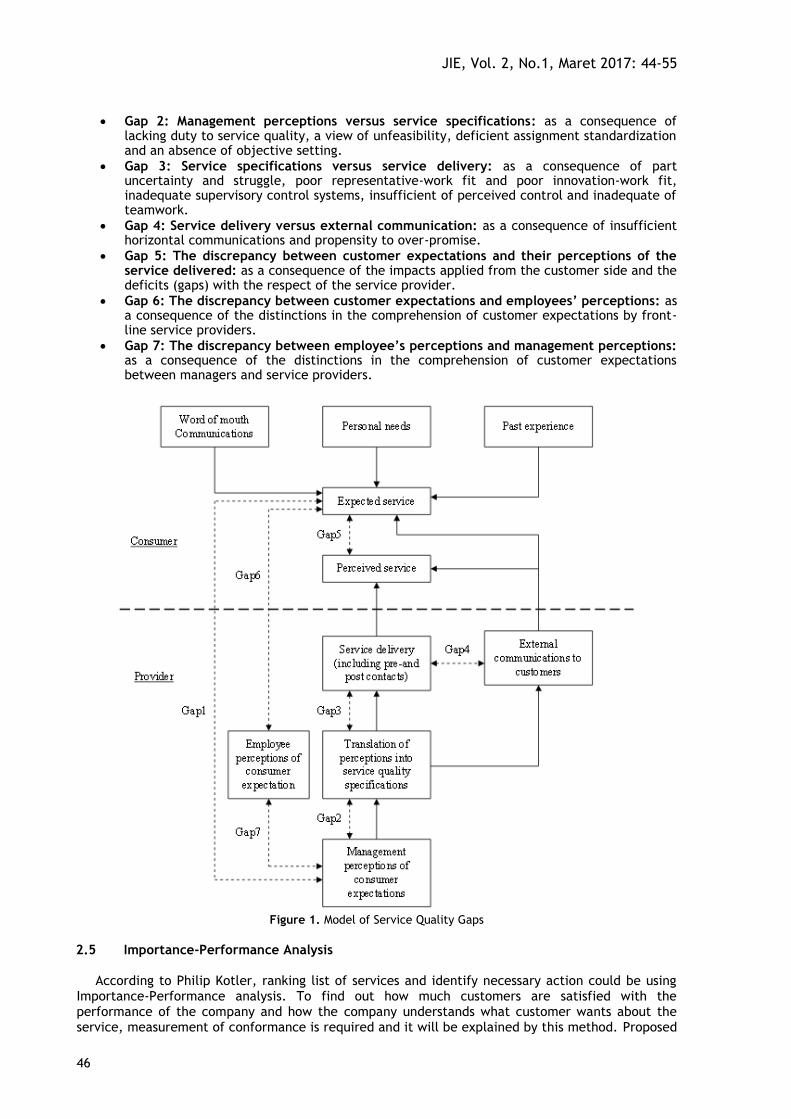
Gap analysis that used is the extension of the service quality. There are 7 gaps and each of the gap has the description below:
Gap 1: Customers’ expectations versus management perceptions: as a consequence of the absence of a marketing research orientation, insufficient upward communication and too many layers of management.
JIE, Vol. 2, No.1, Maret 2017: 44-55
46
Gap 2: Management perceptions versus service specifications: as a consequence of lacking duty to service quality, a view of unfeasibility, deficient assignment standardization and an absence of objective setting.
Gap 3: Service specifications versus service delivery: as a consequence of part uncertainty and struggle, poor representative-work fit and poor innovation-work fit, inadequate supervisory control systems, insufficient of perceived control and inadequate of teamwork.
Gap 4: Service delivery versus external communication: as a consequence of insufficient horizontal communications and propensity to over-promise.
Gap 5: The discrepancy between customer expectations and their perceptions of the service delivered: as a consequence of the impacts applied from the customer side and the deficits (gaps) with the respect of the service provider.
Gap 6: The discrepancy between customer expectations and employees’ perceptions: as a consequence of the distinctions in the comprehension of customer expectations by front-line service providers.
Gap 7: The discrepancy between employee’s perceptions and management perceptions: as a consequence of the distinctions in the comprehension of customer expectations between managers and service providers.
Figure 1. Model of Service Quality Gaps
2.5 Importance-Performance Analysis
According to Philip Kotler, ranking list of services and identify necessary action could be using Importance-Performance analysis. To find out how much customers are satisfied with the performance of the company and how the company understands what customer wants about the service, measurement of conformance is required and it will be explained by this method. Proposed
JIE, Vol. 2, No.1, Maret 2017: 44-55
47
and introduced by Martilla and James (1977), Importance-Performance Analysis is a set of service attributes which based on the level of customer’s interest and associated with evaluated services. This analysis used the comparison between customer’s assessment of the importance of service quality level and service quality performance. The results will be explained in Importance-Performance Analysis after the customer done the assessment. It is used to determine average level that has been determined to become a constraint of high and low performances. Importance-Performance Matrix is divided into four quadrants based on the importance of performance measurement results as shown in the figure below.
Figure 2. Cartesian Diagram
Strategies that can be made regards to the respective positions variable on the four quadrants
can be explained as follows: 1. Quadrant 1 (Concentrate These)
This area contains the factors that have not met customers’ expectations and these factors are considered critical factors. Improving variables in this area is a must.
2. Quadrant 2 (Keep Up the Good Work) This area contains that factors already met customers’ expectation which leads to quite high level of satisfaction and the factors are considered important by the customers. Retaining variables in this area is a must because these variables make excellent products or services from customers’ point of view.
3. Quadrant 3 (Low Priority) This area contains factors that is not too special and considered less important by customers. Reconsidering enhancement variables in this quadrant is suggested because of very small amount of perceived benefits by the customer.
4. Quadrant 4 (Possible Overkill) This area contains factors that deemed too excessive and considered less important by the customers. Reducing variables in this quadrant is suggested to save costs for the company.
3. Result and Discussion
The explanation below will explain the result of this research: 3.1 Problem Identification
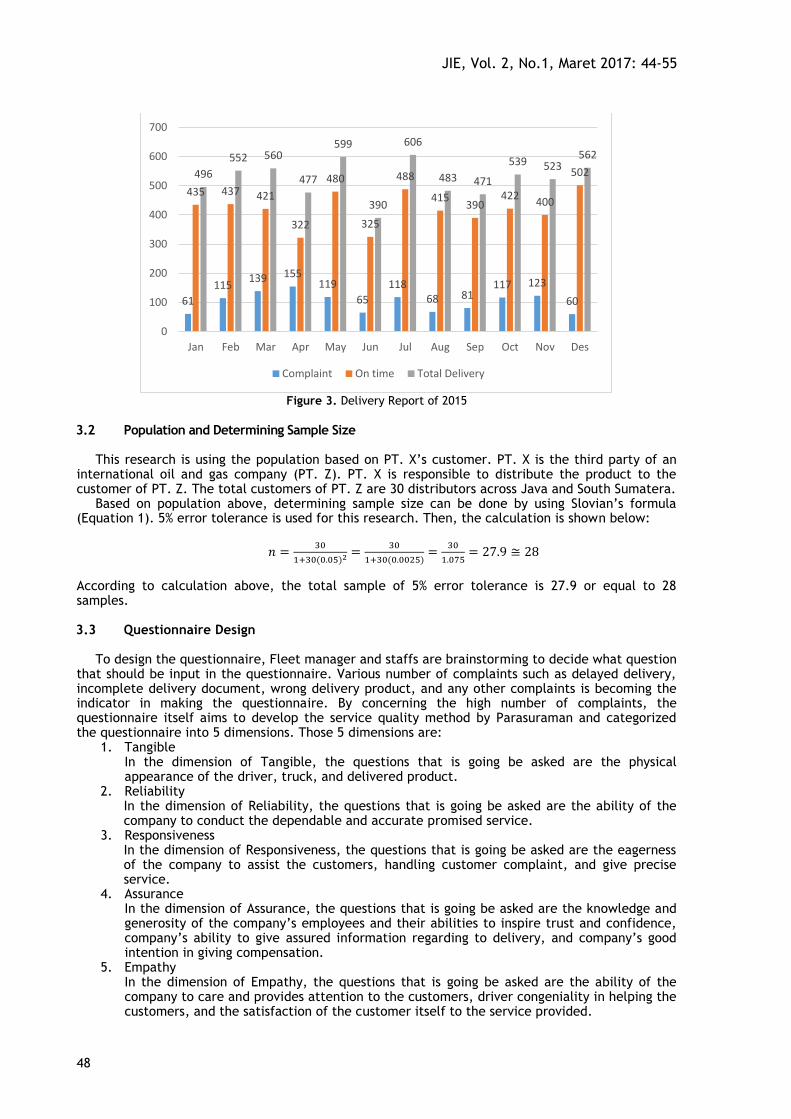
Fleet division is a division that responsible to handle, arrange, and monitor the delivery service to the customers in accordance with company standards. In 2015, PT. X is having a deal with PT. Z in project Y to deliver PT. Z’s products to their customers. Approximately, there are 30 customers all across Java and South Sumatera. To reach these customers, PT. X is using 4 types of truck with different capacities, which are CDE 2 tons, CDD 4 tons, Fuso 8 tons, and BU 16 tons. According to Figure 3, the number of complaints are exceeding the maximum number of complaints that has been set by the company (100 complaints per month).
To identify what factors that influence customer satisfaction, Fleet manager and staffs are brainstorming to design a questionnaire. This research is expected to know the satisfaction of customer towards PT. X’s delivery service quality. Therefore, it can be known which factor that has big influence on high number of complaints and later can come up with improvement for the factor.
Very Important
Very Unimportant
Very
Sati
sfie
d
Very
Unsa
tisf
ied
JIE, Vol. 2, No.1, Maret 2017: 44-55
48
Figure 3. Delivery Report of 2015
3.2 Population and Determining Sample Size
This research is using the population based on PT. X’s customer. PT. X is the third party of an international oil and gas company (PT. Z). PT. X is responsible to distribute the product to the customer of PT. Z. The total customers of PT. Z are 30 distributors across Java and South Sumatera.
Based on population above, determining sample size can be done by using Slovian’s formula (Equation 1). 5% error tolerance is used for this research. Then, the calculation is shown below:
( )
( )
According to calculation above, the total sample of 5% error tolerance is 27.9 or equal to 28 samples. 3.3 Questionnaire Design
To design the questionnaire, Fleet manager and staffs are brainstorming to decide what question that should be input in the questionnaire. Various number of complaints such as delayed delivery, incomplete delivery document, wrong delivery product, and any other complaints is becoming the indicator in making the questionnaire. By concerning the high number of complaints, the questionnaire itself aims to develop the service quality method by Parasuraman and categorized the questionnaire into 5 dimensions. Those 5 dimensions are:
1. Tangible In the dimension of Tangible, the questions that is going be asked are the physical appearance of the driver, truck, and delivered product.
2. Reliability In the dimension of Reliability, the questions that is going be asked are the ability of the company to conduct the dependable and accurate promised service.
3. Responsiveness In the dimension of Responsiveness, the questions that is going be asked are the eagerness of the company to assist the customers, handling customer complaint, and give precise service.
4. Assurance In the dimension of Assurance, the questions that is going be asked are the knowledge and generosity of the company’s employees and their abilities to inspire trust and confidence, company’s ability to give assured information regarding to delivery, and company’s good intention in giving compensation.
5. Empathy In the dimension of Empathy, the questions that is going be asked are the ability of the company to care and provides attention to the customers, driver congeniality in helping the customers, and the satisfaction of the customer itself to the service provided.
61
115 139 155
119
65
118 68 81
117 123
60
435 437 421
322
480
325
488
415 390
422 400
502 496
552 560
477
599
390
606
483 471
539 523 562
0
100
200
300
400
500
600
700
Jan Feb Mar Apr May Jun Jul Aug Sep Oct Nov Des
Complaint On time Total Delivery
JIE, Vol. 2, No.1, Maret 2017: 44-55
49
Table 1. Question Items of Each Dimension in the Questionnaire
3.4 Questionnaire Evaluation
Evaluation of the questionnaire for the questions number 1 until 20 for five dimensions that reflect tangible, reliability, responsiveness, assurance, and empathy for the perceived and expected service of delivery can be answered by using Likert scale.
Table 2. Questionnaire Evaluation of Perceived and Expected Service
3.5 Descriptive Summary of the Questionnaire
After distributing and collecting respondents answers of the questionnaires, summarizing the
answers is the next step to give critical information for the result of the questionnaire. The main
10If there is any complaint, the company is handle it efficiently
and not harming the customers.
15Information of product delivery is notified to the customers
before the delivery is made.
3 Truck arrives in a clean condition.
4
7 Driver brings complete delivery documents.
8 Driver is not doing unnecessary thing when the delivery.
objective is to identify the preferred answer from respondents and will be used for further data calculation and analysis steps.
Table 3. Descriptive Summary of Perceived and Expected Service Questionnaire
3.6 Validity Test
After doing the descriptive summary of the questionnaires, the next step is to do statistical tests such as validity and reliability test. This next chapter will show the result of the validity and reliability test.
In this research, these questionnaires were distributed to 28 customers who use delivery service of PT. X in 2015. After distributed the questionnaires and receive the responses, next validity test is conducted using Pearson Correlation, that correlate between the item score and the total score.
The r-value for N = 28 with 5% error tolerance is 0.374. If the Pearson Correlation of the question is ≥ 0.374, then the question is valid. However, Pearson Correlation of the question is ≤ 0.374 then the questions are invalid. Invalid questions must be removed and re-tested to obtain valid result.
As can be seen from Table 4, the value of Pearson Correlation of every questions on each dimensions are higher than 0.374 which can be concluded that all of the questions are valid. 3.7 Reliability Test
After validity test is conducted for all of the questions in the questionnaire, consistency and stability of each dimension can be known by conducting reliability test to the questions of the questionnaire that has been filled by the respondents. Reliability test result by using Cronbach’s Alpha formula can be seen in the Table 5.
3.8 Data Processing of Each Questions
Different gap has come out on each of the questions. Table 4.11 shows the gap of each questions between perceived service and expected service.
The average gap of the questions is -0.95 which means that the customers are not satisfy enough with the service provided by PT. X.
Mean Median Mode Std. Dev. Max Min Mean Median Mode Std. Dev. Max Min
PERCEIVED SERVICE QUESTIONNAIRE EXPECTED SERVICE QUESTIONNAIRE
JIE, Vol. 2, No.1, Maret 2017: 44-55
51
Table 4. Perceived and Expected Service Questionnaire Validity Test Result
Table 5. Perceived Service and Expected Service Reliability Test Result
Dimension Item Pearson Correlation r-table Result Dimension Item Pearson Correlation r-table Result
Empathy
17 0.589 0.374 Valid
18 0.911 0.374 Valid
19 0.589 0.374 Valid
20 0.911 0.374 Valid
Assurance
13 0.589 0.374 Valid
14 0.911 0.374 Valid
15 0.557 0.374 Valid
16 0.649 0.374 Valid
Responsiveness
9 0.428 0.374 Valid
10 0.649 0.374 Valid
11 0.589 0.374 Valid
12 0.911 0.374 Valid
7 0.991 0.374 Valid
8 0.991 0.374 Valid
0.911 0.374 Valid
6 0.557 0.374 Valid
EX
PE
CT
ED
SE
RV
ICE
Tangible
1 0.577 0.374 Valid
2 0.649 0.374 Valid
3 0.911 0.374 Valid
4 0.557 0.374 Valid
Reliability
5
Empathy
17 0.586 0.374 Valid
18 0.923 0.374 Valid
19 0.584 0.374 Valid
20 0.591 0.374 Valid
Assurance
13 0.765 0.374 Valid
14 0.584 0.374 Valid
15 0.862 0.374 Valid
16 0.590 0.374 Valid
Responsiveness
9 0.759 0.374 Valid
10 0.820 0.374 Valid
11 0.923 0.374 Valid
12 0.626 0.374 Valid
7 0.759 0.374 Valid
8 0.917 0.374 Valid
0.917 0.374 Valid
6 0.795 0.374 Valid
PE
RC
EIV
ED
SE
RV
ICE
Tangible
1 0.577 0.374 Valid
2 0.830 0.374 Valid
3 0.613 0.374 Valid
4 0.878 0.374 Valid
Reliability
5
1 Tangible 1 Tangible
2 Reliability 2 Reliability
3 Responsiveness 3 Responsiveness
4 Assurance 4 Assurance
5 Empathy 5 Empathy
Reliability
ValueResult
0.9
Perceived Service Expected Service
Result No DimensionCronbach's
AlphaNo Dimension
Cronbach's
Alpha
Reliability
Value
0.957 0.9 ReliableReliable0.964
JIE, Vol. 2, No.1, Maret 2017: 44-55
52
Table 6. Gap Calculation of Each Questions
3.9 Satisfaction Percentage on Each Dimensions
Based on the Figure 4, it can be seen that the highest satisfaction percentage of tangible dimension is 83.74%, the highest satisfaction percentage of reliability dimension is 82.03%, the highest satisfaction percentage of responsiveness dimension is 79.69%, the highest satisfaction percentage of assurance dimension is 82.11%, and the highest satisfaction percentage of empathy dimension is 86.72%.
10If there is any complaint, the company is handle it
efficiently and not harming the customers.
11Customer's complaint is not left without any solution
from the company.
12Company act professionally in handling customer's
complaint.
7 Driver brings complete delivery documents.
8Driver is not doing unnecessary thing when the
delivery.
9Customers can easily contact the company if there
is any complaint.
Perceived
Service
Expected
ServiceGap
Satisfaction
Percentage
3,57 4,57 -1,00 78,13%
19Driver helps customers when unloading and check
the products.
No Question
16Information of product delivery is given clearly and
completely.
17 Company gives best service in every delivery.
18 Driver being hospitable when delivering products.
13Company is responsible if there is any replacement
to the damaged product.
14Redelivery cost of replacing damaged product is not
passed on to customers.
15Information of product delivery is notified to the
customers before the delivery is made.
3,61 4,57 -0,96 78,91%
3,46 4,39 -0,93 78,86%
3,54 4,75 -1,21 74,44%
3,68 4,39 -0,71 83,74%
3,46 4,39 -0,93 78,86%
3,29 4,54 -1,25 72,44%
3,75 4,57 -0,82 82,03%
3,29 4,39 -1,11 74,80%
3,46 4,39 -0,93 78,86%
3,75 4,57 -0,82 82,03%
3,68 4,75 -1,07 77,44%
3,64 4,57 -0,93 79,69%
3,36 4,75 -1,39 70,68%
3,96 4,57 -0,61 86,72%
3,61 4,39 -0,79 82,11%
3,75 4,57 -0,82 82,03%
3,39 4,39 -1,00 77,24%
Average
3,64 4,39 -0,75 82,93%
3,61 4,57 -0,96 78,91%
20The given information of delivery is satisfy the
customers.
JIE, Vol. 2, No.1, Maret 2017: 44-55
53
Figure 4. Highest Satisfaction Percentage on Each Dimension
Figure 5. Lowest Satisfaction Percentage on Each Dimension
Based on the figure above, it can be seen that the lowest satisfaction percentage of tangible
dimension is 74.44%, the lowest satisfaction percentage of reliability dimension is 74.80%, the lowest satisfaction percentage of responsiveness dimension is 72.44%, the lowest satisfaction percentage of assurance dimension is 70.68%, and the lowest satisfaction percentage of empathy dimension is 77.24%. 3.10 Importance-Performance Analysis on Each Questions
To improve the delivery service quality, a quadrant mapping is important to determine the priority of the problem. Cartesian diagram is used to make a quadrant mapping where X-axis is the perceived service axis and Y-axis is the expected service axis.
JIE, Vol. 2, No.1, Maret 2017: 44-55
54
Figure 6. Cartesian Diagram of Importance-Performance Analysis
Cartesian diagram map the perceived value and the expected value of delivery service in order
to be analyze using Importance-Performance Analysis. Variable services of quadrant A implies that repair and improvement for the variable is a priority. Quadrant B shows that the variable already met customers’ expectation and must be retained. Quadrant C shows that the variable is not too special for the customer and should be reconsidered. Quadrant D shows that the variable is less important and deemed too excessive, which lead to reducing variable so company can save costs.
Improvement will be focused on Quadrant A because it is the critical factors that should be
solved immediately. The action of improvement shown in Table 4.18.
Table 7. Action of Improvement
3.11 Summary
After calculated and analyzed the data, it is acquired that the gap from all of the 20 variables are negative values (-) with the smallest gap is -0.61 and the largest gap is -1.39.
Dimension of responsiveness is becoming the dimension with the highest gap is -1.04 and the lowest satisfaction percentage with satisfaction percentage 77.11% which explains about the responsiveness of the company in handling customers’ complaint. Customers felt that the company
No. Explanation
The step of giving corrective action and accurate
information will be explained in Service Blueprint
The safety of the driver will be checked by the
receiver staff
The safety of the truck will be checked by the
receiver staff
The step of handling customer complaint will be
explained in Service Blueprint
Control using Check
List
Control using Check
List
Control using
Service Blueprint
Control using
Service Blueprint
(1)
(2)
(9)
(16)
Action
JIE, Vol. 2, No.1, Maret 2017: 44-55
55
cannot easily contacted if there is any complaint, not handling the complaint efficiently, no visible solution, and not acting professionally when handling the complaint.
Based on the analysis using Importance-Performance Analysis to the entire 20 variables, there
are 4 factors that should prioritized by Fleet department. To lessen the gap that appears. Those variables are:
keys). (9) Customers can easily contact the company if there is any complaint.
(16) Information of product delivery is given clearly and completely.
4. Conclusion According to the results of the data calculation and analysis, there are several conclusions that can be drawn, which are: 1. From all of the variables with 20 questions, the mean of perceived service for 20 questions is
3.58 while the mean of expected service for 20 questions is 4.53. It indicates that the customer has not satisfied with the quality of delivery service provided by PT. X through Fleet department.
2. The results of data calculations and analysis that has been done using Service Quality method,
it indicates a variable that has the highest gap and can be categorized as a factor that affects customers’ satisfaction, which is the variable number 16 which stated “Information of product delivery is given clearly and completely” with the total gap between perceived service and expected service is -1.39 with satisfaction percentage 70.68%.
3. After conducting customer satisfaction assessment, improvement that can be done is making
Service Blueprint to set the procedure in handling customer complaint. To control the improvement, Check List is used to maintain the improvement that already been done.
5.References 1. Gay, L. R. (1987). Educational Research: Competencies for analysis and application. Ohio:
Merrill. 2. Martilla, J. and James, J. (1977). Importance-Performance Analysis. Journal of Marketing,
41(1), 77-79. 3. Nunnally, J. C. (1978). Psychometric Theory. New York: McGraw-Hill. 4. Parasuraman, A., Zeithaml, V. A., & Berry, L. L. (1985). A conceptual model of service quality
and its implication. Journal of Marketing, 41-50. 5. Parasuraman, A., Zeithaml, V. A., & Berry, L. L. (1988). SERVQUAL: a multiple-item scale for
measuring customer perceptions of the service quality. Journal of Retailing, 23.