Analysis of Different Level of EOG Signal from Eye Movement for Wheelchair Control Nurul Muthmainnah Mohd Noor, Salmiah Ahmad* Department of Mechatronics, Kuliyyah of Engineering, IIUM, Gombak, Malaysia Abstract – This paper is aimed to analyze different levels of eye movement signals strength using Electrooculography (EOG). The eye movement that is known to be a significant communication tool for a tetraplegia, can be defined as a paralysis that is caused by serious injuries or illness to a human that lead to a partial or total loss of their lower limb and torso. A person who has such paralysis is highly dependent on an assistant and a wheelchair for movement. It is not always the case where the helper is with the patient all the time, therefore independence is encouraged among the wheelchair users. The signal from the eye muscles that is called electrooculogram is generated at different eye movements’ directions and levels. The eye movement signals are acquired using g.USBamp from G.TEC Medical Engineering GMBH by using Ag/AgCl electrodes. The data is then passed to MATLAB/SIMULINK software for data analysis. Different directions and strength level of eye movement are fed to a virtual wheelchair model developed in MSC.Visual Nastran 4D software to study the effect of the signals on the distance and rotation travelled by the wheelchair. Simulation exercises has verified that different strength of eye movement signals levels that have been processed could be manipulated for helping tetraplegia in their mobility using the wheelchair. Keywords – eye movement, signal processing, wheelchair control, tetraplegia, and EOG I. INTRODUCTION Over the past several years, there have been increasing in the interest on the wheelchair improvement among inventors, design engineers, and the general public. *Corresponding author, Tel: (603) 6196 4506; Fax No: (603)61964433 Email address: [email protected]
Transcript
Analysis of Different Level of EOG Signal from Eye
Movement for Wheelchair Control
Nurul Muthmainnah Mohd Noor, Salmiah Ahmad*
Department of Mechatronics, Kuliyyah of Engineering, IIUM, Gombak, Malaysia Abstract – This paper is aimed to analyze different levels of eye movement signals strength using
Electrooculography (EOG). The eye movement that is known to be a significant communication tool for a
tetraplegia, can be defined as a paralysis that is caused by serious injuries or illness to a human that lead to
a partial or total loss of their lower limb and torso. A person who has such paralysis is highly dependent on
an assistant and a wheelchair for movement. It is not always the case where the helper is with the patient all
the time, therefore independence is encouraged among the wheelchair users. The signal from the eye
muscles that is called electrooculogram is generated at different eye movements’ directions and levels. The
eye movement signals are acquired using g.USBamp from G.TEC Medical Engineering GMBH by using
Ag/AgCl electrodes. The data is then passed to MATLAB/SIMULINK software for data analysis. Different
directions and strength level of eye movement are fed to a virtual wheelchair model developed in
MSC.Visual Nastran 4D software to study the effect of the signals on the distance and rotation travelled by
the wheelchair. Simulation exercises has verified that different strength of eye movement signals levels that
have been processed could be manipulated for helping tetraplegia in their mobility using the wheelchair.
Keywords – eye movement, signal processing, wheelchair control, tetraplegia, and EOG
I. INTRODUCTION Over the past several years, there have been increasing in the interest on the wheelchair improvement
among inventors, design engineers, and the general public.
This is because the use of wheelchair that has come to help many people with different illness and
injuries. For example, a suitable wheelchair may facilitate the user to be out of sick bed, continuing
their life, pick and place things, maneuvers in narrow spaces and partaking of human experience [1].
The use of wheelchair has becoming very important for mobility among disabled as well as the
quadriplegic, which may cause by road accident, falling from the high position or severe diseases. The
initial purpose of the wheelchair is actually aimed to give more freedom for these people to do basic
things on their own, such as carrying items from one place to another and maneuver [2]. The mobility
of the wheelchair users can be aided according to the level of injuries of a user has, or depending on
the capability of the user to handle the wheelchair.
There are several techniques used to aid disabled people based on the user’s ability and the
communication tools between the human and machine such as mouse, keyboard and joystick [3]. In
addition, bio-potential signal also is one of the examples of human–machine interface using of nonverbal
information such as electrooculography (EOG), electromyography (EMG), and electroencephalography
(EEG) signals [4],[5]. The EOG and EMG signals are caused by physiological changes; many studies have
focused on using EMG signals for the human–machine interface. The EOG signal is more suitable as a
mode of the interface for those wheelchair users who are categorized as tetraplegia. A person who is
categorized under tetraplegia is known to have disability on the torso and lower extremities, partially or
total losses; such that their eye movement could be benefited for their mobility. This paper has investigated
that different EOG signals obtained from four different places around eye; (right, left, up, and down) have
lead to different level of distance and rotation of wheelchair. Those four signals are correspond to different
levels of right and left steer, forward and backward motion. There are many research that have concentrated
in making use of the eye movement signals for tetraplegia, [6], [7], [8] despite of the complexity that arises
when analyzing the eye movement signals. In this case the constraints are made such that the eye
movement is assumes to be very limited to; (straight-to-up, straight-to-down, straight-to-right and straight-
to-left). The issue of other eye movement patterns, i.e. not so straight or in diagonal direction of the eye
movement signals are not discussed in this paper, which will be catered in future research. It is very crucial
in translating the eye movement into a correct motion input. Any wrong judgment of eye movement input
classification will lead to a fault motion instruction of the wheelchair. This can be catered by having an
intelligent classification method, i.e fuzzy logic, which is separately discussed in another paper.
This paper is organized as follows: Section II presents the description of electrooculography
(EOG) while Section III presents the EOG data acquisition using g.USBamp and MATLAB. In
Section IV, the modeling of wheelchair using MSC. VisualNastran 4D is presented. While in Section V,
the EOG signals result and also the relationship between inputs and distances and the angles position using
simulation is performed and followed by the conclusion.
II. ELECTROOCULOGRAPHY (EOG) Electrooculography is a technique for measuring the resting potential [9], [10]. A resting potential
is generated by an electric dipole formed by a positive cornea and a negative cornea [11]. This
resulting signal which is called EOG is essentially a record of the difference in electrical voltage
between the front and back of the eye that is correlated with the eyeball movement and obtained
by electrodes placed on the skin near the eye.
EOG signal is acquired by placing Ag/AgCI electrodes around the eyes. Silver (Ag) –
Silver Chloride (AgCI) electrodes have been used, which produce low levels of junction potential,
motion artifacts and drift in the direct current signal [12]. There are two channels of bipolar EOG
signal are acquired for analysis, which are horizontal channels and vertical channels. The
horizontal channel EOG reflects horizontal eyeball movements while the vertical channel EOG
reflects the vertical eyeball movements.
Two disposable Ag/AgCI electrodes were placed above and below the right eye to measure the
vertical EOG while two other electrodes were placed at the outer canthi to measure the horizontal
EOG. The illustration of electrodes placements is shown in Figure 1. The reflected eye signal direction
depends on the position of electrodes which can be shown in Table 1.
The ground is needed in order to create a safety electrical path off and protect the amplifier
[13]. On the other hand, the reference point is needed to allow a known starting point for all EOG
measurements in the horizontal and vertical planes. It is to make sure all eye signals data are
recorded including a small EOG signal.
III. EOG DATA ACQUISITION
a) G.USBamp and MATLAB G.USBamp from G.TEC Medical Engineering GMBH is a high performance and high accuracy bio-
potential amplifier and acquisition/processing system [14]. It allows the investigation of brain, heart and
muscle activity, eye movement, respiration, galvanic skin response and many other physiological and
physical parameters. In addition, g.USBamp amplifier is a USB 2.0 enabled and comes with 24-bit
of 16 simultaneously sampled bio-potential channels. A total of 4 independent grounds, guarantee
no interference between the recorded signals are connected. The amplifier is then can be connect
easily with the computer and can be used for data recording. In order to process the data, the
g.USBamp can be configured easily and set via MATLAB/SIMULINK Version 7.0.1 (R14SP1)
and LABVIEW.
b) Basic data acquisition of eye movement In this experiment, g.USBamp was used to acquire the eye movement data. It has been interfaced
with MATLAB/SIMULINK. The experiment set up is shown in Figure 2. The data was collected
in 20s for each eye movement.
In the setup, the g.USBamp was plugged into the computer with MATLAB/SIMULINK. Then,
the Ag/AgCl electrodes were connected to g.USBamp. In this experiment, there were two channels
used; Channel 1 and Channel 2 of port A. The others two electrodes were grounded and referenced.
The simple simulation diagram as in Figure 3 has been used to collect the data from the eye
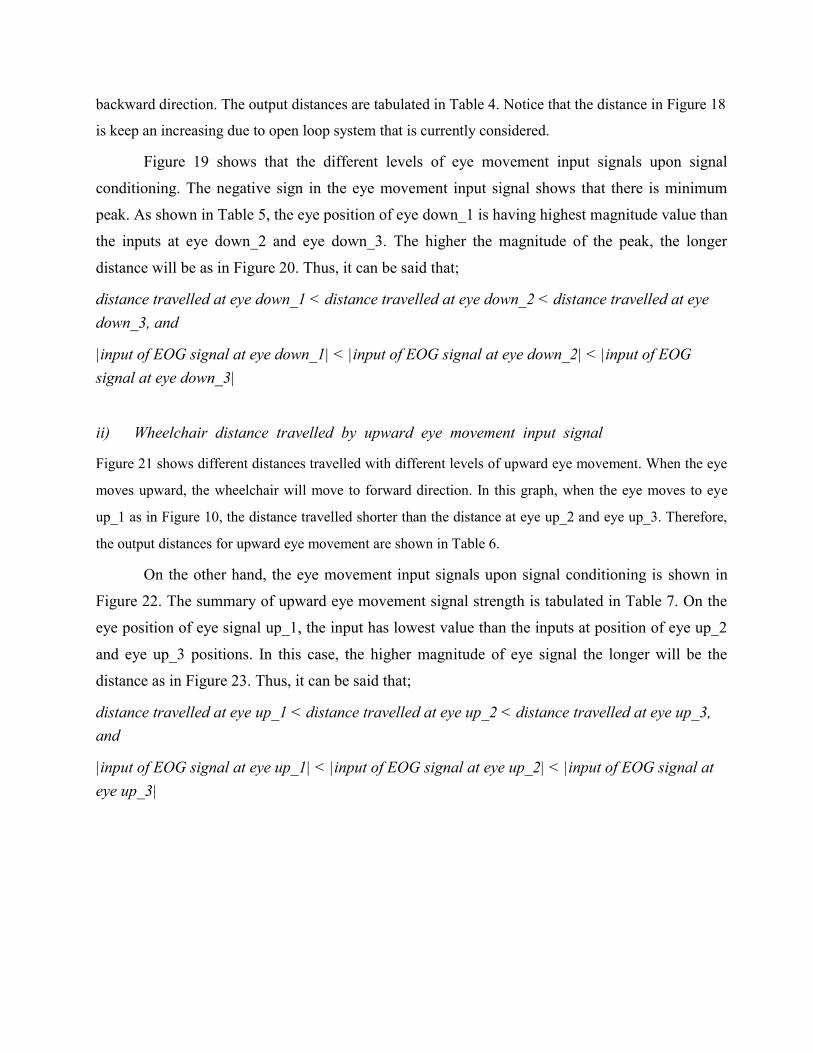
movement. There were parameters of the g.USBamp block function that can be set as in Figure 4. The
parameters include the channels selection, bandpass and notch parameters setting. In this experiment,
the band pass filter with a range between 0.5 and 30 Hz is applied with a sample rate of 256 Hz. This
is because EOG signal information is mainly contained in low frequencies. In this experiment, the
body (normally hand) must also be grounded in the sense that the hand should touch the g.USBamp to
avoid the disturbance and noise.
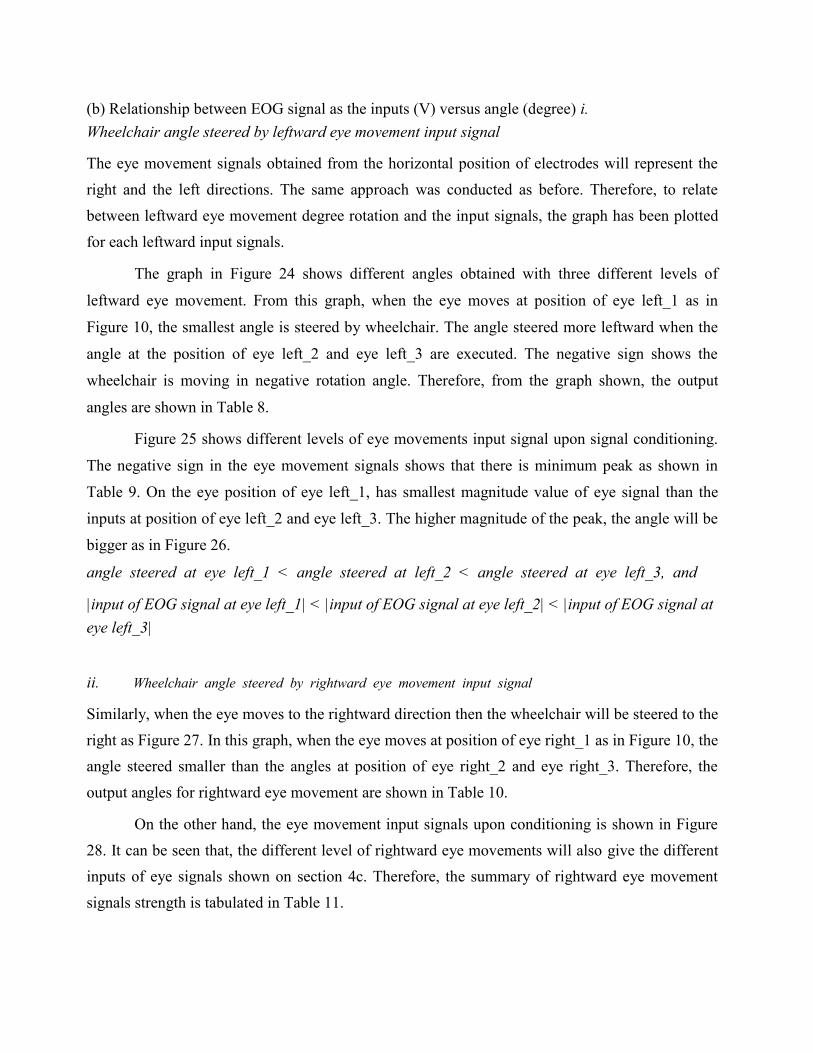
EOG signals acquired in this experiment were collected using an array of six 35 mm Ag/AgCl
electrodes from Salus Healthcare. The horizontal signals that represent the leftward and rightward
direction were collected using one electrode on the edge of the right eye socket and another one on left
eye socket. Similarly, the vertical signals that represent the upward and downward direction are
collected using electrode on the above of right eyebrow and another on the lower edge of the right eye
socket as shown in Figure 5. The fifth and sixth electrodes, the signal represents as reference and
ground. Both electrodes are located near the right and left side of ears. The eye movement data
acquisition can be seen in Figure 6 to Figure 9.
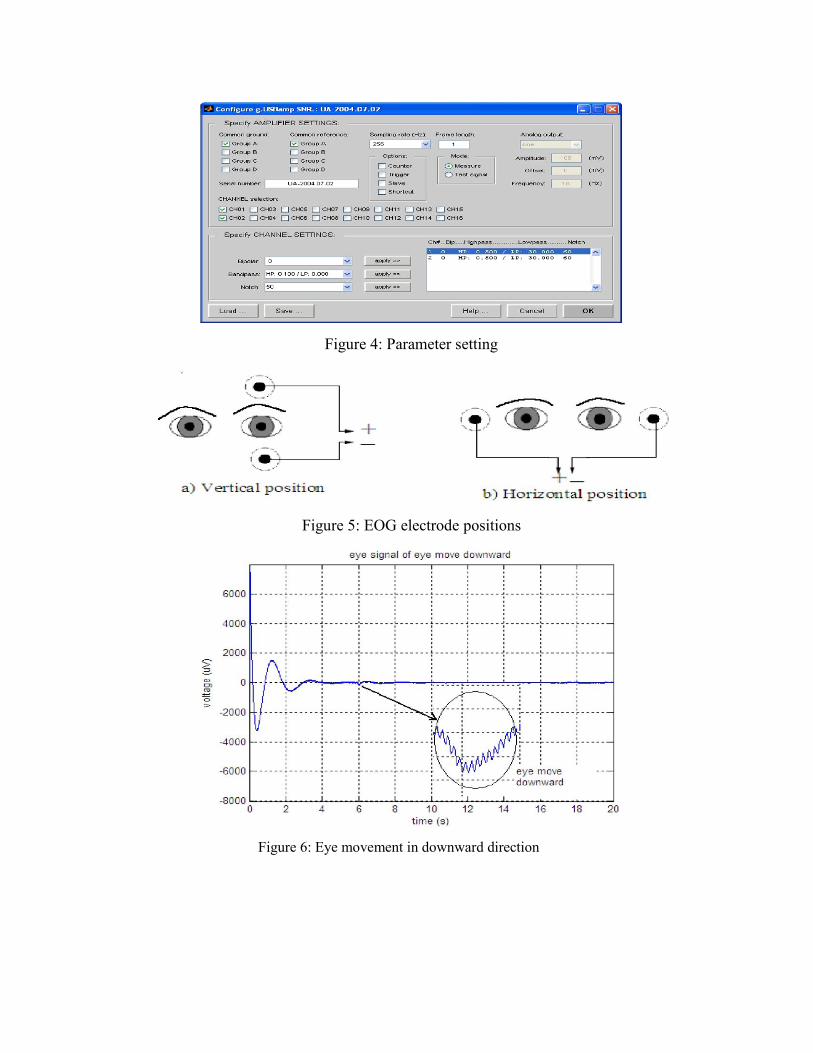
In Figure 6 , it shows the eye signal data when the eye moves downward. The minimum peak
is almost -173 µV. The minimum peak show that when the eye moves downward, the signal will
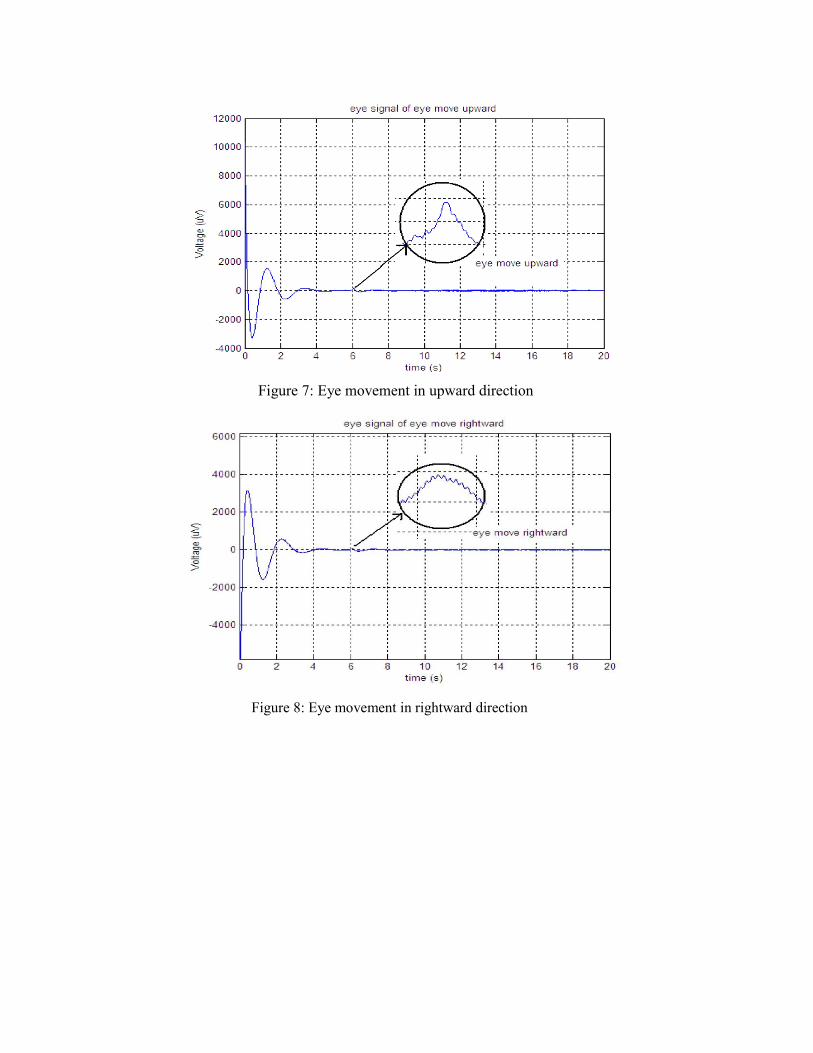
reflect to negative direction. The eye signal is reflected to the upward direction can be seen in
Figure 7. It represents the eye movement to the upward direction that will give the positive
maximum peak accordingly. The value of this peak is 150 µV.
In Figure 8, when the eye moves rightward, the signal will be reflected to the right
direction. From the graph, the maximum peak is having positive direction same as when eye
moves upward, but the value for this peak, is smaller than the peak value during the upward eye
movement. The maximum peak is 80 µV. Similarly, the eye signal when the eye moves to the left
is shown in Figure 9, which has the minimum peak (negative), and the value at this peak is smaller
than the minimum peak during downward eye movement. From this graph, the minimum peak is -
80 µV.
c) Different levels of eye movement signals There are different strengths of eye movement for different people. This experiment was done to
analyze different levels of eye movement which will lead to different control signals at later. In this
experiment, the goggle was used to differentiate the different levels for eye movement. On the goggle,
the position was marked to three levels as in Figure 10. The objective of this step is to know the effect
of eye movement signals on the different levels of eye movement strength. For each level, the distance
between levels to another level was made 7 mm. The summary for these three positions for each eye
signal is shown in Table 2. In this experiment, five readings were taken for each level of eye
movement in 20 s. Then these readings were averaged as in Table 3.
The average of readings for each position = (1st
reading + 2nd
reading + 3rd
reading + 4th
reading
+ 5th
reading)/5.
In Figure 11, eye down_3 has highest strength input of EOG signal compared with the
other two level of eye signal which give the highest peak level. From the graph, the input of EOG
at eye down_1 is -90 µV. At the eye down_2, the input of EOG is -150 µV and at the eye down_3,
the input of EOG signal is -170 µV.
Figure 12 shows the eye up_3 has the highest input of EOG signal compared with the other two
level of eye signal. From the graph, the input of EOG at eye up_1 is 90 µV. At the eye up_2, the input of
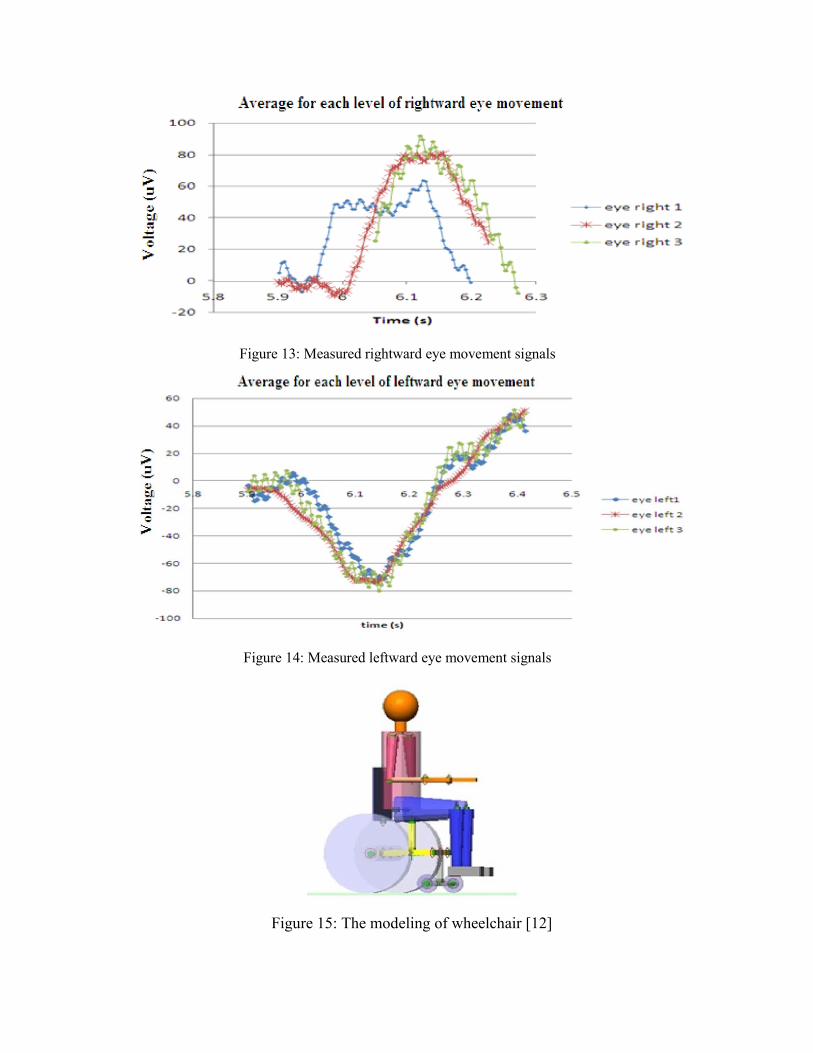
EOG is 110 µV and at the eye up_3, the input of EOG signal is 180 µV. While in Figure 13, the eye right_3
has the highest input of EOG signal compared with the other two level of eye signal. From the graph,
the input of EOG at eye right 1 is 65 µV. At the eye right_2, the input of EOG is 80 µV and at the
eye right_3, the input of EOG signal is 90 µV.
It can be seen from Figure 14, the eye left_3 has the highest negative peak of signal
compared with the other two level of eye signal. From the graph, the input of EOG at eye left_1 is
-65 µV. At the eye left_2, the input of EOG is -75 µV and at the eye left_ 3, the input of EOG
signal is -80 µV. Those signals will be used to control wheelchair motion upon suitable signal
conditioning and a proper classification.
IV. WHEELCHAIR MODELLING In this research, the model of a standard wheelchair with basis shapes of frame was designed using
MSC VisualNastran 4D [15]. MSc. VisualNastran 4D (MSC.N4D) is software used for design and
engineering professional developing products involving assemblies of 3D parts [16].
This software can measure forces, torques, friction, collisions, and also velocity. It is also
capable to be integrated with MATLAB for control. The wheelchair with human model as in Figure 15
was used as a plant in this research. The model was further integrated with EOG signal for control
purpose as shown in Figure 16. The data obtained from eye movement signal was fed into the
developed wheelchair model. This was done offline in initial stage.
V. SIMULATION RESULTS At this stage, the data obtained from eye movement is fed into MATLAB/SIMULINK for
simulation. The simulation exercise was done to investigate on how far the wheelchair can move
based on eye signals that have been processed and conditioned. In the simulation, the transfer
function of motor was used before it was fed into the model. The gain was also added to see
significant impact on the distance travelled of wheelchair since the eye movement signals are very
small (in µV).
From the eye movement signals, the vertical and horizontal positions of electrodes that gave the
maximum or minimum peak accordingly will determine how far the distance or rotation of wheelchair is.
Thus the minimum peak or maximum fraction block was used to condition the signals. However, eye
movement signal that used only starts from 5s onwards in 20s. All data below 5s are not used and thus were
removed. Figure 17 shows block diagram for the open loop on the effect of simulation conditioned eye
movement signals on the wheelchair motion.
In modeling of the motor, the transfer function was obtained as in Equation (1). The
followings are the parameters that were used in the transfer function. The input is the voltage (V)
while the output is angular speed (ω).
=
(1)
where
ω(s) = rotor angular velocity
V(s) = applied voltage
Ki = torque constant Jm
= rotor inertia
La = armature inductance Ra
= armature resistance
Bm =viscous – friction coefficient
Kb = back emf constant
In this system, Ki = 1 Nm/A, Jm = 0.01 kg.m2, La = 0.5 H, Ra = 0.1 Ohm, Bm = 0.1 Nms and Kb =
0.1001 Nm/A were used. Therefore, the transfer function of motor for this simulation is obtained
as follow,
=
(a) Relationship between EOG signal as the inputs (V) versus distances (meter) i)
Wheelchair distance travelled by downward eye movement input signal In order to get the relationship between EOG signals as an input with distance travelled by
wheelchair, the graph for each distance versus each eye movement input was plotted. Different
eye movement strength levels were simulated to get the distance/rotation output of wheelchair.
This is only an open loop simulation without any feedback and position control.
The graph in Figure 18 shows the different distances obtained with three different levels of eye
movement. The eye movement signals used is from the vertical position of electrodes, where the
wheelchair moves to backward direction. From this graph, when the eye moves at position at eye
down_1 as in Figure 10, the distance travelled by wheelchair is the shortest as compared to the
distance travelled using eye down_2 and eye down_3. The distance travelled more backward at the
position eye down_2 and eye down_3. The negative sign shows the wheelchair is moving in the
backward direction. The output distances are tabulated in Table 4. Notice that the distance in Figure 18
is keep an increasing due to open loop system that is currently considered.
Figure 19 shows that the different levels of eye movement input signals upon signal
conditioning. The negative sign in the eye movement input signal shows that there is minimum
peak. As shown in Table 5, the eye position of eye down_1 is having highest magnitude value than
the inputs at eye down_2 and eye down_3. The higher the magnitude of the peak, the longer
distance will be as in Figure 20. Thus, it can be said that; distance travelled at eye down_1 < distance travelled at eye down_2 < distance travelled at eye
down_3, and |input of EOG signal at eye down_1| < |input of EOG signal at eye down_2| < |input of EOG
signal at eye down_3|
ii) Wheelchair distance travelled by upward eye movement input signal Figure 21 shows different distances travelled with different levels of upward eye movement. When the eye
moves upward, the wheelchair will move to forward direction. In this graph, when the eye moves to eye
up_1 as in Figure 10, the distance travelled shorter than the distance at eye up_2 and eye up_3. Therefore,
the output distances for upward eye movement are shown in Table 6.
On the other hand, the eye movement input signals upon signal conditioning is shown in
Figure 22. The summary of upward eye movement signal strength is tabulated in Table 7. On the
eye position of eye signal up_1, the input has lowest value than the inputs at position of eye up_2
and eye up_3 positions. In this case, the higher magnitude of eye signal the longer will be the
distance as in Figure 23. Thus, it can be said that; distance travelled at eye up_1 < distance travelled at eye up_2 < distance travelled at eye up_3,
and |input of EOG signal at eye up_1| < |input of EOG signal at eye up_2| < |input of EOG signal at
eye up_3|
(b) Relationship between EOG signal as the inputs (V) versus angle (degree) i.
Wheelchair angle steered by leftward eye movement input signal The eye movement signals obtained from the horizontal position of electrodes will represent the
right and the left directions. The same approach was conducted as before. Therefore, to relate
between leftward eye movement degree rotation and the input signals, the graph has been plotted
for each leftward input signals.
The graph in Figure 24 shows different angles obtained with three different levels of
leftward eye movement. From this graph, when the eye moves at position of eye left_1 as in
Figure 10, the smallest angle is steered by wheelchair. The angle steered more leftward when the
angle at the position of eye left_2 and eye left_3 are executed. The negative sign shows the
wheelchair is moving in negative rotation angle. Therefore, from the graph shown, the output
angles are shown in Table 8.
Figure 25 shows different levels of eye movements input signal upon signal conditioning.
The negative sign in the eye movement signals shows that there is minimum peak as shown in
Table 9. On the eye position of eye left_1, has smallest magnitude value of eye signal than the
inputs at position of eye left_2 and eye left_3. The higher magnitude of the peak, the angle will be
bigger as in Figure 26. angle steered at eye left_1 < angle steered at left_2 < angle steered at eye left_3, and |input of EOG signal at eye left_1| < |input of EOG signal at eye left_2| < |input of EOG signal at
eye left_3|
ii. Wheelchair angle steered by rightward eye movement input signal Similarly, when the eye moves to the rightward direction then the wheelchair will be steered to the
right as Figure 27. In this graph, when the eye moves at position of eye right_1 as in Figure 10, the
angle steered smaller than the angles at position of eye right_2 and eye right_3. Therefore, the
output angles for rightward eye movement are shown in Table 10.
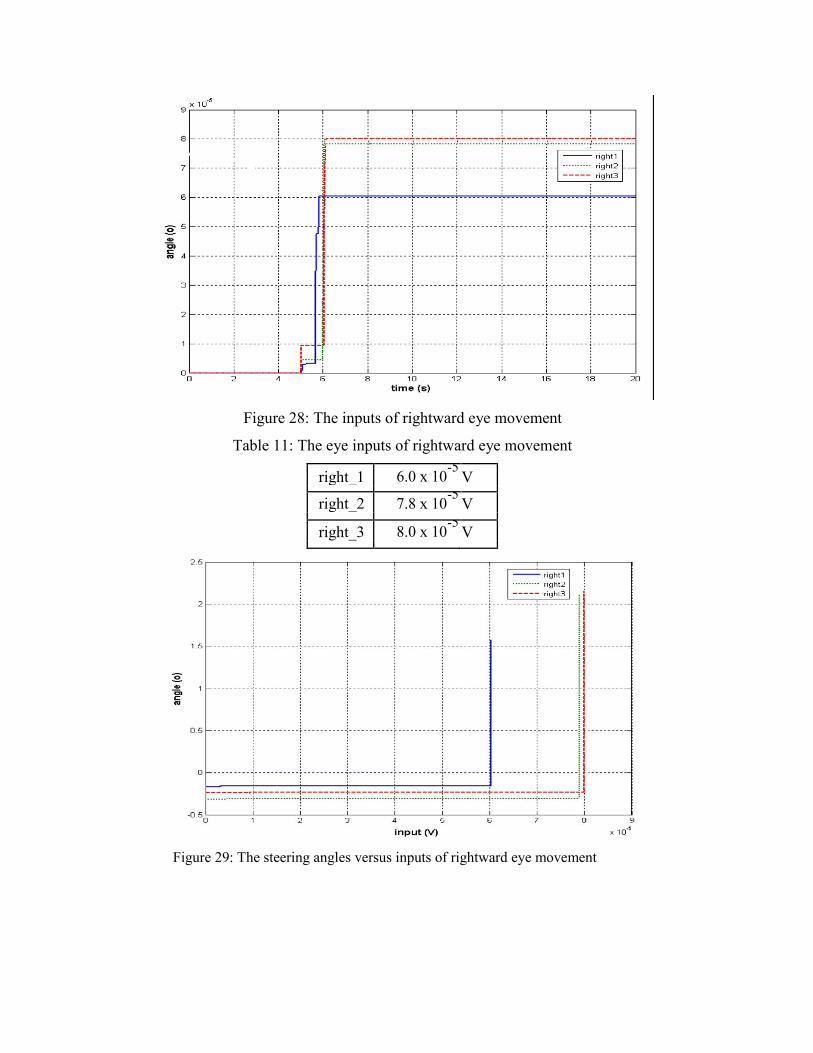
On the other hand, the eye movement input signals upon conditioning is shown in Figure
28. It can be seen that, the different level of rightward eye movements will also give the different
inputs of eye signals shown on section 4c. Therefore, the summary of rightward eye movement
signals strength is tabulated in Table 11.
On the eye position of eye right_1, the input has lowest value of eye signal than the inputs
at position of eye right_2 and eye right_3. In this case, the higher magnitude of eye signal, the
larger will be the angle as in Figure 29. Thus, it can be said that; angle steered at eye right_1 < angle steered at right_2 < angle steered at eye right_3, and |input of EOG signal at eye right_1| < |input of EOG signal at eye right_2| < |input of EOG signal
at eye right_3|.
In fact, the tetraplegia, who can use eye movement as a communication tool is capable to
have a different levels of input. If the eye far from the center position the magnitude of the peak is
maximum. The maximum positive peak will give the longest distance for eye moves upward and
the biggest angle for eye moves to rightward direction. However, the maximum negative peak will
give the longest distance for eye moves downward and the biggest angles for eye moves to
leftward direction but in opposite direction.
VI. CONCLUSIONS Eye movement can be a very significant communication tool among tetraplegia (quadriplegia) for
wheelchair control. The fact is that different tetraplegic may have different eye movement strengths to
be used for commanding the wheelchair to move. This will lead to different distance travelled (used
for forward and backward motion) from the vertical position of electrodes and different rotational
angles (used for left and right steering motion) from the horizontal position of electrodes. Simulation
exercise has been conducted using the experiment data obtained from the eye movement signal with
proper signal conditionings. It has been shown that the eye movement signals are able to be used
among tetraplegia for wheelchair control.
VII. REFERENCES [1] T. C. Teng, (2005) Lifting Mechanism of Wheelchair. Unpublished Ph.D Thesis, University of
Southern Queensland, Australia. [2] C. A. McLaurin (1986) Current Directions in Wheelchair Research. JRRD Clinical
Supplement No. 2: Choosing a Wheelchair System, pp. 88–99.
[3] M. Mazo, F.J. Rodríguez, J. Lázaro, J. Ureña, J.C. García, E. Santiso, P.Revenga, and J.J.
García, (1995) ‘Wheelchair for physically disabled people with voice, ultrasonic and infrared
sensor control,’ Autonomous Robot, Vol. 2, No. (3), pp. 203-224.
[4] Danish Chopra (2010) ‘Detection of Iris Movement by Estimating Sclera Size and Sync it
with the Caster Wheel of a Wheelchair’, International Journal of Electronics Engineering,
Vol.2, No. 2, pp. 283 – 286. [5] M. A. Fkirin, S. Badawy, A. S .El-Sherbeny, (2009) ‘Driving a DC Motor by Numerically
Manipulated Eye Signal Captured by EOG’, The Online Journal on Electronics and
Electrical Engineering, Vol. (2) – No. (1) pp. 170. [6] Lei Sun, Sun-an Wang, Jin-hua Zhang and Xiao-hu Li, (2012) ‘Robust electrooculography
endpoint detection based on autoregressive spectral entropy’, International Journal of Biomedical
Engineering and Technology, Vol. 10, No.3 pp. 239 - 254. [7] Satoru Goto, Masatoshi Nakamura, Takenao Sugi (2008) ‘Development of meal assistance
orthosis for disabled persons using EOG signal and dish image’, International Journal of
Advanced Mechatronic Systems, Vol. 1, No. 2 pp. 107 – 115. [8] Q.P. Ha, T.H. Tran, G. Dissanayake (2005) ‘A hybrid human-machine interface for hands-
free control of an intelligent wheelchair’, International Journal of Intelligent Systems
Technologies and Applications, Vol. 1, No. 1 pp. 49 – 65. [9] R. Barea, L.Boquete, M. Mazo, and E.Lopez (2002) ‘System for Assisted Mobility Using
Eye Movements Based on Electrooculography’, IEEE Transactions on Neural Systems and
Rehabilation Engineering, Vol 10, No. 4, pp. 209 – 218. [10] R. Barea, L. Boquete, M. Mazo, E. Lopez, and L. Bergasa (2003) ‘Electrooculographic
guidance of a wheelchair using eye movements codification’, The International Journal of
Robotics Research, Vol. 22, No. 10, pp 641 – 652. [11] S. Yathunanthan, L. U. R. Chandrasena, A. Umakanthan, , V.Vasuki, , and S. R.
Munasinghe (2008) ‘Controlling a Wheelchair by Use of EOG Signal’ in ICIAFS 2008:
Proceedings of International Conference on Information and Automation for
Sustainability, Colombo, Sri Lanka, pp. 283 – 288.
[12] Roy Choudhury, S.Venkataramanan, Harshal B. Nemade, J.S. Sahambi, Design and
Development of a Novel EOG Biopotential Amplifier, IJBEM, Vol. 7, No. 1, 2005, p. 271
[13] About Electrodes. [online], http://www.braintrainer.com/equipment/about_electrodes.html,
(Assessed on 12 October 2011). [14] g.USBamp amplifier. [online], http://www.gtec.at/Products/Hardware-and-
Accessories/g.USBamp-Specs-Features , (Assessed on 8 October 2011). [15] Ahmad, Salmiah and Tokhi, M. Osman and Siddique, Nazmul S. Haqque (2010), ‘Modular
fuzzy control with input shaping technique for transformation of two-wheeled wheelchair
to four-wheeled mode’ in ISIEA 2010: Proceeding of IEEE Symposium Industrial
Electronics & Applications, P.Pinang, Malaysia, pp. 562 – 566. [16] MSC.visualNastran4D. [online],
http://www.mae.virginia.edu/meclab/images/visualNastran4D.pdf, (Assessed on 13
October 2011).
Figure 1: Placement of electrodes
Table 1: Reflected eye signal direction Point Position Reflected signal direction
A Above eyebrow Up
B Below eye Down
C Right eye canthi Right
D Left eye canthi Left
E Near to right ear Reference
F Near to left ear Ground
Figure 2: Experimental setup
Figure 3: g.USBamp block diagram in simulink
Figure 4: Parameter setting
Figure 5: EOG electrode positions
Figure 6: Eye movement in downward direction
Figure 7: Eye movement in upward direction
Figure 8: Eye movement in rightward direction
Figure 9: Eye movement in leftward direction
Figure 10: The different levels of eye signal movement marked on goggle
Table 2: The distance of different level of position
Position Distance
From 0 to up1 , down1, left1, right1 7 mm
From 0 to up2 , down2, left2, right2 14 mm
From 0 to up3 , down3, left3, right3 21 mm
Table 3: Average of eye movement signals
1st 2nd 3rd 4th 5th Average eye movement signals
Up a1 a2 a3 a4 a5 (a1+a2+a3+ a4+a5)/5
Down b1 b2 b3 b4 b5 (b1+b2+b3+ b4+b5)/5
Right c1 c2 c3 c4 c5 (c1+c2+c3+ c4+a5)/5
Left d1 d2 d3 d4 d5 (d1+d2+d3+ d4+d5)/5
Figure 11: Measured downward eye movement signals
Figure 12: Measured upward eye movement signals
Figure 13: Measured rightward eye movement signals
Figure 14: Measured leftward eye movement signals
Figure 15: The modeling of wheelchair [12]
Figure 16: Open loop block diagram form EOG signal to wheelchair
Figure 17: Block diagram relating EOG and wheelchair.
Figure 18: The distances of downward eye movement Table
4: The output distances of downward eye movement
Down_1 - 0.27 m
Down_2 - 0.43 m
Down_3 - 0.50 m
Figure 19: The inputs of downward eye movement
Figure 20: The distances versus inputs of downward eye movement
Table 5: The eye inputs of downward eye movement
down_1 -0.8 x 10⁻⁴
V
down_2 -1.3 x 10⁻⁴
V
down_3 -1.5x 10⁻⁴
V
Figure 21: The distances of upward eye movement Table
6: The output distances of upward eye movement
up_1 0.27 m
up_2 0.37 m
up_3 0.57 m
Figure 22: The inputs of upward eye movement
Figure 23: The distances versus inputs of upward eye movement
Table 7: The eye inputs of upward eye movement
up_1 0.8 x 10⁻⁴
V
up_2 1.1 x 10⁻⁴
V
up_3 1.7x 10⁻⁴
V
Figure 24: The angles of leftward eye movement
Table 8: The output angles of leftward eye movement
left_1 3.75o
left_2 3.85o
left_3 4.0o
Figure 25: The inputs of leftward eye movement
Table 9: The eye inputs of leftward eye movement
left_1 -7.20 x 10⁻⁵
V
left_2 -7.35 x 10⁻⁵
V
left_3 -7.40 x 10⁻⁵
V
Figure 26: The steering angles versus inputs of leftward eye movement
Figure 27: The angles of rightward eye movement Table
10: The output angles of rightward eye movement
right_1 1.5o
right_2 2.1o
right_3 2.3o
Figure 28: The inputs of rightward eye movement
Table 11: The eye inputs of rightward eye movement
right_1 6.0 x 10⁻⁵
V
right_2 7.8 x 10⁻⁵
V
right_3 8.0 x 10⁻⁵
V
Figure 29: The steering angles versus inputs of rightward eye movement