Page 1
INSTITUT FÜRELEKTRISCHEANLAGEN UNDENERGIEWIRTSCHAFT
Analysis of Electricity Network Capacities
and Identification of Congestion
Final Report
Aachen, December 2001
commissioned by the
European Commission
Directorate-General Energy and Transport
carried out by the
Institute of Power Systems and Power Economics (IAEW)
of Aachen University of Technology (RWTH Aachen)
Schinkelstr. 6, D-52056 Aachen, Tel. +49. 241. 8097652, Fax +49. 241. 8092197
e-mail: [email protected]
and
CONSENTEC Consulting für Energiewirtschaft und -technik GmbH
Krantzstr. 7, D-52070 Aachen, Tel. +49. 241. 93836-0, Fax +49. 241. 93836-15
e-mail: [email protected]
Page 3
Analysis of Electricity Network Capacities
and Identification of Congestion
Final Report
Aachen, December 2001
commissioned by the
European Commission
Directorate-General Energy and Transport
carried out by
Univ.-Prof. Dr.-Ing. Hans-Jürgen Haubrich, Dr.-Ing. Christian Zimmer,
Dipl.-Ing. Klaus von Sengbusch, M.Sc. Feng Li
Institute of Power Systems and Power Economics (IAEW)
of Aachen University of Technology (RWTH Aachen)
Schinkelstr. 6, D-52056 Aachen, Tel. +49. 241. 8097652, Fax +49. 241. 8092197
e-mail: [email protected]
and
Dr.-Ing. Wolfgang Fritz, Dipl.-Ing. Stefanie Kopp
CONSENTEC Consulting für Energiewirtschaft und -technik GmbH
Krantzstr. 7, D-52070 Aachen, Tel. +49. 241. 93836-0, Fax +49. 241. 93836-15
e-mail: [email protected]
with a sub-task contributed by
Prof. Dr. Walter Schulz, Dipl.-Volksw. Felix Müsgens, Dipl.-Volksw. Markus Peek
Institute of Energy Economics (EWI) at the University of Cologne
Albert-Magnus-Platz, D-50923 Köln, Tel. +49. 221. 4702258, Fax +49. 221. 446537
Page 5
Analysis of Electricity Network Capacities and Identification of Congestion – Final Report, December 2001 i
Table of Contents
Abbreviations vii
Executive Summary I
1 Introduction and objective 1
2 Methodical approach 5
2.1 Phase 1: Capacity determination methods and transmission bottlenecks 5
2.2 Phase 2: Demand and possibilities to increase transmission capacity 7
3 Determination and allocation of cross-border transmission capacity 9
3.1 Overview 9
3.2 Determination of indicative NTC values published by ETSO 10
3.2.1 Data base and methodology 10
3.2.2 Assessment of network security 17
3.2.3 Limits of feasible network operation 19
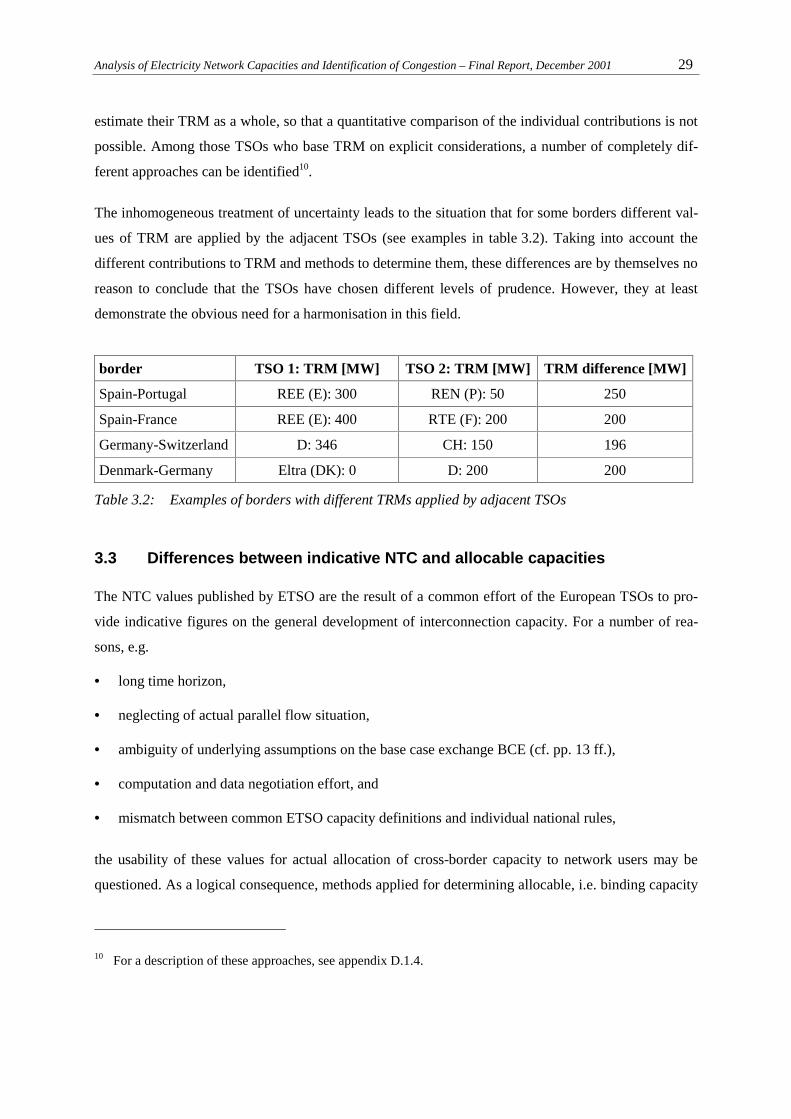
3.2.4 Consideration of uncertainties 25
3.3 Differences between indicative NTC and allocable capacities 29
3.4 Conclusions 31
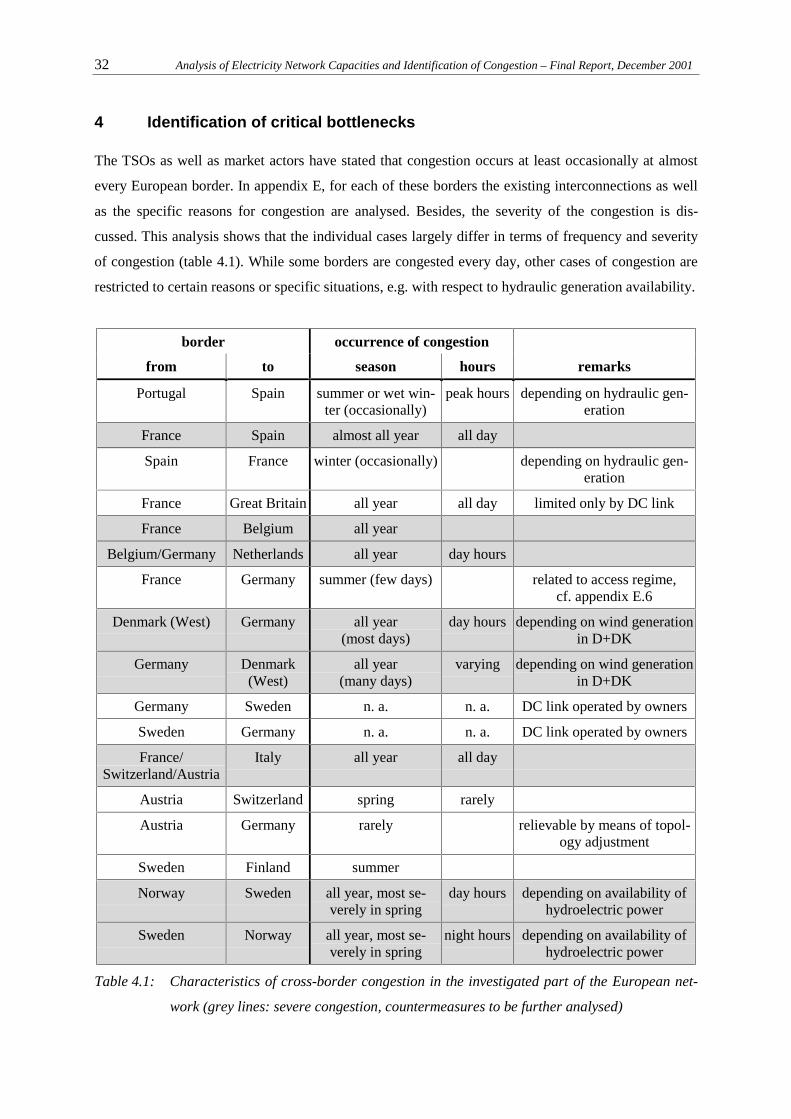
4 Identification of critical bottlenecks 32
5 Investigations on the demand for transmission capacity 34
5.1 Introduction 34
5.2 Investigations carried out by TSOs 36
5.3 Investigation for France-Italy based on a generation dispatch model 37
5.3.1 Objective 37
5.3.2 Methodology 38
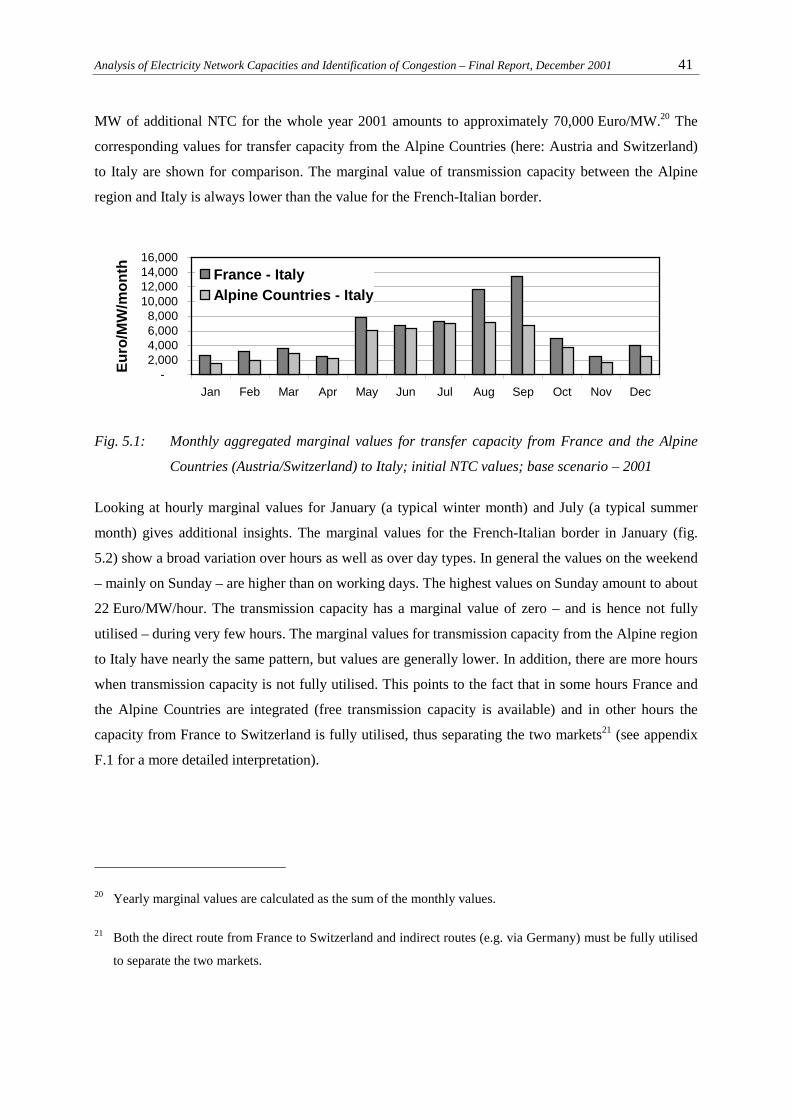
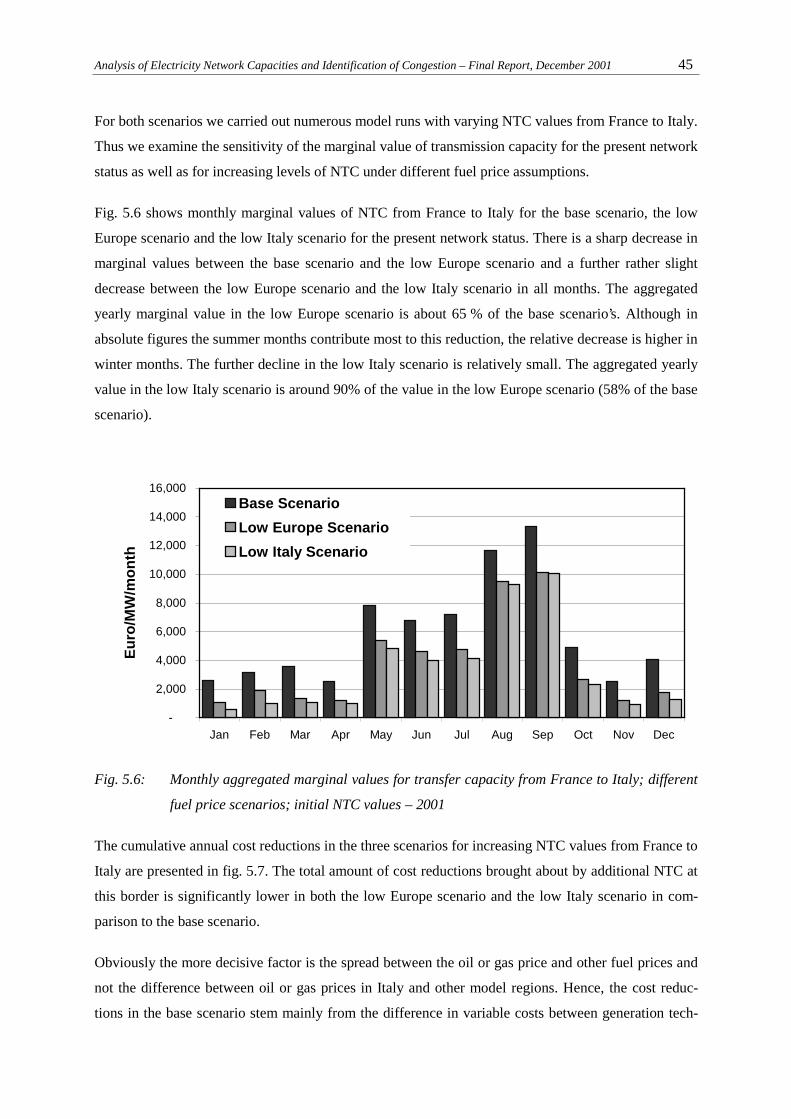
5.3.3 Results for the base scenario 40
5.3.4 Results of the sensitivity analysis 44
5.3.5 Summary 46
5.4 Considerations for France-Spain based on dispatch information 47
5.5 Evaluation of transmission capacity auctioning results 51
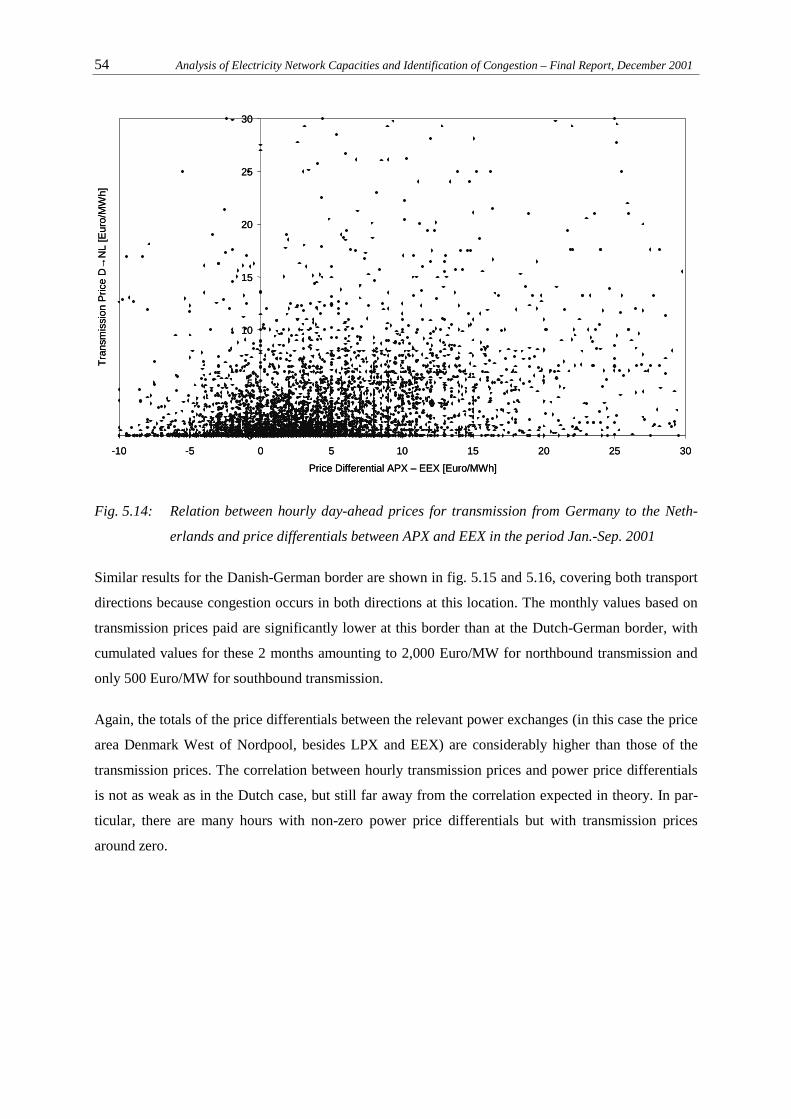
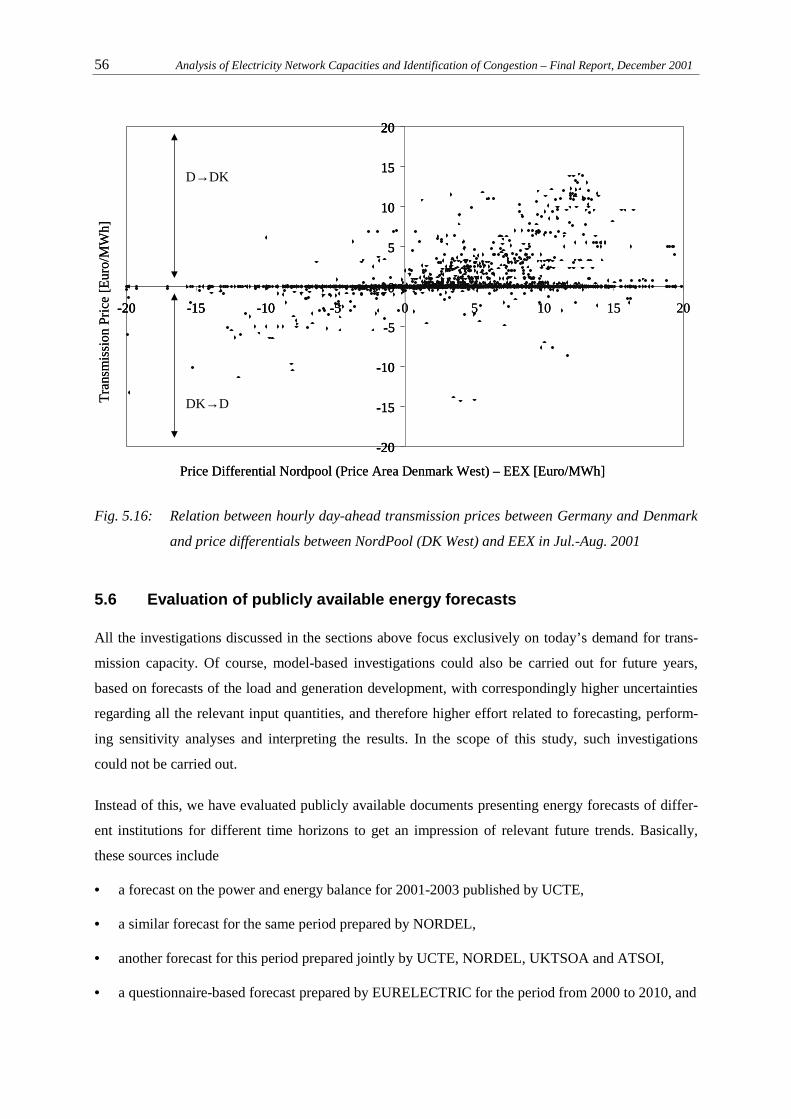
5.6 Evaluation of publicly available energy forecasts 56
5.7 Determination of network density 57
5.8 Conclusions 61
Page 6
ii Analysis of Electricity Network Capacities and Identification of Congestion – Final Report, December 2001
6 General considerations on “soft measures” to increase transmission capacity 63
6.1 Principles of capacity determination and allocation 63
6.1.1 General remarks on the applicability of NTC values 63
6.1.2 Co-ordinated capacity allocation 64
6.1.3 Cross-border congestion management 68
6.1.4 Probabilistic evaluation of operational uncertainties 69
6.1.5 Transparency and harmonisation 72
6.2 Extension of operational limits 73
6.2.1 Assumptions on environmental conditions 73
6.2.2 Temporary overload and corrective measures 77
6.2.3 Neglecting rare failures 78
6.3 Costs of soft measures 80
6.4 Legal issues 80
6.5 Conclusions 81
7 General considerations on network reinforcement measures 82
7.1 Overview on possible reinforcement measures 82
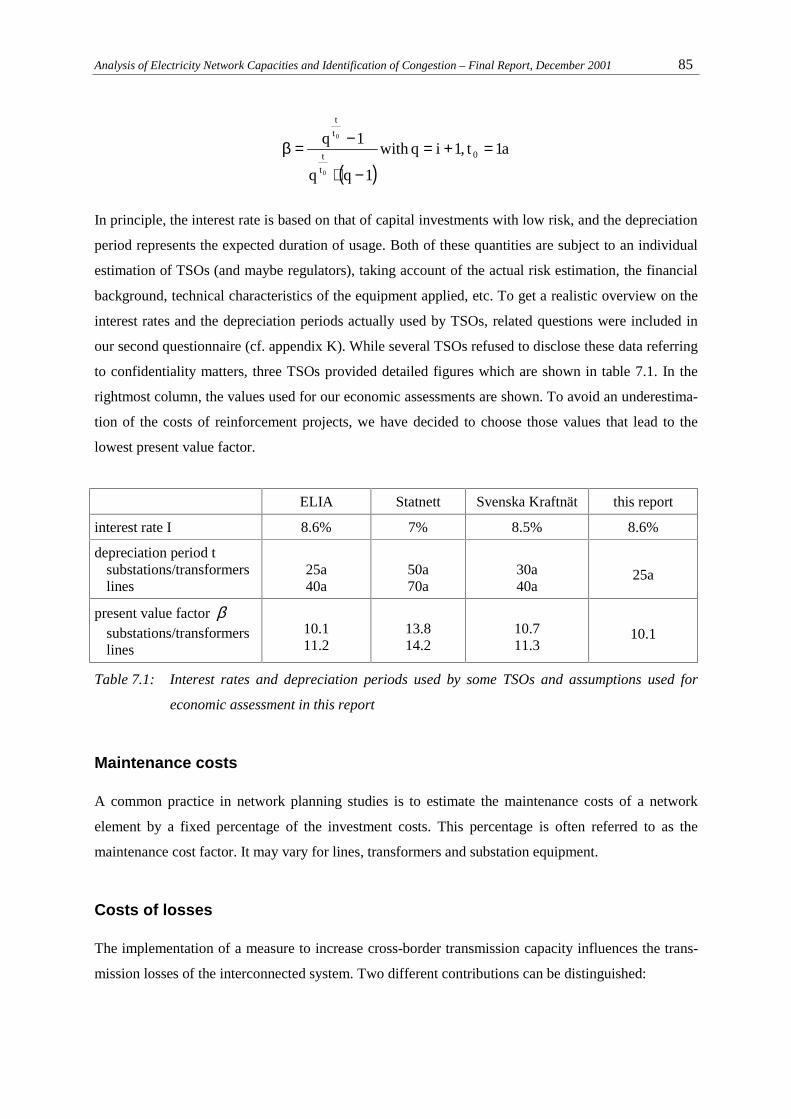
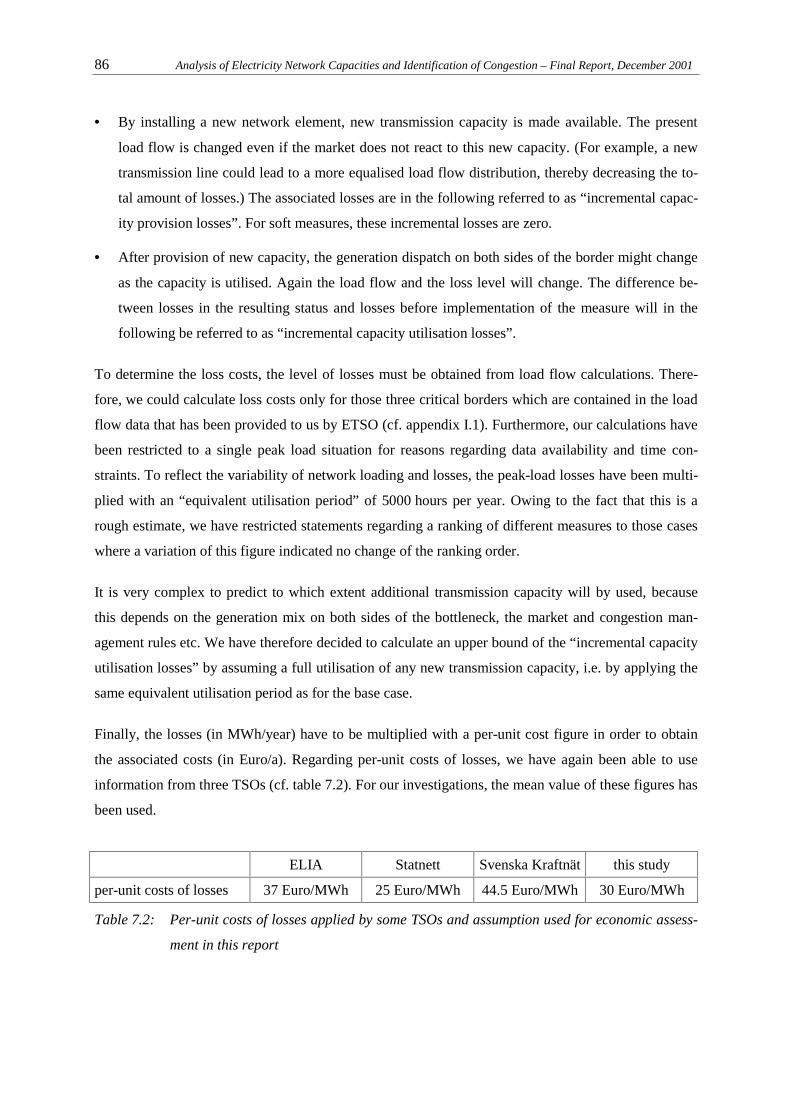
7.2 Economic assessment 84
7.2.1 Cost determination 84
7.2.2 Evaluation criteria 87
7.3 Feasibility issues 87
7.4 TEN projects of common interest 88
8 Evaluation of measures to increase individual cross-border capacities 89
8.1 Overview 89
8.2 Significance of load flow based investigations as evaluation criterion 89
8.3 France/Switzerland/Austria(/Slovenia) → Italy 90
8.3.1 Soft measures 90
8.3.2 Network reinforcement 92
8.3.3 Evaluation 95
8.4 Germany ↔ Denmark 96
8.4.1 Soft measures 96
8.4.2 Network reinforcement 98
8.4.3 Evaluation 99
8.5 Belgium/Germany → Netherlands & France → Belgium 100
Page 7
Analysis of Electricity Network Capacities and Identification of Congestion – Final Report, December 2001 iii
8.5.1 Soft measures 100
8.5.2 Network reinforcement 104
8.5.3 Evaluation 107
8.6 France → Spain 108
8.6.1 Soft measures 108
8.6.2 Network reinforcement 109
8.6.3 Evaluation 112
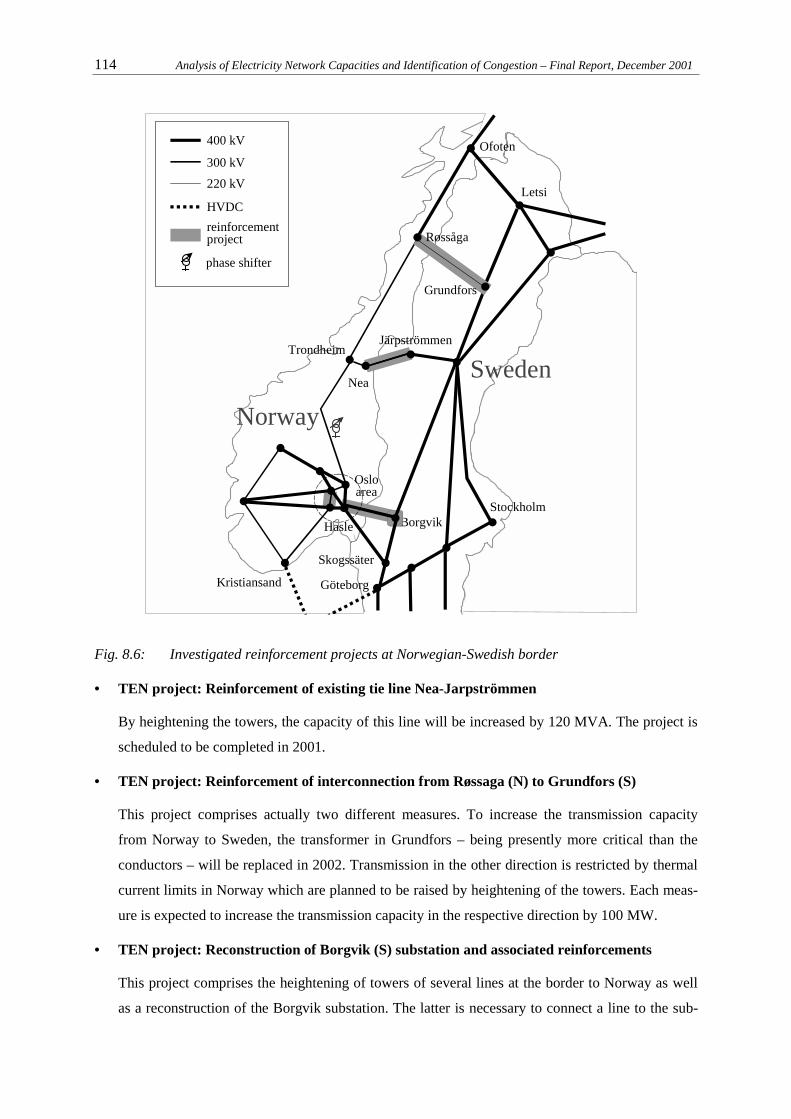
8.7 Norway ↔ Sweden 112
8.7.1 Soft measures 113
8.7.2 Network reinforcement 113
8.7.3 Evaluation 115
9 Conclusions 117
9.1 Observations 117
9.2 General recommendations 118
9.3 Recommendations for individual borders 123
9.3.1 France/Switzerland/Austria(/Slovenia) → Italy 123
9.3.2 France → Spain 124
9.3.3 Belgium/Germany → Netherlands & France → Belgium 124
9.3.4 Germany ↔ Denmark 125
9.3.5 Norway ↔ Sweden 126
10 References 127
Appendix A-1
A Meetings held in the course of this study A-1
B Electricity transmission and network access B-1
B.1 Interconnected power systems in Europe B-1
B.2 Technical aspects of interconnected transmission systems B-5
B.2.1 Power balancing B-5
B.2.2 AC transmission B-5
B.2.3 DC transmission B-7
B.2.4 Network security requirements B-8
B.3 Access to transmission systems B-9
B.3.1 Basic principles B-9
B.3.2 Definitions of transmission capacity B-13
Page 8
iv Analysis of Electricity Network Capacities and Identification of Congestion – Final Report, December 2001
B.3.3 NTC Assessment B-14
C Present state of cross-border access to transmission networks C-1
C.1 General country-related information on transmission access C-1
C.1.1 Key figures on electricity supply C-1
C.1.2 Status of electricity market opening C-2
C.2 Regulators, TSOs, network access and market organisation C-2
C.3 Cross-border connections of the European transmission systems C-10
D Additional information on the determination and allocation of cross-border transmission
capacity D-1
D.1 Determination of indicative NTC values published by ETSO D-1
D.1.1 Data base and methodology D-1
D.1.2 Assessment of network security D-3
D.1.3 Limits of feasible network operation D-4
D.1.4 Determination of TRM D-7
D.1.5 Summary of NTC determination principles D-8
D.2 Methods for allocation of cross-border capacity and determination of allocable capacity D-12
D.2.1 Portugal ↔ Spain D-12
D.2.2 France ↔ Spain D-13
D.2.3 France ↔ Great Britain D-14
D.2.4 France ↔ Belgium D-14
D.2.5 France ↔ Germany D-15
D.2.6 Netherlands ↔ Belgium/Germany D-15
D.2.7 Germany ↔ Denmark D-16
D.2.8 Germany ↔ Sweden D-16
D.2.9 France/Switzerland/Austria ↔ Italy D-17
D.2.10 Borders inside the NORDEL interconnection D-18
E Individual analysis of cross-border transmission congestion E-1
E.1 Overview E-1
E.2 Portugal ↔ Spain E-1
E.3 France ↔ Spain E-3
E.4 France ↔ Great Britain E-5
E.5 France ↔ Belgium E-6
Page 9
Analysis of Electricity Network Capacities and Identification of Congestion – Final Report, December 2001 v
E.6 France ↔ Germany E-7
E.7 Netherlands ↔ Belgium/Germany E-8
E.8 Germany ↔ Denmark E-12
E.9 Germany ↔ Sweden E-16
E.10France/Switzerland/Austria(/Slovenia) ↔ Italy E-16
E.11Austria ↔ Switzerland E-19
E.12Austria ↔ Germany E-19
E.13Finland ↔ Sweden E-21
E.14Norway ↔ Sweden E-21
F Details on investigations regarding transmission capacity demand F-1
F.1 Details on the model-based investigation for France-Italy F-1
F.1.1 The model EUDIS F-1
F.1.2 Parameterisation F-5
F.1.3 Simulation results F-7
F.2 Details on the evaluation of publicly available energy forecasts F-12
F.2.1 Introduction F-12
F.2.2 Forecast documents F-13
F.2.3 Results F-19
G Probabilistic approach to derive assumptions for ambient temperatures G-1
G.1 Variation with respect to time of year and time of day G-1
G.2 Relation between probability of excessive temperature and resulting temperature
assumptions G-3
H Assumptions on investment and maintenance costs H-1
I Load flow based investigations I-1
I.1 Overview and data base I-1
I.2 Determination of network density I-1
I.2.1 Algorithm I-1
I.2.2 Results I-3
I.3 Measures to increase transmission capacity I-5
I.3.1 Methodology I-5
I.3.2 France/Switzerland/Austria(/Slovenia) → Italy I-8
I.3.3 Germany → Netherlands & France → Belgium/Netherlands I-14
Page 10
vi Analysis of Electricity Network Capacities and Identification of Congestion – Final Report, December 2001
I.3.4 France → Spain I-19
J Questionnaire on NTC Assessment and Congestion J-1
J.1 NTC Assessment J-1
J.1.1 TTC Assessment J-1
J.1.2 TRM assessment J-5
J.2 Congestions J-6
K Questionnaire on measures to increase transmission capacity K-1
K.1 Purpose of this questionnaire K-1
K.2 Operational Measures K-1
K.2.1 Variation of ambient temperature K-1
K.2.2 Other operational measures K-3
K.3 Network reinforcements K-3
K.3.1 Planned network reinforcements K-3
K.3.2 Evaluation of network reinforcements K-5
Page 11
Analysis of Electricity Network Capacities and Identification of Congestion – Final Report, December 2001 vii
Abbreviations
Country codes
A Austria GR Greece
B Belgium I Italy
CH Switzerland IRL Ireland
D Germany L Luxembourg
DK Denmark N Norway
E Spain NL The Netherlands
F France P Portugal
FIN Finland S Sweden
GB Great Britain
Other abbreviations
AC Alternating current
ATSOI Association of Transmission System Operators of Ireland
BCE Base case exchange
CCGT Combined Cycle Gas Turbine
CHP Combined Heat and Power
CENTREL Association of transmission system operators of Czechia, Hungary, Poland, and Slovakia
DACF Day ahead congestion forecast
DC Direct current
DVG Deutsche Verbundgesellschaft (Association of German TSOs)
ETSO European Transmission System Operators Association
FACTS Flexible AC transmission systems
NORDEL Organisation för nordiskt elsamarbete (Association of Nordic TSOs)
NTC Net Transfer Capacity
NTPA Negotiated third party access
Page 12
viii Analysis of Electricity Network Capacities and Identification of Congestion – Final Report, December 2001
OCGT Open Cycle Gas Turbine
RES Renewable Energy Sources
RTPA Regulated third party access
SB Single buyer
SMC System marginal cost
SPS Special protection system
TRM Transmission Reliability Margin
TSO Transmission System Operator
TTC Total Transfer Capacity
UCTE Union pour la Coordination du Transport de l’Électricité
UKTSOA United Kingdom Transmission System Operators Association
Page 13
Analysis of Electricity Network Capacities and Identification of Congestion – Final Report, December 2001 I
Executive Summary
In the context of the creation of an internal European electricity market, the existence of sufficient
cross-border transmission capacities and their efficient utilisation gain crucial importance. Histori-
cally, transmission system operators (TSOs) have not designed the interconnections between their
networks primarily to facilitate bulk power trade, but rather to achieve better reliability and efficiency
of supply through co-operation among them. Hence, the introduction of open access to transmission
networks has made a number of bottlenecks in cross-border transmission capacity visible that can have
an adverse effect on competition and thus on the integration of the internal market.
On this background, the European Commission has assigned us to carry out a comprehensive investi-
gation on electricity transmission capacities between the EU member states plus Norway and Swit-
zerland, with the objectives
• to analyse the approaches applied by TSOs to determine the operationally utilisable levels of
cross-border transmission capacity, among others for the purpose of publishing net transfer ca-
pacities (NTCs), and to propose possible improvements,
• to identify bottlenecks in the cross-border transmission systems and to categorise them into critical
and less critical ones,
• to investigate the present and future demand for additional transmission capacity specifically at the
locations of the critical bottlenecks, and
• to identify and evaluate possibilities to increase the level of usable cross-border transmission ca-
pacity at the critical locations, including so-called “soft measures” that require no or only insig-
nificant investments, investment options other than new lines, like the installation of power flow
controllers or the reinforcement of existing connections, as well as the construction of new lines,
taking into account also projects that have been identified as projects of common interest in the
context of the “Trans-European Networks” (TEN) programme.
We have subdivided the work on this study into two phases:
• In the first phase that has been completed by the submission of an interim report, we have gath-
ered information about the operational methods, definitions, etc. applied to determine cross-border
transmission capacity, and about the occurrence and severity of congestion of the existing capac-
ity, mainly in personal meetings with TSOs and network users.
• In the second phase, we have on the one hand investigated the demand for additional transmission
capacity at the critical bottlenecks based on diverse approaches. On the other hand, we have
evaluated possibilities to increase usable transmission capacity across these bottlenecks by a range
Page 14
II Analysis of Electricity Network Capacities and Identification of Congestion – Final Report, December 2001
of measures as outlined above. This has involved further intensive communication with TSOs,
complemented by our own investigations including load flow modelling and other approaches.
The attempt to derive quantitative information on the demand for additional capacity at the critical
bottlenecks has turned out to be a particularly difficult task, and we could hardly gather any relevant
information on this issue from TSOs and market participants. Moreover, it is not even clear how to
define transmission demand properly, because this is not only an engineering or economic question,
but also a political one. Therefore, instead of seeking for a unique approach to this task, we have car-
ried out several fundamentally different investigations to highlight different possible viewpoints to this
issue. We have included the following approaches, some of which focus only on one or few of the
critical bottlenecks due to limitations of time and data availability:
• an investigation of the short-term marginal value of transmission capacity based on a generation
dispatch model, carried out by the Institute of Energy Economics (EWI) at the University of Co-
logne, acting as a subcontractor;
• an investigation of the results of transmission capacity auctioning procedures, also aiming at
evaluating the short-term value of transmission capacity;
• an evaluation of publicly available energy forecast documents with the objective to identify key
trends in the development of load and generation in the relevant countries that might lead to sig-
nificant changes of cross-border transmission demand in the longer term; and
• an evaluation of the network density inside countries and across borders, independent from loca-
tions, capacities and dispatch of generation units.
The conclusions that we have drawn from the whole of our investigations can be subdivided into ob-
servations, general recommendations and border-specific recommendations. Essential observations
about the determination of cross-border transmission capacity are:
• There is an important difference between indicative, non-binding NTC values published by ETSO
twice a year, and capacity values used for the actual allocation of transmission rights at individual
borders. Since the degree of coherence between these types of capacity figures differs considera-
bly from TSO to TSO, the discussion on the further development of rules and standards for capac-
ity determination should not only be focused on the official ETSO NTCs.
• All TSOs apply a uniform basic concept for the determination of cross-border transmission capac-
ity. There is however significant space for individual interpretation and parameterisation of this
concept. This leads to a large variety of the concrete details of the actually applied approaches,
which not only makes their comparison very difficult, but also can have a considerable impact on
the resulting capacity values.
Page 15
Analysis of Electricity Network Capacities and Identification of Congestion – Final Report, December 2001 III
As regards the identification of bottlenecks, we could gather sufficient information on the frequency
and severity of congestion to come to a relatively clear distinction between critical and less critical
bottlenecks. Taking into account that we have excluded bottlenecks that can only be relieved by add-
ing new DC sea cables which is on the one hand a very expensive and long-term measure and whose
impact on available capacity can on the other hand be determined very easily, we have identified the
following five interconnections as “critical”, being relevant for the further investigation:
• France → Spain,
• France → Belgium & Belgium/Germany ↔ Netherlands (to be analysed in combination),
• Denmark ↔ Germany,
• France/Switzerland/Austria(/Slovenia) → Italy, and
• Norway ↔ Sweden.
As stated above, our recommendations with respect to the necessity and possibilities of measures to
increase transmission capacity can be split into general and border-specific ones. The general recom-
mendations can be summarised as follows:
• Our analysis has revealed a fundamental problem regarding the applicability and meaningfulness
of bilateral capacity values like NTCs: the assumptions for “base case exchanges” (BCE) included
in the network model used for NTC determination are of significance for the resulting NTCs, and
they can change due to changing trading relations, without any change of the physical load flow
situation. To mitigate this problem, we recommend in the short term to request TSOs to publish
the assumptions made for BCE, and in the long term to switch to a more coordinated concept of
capacity allocation that would reduce the importance of NTC values.
• The fact that a variety of aspects in capacity determination are treated very differently among
TSOs promises a potential for improvements through harmonisation. However, due to the strong
interdependencies between these aspects, it would not be recommendable to identify the “best
practice” with respect to each single aspect and to synthesise a best practice solution as a basis for
harmonisation, because this would probably not lead to a uniform “quality level” of transmission
services. Instead, we recommend to aim at a harmonising the overall level of “risk” associated to
the determination of transmission capacity, with risk being defined as the probability of undesired
measures like re-dispatch or supply interruptions, multiplied with the respective cost or damage.
This would leave the specification of single aspects of capacity determination up to subsidiarity,
but harmonise the resulting quality level as seen by the network users.
Page 16
IV Analysis of Electricity Network Capacities and Identification of Congestion – Final Report, December 2001
• Since a complete and unified risk assessment as proposed above will not be achievable in the short
term for several reasons, concrete efforts should be spent on an improved assessment of single
contributions to the overall risk, as far as possible on a probabilistic basis. Even without having
defined target levels for these risk contributions, improvements could be achieved by levelling the
partial risks over time or among TSOs. This requires first of all that TSOs separate more properly
the treatment of the relevant factors that influence this risk. On this basis, several approaches for
improvement can be taken, two of which are outlined below:
o The actual transmission capacity of overhead lines varies over time, because it depends on the
prevailing environmental conditions. Encouraged by the good experience of several TSOs, we
recommend to take the systematic influence of ambient temperature on the transfer capacity of
lines explicitly into account, by applying seasonally varying transfer limits as far as possible.
o TSOs can influence the quality level of transmission by applying corrective measures in the
operational phase (corrective switching; re-dispatch) when unexpected events occur or simply
a number of unfavourable influences accumulate. We recommend to take this possibility of
occasional countermeasures into account in the process of capacity determination in a more
systematic way, because this could lead to increased capacity values.
• Besides technical aspects that we have mainly focused on, several TSOs have indicated that also
legal issues can be obstacles to the implementation of approaches that are already applied in other
countries or that are suggested on the basis of our results. This should be kept in mind when dis-
cussing the possibilities of improvement, and the affected TSOs should be requested to highlight
such obstacles when they are confronted with the approaches discussed in this study.
• An issue that is often raised in the context of capacity determination is the potential benefit of
additional transparency by more comprehensive publication of details about the methods applied,
about underlying definitions and statistical evaluations, and about retrospective evaluations of the
actual utilisation of capacity. Although not directly influencing available capacity, we agree that
such publications can be expected to have an indirect positive effect both by influencing the be-
haviour of TSOs and by giving network users better insight into the relevant interdependencies.
In the following, we briefly summarise our findings related to individual borders identified earlier as
critical bottlenecks, presented in the order of decreasing priority as regards measures to increase
transmission capacity:
• At the Italian border, the economic value of transmission capacity has been identified to be re-
markably high, and the network density appears clearly lower at this border than inside the adja-
cent countries. Therefore we come to the conclusion that besides two promising soft measures,
specifically the abolishment of the (n-2) criterion applied for a French-Italian double circuit line
Page 17
Analysis of Electricity Network Capacities and Identification of Congestion – Final Report, December 2001 V
and the application of seasonally differentiated line ratings for internal Italian lines, also invest-
ment measures should be pursued. Apart from a new phase shifting transformer on the French
side, we have analysed a number of new tie line projects from France, Switzerland or Austria to
Italy whose cost/benefit ratios are roughly in the same magnitude and which should therefore be
assessed rather in the light of authorisation issues.
• Based on rough estimations of the economic value of transmission capacity and on the evaluation
of network density, we conclude that also the French-Spanish border is a relatively urgent can-
didate for measures to increase transmission capacity. Since the potential of soft measures is al-
ready more or less fully exploited at this border, this implies the need to consider investment
measures. Besides a few minor reinforcements to be implemented in the short term, a significant
capacity increase can only be achieved by constructing new tie lines, of which we have analysed
three alternatives with similar cost/benefit ratios but different chances of being realisable.
• Regarding the Dutch border, our investigations indicate a relatively high economic value of
transmission capacity today, but a limited need of adding new interconnection capacity in the long
term. Therefore, besides the implementation of the phase shifter project in Meeden that has al-
ready started, we recommend to strive for application of the soft measure of increasing the thermal
current limits on the German side in the colder periods of the year.
The fact that there is no direct interconnection at the German-Belgian border does in our opinion
not necessarily lead to the conclusion that such an interconnection should be constructed. Rather, a
co-ordinated approach of capacity allocation appears particularly promising for this network area.
Regarding the French-Belgian border which is also frequently congested, we have analysed dif-
ferent investment projects whose benefit depends on the assumptions for the import demand of
Belgium and the Netherlands. Besides French-Belgian tie lines, these projects include also the re-
inforcement of a French-German tie line.
• For the German-Danish border, the economic value of transmission capacity according to capac-
ity auctioning results has turned out to be relatively low in both directions. In the longer term, the
demand for transmission capacity might however grow due to transits and wind generation. We
recommend mainly to clarify some details in the context of capacity determination that might re-
veal potential for soft measures. An investment project that we have analysed appears hardly rec-
ommendable at the moment due to its high cost and difficult authorisation situation.
• According to our own considerations and those of the TSOs, the demand for additional transmis-
sion capacity at the Swedish-Norwegian border appears rather low at the moment. Taking into
consideration a number of projects that will soon be implemented, we do not see an urgent need to
identify further measures to increase capacity at this border.
Page 19
Analysis of Electricity Network Capacities and Identification of Congestion – Final Report, December 2001 1
1 Introduction and objective
In the process of the liberalisation of the electricity supply sector in Europe and the creation of an in-
ternal European electricity market, the existence and the transport capacities of cross-border intercon-
nections of the electricity transmission systems are gaining major importance. Historically, transmis-
sion systems have been built mainly to enable the secure, reliable and economically efficient electric-
ity supply within each single country or even within the area of each individual transmission system
operator (TSO). Tie-lines between the different systems have been built, too, aiming at even better
reliability and efficiency through cooperation in case of faults and through electricity trading for cost
optimisation, mainly between neighbouring systems. However, bulk power transports over long dis-
tances have not been the primary objective of linking the transmission systems.
In the internal electricity market being created in Europe, this situation is changing. Sufficient trans-
port capacity between regions and nations is a necessary prerequisite of creating trading opportunities
over short and long distance. Without sufficient trading opportunities, competition may be limited in
the affected areas. In the extreme case, the market may be split up into more or less separate zones,
which would obviously counteract the creation of a true internal market.
In fact, practical experience in the years since implementation of the electricity directive shows that on
a number of interfaces between national transmission systems, available transport capacities are not
sufficient to fully meet the demand caused by the trading transactions among market participants.
Since bottlenecks in the transmission systems can not be removed in the short term, TSOs have to set
up rules and procedures for allocating scarce transmission capacity to market actors in case of con-
gestion. There exist fundamentally different approaches to capacity allocation, but the common start-
ing point is usually the determination of available and thus allocable capacities. In order to give mar-
ket participants an indicative overview of existing transmission capacities, European TSOs, on the
level of their association ETSO, have started to publish non-binding values for the “Net Transfer Ca-
pacity” (NTC) on the cross-border transmission interfaces between their systems.
In the long run, transmission system bottlenecks may be removed by network reinforcement, e.g. by
building new lines or transformers, by upgrading existing ones, or by installing power flow control-
lers. Most reinforcement projects like that are however highly capital-intensive and time-consuming,
and have a more or less considerable impact on the environment, and therefore need to be planned
very carefully.
On this background, it appears necessary firstly to make optimal use of existing transmission capacity,
and secondly to identify possibilities of capacity expansion that can be implemented quickly and at
Page 20
2 Analysis of Electricity Network Capacities and Identification of Congestion – Final Report, December 2001
low expenditure. With respect to cross-border transmission, these objectives can likely be better pur-
sued from a Europe-wide perspective than from a single country’s or TSO’s perspective, because:
• differences in the methods and underlying standards applied for the determination of transmission
capacity like the definition of transfer limits of lines or the specification of necessary security
margins may only be identified by comparing practices and experiences of different TSOs,
• an internationally harmonised attitude towards the trade-off between high utilisation of existing
capacity and the risk of short-term curtailment of confirmed transactions due to insecure network
states still has to be developed,
• the incentives for TSOs to strive for an optimal utilisation and for efficient expansion of cross-
border transmission capacity may be very different from country to country, and
• efficient technical measures to increase cross-border transmission capacity may be easier to im-
plement and to find acceptance if pursued by the Community and not only by single TSOs.
In order to support a development towards the objectives outlined above, the European Commission
has assigned us to carry out this study, with the following objectives:
• to analyse the operational methods, definitions, criteria and standards applied by TSOs to deter-
mine cross-border transmission capacities; to compare the findings, and to propose possible im-
provements,
• to identify bottlenecks in the cross-border transmission systems and to categorise them into critical
and less critical ones,
• to investigate the present and future demand for additional transmission capacity specifically at the
locations of the critical bottlenecks, and
• to identify and evaluate possibilities to improve the utilisation or to increase the level of cross-
border transmission capacity at the critical locations in terms of operational improvements, rein-
forcement of existing capacity, or construction of new capacity. In this context, the list of projects
of common interest identified in the framework of the “Trans-European Networks” (TEN) pro-
gramme of the EU shall be reviewed.
Geographically, this study focuses on the interfaces between the transmission systems of the EU
member states plus Norway and Switzerland, because the latter two are strongly integrated in the in-
ternal electricity market. Transfer capacities to countries other than the above are not included.
Moreover, some countries that are in principle in the scope of this study, but do not have their trans-
mission systems connected with those of at least one other country in the same scope are not further
Page 21
Analysis of Electricity Network Capacities and Identification of Congestion – Final Report, December 2001 3
investigated. This applies basically to Greece and Ireland as well as the Scottish and Northern Irish
parts of Great Britain.
Our approach for this investigation is subdivided into two phases:
• In the first phase that has been completed by the submission of an interim report, we have gath-
ered information about the operational methods, definitions, etc. applied to determine cross-border
transmission capacity, and about the occurrence and severity of congestion of the existing capac-
ity, by communicating with TSOs and network users. As one of the results of this phase, we have
identified a list of critical bottlenecks to be further investigated in the second phase.
• In the second phase, we have on the one hand investigated the demand for additional transmission
capacity at the critical bottlenecks based on diverse approaches. On the other hand, we have
evaluated possibilities to increase usable transmission capacity across these bottlenecks by im-
provement and/or harmonisation of the principles for capacity determination, by other operational
improvements, or by network reinforcement. This has been done by further intensive communica-
tion with the involved TSOs and by our own investigations including load flow modelling and
other approaches.
The methodology of this study and the structure of this report are outlined in more detail in chapter 2.
As an overall structure, we have subdivided the report into a main part and a series of appendixes. The
main part is intended to suffice for readers who are familiar with the fundamentals of electricity
transmission and network access and who are basically interested in a rough description of the meth-
odologies applied, and in discussions, interpretations and conclusions of the results obtained. The ap-
pendixes comprise explanations of fundamental issues, details of our investigation approaches and
results, and details regarding our communication with TSOs and other parties.
Regarding the scope of this study, it is important to clarify that it does not include a detailed analysis
and discussion of the specific network access arrangements inside the countries or for cross-border
transmission as far as they relate only to the allocation of capacity to market participants, to measures
taken in the short term to fulfil transmission services committed, or to pricing for transmission access
or other aspects of financial compensation. These issues that have been discussed extensively in the
context of the “Florence process”, including among others our study of 1999 [1], will be taken up in
this report only insofar as they may have an impact on the actual amount of allocable transmission
capacity. In other words, this study focuses on factors influencing the allowable physical levels of
power transport across borders.
At this place, we would like to thank all the involved TSOs and their organisations for giving us ex-
tensive and valuable support for this study by comprehensive communication, including numerous
Page 22
4 Analysis of Electricity Network Capacities and Identification of Congestion – Final Report, December 2001
personal meetings, to answer and discuss our questionnaires, to discuss our ideas, methodologies and
results, and to comment on documents circulated throughout this study like the interim report and a
survey of the results of our load flow calculations. We also thank the TSOs for providing load flow
data of the UCTE system needed for our investigations.
In the context of the investigation of the demand for additional transmission capacity, we have as-
signed a sub-task, specifically the analysis of the value of transmission capacity at the Italian border
based on a generation dispatch model, to the Institute of Energy Economics (EWI) at the University of
Cologne. The results of this investigation are presented in section 5.3 of this report and section F.1 of
the appendix. We would like to express our thanks to EWI for this valuable contribution to the study.
Finally to this introduction, we would like to point out, regarding the terms used in this report,
• that for the sake of simplicity, we frequently use the term “European countries” to denote only
those countries covered by the scope of this study (EU member states plus Norway and Switzer-
land), and
• that we understand the term “transmission capacity” such as to denote the total transmission capa-
bility of the network between two (groups of) countries that can be utilised in a secure way, not
only the available capacity that remains after partly allocating capacity, and not associated exclu-
sively to one of the capacity values as defined by the TSOs,
as far as it is not explicitly stated otherwise.
Page 23
Analysis of Electricity Network Capacities and Identification of Congestion – Final Report, December 2001 5
2 Methodical approach
As outlined above, our approach to this study is subdivided into two phases. The sections below de-
scribe the objectives and methodologies of each phase and give an overview of the structure of this
report.
2.1 Phase 1: Capacity determination methods and transmission bottlenecks
The main objectives of phase 1 of the project have been
• to prepare an overview of the methods and the underlying definitions, criteria and standards ap-
plied by the TSOs to determine cross-border transmission capacities both for the purpose of publi-
cation of NTC values and for the actual capacity allocation, and
• to identify critical bottlenecks in the cross-border networks that have to be further analysed in the
second phase of the project.
To gather the required information, we have basically started a communication process with the TSOs
in the area covered by this study, based on a comprehensive questionnaire that we have circulated, and
followed by personal meetings and/or other forms of communication with almost all TSOs. (A list of
meetings having taken place in both phases of the study is given in appendix A). The questionnaire
(see appendix J) focuses primarily on the principles of NTC determination. Besides briefly summaris-
ing our view of the basic principles of capacity determination, it contains questions on all those issues
that, in our opinion, are not precisely defined in the definitions published by ETSO, and therefore re-
quire individual interpretation by each TSO, often including individual risk assessment. These issues
are:
• the basic algorithm of NTC determination, including the way in which generation changes are
broken down to the generating units in the own (internal) and the external network areas,
• the selection and, possibly, adjustment of a base case load flow model for the relevant intercon-
nected system,
• the criteria and methods for evaluation of network security, including the selection of relevant
contingencies, the consideration of automatic control mechanisms and manual corrective actions
in contingency cases, the range of load and generation situations analysed in addition to the base
case, and the experiences about the question which contingencies and which types of technical
limits of network operation usually turn out to be critical,
• the specification of technical limits to be taken into account in network security assessment, in-
cluding the driving factors for the definition of power transfer limits of lines and transformers
Page 24
6 Analysis of Electricity Network Capacities and Identification of Congestion – Final Report, December 2001
(physical properties, environmental conditions, configuration of network equipment and protection
systems), the ranges of tolerance regarding temporary overloading, the relevance and values of
voltage limits, and the relevance of stability limits, and
• the determination of the contributions to the reliability margin TRM and the resulting overall val-
ues of TRM.
Besides this, in order to identify existing bottlenecks, the questionnaire contains questions on the ac-
tual occurrence of cross-border network congestion and possible capacity allocation procedures, par-
ticularly including
• the time periods during which congestion usually occurs at which borders, and
• the frequency and time horizons of the determination of allocable capacity, as far as capacity allo-
cation procedures are in place, and the differences of the methods applied for this in comparison to
the methods applied for NTC determination.
The results of the communication process with TSOs are presented in chapters 3 and 4 of this report,
with details given in appendixes D and E. As a fundamental result for the further investigation, we
have identified five (groups of) border sections as critical bottlenecks.
With a particular view to the identification of critical bottlenecks, we have also had discussions with
representatives of network users, especially traders and consumers. The positions and experiences
expressed by these market parties are occasionally pointed out in the chapters referred to above. Gen-
erally, these discussions have shown that it is difficult for network users to develop an understanding
of the plausibility of the published values of transmission capacity, due to an overall lack of transpar-
ency regarding the technical requirements and methods applied.
In addition to the aforementioned discussions with TSOs and network users, we have gathered general
information that has flown into this report by reviewing documents published by Internet or elsewhere.
Amongst others, such publicly available information could be used as an additional input to the analy-
sis of the severity of congestions.
During phase 1, we have also prepared a chapter explaining fundamental issues of electricity transmis-
sion and network access (appendix B), including amongst others a section about the definitions of
transmission capacity used by ETSO, and an overview of the present state of cross-border access to
transmission networks in the investigated area (appendix C), including key figures of electricity supply
and market opening as well as lists of relevant regulators, TSOs and market parties for each country,
and an overview of existing cross-border connections.
Page 25
Analysis of Electricity Network Capacities and Identification of Congestion – Final Report, December 2001 7
Phase 1 has been completed in June 2001 by the submission of an interim report.
2.2 Phase 2: Demand and possibilities to increase transmission capacity
The objectives of the second phase have been
• on the one hand to investigate the potential demand for additional transmission capacity at the
bottlenecks having been identified as critical, and
• on the other hand to identify and to evaluate possibilities to increase transmission capacity at these
locations if this turns out necessary.
In phase 1, the severity of congestion at individual borders has been assessed in a qualitative way. This
has allowed for a distinction between critical and less critical bottlenecks, but it does not suffice to
estimate the demand for additional capacity at these locations. For this purpose, deeper investigation is
required. However we have recognised quickly that the quantitative evaluation of the demand for
transmission capacity is a particularly difficult task, and we could hardly gather any relevant informa-
tion on this issue in our discussions with TSOs and market participants. Moreover, it is not even clear
how to define transmission demand properly, because this is not only an engineering or economic
question, but also a political one. Therefore, instead of seeking for a unique approach to this part of the
study, we have carried out several investigations of very different kind, partly focusing only on one or
few of the critical bottlenecks. These approaches are:
• an investigation of the short-term marginal value of transmission capacity based on a generation
dispatch model;
• an investigation of the results of transmission capacity auctioning procedures, also aiming at
evaluating the short-term value of transmission capacity;
• an evaluation of publicly available energy forecast documents with the objective to identify key
trends in the development of load and generation in the relevant countries that might lead to sig-
nificant changes of cross-border transmission demand in the longer term; and
• an evaluation of the network density inside countries and across borders, independent from loca-
tions, capacities and dispatch of generation units.
The methodologies and results of these investigations are presented in chapter 5. Details on some of
the approaches can be found in sections F and I.2 of the appendix.
Page 26
8 Analysis of Electricity Network Capacities and Identification of Congestion – Final Report, December 2001
The major part of the work in the second phase has been dedicated to the identification and evaluation
of possible measures to increase transmission capacity. In general, the range of measures analysed
reaches from
• so-called “soft measures” that require no or only insignificant investments, like improvement and
harmonisation of operational approaches or standards relating to the definition of technical limits,
to the way in which different sources of operational uncertainty are taken into account, to toler-
ances regarding short-term overloading of network elements, etc.;
• investments other than the construction of new lines, like the installation of power flow controlling
devices in conventional or FACTS technology, or the reinforcement of weak spots of existing in-
terconnections; down to
• the construction of new lines, including projects that have been identified as projects of common
interest in the context of the “Trans-European Networks” programme (TEN).
Our approach to the investigation of these measures has again included extensive communication with
the TSOs affected by the critical bottlenecks, including a second round of personal meetings. As a
basis for discussion, we have circulated individual questionnaires in advance of these meetings. The
template of these questionnaires is given in appendix K.
In parallel to this, we have carried out technical investigations on the possibilities and the impact of
such measures based on data that has been available to us beforehand or could be procured during the
study. At the end of phase 2, we have in particular received from TSOs a load flow data set covering
the UCTE area that we could apply to simulate the effects of potential measures. Apart from technical
investigations, we have also gathered information about the cost of such measures in this phase.
For this report, we have split the presentation and discussion of our results into general considerations
on “soft measures” and reinforcement measures (chapters 6 and 7 and appendix G) that do not relate to
specific bottlenecks, and an individual evaluation of potential measures for each of the 5 critical bot-
tlenecks (chapter 8, with details on the results of the load flow investigations given in appendix I.3).
A final evaluation of the necessity and the possibilities of measures to increase transmission capacity
along with our recommendations is given in chapter 9.
Page 27
Analysis of Electricity Network Capacities and Identification of Congestion – Final Report, December 2001 9
3 Determination and allocation of cross-border transmission capacity
3.1 Overview
This chapter deals with the methods and standards presently used by the TSOs to determine capacity
available for cross-border power transmission. Its purpose is to describe and to structure information
on the related aspects in order to prepare a basis for the development of possible improvements in later
chapters. The analysis is divided into two sections:
• In a joint effort to provide consistent, although only indicative, capacity values, ETSO has in 1999
started publishing so-called net transfer capacities (NTCs) twice a year. While the terms and defi-
nitions associated to these values are specified in detail [5], the methods and standards applied by
the TSOs to obtain them are documented only roughly [6] and leave many degrees of freedom.
Section 3.2 aims at bringing transparency to the process of NTC determination as it is carried out
by the individual TSOs. The analysis is structured by the different aspects that have an influence
on the capacities, thereby allowing for an easy assessment of the common solutions as well as the
differences between the treatment of these aspects by the numerous TSOs.
• The aforementioned NTC values are only indicative, non-binding estimates, and for a number of
reasons their applicability for actual allocation of cross-border capacity to network users is ques-
tionable. However, at borders where allocation methods are applied a determination of allocable
capacities is indispensably required prior to the allocation phase. These allocable, binding capaci-
ties constitute the actual limit of cross-border trade. In section 3.3 we outline in which way the
determination of those capacities that are allocable to market participants differs from the determi-
nation of the ETSO NTC values.
In principle, the analysis covers all countries considered relevant with respect to cross-border issues in
the sense of this study (cf. chapter 1). For different reasons, NGC (GB), CEGEDEL (L), and TIWAG
(A) do not perform explicit calculations of cross-border capacity. Nevertheless, information from these
TSOs is also included as far as general aspects like security criteria are concerned. The analysis is
based on the results of the questionnaires sent to the TSOs as well as numerous subsequent contacts
with TSO representatives. (Regarding TenneT (NL), a recent audit on the applied capacity determina-
tion procedures [7] has been used as an additional source of information.)
Page 28
10 Analysis of Electricity Network Capacities and Identification of Congestion – Final Report, December 2001
3.2 Determination of indicative NTC values published by ETSO
3.2.1 Data base and methodology
Organisation of NTC determination
In principle, NTC is calculated for each border between two countries. Some borders are considered in
combination in order to reflect their geographical proximity and the consequently strong mutual influ-
ence of the corresponding electrical interconnections. For each border or set of borders, the NTC is
determined individually by all adjacent countries and, in the likely case of different results, negotiated
among the involved TSOs.
In most countries a single TSO is responsible for the respective transmission system and, conse-
quently, for all NTC calculations related to this country. In countries with more than one TSO or dif-
ferent responsible parties, NTC calculation is organised as follows:
• In Germany (six TSOs under the umbrella organisation DVG), preliminary NTC values are first
determined by RWE Net and transmitted to the other TSOs in order to give them a possibility to
compare the results with their operational experience. After confirmation or adjustment of the pre-
liminary values, the final NTCs are communicated to ETSO. Corresponding to this joint proce-
dure, German TSOs have decided to prepare a joint answer to our questionnaire on capacity de-
termination.
• In Switzerland (seven TSOs of which five are engaged in cross-border transmission), NTC calcu-
lations are carried out by ETRANS (an organisation founded by the Swiss TSOs) in co-operation
with the TSOs. Swiss TSOs/ETRANS have also prepared a joint reply to the questionnaire.
• In Austria (three TSOs), NTC calculation has so far been carried out by Verbund APG for the
APG, TIWAG and VKW grids. For the future, TIWAG plan to perform independent capacity as-
sessment, whereas the operation of the VKW transmission grid is strongly integrated with EnBW
(D) (e.g. regarding load-frequency control, the VKW area is included in EnBW’s control area).
Statements with respect to this study have been presented individually by Verbund APG and
TIWAG.
• In Denmark, the transmission networks of Eltra and Elkraft are not synchronously coupled. Corre-
spondingly, capacity assessment is performed individually by each TSO.
• In Italy, the TSO (GRTN) is responsible for capacity assessment, i.e. for all investigations related
to the overall functioning of the national power system and its interconnections. Responsibility for
the safe operation of individual network elements is however in the hand of the network owners.
Page 29
Analysis of Electricity Network Capacities and Identification of Congestion – Final Report, December 2001 11
Consequently, our considerations referring to the Italian network are based on statements from
both GRTN and network owners.
Methodical approach
The method applied by all TSOs for the determination of NTC can be described by the following gen-
eral scheme:
1. A base case network model reflecting a typical load flow situation is prepared. This is further
discussed in the section “Power system data” below.
2. According to the transport direction for which the transmission capacity is to be determined, gen-
eration is increased by a fixed, relatively small amount in the exporting country/ies and de-
creased by the same amount in the importing country/ies, thereby simulating an incremental
commercial power exchange ∆E between exporting and importing area. The way in which the
overall generation shift is broken down to individual generators is discussed in the section
“Modelling of generation increase/decrease” below.
3. The resulting simulated network state is checked for fulfilment of the individual TSO’s security
criteria. This security assessment is given special attention in sections 3.2.2 and 3.2.3.
4. As long as no security limit is breached, steps 2 and 3 are repeated.
5. The highest feasible exchange ∆E denotes how much power can be additionally transmitted in the
given base scenario. However, there might already exist some power exchange between the ex-
porting and importing country/ies in the base case. As an attempt to determine – to some extent –
case-independent capacity values, the existing commercial exchange between the exporting and
the importing area in the base case (“base case exchange”, BCE) is added to ∆E to obtain the to-
tal transfer capacity TTC. The potential ambiguities arising from this procedure are discussed in
the section “Significance of commercial exchanges” below.
6. Uncertainties from numerous sources are associated to the determination of transmission capacity.
Some of these are considered explicitly, e.g. during security assessment (step 3). Others are treated
implicitly by means of a summarised security margin TRM (“transmission reliability margin”).
The TRM value is subtracted from TTC to obtain the final net transfer capacity NTC. The treat-
ment of uncertainties by the different TSOs is discussed in section 3.2.4.
Page 30
12 Analysis of Electricity Network Capacities and Identification of Congestion – Final Report, December 2001
Power system data
Due to the decentralised responsibility for the operation of the European interconnected systems (cf.
appendix B.3.1) each TSO has direct access to data on network equipment, connected generation units
as well as operational statistics only with respect to his own area of responsibility. However, the de-
termination of cross-border capacity values requires extended network models including at least
neighbouring and – in highly meshed systems – even more distant TSOs’ areas. Consequently, the
TSOs have installed procedures for data exchange as a basis for such kind of system models. (Note
that this requirement does not apply to areas being exclusively connected by DC links. Due to their
controllability, these interconnections can be regarded independent from the network region “behind”
them.)
For the UCTE interconnected system, a common load flow data set is prepared by the member TSOs
twice a year (forecasted winter and summer peak load situations). This data model comprises all
380 kV and 220 kV lines (i.e. tie lines and internal lines) and 380/220 kV transformers. Regarding the
amounts and geographical distribution of generation and load, each TSO creates a typical situation for
his own network area. Therefore, the resulting data set does not correspond to a specific, synchronous
point of time or to a real (recorded) load flow situation. Generator capacities are so far only specified
in this data with respect to reactive power. Installed (active power) capacities are not included, al-
though this is planned for the future.
In addition to the preparation of these forecast data sets, real load flow snapshots are recorded twice a
year (at those points of time for which also the forecasts have been made) by all member TSOs. Simi-
lar to the forecast procedure, the individual contributions covering single TSOs’ network areas are
assembled to form a combined load flow model of the interconnected system.
For each season (winter/summer) either the forecasted or the most recent real load flow data set is
used as the initial input data for the NTC calculations by the majority of the UCTE TSOs. However,
the selection of forecast or snapshot as well as individual modifications to this base case are not ex-
plicitly specified1. Therefore, the base case conditions upon which the incremental exchanges are actu-
ally simulated may differ significantly between TSOs. (It should however be noted that the reason to
modify the original common data is usually the aim to create a more realistic situation with respect to
the border under study.)
1 Examples for particular solutions applied by the TSOs are given in appendix D.1.1
Page 31
Analysis of Electricity Network Capacities and Identification of Congestion – Final Report, December 2001 13
Additional load flow data is exchanged between a growing number of TSOs on a daily or weekly basis
for the purpose of day-ahead congestion forecast (DACF). While the assessment of the indicative
ETSO NTC values cannot benefit form this procedure, some TSOs use DACF data to regularly update
their load flow model that is used for the determination of allocable capacities in the short term.
Also for the NORDEL area a model of the complete interconnected system exists. In contrast to the
UCTE model, it comprises also dynamic models of the generators in order to allow for stability as-
sessment. On the other hand, this model is not regularly updated by a formal, co-ordinated procedure.
Instead, each TSO includes updates according to available information on relevant changes. This is
however not considered to be a reason or a justification for a restriction of usable transmission capac-
ity due to a higher degree of uncertainty. The reason for this is mainly the looser electrical coupling
between the different areas of the NORDEL network resulting in the importance of parallel flows be-
ing negligible. Nevertheless, NORDEL TSOs are planning to increase data exchange in the near fu-
ture.
Eltra (DK), though being a NORDEL member, has synchronous interconnections to the UCTE system.
However, the Eltra network is not included in the common UCTE model. Therefore, Eltra use a model
of the own system and the adjacent region of Germany with an equivalent representing the rest of the
UCTE network. From the German side, only the 380 kV lines of the interconnection are modelled for
NTC assessment, but the inclusion of the 220 kV tie lines is planned for the future.
NGC (GB), having only a DC interconnection to France, perform capacity analyses using a separate
model of the UK system based on data exchange with the Scottish TSOs.
Significance of commercial exchanges
When creating a combined data set of several TSOs’ areas representing a typical load flow situation,
the exchange programmes (“base case exchange” BCE) between neighbouring countries must be mu-
tually agreed among the TSOs in order to achieve a global equilibrium of generation and load2. These
commercial exchange programmes are based on statistical data and expectations about the summarised
2 The consideration of a basic power exchange scenario is necessary to take into account the existence of a
certain pre-load on network elements due to third party exchanges. Starting capacity determination from an
“empty” network or a situation without any cross-border exchange would lead to unrealistic results because
such a situation never occurs in the European interconnected systems.
Page 32
14 Analysis of Electricity Network Capacities and Identification of Congestion – Final Report, December 2001
commercial power trade between each pair of neighbouring countries. As already mentioned in the
section “Methodical approach” above, BCE values directly influence TTC and consequently NTC.
However, the present method of considering BCE constitutes a source of ambiguity which fundamen-
tally questions the usefulness of NTC values:
• On the one hand, a given set of bilateral commercial exchanges leads to unambiguous export or
import balances for each area and consequently to an unambiguous inter area load flow. Under
consideration of the inevitable uncertainties in modelling each area’s internal system state the re-
sulting load flow situation can be predicted fairly well.
• On the other hand, a given load flow situation (based on a given set of area import/export bal-
ances) can be the result of an infinite variety of commercial exchange scenarios. Therefore, BCE
values do not unambiguously correspond to the physical pre-load of the power system elements.
Consequently, a change in the assumption for BCE can lead to an arbitrary change of NTC with-
out modifying any properties of network elements, generation/load pattern or network security as-
sessment procedures.
This effect can be illustrated by a simplified example (fig. 3.1). Consider a situation of three countries
A, B and C where – in addition to the domestic supply which is neglected here – A exports 1000 MW
and C imports 1000 MW. The resulting physical power flow (fig. 3.1, upper half) can be determined
unambiguously. However, numerous sets of commercial exchanges could lead to this physical situa-
tion. Country A could either deliver the amount of 1000 MW directly to C, or some trader in country
B could – completely or partially – act as an intermediary party (fig. 3.1, lower half).
Suppose that an additional power transfer ∆E of 2000 MW from A to C was feasible without violating
any security criterion. Depending on the underlying BCE assumption, the total transfer capacity TTC
in this example would amount to either 3000 MW (assuming that there is a BCE of 1000 MW directly
from A to C) or 2500 MW (assuming that there are BCEs from A to C with and without intermediary
trade through B of 500 MW each).
This ambiguity exists at all UCTE borders except for peninsula situations (e.g. Spain-France, Ger-
many-Denmark), because in these latter cases the direct borders cannot by bypassed. (In the NORDEL
system where the phenomenon of parallel flows can be neglected there is practically a direct corre-
spondence between commercial and physical power exchange. Therefore, the maximum feasible
physical flow on the tie lines between two countries can be regarded as TTC.)
Page 33
Analysis of Electricity Network Capacities and Identification of Congestion – Final Report, December 2001 15
physicalload flow:
B
C
A
~
1000 MW
......
B
C
AB
C
A
1000 MW 500 MW
500 MW500 MW
examples of possiblecommercialexchanges:
1000 MW
Fig. 3.1: Correspondence between physical load flow and commercial exchanges (example)
As a conclusion of the preceding considerations, one should be aware that the NTC values for all
central UCTE borders (i.e. all borders between any of the countries Austria, Belgium, France, Ger-
many, Italy, the Netherlands and Switzerland) are not exclusively a result of the physical properties
of the technical system, but also depend on the ambiguous assumptions for the BCE agreed upon dur-
ing the preparation of the common load flow model. (Note that we are not imputing deliberate ma-
nipulation of capacity results. TSOs are certainly negotiating a realistic and commonly agreed matrix
of BCE values. However, this matrix is still just an estimate; it may change for the next calculation
cycle and influence NTC even if all technical parameters remain constant. The BCE ambiguity is a
problem resulting from the definition of NTC which therefore is not a uniquely technical quantity as
one might have thought.)
Despite the limitations of the meaningfulness of NTC values in the light of the above considerations,
one must keep in mind that the vast majority of aspects dealt with in the context of NTC calculation
are related to purely technical standards and procedures. Moreover, the methods used by TSOs to de-
termine binding, allocable capacities are often based on the NTC assessment method or share at least
the underlying technical standards with it. This should be taken into account when evaluating the im-
portance of the following discussions on NTC determination principles.
Page 34
16 Analysis of Electricity Network Capacities and Identification of Congestion – Final Report, December 2001
Modelling of generation increase/decrease
In meshed AC networks the distribution of generation within the individual areas has a strong impact
on the power flow not only on internal lines and transformers but also on the tie lines. Therefore, the
results of cross-border capacity calculations depend significantly on the way in which the overall gen-
eration increase/decrease of the exporting/importing area is broken down to the individual genera-
tors.Generally, TSOs distinguish between the models for generation in their own area and in foreign
networks. Regarding the internal area, two fundamentally different methods are applied3:
• One group of TSOs distribute the generation change proportional to the base case dispatch. This
group comprises Verbund APG (A), Swiss TSOs/ETRANS, German TSOs, REE (E), TenneT
(NL), Svenska Kraftnät (S), and Statnett (N)4.
• In other countries (B, F, GB, I, P and FIN) TSOs use information on the generation costs of indi-
vidual units to distribute the generation change according to an estimated merit order. This
method aims at simulating the market behaviour under the assumption of a globally economically
efficient generation dispatch within each TSO’s area.
Generally, the method used for simulating the generation change in external areas is somewhat sim-
pler than for the internal area. Most TSOs apply a proportional distribution according to the base case
dispatch or – in the case of Svenska Kraftnät (S) – to the size of generating units.
TenneT (NL) and Svenska Kraftnät (S) restrict the external generation change to certain regions in-
stead of countries. These procedures are further discussed in section 3.2.4 below.
3 For more information on these methods see appendix D.1.1.
4 Statnett use the proportional distribution only when thermal current limits are expected to be critical. For
stability assessment, generators not running in the base case are started for exports, while running generators
are stopped to increase import.
Page 35
Analysis of Electricity Network Capacities and Identification of Congestion – Final Report, December 2001 17
3.2.2 Assessment of network security
Overview
In the context of capacity determination, all TSOs apply so-called “deterministic” security criteria like
the (n-1) principle (cf. appendix B.2.4). This implies that certain classes of network equipment failures
or generator outages are defined as relevant for the security assessment, and if a physical quantity ex-
ceeds its specified range in any of these cases, the situation before the failure is considered insecure
and thus not tolerable. The application of a TSO’s security criteria can be divided into two steps:
1. subsequent simulation of a number of unplanned events (e.g. line outage due to lightning) and
the corresponding reactions of the technical system and/or the operating staff and
2. for each simulated event, checking if all relevant physical quantities stay within their specified
ranges.
The way in which the first step is carried out is analysed in this section while the second step is dealt
with in the following section 3.2.3.
This assessment does in most cases not explicitly take into account the probability or frequency of the
investigated events nor the severity of their individual consequences. However, the selection of fail-
ures to be assessed is based on an implicit distinction between “frequent” and “rare” failures and be-
tween “severe” and “minor” consequences.
Considered types of failures
For their respective internal area, all TSOs consider at least single failures – also called “(n-1)” out-
ages – of circuits and, if existing, 380/220 kV transformers. Single generator outages are considered
by most TSOs. The others either state that in their areas generator outages are never the critical events
regarding limits of cross-border power transfer, or they include an additional margin into the TRM to
reflect the effects of generator outages, i.e. the provision of primary reserve by generators in other
control areas (see section 3.2.4).
Page 36
18 Analysis of Electricity Network Capacities and Identification of Congestion – Final Report, December 2001
Bus bar failures are only considered by Fingrid (FIN), Statnett (N)5, Svenska Kraftnät (S), TenneT
(NL), and NGC (GB). In the three Nordic countries, the severity of possible consequences (dynamic
effects, usually loss of stability endangering overall system security) is pointed out as a justification
for this decision. In a similar way TenneT argues that bus bar failures and the subsequent tripping of
all transformers within a substation may lead to temporary supply interruptions within complete re-
gional high voltage networks. The restrictive effect of taking bus bar failures into consideration is
however – at least partially – compensated by increasing transformer current limits for these cases (cf.
section 3.2.3).
Some TSOs investigate not only single failures, but also certain failure combinations, i.e. “(n-2)”
outages6. There is however only one case where this criterion actually limits the cross border capacity,
namely the double circuit outage of the French-Italian tie line Albertville-Rondissone.
Most TSOs regard only failures inside their own area including the tie lines. Since all cross-border
capacities are calculated by all adjacent TSOs, it is guaranteed that each failure is investigated at least
once. However, there are cases where external failures might lead to a violation of security limits in
the internal system which is usually not monitored by the neighbouring TSOs. Therefore, some TSOs
also assess external failures at least in the vicinity of the own area.
Consideration of response to failures
Although the power flows in meshed AC networks are not freely controllable (cf. section B.2.2), TSOs
have a certain range of corrective measures at their disposal to relieve congestion during real-time
operation. At least switching operations to change the network topology (e.g. opening of bus bar cou-
plers) as well as transformer tap adjustments are feasible for all TSOs. RTE (F) and Verbund APG (A)
have even partially automated such procedures to achieve a quick reaction to certain pre-specified
critical situations. In Norway, Sweden and Denmark, such automated mechanisms – called “special
protection systems” (SPS) – reach even one step further: Statnett (N) disconnect specific generators
after certain line failures, while Svenska Kraftnät (S) and Eltra (DK) quickly adjust the flows on some
of their DC interconnections after certain severe failures. Most TSOs additionally have the possibility
5 Statnett consider only failures of bus bars close to the Swedish border who have an influence on the Swedish
security criteria.
6 For more details see appendix D.1.2.
Page 37
Analysis of Electricity Network Capacities and Identification of Congestion – Final Report, December 2001 19
to initiate a generation re-dispatch within their area of responsibility. Between some countries, this is
even feasible without geographical restrictions by performing cross-border re-dispatch7.
In view of the diversity of measures to maintain system security during real-time operation, the ques-
tion arises to which extent these measures are taken into account in the NTC assessment procedures.
While adjustments of network topology and transformer taps can be performed without extra costs, re-
dispatching leads to payments from the TSO to the affected generating companies and is therefore in
many cases not considered to provide a contribution to available capacity. The automatic measures
applied in Norway and Sweden are an exception in this respect: Although they directly affect network
users, they are taken into account to increase NTC because they have been installed just for this pur-
pose on the basis of agreements between the respective TSO and the network users.
Those TSOs who explicitly consider corrective measures in their NTC assessment do so in order to
check if such measures are efficient enough to completely relieve a thermal overload of network ele-
ments after an outage. The relation between treatment of corrective measures and tolerated overload
will be further discussed in the following section.
3.2.3 Limits of feasible network operation
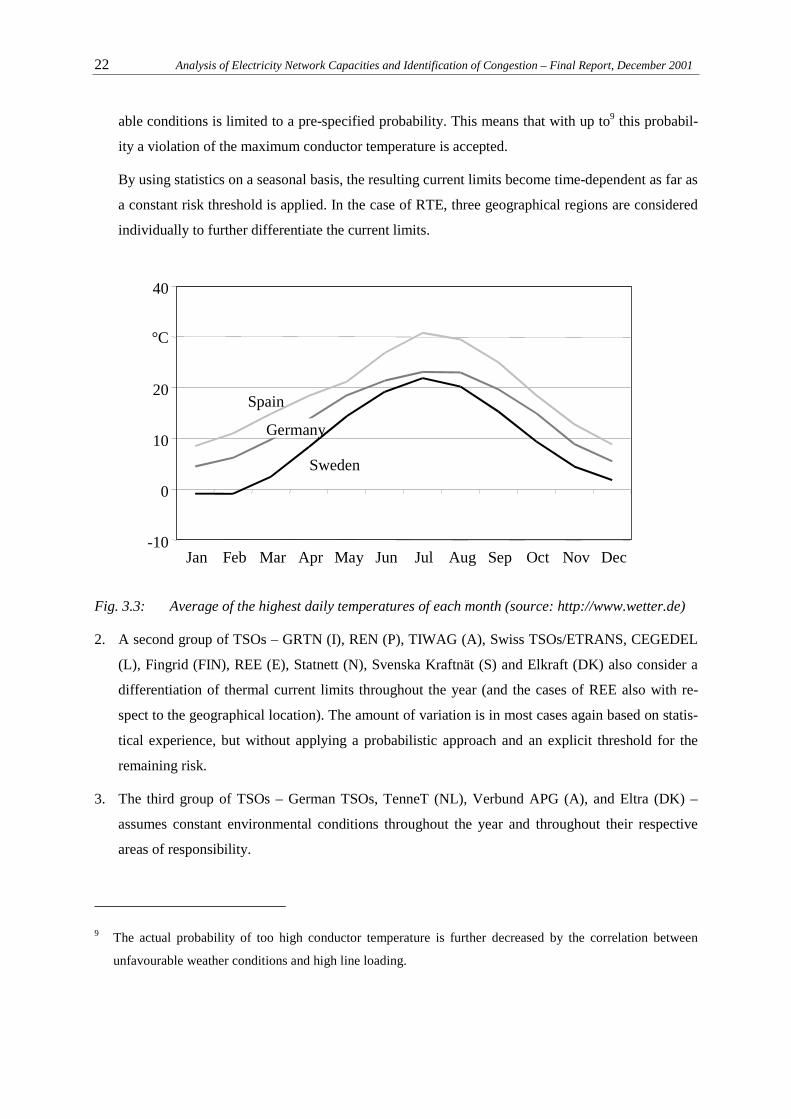
Thermal limits – consideration of environmental conditions
The thermal transfer limit of overhead lines is reached when the electric current heats the conductors
up to a temperature above which either the conductor material would start being softened or the clear-
ance to ground would drop beyond its minimum. (Other network elements like measuring transformers
or disconnectors further restrict the transfer capacity of some network branches, but according to the
TSOs, this does currently not cause limitations of cross-border transmission capacity in any practical
case.)
The maximum allowed continuous conductor temperature which is relevant for these limits differs
largely from one TSO to the other, but also within single countries, with values reaching from 50 °C to
100 °C (fig. 3.2). For an individual line, this temperature limit depends on a variety of factors, e.g.
7 In some countries, this is also referred to as “cross-border counter-trading”, the difference being the associ-
ated commercial rules.
Page 38
20 Analysis of Electricity Network Capacities and Identification of Congestion – Final Report, December 2001
• the material and age of the conductors,
• the tensile stress of the conductors (whose limit depends on the material),
• the geometry of the line depending on
o the height of the towers,
o the length of the insulators, and
o the ground topography including buildings and/or vegetation, and
• the security standards imposing limitations on the clearance to ground.
0
20
40
60
80
100
120
A
EL
IA (
B)
CH D
Elt
ra (
DK
)
RE
E (
E)
RT
E (
F)
Fing
rid
(FIN
)
NG
C (
GB
)
GR
TN
(I)
CE
GE
DE
L (
L)
Stat
nett
(N)
Ten
neT
(N
L)
RE
N (
P)
Sve
nska
K. (
S)
°C
Temperature
Fig. 3.2: Ranges of maximum allowed temperatures of overhead line conductors (for some coun-
tries/TSOs including limits by minimum clearance to ground)
The different conductor materials and ages throughout the European networks as well as the impor-
tance of geometry limitations (e.g. limited tower height imposed by authorisation procedures) clearly
account for a large portion of the observed diversity of maximum conductor temperatures. In these
cases the present temperature limits could only be raised by some kind of investment.
As regards requirements of minimum clearance to ground, this factor is usually in itself the result of
complex considerations, e.g. including limits for electromagnetic fields or the proximity of moving
objects and persons. The different standards and legal obligations resulting from these considerations
may bear a potential for harmonisation among the European countries. The derivation of specific rec-
ommendations in this respect would however require further detailed investigations which are beyond
the scope of this report. Moreover, a revision of the minimum clearance to ground would not always
Page 39
Analysis of Electricity Network Capacities and Identification of Congestion – Final Report, December 2001 21
allow for higher conductor temperatures, because many lines have been designed such that the tem-
perature limit related to the conductor material is reached practically at the same level of loading as
the limit for clearance to ground. In the further analysis we therefore assume that for existing lines the
maximum conductor temperature has been derived such as to meet fixed requirements that are binding
for the respective TSOs. Since the re-consideration of such fixed requirements, imposed by law or
industry standards, would take considerable time and efforts due to the complexity of the underlying
relations and limitations, we do not expect that significant improvements could be achieved in this
respect in the short term. This does not mean that deeper investigations aiming at identifying the po-
tential of improvements in the longer term would not be worthwhile.
For the determination of the electric current that leads to the maximum allowed conductor tempera-
ture, one must make assumptions8 on the environmental conditions, because ambient temperature,
wind speed and solar radiation have a significant effect on conductor cooling and therefore on the
relation between electric current and conductor temperature.
In contrast to the maximum conductor temperature, the assumptions on environmental conditions al-
ways express some kind of risk attitude. This is mainly because on the one hand, these conditions vary
considerably with respect to the geographical location as well as to the time (cf. exemplary progres-
sion of ambient temperatures with respect to the time of year in different countries as shown in
fig. 3.3), and on the other hand, TSOs take such variations into account in different levels of detail and
with different risk thresholds. As a result, environmental conditions are assumed very inhomogene-
ously throughout Europe, and this inhomogeneity relates to qualitative aspects (i.e. the structure of the
approaches to this topic) as well as to the considered quantities of environmental parameters.
Basically, three different types of approaches can be identified:
1. One group of TSOs – RTE (F), ELIA (B) and NGC (GB) – apply a probabilistic model: based on
meteorological statistics (i.e. ambient temperature and sometimes also wind speed and solar radia-
tion), a set of environmental conditions is chosen such that the occurrence of even more unfavour-
8 Several TSOs have pointed out that they apply real time measurements of environmental parameters and/or
conductor temperatures in order to assess the present thermal current rating of lines. Such information is very
useful in the operational phase to determine when countermeasures against actual overloading have to be
taken. For capacity allocation however, only the assumptions on the future thermal current limits are relevant.
Page 40
22 Analysis of Electricity Network Capacities and Identification of Congestion – Final Report, December 2001
able conditions is limited to a pre-specified probability. This means that with up to9 this probabil-
ity a violation of the maximum conductor temperature is accepted.
By using statistics on a seasonal basis, the resulting current limits become time-dependent as far as
a constant risk threshold is applied. In the case of RTE, three geographical regions are considered
individually to further differentiate the current limits.
-10
0
10
20
40
Jan Feb Mar Apr May Jun Jul Aug Sep Oct Nov Dec
Sweden
Germany
Spain
°C
Fig. 3.3: Average of the highest daily temperatures of each month (source: http://www.wetter.de)
2. A second group of TSOs – GRTN (I), REN (P), TIWAG (A), Swiss TSOs/ETRANS, CEGEDEL
(L), Fingrid (FIN), REE (E), Statnett (N), Svenska Kraftnät (S) and Elkraft (DK) also consider a
differentiation of thermal current limits throughout the year (and the cases of REE also with re-
spect to the geographical location). The amount of variation is in most cases again based on statis-
tical experience, but without applying a probabilistic approach and an explicit threshold for the
remaining risk.
3. The third group of TSOs – German TSOs, TenneT (NL), Verbund APG (A), and Eltra (DK) –
assumes constant environmental conditions throughout the year and throughout their respective
areas of responsibility.
9 The actual probability of too high conductor temperature is further decreased by the correlation between
unfavourable weather conditions and high line loading.
Page 41
Analysis of Electricity Network Capacities and Identification of Congestion – Final Report, December 2001 23
The individual TSOs’ solutions are described in more detail in appendix D.1.3.
Thermal limits – temporary overload
The criteria for deriving thermal limits as described above are related to continuous currents under
normal operating conditions, i.e. without considering limits of duration. When assessing contingency
situations in the framework of network security analysis, two reasons might justify to allow higher
current limits than for normal operation:
1. Contingency situations occur rarely and usually do not last long. Consequently, the probability
that simultaneously other conditions are such that the regarded network element exceeds its
maximum temperature is much lower than under normal operating conditions. Therefore, a higher
continuous current limit might be admissible without noticeably increasing the risk of damage to
network equipment or persons. For transformers, studies have proved that rare overloading up to
some extent does not accelerate ageing [8].
2. As we have already discussed above, after occurrence of a failure the operating staff have at their
disposal a variety of corrective measures to quickly eliminate short-term overload. Some of these
measures are even activated automatically.
Our analysis of TSOs’ approaches shows that NGC (GB) and RTE (F) consider higher continuous
current limits in contingency situations. In the case of RTE conductor temperatures are allowed to
reach 75-90 °C instead of 65 ° in normal operation, while NGC allows a higher probability of exces-
sive line temperatures.
The second of the above points is more often taken into account. This means that many TSOs tolerate
higher current limits after failures, but only when the loading can be decreased by means of TSO ac-
tions below normal limits within a short time (usually between 10 and 30 minutes).
Fig. 3.4 gives an overview on how much short-term overload of network branches – separated by in-
ternal lines, tie lines and transformers – is tolerated in cases of (n-1) contingencies, i.e. outage of a
single network element. (Several TSOs apply specific rules that reach beyond the specification of a
single percentage value; these approaches are described in appendix D.1.3.)
Page 42
24 Analysis of Electricity Network Capacities and Identification of Congestion – Final Report, December 2001
0
10
20
30
40
50T
IWA
G (
A)
RE
E (
E)
NG
C (
GB
)
GR
TN
(I)
Sta
tnet
t (N
)
Sve
nska
K. (
S)
RT
E (
F)
EL
IA (
B)
Ver
bud
AP
G (
A) D
CH
Ten
neT
(N
L)
RE
N (
P)
Eltr
a (D
K)
internal linestie linestransformers
tolerated relative short-term overload in (n-1) situations
%
TSOs explicitly assessing if corrective measures can relieve overload
TSOs not explicitly assessing corrective measures
Fig. 3.4: Accepted relative short-term overload of network branches in (n-1) contingency situa-
tions when determining transmission capacity
In general, two different approaches must be distinguished:
• The TSOs on the right side of the diagram tolerate a constant percentage of overload after any
contingency. This approach is based on the implicit assumption, that corrective measures to re-
lieve overload up to this extent will usually be available.
• The TSOs on the left side of the diagram explicitly assess for every contingency if there are cor-
rective measures available to decrease the currents below pre-fault limits. This means that the in-
dicated overload limits are upper bounds which may be lower for individual contingencies where
corrective measures are little effective.
Voltage limits
Several TSOs consider limits for steady-state voltages, but only three of them, namely REE (E), Ten-
neT (NL) and NGC (GB), are actually facing voltage-related limitation of transmission capacity. (For
TenneT, this statement is only valid for short-term capacity assessment, but not for the half-year
ETSO values.) DVG (D) state that in Germany steady-state voltage may become a major concern in
the future if more domestic generation units are shut down for competition reasons.
All these TSOs apply similar ranges of tolerated voltages during contingency analysis, at least in terms
of relative percentages (maximum voltage / minimum voltage ≈ 120 %). An assessment of the applied
Page 43
Analysis of Electricity Network Capacities and Identification of Congestion – Final Report, December 2001 25
absolute voltage limits is not appropriate here, since these may depend on the different normal opera-
tional voltages. In addition to the absolute limits, NGC and TenneT also impose a limit on the voltage
drop per fault (TenneT: 10 %; NGC: 6 % for single, 12 % for double failures).
Significance of stability limits
Among the different stability phenomena, only voltage stability and static stability are potentially
threatened by excessive volumes of long distance power transfers. Depending on the considered bor-
der, load flow situation and power transfer direction, both of these phenomena impose limits on the
cross-border capacity between the Nordic countries Norway, Sweden, Denmark and Finland. (Note:
The potential loss of voltage stability is the reason for considering bus bar failures in these areas, cf.
section 3.2.2.) Stability is also the critical factor for the transmission capacity between Germany and
western Denmark.
Among the other TSOs, only RTE (F) and NGC (GB) declare that stability – in rare cases – may be-
come a limiting factor for transmission capacity.
3.2.4 Consideration of uncertainties
General aspects
It is undoubted that the determination of transmission capacity requires the TSOs to make assumptions
on future system conditions that are – as with every forecast – uncertain at calculation time. (For an
introductory explanation see appendix B, sections B.2.4 and B.3.3.) These assumptions can have a
large impact on the resulting transmission capacities, but also on the risk of unstable or insecure net-
work states. The sources of uncertainty to be considered in this context comprise, but are not neces-
sarily restricted to
• environmental conditions (temperature, wind speed) which may cause conductors to exceed their
maximum temperature although the current is within its limits. Due to different assumptions about
ambient temperatures and wind speed (cf. section 3.2.3), but also different climatic conditions
throughout Europe, the associated risk levels probably vary considerably among TSOs;
• unplanned failures of network elements and generators which can be assessed through explicit
simulation during security analysis or be included in the general TRM. Again, different decisions
by the TSOs which types of failures to take into account – and in which way – (cf. section 3.2.2),
but also differences with respect to the frequencies and consequences of failures lead to a variety
of resulting risk levels;
Page 44
26 Analysis of Electricity Network Capacities and Identification of Congestion – Final Report, December 2001
• inertia of control mechanisms resulting in “inadvertent exchange”. Since power imbalances occur
permanently in each control area due to load fluctuations and forecast errors, an unplanned mo-
mentary cross-border power exchange takes place at all times due to the fast reaction of primary
control mechanisms and the inertia of secondary control;
• errors in the prediction of generation and load distribution, including power exchange between
third parties;
• uncertainty regarding the actual network topology; and
• measurement errors.
Although some TSOs apply probabilistic methods to quantify parts of their risk, it is not possible to
quantitatively assess the overall level of uncertainty that is taken into account by each TSO or, in other
words, the overall level of risk that is accepted. A qualitative comparison, however, shows similarities
and differences concerning the sources of uncertainty that are taken into account and the way in which
this is done (table 3.1).
All TSOs use the framework of security analysis to explicitly consider uncertainty with respect to en-
vironmental conditions (by applying corresponding current limits) and failures of network equipment
(by simulation of selected failure events). Regarding generator outages, this is true for most TSOs,
whereas others consider this uncertainty partially or completely as part of TRM. (For example, Ger-
man TSOs explicitly model internal outages and the subsequent import of primary response, but ca-
pacity for the export of primary response in case of external generator outages is included in TRM.)
Uncertainty on network topology and inadvertent exchange is never modelled explicitly, i.e. either
considered under TRM or neglected.
As already mentioned in section 3.2.1, most TSOs perform NTC calculation on the basis of a single
system model reflecting a plausible estimated network state including assumptions on cross-border
power exchange (pp. 12 ff.). When increasing and decreasing generation in the exporting/importing
areas under study, a fixed method is used for the distribution of power among generators (p. 15). De-
viations between this model and reality regarding the distribution of generation and load are consid-
ered as part of TRM.
Page 45
Analysis of E
lectricity Netw
ork Capacities and Identification of C
ongestion – Final R
eport, Decem
ber 200127
Verbund APG (A)
expl.
expl.
TRM
TRM
TRM
[n.a.]
TenneT (NL)
expl.
expl.
expl.
TRM
expl. / TRM
TRM
300
Svenska Kraftnät
(S)
expl.
expl.
expl.
TRM
expl. / TRM
TRM
150 - 300
Statnett (N)
expl.
expl.
expl.
expl.
TRM
150
RTE (F)
expl.
expl.
TRM
TRM
TRM
TRM
expl.
200 - 300
REN (P)
expl.
expl.
expl.
expl.
TRM
50
REE (E)
expl.
expl.
expl.
TRM
TRM
TRM
300 - 400
Fingrid (FIN)
expl.
expl.
expl.
TRM
100
Eltra (DK)
expl.
expl.
expl. / TTC*
TTC*
TTC*
0
Elkraft (DK)
expl.
expl.
expl.
TRM
TRM
200
D
expl.
expl.
expl. / TRM
TRM
TRM
TRM
200 - 350
ELIA (B)
expl.
expl.
expl.
TRM
TRM
TRM
300
CH
expl.
expl.
TRM
TRM
TRM
TRM
TRM
150
Environmental conditions
Failures of network equipment
Generator outages
Network topology
Generation and load distribution
Inadvertent exchange
Measurement errors
TRM value(s) in MW
Table 3.1:
Consideration of different sources of uncertainty
(expl. = explicitly m
odelled, TRM
= included in transm
ission reliability margin)
*: Elkraft consider uncertainties im
plicitly in TT
C and apply no T
RM
Page 46
28 Analysis of Electricity Network Capacities and Identification of Congestion – Final Report, December 2001
In contrast to this, some TSOs explicitly consider a certain variety of scenarios to cope with this un-
certainty:
• REN (P) use eight different base scenarios reflecting differences in time of year, load level and
level of hydraulic generation. Cross-border transmission capacity is calculated for each scenario,
and the minimum result is used as TTC.
• TenneT (NL) use
o three different base scenarios reflecting different generation dispatch patterns inside Germany
and
o three different external regions as the source of power being imported to the Netherlands.
From this total of nine scenarios, the minimum capacity result is used as TTC. In contrast to REN,
TenneT additionally regard further uncertainty on the distribution of generation and load as part of
TRM. According to [7], this is however only a small amount being dominated by the amount as-
signed to inadvertent exchanges.
• Statnett (N), Fingrid (FIN) and Svenska Kraftnät (S) consider a certain range of scenarios for each
border under study, because in some cases several different phenomena (continuous current limits,
stability) can constitute the limitation for cross-border transfer. For example, for a transfer from
southern Norway to Sweden the limiting phenomenon as well as the resulting capacity are de-
pending on the load level in the Oslo region (being in turn a function of outside temperature).
This kind of assessment – involving complex dynamic calculations – is mainly used as a prepara-
tion to speed up day-ahead capacity determination. For ETSO NTC publication, the maximum ca-
pacity obtained (i.e. a best case estimation) is used. In contrast to this, Svenska Kraftnät make an
individual worst case assumption for each border under study regarding the generators participat-
ing in the generation shift.
Determination and amount of TRM
Theoretically, one would assume that TSOs who consider many aspects of uncertainty in an explicit
way use a low TRM for the remaining risk and vice versa. An example of this is REN (P), who ex-
plicitly assess a variety of system scenarios and use a TRM of only 50 MW. However, this correlation
cannot be confirmed for all TSOs (cf. table 3.1). In fact, a number of reasons can justify a higher
TRM, like a rather central location within the interconnected network (leading to larger influence of
flows induced by third parties) or a higher number of interconnection lines (leading to a larger vari-
ability of the load flow distribution). Moreover, the mere qualitative analysis on which sources of un-
certainty are considered under TRM does not reveal quantitative relations. Unfortunately, most TSOs
Page 47
Analysis of Electricity Network Capacities and Identification of Congestion – Final Report, December 2001 29
estimate their TRM as a whole, so that a quantitative comparison of the individual contributions is not
possible. Among those TSOs who base TRM on explicit considerations, a number of completely dif-
ferent approaches can be identified10.
The inhomogeneous treatment of uncertainty leads to the situation that for some borders different val-
ues of TRM are applied by the adjacent TSOs (see examples in table 3.2). Taking into account the
different contributions to TRM and methods to determine them, these differences are by themselves no
reason to conclude that the TSOs have chosen different levels of prudence. However, they at least
demonstrate the obvious need for a harmonisation in this field.
border TSO 1: TRM [MW] TSO 2: TRM [MW] TRM difference [MW]
Spain-Portugal REE (E): 300 REN (P): 50 250
Spain-France REE (E): 400 RTE (F): 200 200
Germany-Switzerland D: 346 CH: 150 196
Denmark-Germany Eltra (DK): 0 D: 200 200
Table 3.2: Examples of borders with different TRMs applied by adjacent TSOs
3.3 Differences between indicative NTC and allocable capacities
The NTC values published by ETSO are the result of a common effort of the European TSOs to pro-
vide indicative figures on the general development of interconnection capacity. For a number of rea-
sons, e.g.
• long time horizon,
• neglecting of actual parallel flow situation,
• ambiguity of underlying assumptions on the base case exchange BCE (cf. pp. 13 ff.),
• computation and data negotiation effort, and
• mismatch between common ETSO capacity definitions and individual national rules,
the usability of these values for actual allocation of cross-border capacity to network users may be
questioned. As a logical consequence, methods applied for determining allocable, i.e. binding capacity
10 For a description of these approaches, see appendix D.1.4.
Page 48
30 Analysis of Electricity Network Capacities and Identification of Congestion – Final Report, December 2001
figures can be expected to deviate from those used for the calculation of ETSO NTC. For those bor-
ders where actual congestion occurs, such deviations are analysed in detail in appendix D.2 along with
a brief introduction of the respective allocation methods11. In the following, we point out the most
important aspects:
• Since at most borders, capacity may be allocated for periods much shorter than six months (e.g.
monthly or daily), allocable capacity figures can be (and are) recalculated more frequently and
with a limited validity duration. This reduces generally the level of uncertainty. The following ex-
amples show in which way some TSOs calculations reflect this:
o In general, TSOs update their system models according to known changes of the topology,
switching status as well as load and generation distribution.
o RTE (F), REE (E) and ELIA (B), who are among those TSOs who consider the variability of
ambient temperatures with the time of year, use the shorter validity period of the binding ca-
pacities to increase the number of different thermal current limits, e.g. from summer/winter to
four or five seasonal values.
o In the NORDEL interconnection, binding capacities must only be calculated for the day ahead.
Svenska Kraftnät (S) and Statnett (N) make use of this by using temperature forecasts (in-
cluding a day/night differentiation) instead of statistics when deriving the thermal current lim-
its of overhead lines.
o Some of the TSOs who consider a variety of network and system scenarios for NTC assess-
ment, consider only one actually relevant scenario for short-term allocable capacities. This is
done by REN (P) and Svenska Kraftnät, but not by TenneT (NL).
• Swiss TSOs/ETRANS tolerate a temporary overload of at least 20 % (even more in cases where
quick corrective measures are clearly available) compared to no overload in NTC determination.
• For capacity allocation from France to Italy, RTE (F) takes into account internal re-dispatch possi-
bilities to both raise the capacity and make it constant throughout most of the year.
• From Austria to Italy, allocable capacity is limited by a UCTE rule [2] to the thermal limit of the
only direct tie line. While this rule in principle must be applied to every border, the Austrian-
11 It should be noted that an assessment of the allocation methods, especially in terms of economical efficiency,
is beyond the scope of this study. Therefore, our analysis is restricted to those aspects that have an influence
on the technical capacity determination.
Page 49
Analysis of Electricity Network Capacities and Identification of Congestion – Final Report, December 2001 31
Italian one is the only case where this formal criterion is more restrictive than technical considera-
tions.
3.4 Conclusions
In this chapter, we have analysed the methods and standards which are applied by the TSOs to deter-
mine the amounts of NTC as well as allocable cross-border transmission capacity. Generally speaking,
these calculations are complex engineering tasks which are founded on extensive considerations and a
large variety of assumptions and input parameters.
Our analysis on the TSOs’ approaches shows that the overall capacity assessment schemes are more or
less similar in most countries. These general methods leave however large spaces for individual inter-
pretations and definitions, which has led to a diversity of individual solutions regarding many aspects
of the procedures. As we have pointed out in the analysis, the effects of different parameter settings on
the resulting transmission capacity as well as on the level of network security are often coupled.
Therefore, different solutions may yield similar results. Moreover, due to the technical diversity be-
tween and within the European power systems, it is likely that even identical approaches would lead to
undesired differences, e.g. regarding the resulting quality of supply.
For these reasons we do not consider it recommendable to determine a “best practice” of capacity de-
termination just from the findings of this chapter. Rather, the further analysis of possible improve-
ments will be carried out in the following steps:
1. After the identification of the most critical bottlenecks (chapter 4) and considerations on their re-
spective capacity demand (chapter 5) we will discuss a variety of “soft measures” to increase
cross-border transmission capacity (chapter 6). These measures will partly be derived from details
of the different presently applied approaches towards capacity assessment as outlined in this
chapter, but also comprise more general, conceptual suggestions.
2. When analysing capacity increase options for individual bottlenecks (chapter 8) we will investi-
gate the individual applicability of the presented soft measures, partly involving quantitative as-
sessments of their potential impact.
Page 50
32 Analysis of Electricity Network Capacities and Identification of Congestion – Final Report, December 2001
4 Identification of critical bottlenecks
The TSOs as well as market actors have stated that congestion occurs at least occasionally at almost
every European border. In appendix E, for each of these borders the existing interconnections as well
as the specific reasons for congestion are analysed. Besides, the severity of the congestion is dis-
cussed. This analysis shows that the individual cases largely differ in terms of frequency and severity
of congestion (table 4.1). While some borders are congested every day, other cases of congestion are
restricted to certain reasons or specific situations, e.g. with respect to hydraulic generation availability.
border occurrence of congestion
from to season hours remarks
Portugal Spain summer or wet win-ter (occasionally)
peak hours depending on hydraulic gen-eration
France Spain almost all year all day
Spain France winter (occasionally) depending on hydraulic gen-eration
France Great Britain all year all day limited only by DC link
France Belgium all year
Belgium/Germany Netherlands all year day hours
France Germany summer (few days) related to access regime,cf. appendix E.6
Denmark (West) Germany all year(most days)
day hours depending on wind generationin D+DK
Germany Denmark(West)
all year(many days)
varying depending on wind generationin D+DK
Germany Sweden n. a. n. a. DC link operated by owners
Sweden Germany n. a. n. a. DC link operated by owners
France/Switzerland/Austria
Italy all year all day
Austria Switzerland spring rarely
Austria Germany rarely relievable by means of topol-ogy adjustment
Sweden Finland summer
Norway Sweden all year, most se-verely in spring
day hours depending on availability ofhydroelectric power
Sweden Norway all year, most se-verely in spring
night hours depending on availability ofhydroelectric power
Table 4.1: Characteristics of cross-border congestion in the investigated part of the European net-
work (grey lines: severe congestion, countermeasures to be further analysed)
Page 51
Analysis of Electricity Network Capacities and Identification of Congestion – Final Report, December 2001 33
It should be noted that the continental European synchronously interconnected network includes
countries which are beyond the scope of this study (cf. section C.3). However, frequent and severe
congestion is also reported to occur on the eastern borders of Austria and Germany as well as on the
Austrian-Slovenian and Spanish-Moroccan borders. Owing to the importance of many of these borders
for international trade and to the mutual influence of network regions especially in highly meshed
grids, the involved TSOs as well as representatives of network users have expressed that they would
strongly desire similar investigations to be carried out for these borders.
Because of the wide variety of applied market rules and allocation principles, a uniform quantitative
evaluation of congestion severity is not feasible. However, the presented analysis allows for a rela-
tively clear identification of the most important bottlenecks for which a detailed analysis of possible
countermeasures will be presented in the remaining chapters of this report:
• France → Spain,
• France → Belgium & Belgium/Germany ↔ Netherlands (to be analysed in combination),
• Denmark ↔ Germany,
• France/Switzerland/Austria → Italy, and
• Norway ↔ Sweden.
In this list, we have not included transmission interfaces which consist only of DC links. This is be-
cause
• it is difficult to obtain information about the severity of congestion of these links because in the
operational practice, TSOs at least partly treat them like loads and power plants that are operated
on the basis of programmes submitted by the owners of the links, so that the demand for open ac-
cess to these interconnections cannot be estimated, and
• partly, the capacity on these interfaces is only determined by the capacity of the individual DC
links and therefore could be increased only by the construction of new DC links. This type of net-
work reinforcement is however not considered to be in the scope of this study, because it is associ-
ated to considerable costs and time demand, while its effect on transmission capacity can be
evaluated in a trivial way (as far as the capacity of the DC links remains the determining factor for
transmission capacity).
Page 52
34 Analysis of Electricity Network Capacities and Identification of Congestion – Final Report, December 2001
5 Investigations on the demand for transmission capacity
5.1 Introduction
An important step between the identification of critical bottlenecks in the cross-border transmission
networks and the evaluation of possible measures to increase transmission capacity is the quantitative
investigation of the demand for transmission capacity at those locations. Ideally, one might envisage to
quantify the level of transmission demand across a border in terms of a value in MW, representing the
“optimal NTC” for that border. However, besides practical difficulties to determine such optimal lev-
els as we will discuss below, this thinking has the fundamental flaw that it assumes the determination
of optimal transmission capacity to be independent from the cost of additional transmission capacity,
which is of course not the case: transmission capacity should not be increased at any cost, but only to
an extent that strikes an optimal balance between cost and benefit. Although it is difficult to determine
this point of optimal balance, it is quite obvious that it will normally not be optimal to remove conges-
tion completely.
A more realistic approach is therefore to quantify the economic value of additional transmission ca-
pacity. This means to determine the monetary benefit that electricity companies throughout Europe –
and ultimately the consumers – could realise by utilising additional capacity. From a purely economic
viewpoint, the optimal level of transmission capacity would thus be determined by the intersection of
the curve of the economic gain for the electricity industry caused by additional capacity, and the curve
of the expenditure related to making additional capacity available.
Even this viewpoint may however not be fully satisfactory. For political reasons, it may be desired to
deviate from the overall economic optimum, e.g. to give incentives for the location of new generation
plant close to the demand, by keeping cross-border transmission capacity below the optimal level. The
opposite of this, i.e. to increase transmission capacity above that optimal level, may just as well be
considered desirable if strong emphasis is put on the promotion of cross-border trading in order to
accelerate the integration of the internal electricity market.
Another great difficulty in defining the optimal level of transmission capacity is due to the fact that
transmission demand varies over time. While intra-year fluctuations depending on daytime, day type
and season will have to be taken into account in the determination of the value of transmission capac-
ity in any case, longer term variations over the years will be difficult to predict. In particular it is un-
likely that the marginal value of additional transmission capacity can be predicted accurately enough
to assess the overall economic efficiency of an additional asset over the whole of its lifetime. The
question may therefore arise to which extent measures to increase transmission capacity that appear
Page 53
Analysis of Electricity Network Capacities and Identification of Congestion – Final Report, December 2001 35
efficient in the short term should be implemented if a reduction of transmission demand is foreseen for
the long term.
Instead of trying to achieve such an integrated efficiency assessment over a long period, it may appear
more reasonable to strive for best possible homogeneity in the density of the networks, particularly
aiming at smooth transitions of the network density on the borders. This approach would not take ac-
count of today’s locations and dispatch structures of generation units at all, but only evaluate the
structure of the network itself, maybe including information about the locations of load centres.
The above considerations show that it is quite difficult to only define the optimal level of cross-border
transmission capacity, and due to interdependencies with political objectives, a unique definition will
not even exist. The more difficult will it be to actually quantify the demand for transmission capacity,
taking account of the complexity and diversity of the various approaches outlined above.
Correspondingly, we could gather only very little information on the expected demand for transmis-
sion capacity in our discussions with TSOs and market parties. Typically, TSOs estimate the severity
of congestion rather in a qualitative way, based on information that we have partly also taken into
account for the selection of critical bottlenecks, like the frequency of congestion or the degree at
which available capacity is “oversubscribed” in the allocation procedures. Only few TSOs have indi-
cated that they have carried out market studies in order to determine the demand for transmission ca-
pacity. These cases are briefly addressed in section 5.2.
Due to this lack of satisfactory information about the demand for transmission capacity we have car-
ried out a number of own investigations based on very different approaches. These comprise
• an investigation of the short-term value of transmission capacity focusing on the Italian border,
with special emphasis on exchanges between France and Italy, being based on a comprehensive
generation dispatch model; this investigation has been carried out on our request by the Institute
of Energy Economics (EWI) at the University of Cologne;
• rough considerations on the short-term value of transmission capacity between France and Spain,
based on results of the above-mentioned investigation of EWI and on easily accessible information
on generation dispatch in Spain; this investigation is however far less detailed and thus less reli-
able than the investigation for the Italian border and can therefore not replace a more detailed in-
vestigation;
• investigations based on the results of transmission capacity auctioning procedures for the Dutch-
German border and the Danish-German border, also aiming at evaluating the short-term value of
transmission capacity;
Page 54
36 Analysis of Electricity Network Capacities and Identification of Congestion – Final Report, December 2001
• an evaluation of publicly available energy forecast documents with the objective to identify key
trends in the development of load and generation in the relevant countries that might lead to sig-
nificant changes of cross-border transmission demand in the longer term; and
• an evaluation of the network density inside countries and across borders, focusing on the conti-
nental part of Europe (without Denmark), based on the UCTE load flow model that we have been
given by TSOs.
The methodologies and key results of these investigations are detailed in sections 5.3 through 5.7 with
complementary background information given in appendix F.
It should be stressed in advance that none of these approaches will in itself be sufficient to give a
complete answer to the issue of transmission demand. In particular, as has been discussed at the be-
ginning of this section, none of them can yield concrete MW values regarding the lack of transmission
capacity. Nevertheless, taken together, the presented results create a much better impression of how
urgent the need for additional transmission capacity is at which border, so that they can be used to
prioritise possible measures.
The above list indicates that some of these investigations focus only on one or few of the bottlenecks
identified as critical. This is due to limitations of time and effort that we could spend on this part of the
study and limitations of the availability of the required data. Where this is the case, we recommend
that later on, similar investigations be initiated also for the remaining bottlenecks in order to obtain a
more complete picture of the situation.
5.2 Investigations carried out by TSOs
Although we have addressed this issue in all of the discussions with TSOs in the second phase of the
study, we have only been given very little information about investigations concerning the demand for
transmission capacity. Most TSOs do not seem to perform investigations like those presented in the
sections below, and some of them question the applicability and benefit of such approaches.
Nevertheless, indications regarding the application of generation dispatch models similar to the one
described in section 5.3 have been given by the Nordic TSOs, particularly by Statnett (N) and Svenska
Kraftnät (S). The model applied by Statnett as a tool for the evaluation of investment plans is capable
of determining the “unconstrained” and the “constrained” generation dispatch for different levels of
transmission capacity and to determine both the probability of congestion for the investigated scenar-
ios and the monetary implications of this congestion.
Page 55
Analysis of Electricity Network Capacities and Identification of Congestion – Final Report, December 2001 37
Also TenneT (NL) have performed a market study mentioned in the “Capacity Plan 2001-2007”, ac-
cording to which a maximum import demand of 5000 MW in the period until 2005 is assumed realistic
for economic reasons. However, due to significant uncertainties about the market development, Ten-
neT also take into consideration a second scenario of only 1500 MW import which is a clear indication
of the difficulties related to predictions of transmission demand. Regarding the methodology of the
market study, we have not obtained additional information from TenneT.
5.3 Investigation for France-Italy based on a generation dispatch model
5.3.1 Objective
The analysis described in the following investigates the value of present and additional transmission
capacity between France and Italy. This investigation has been carried out by the Institute of Energy
Economics (EWI) at the University of Cologne. Values are based on simulation results using EWI’s
electricity spot price model EUDIS.12 The EUDIS model optimises generation plant dispatch and
transmission capacity usage in most West European countries by minimising total generation costs in
the system. Price estimators are based on system marginal costs.13
In a first step marginal values for the transmission capacity between France and Italy in every month
of the year 2001 are computed. In a second step different model runs with gradually increasing trans-
mission capacity are calculated since marginal savings permit no prediction of the savings brought
about by greater changes in transmission capacity. The main result of this approach is a curve showing
savings in the system depending on additions of transmission capacity. The cost of adding transmis-
sion capacity is not taken into account in this investigation.
Values of transmission capacity are highly dependent on fuel prices in Europe. For that reason, our
approach is completed by a sensitivity analysis for different fuel price levels.
12 A detailed model description can be found in Kreuzberg, M.: Spot Prices of Electricity in Germany and other
European Countries, Oldenbourg Industrieverlag, 2001.
13 An analysis on the basis of SMC prices shows minimum savings in the system. If prices in one or all coun-
tries are higher due to market power, reductions in generation costs brought about by additional transmission
capacity are at least as high as long as the additional transmission capacity is utilised.
Page 56
38 Analysis of Electricity Network Capacities and Identification of Congestion – Final Report, December 2001
This section focuses on presenting and describing the key results. Assumptions, interpretations, and a
model description can be found in section F.1 of the appendix.
5.3.2 Methodology
The EUDIS model simulates the outcome of a perfectly competitive electricity market by cost minimi-
sation in the production system given the European generation and transmission capacities. The model
calculates hourly system marginal cost (SMC) prices for a typical working day, a Saturday and a Sun-
day in 12 independent months per year. Exogenous inputs such as load curves, fuel prices, available
generation capacities, and cross-border transmission capacities mirror the current situation (year
2001). The model focuses on the interaction of thermal and hydro generation capacity in the European
generation system taking technical constraints and intertemporal interdependencies in both generation
and transmission into account. Interconnected model regions in EUDIS are Germany/Luxembourg, the
Netherlands, Belgium, Great Britain, Austria/Switzerland and Italy. Exports and imports from other
adjacent regions – Scandinavian countries, Middle-East European countries – are integrated in the
model using aggregated supply functions.
Power exchange between regions is based on the fiction of contract paths under the constraint of net
transfer capacities (NTCs) as indicated by ETSO. I.e. if the model transports electricity from say
France to Italy because it is cheaper to produce in France (taking transmission losses into account),
than in Italy, it first fills up the cheapest (usually direct) route. If this is full, the model tests the second
cheapest route (via Switzerland) and uses this route if there is idle capacity and this still would save
costs, and so on. While this does certainly not reflect the physical distribution of load flows, this ap-
proach is compatible with the concept of NTCs and is thus sufficient for this investigation whose ob-
jective is to determine the value of additional NTC and not to analyse concrete network reinforcement
options.
In a competitive electricity market the wholesale market electricity price depends on variable costs of
the marginal generation unit. Actual system marginal cost may be higher or lower than variable cost of
the marginal plant due to dynamic effects such as the dispatch of (pump) storage plants and start-up
costs but the variable cost of the marginal plant can be used as a rough indication of the wholesale
electricity price in the market. In periods with idle transmission capacity between two or more coun-
Page 57
Analysis of Electricity Network Capacities and Identification of Congestion – Final Report, December 2001 39
tries the electricity prices in these countries should be very close except for payments for transmission
rights14 and compensations for transmission losses.
The marginal value of cross-border transmission capacity results from the cost reduction in the whole
system which can be achieved by a marginal increase in capacity. Basically, this is the spread between
the electricity prices in the exporting country and the importing country, but transmission costs and
transmission losses have to be taken into account. Transmission capacity has positive marginal value
only in time periods when it is fully utilised. When transmission capacity is not fully used, a marginal
variation would not have any effect on costs, i.e. the marginal value is zero.15 Marginal values for the
initial NTC values in the base scenario are presented in the first part of section 5.3.3.
Besides marginal changes in transmission capacity, greater variations in transmission capacity have to
be regarded. Since the relation between transmission capacity and savings is not linear, it is not
enough to simply multiply marginal savings by additional capacity. Numerous model runs with a
gradually increasing NTC value between the two countries have to be carried out to determine the cost
reduction in the whole system depending on the amount of additional NTC between France and Italy.
The results for increasing transmission capacity in the base scenario are described in the second part
of section 5.3.3.
The value of transmission capacity reflects differences in marginal generating costs between the two
regions it connects. If cost differences are close to zero, the transmission capacity has a value close to
zero, it might not be fully utilised. If cost differences between regions are higher, for example because
the marginal plant on one side of the interconnection is a hard coal fired plant whereas on the other
side the marginal plant is gas fired, the transmission capacity is fully utilised and its value is high. In
this case, the value of transmission capacity depends on fuel price differences between hard coal and
gas. Regarding France and Italy, this is a likely scenario during some periods of the year because of
14 For this investigation no tariffs for transmission rights are implemented in the model. If the allocation mecha-
nism for existing transfer capacities is efficient the payments for transmission rights are no real (short-term)
costs. The payments just lead to a redistribution.
15 An interconnector can have a value of zero even if it is fully utilised. This situation will not be distinguished
from the situation where the interconnector is not fully utilised.
Page 58
40 Analysis of Electricity Network Capacities and Identification of Congestion – Final Report, December 2001
the high share of gas-fired power plants in Italy in comparison to other countries, especially France.16
During other periods, mainly off-peak periods on Summer weekends, the price in France might even
be determined by nuclear power plants, while in Italy gas-fired plants determine SMC.
A sensitivity analysis in the form of two additional scenarios was performed to isolate the effects of
different fuel prices on the value of transmission capacity. In a low Europe oil and gas price scenario
oil and gas prices in all model regions are reduced to 80% of the prices in the base scenario. This re-
duces SMC in all countries when gas- or oil-fired plants are at the margin and hence reduces the value
of transmission capacity in periods where oil- and gas-fired plants are marginal in Italy and cheaper
technologies are setting the price in France.17 In the low Italian oil and gas price scenario, oil and
gas prices are reduced only in Italy but not in the other model regions. The results of the sensitivity
analysis are shown in section 5.3.4.
5.3.3 Results for the base scenario
Initial NTC values
In a first step we have run the EUDIS model with the base scenario assumptions for exogenously
given input parameters (fuel prices, generating and transfer capacities and load curves) to determine
the value of the present transmission capacity between France and Italy. Fig. 5.1 shows the aggregated
monthly marginal values.18 There is a seasonal pattern: The value is high during summer (May to
September) and low during the rest of the year. Thus on a monthly aggregation level the marginal
value of transmission capacity is higher in months with a relatively low demand.19 The value of one
16 See appendix F.1 for a detailed explanation.
17 Note that the marginal plant does not necessarily have to be in France. If for example transmission capacity
between France and Germany is not filled up, the price setting plant might be located in Germany.
18 Aggregated monthly marginal values are the sum of marginal values over all hours of the month.
19 In general the electricity consumption in Europe is higher in cold periods than in warm periods in contrast to
e.g. the USA where a widespread use of air conditioning systems leads to a higher electricity consumption in
summer months.
Page 59
Analysis of Electricity Network Capacities and Identification of Congestion – Final Report, December 2001 41
MW of additional NTC for the whole year 2001 amounts to approximately 70,000 Euro/MW.20 The
corresponding values for transfer capacity from the Alpine Countries (here: Austria and Switzerland)
to Italy are shown for comparison. The marginal value of transmission capacity between the Alpine
region and Italy is always lower than the value for the French-Italian border.
-2,0004,0006,0008,000
10,00012,00014,00016,000
Jan Feb Mar Apr May Jun Jul Aug Sep Oct Nov Dec
Eu
ro/M
W/m
on
th France - ItalyAlpine Countries - Italy
Fig. 5.1: Monthly aggregated marginal values for transfer capacity from France and the Alpine
Countries (Austria/Switzerland) to Italy; initial NTC values; base scenario – 2001
Looking at hourly marginal values for January (a typical winter month) and July (a typical summer
month) gives additional insights. The marginal values for the French-Italian border in January (fig.
5.2) show a broad variation over hours as well as over day types. In general the values on the weekend
– mainly on Sunday – are higher than on working days. The highest values on Sunday amount to about
22 Euro/MW/hour. The transmission capacity has a marginal value of zero – and is hence not fully
utilised – during very few hours. The marginal values for transmission capacity from the Alpine region
to Italy have nearly the same pattern, but values are generally lower. In addition, there are more hours
when transmission capacity is not fully utilised. This points to the fact that in some hours France and
the Alpine Countries are integrated (free transmission capacity is available) and in other hours the
capacity from France to Switzerland is fully utilised, thus separating the two markets21 (see appendix
F.1 for a more detailed interpretation).
20 Yearly marginal values are calculated as the sum of the monthly values.
21 Both the direct route from France to Switzerland and indirect routes (e.g. via Germany) must be fully utilised
to separate the two markets.
Page 60
42 Analysis of Electricity Network Capacities and Identification of Congestion – Final Report, December 2001
France - Italy: January
0
5
10
15
20
25
1 4 7 10 13 16 19 22 1 4 7 10 13 16 19 22 1 4 7 10 13 16 19 22
Eu
ro/M
W/h
ou
r
Working Day Saturday Sunday
Alpine Countries - Italy: January
0
5
10
15
20
25
1 4 7 10 13 16 19 22 1 4 7 10 13 16 19 22 1 4 7 10 13 16 19 22
Eu
ro/M
W/h
ou
r
Working Day Saturday Sunday
Fig. 5.2: Hourly marginal values for transfer capacity from France and the Alpine Countries to
Italy; initial NTC values; base scenario – January 2001
France - Italy: July
0
5
10
15
20
25
1 4 7 10 13 16 19 22 1 4 7 10 13 16 19 22 1 4 7 10 13 16 19 22
Eu
ro/M
W/h
ou
r
Working Day Saturday Sunday
Alpine Countries - Italy: July
0
5
10
15
20
25
1 4 7 10 13 16 19 22 1 4 7 10 13 16 19 22 1 4 7 10 13 16 19 22
Eu
ro/M
W/h
ou
r
Working Day Saturday Sunday
Fig. 5.3: Hourly marginal values for transfer capacity from France and the Alpine Countries to
Italy; initial NTC values; base scenario – July 2001
Page 61
Analysis of Electricity Network Capacities and Identification of Congestion – Final Report, December 2001 43
In July the marginal values of transmission capacity are much higher (fig. 5.3). Although the values on
Sunday are on average still higher than the values on a typical weekday and Saturday, the differences
are smaller than in January. There are almost no hours with a value of zero. Moreover, the values for
the French-Italian border and the border between the Alpine Countries and Italy are very similar. This
implies a higher difference in the cost of the price setting power plants between Italy and its neigh-
bouring countries in July than in January.
Variations of the transmission capacity between France and Italy
In a second step the value of additional NTC from France to Italy was determined. Numerous model
runs were performed with transmission capacity gradually increasing up to 20,000 MW of additional
capacity. This value of about 4 times the existing NTC on the Italian border is of course totally unre-
alistic, but we have chosen it to give a better impression of the shape of the resulting curve. The value
of additional capacity is determined by total cost savings in the system brought about by the new ca-
pacity. Total costs comprise the sum of short term generation costs in all considered model regions
over the year.
In fig. 5.4 the reductions of total system costs depending on additional transmission capacity from
France to Italy in the year 2001 are depicted. The outcome is a monotonously increasing curve con-
verging to a saturation level of savings about 275 Mio. Euro/year. Cost savings are achievable over a
wide range of additional transmission capacity with the saturation being reached approximately by an
addition of 10 GW under the assumptions of the base scenario.
0
50
100
150
200
250
300
- 2,000 4,000 6,000 8,000 10,000 12,000 14,000 16,000 18,000 20,000Additional NTC in MW
Mio
. Eu
ro/y
ear
Fig. 5.4: Yearly reduction of total generation costs depending on additional NTC from France to
Italy; base scenario – 2001
Page 62
44 Analysis of Electricity Network Capacities and Identification of Congestion – Final Report, December 2001
While fig. 5.4 shows cumulative cost savings, fig. 5.5 depicts the marginal yearly values (i.e. cost
savings) of additional capacity for increasing levels of NTC. Additional transmission capacity at this
border is valued high by the system not only on the present margin but also after the addition of sev-
eral hundred MWs of capacity. For the first 500 MW of additional NTC there is almost no decrease in
the marginal yearly values. Even the 3,001st MW of additional capacity still saves costs of almost
34,000 Euro/MW/year. This is an indication of the high amount of idle generating capacity in France
with variable costs lower than those of power plants used in Italy.
-
10,000
20,000
30,000
40,000
50,000
60,000
70,000
80,000
0
100
500
1,0
00
2,0
00
3,0
00
4,0
00
5,0
00
6,0
00
7,0
00
8,0
00
9,0
00
10,
000
15,
000
20,
000
Additional NTC in MW
Eu
ro/M
W/y
ear
Fig. 5.5: Yearly marginal values of additional NTC from France to Italy depending on the level of
NTC; base scenario – 2001
5.3.4 Results of the sensitivity analysis
We conducted a sensitivity analysis for fuel prices. The following two scenarios are investigated:
• Low Europe oil and gas price scenario (low Europe scenario): A reduction of gas and oil prices
to 80% of the base scenario’s values in all model regions.
• Low Italian oil and gas price scenario (low Italy scenario): A reduction in gas and oil prices to
80% of the base scenario’s values only in Italy.
The first scenario serves to demonstrate the effects of a reduced spread between the variable costs of
gas- and oil-fired power stations and other, mainly coal-fired power plants. The second scenario shows
the implications of lower variable costs of Italian oil- and gas-fired power plants.
Page 63
Analysis of Electricity Network Capacities and Identification of Congestion – Final Report, December 2001 45
For both scenarios we carried out numerous model runs with varying NTC values from France to Italy.
Thus we examine the sensitivity of the marginal value of transmission capacity for the present network
status as well as for increasing levels of NTC under different fuel price assumptions.
Fig. 5.6 shows monthly marginal values of NTC from France to Italy for the base scenario, the low
Europe scenario and the low Italy scenario for the present network status. There is a sharp decrease in
marginal values between the base scenario and the low Europe scenario and a further rather slight
decrease between the low Europe scenario and the low Italy scenario in all months. The aggregated
yearly marginal value in the low Europe scenario is about 65 % of the base scenario’s. Although in
absolute figures the summer months contribute most to this reduction, the relative decrease is higher in
winter months. The further decline in the low Italy scenario is relatively small. The aggregated yearly
value in the low Italy scenario is around 90% of the value in the low Europe scenario (58% of the base
scenario).
-
2,000
4,000
6,000
8,000
10,000
12,000
14,000
16,000
Jan Feb Mar Apr May Jun Jul Aug Sep Oct Nov Dec
Eu
ro/M
W/m
on
th
Base Scenario
Low Europe Scenario
Low Italy Scenario
Fig. 5.6: Monthly aggregated marginal values for transfer capacity from France to Italy; different
fuel price scenarios; initial NTC values – 2001
The cumulative annual cost reductions in the three scenarios for increasing NTC values from France to
Italy are presented in fig. 5.7. The total amount of cost reductions brought about by additional NTC at
this border is significantly lower in both the low Europe scenario and the low Italy scenario in com-
parison to the base scenario.
Obviously the more decisive factor is the spread between the oil or gas price and other fuel prices and
not the difference between oil or gas prices in Italy and other model regions. Hence, the cost reduc-
tions in the base scenario stem mainly from the difference in variable costs between generation tech-
Page 64
46 Analysis of Electricity Network Capacities and Identification of Congestion – Final Report, December 2001
nologies, e.g. gas-fired combined cycle power plants and coal-fired power stations, and not from the
difference in efficiency within a power plant technology.
0
50
100
150
200
250
300
- 2,000 4,000 6,000 8,000 10,000 12,000 14,000 16,000 18,000 20,000
Additional NTC in MW
Mio
. Eu
ro/y
ear
Base Scenario
Low Europe Scenario
Low Italy Scenario
Fig. 5.7: Yearly reduction of total generation costs depending on additional NTC from France to
Italy; different fuel price scenarios – 2001
5.3.5 Summary
The simulation results show a remarkably high value for existing transmission capacity from France to
Italy in the year 2001. An increase in the NTC value can reduce the total (variable) generation costs in
the European system considerably.22 The value of an additional MW of transmission capacity – meas-
ured by its cost reduction potential – declines, but remains important even for high NTC additions.
Particularly in low demand periods – at the weekend and in the summer months – there are high cost
reduction opportunities by increasing generation in France or other interconnected parts of Europe and
simultaneously reducing generation in relatively expensive Italian power stations. These results are
highly sensitive to fuel price assumptions. The crucial factor is the difference between gas and oil
prices on the one hand and fuel prices of other generation technologies such as hard coal and nuclear
22 Since costs of additional transmission capacity as well as the allocation mechanism of available capacity are
not taken into account here, this result in itself is clearly not a final assessment of the economic efficiency of
measures to increase transmission capacity at this border.
Page 65
Analysis of Electricity Network Capacities and Identification of Congestion – Final Report, December 2001 47
on the other hand. The difference in the generation costs of gas- and oil-fired power plants in Italy and
other model regions appears to be of less importance.
5.4 Considerations for France-Spain based on dispatch information
As pointed out earlier, an investigation like presented in the section above could only be performed in
this study for one of the critical bottlenecks, particularly the Italian border. Building on the interpreta-
tion of the results of that investigation, we however consider it possible to gain a very rough impres-
sion of the potential for similar results for other borders, too, based on easily accessible information.
In this section, we demonstrate this for the French-Spanish border which is also one of the highly con-
gested interfaces. However we have to stress in advance that this rough consideration, in contrast to
the detailed model-based investigation, can only yield an impression of the order of magnitude of the
results. It should basically be regarded a preliminary analysis to decide about the potential benefit of a
more detailed investigation.
The high generation cost reductions due to addition of transmission capacity across the Italian bor-
der, and thus the high value of transmission capacity, could essentially be explained by coal-fired or
even nuclear generation capacity in France being available in times where gas- or oil-fired generation
determines the marginal generation cost in the Italian system. In such periods, savings can be achieved
due to the high spread between the respective fuel prices of the marginal plant in both countries.
To get a rough idea of the potential value of transmission capacity between France and Spain, it ap-
pears therefore sensible to analyse the dispatch structure of the Spanish generation system. Relevant
information about this can be found in reports published by the Spanish TSO REE on their website. A
particularly interesting diagram is given in the annual report of REE for 2000, showing the load dura-
tion curve of the Spanish transmission system and, for each hour of the year, the structure of the elec-
tricity procurement to cover the total load (fig. 5.8). The procurement structure is broken down into
primary energy types, imports and electricity procured on the basis of “special arrangements”. The
latter can be considered as “take obligations” of electricity e.g. from wind energy converters or indus-
trial cogeneration plants, as we have been informed by REE. Hence, this procurement source is not a
determining factor for the system marginal cost. The same is true for hydraulic production.
Page 66
48 Analysis of Electricity Network Capacities and Identification of Congestion – Final Report, December 2001
0
5000
10000
15000
20000
25000
30000
35000
Fuel+Gas
Nuclear
Coal
Hydraulic
Special arrangement
Imports
Demand
0 4000 8000hours
MW
2000 6000
Fig. 5.8: Load duration curve and procurement structure of the Spanish electricity transmission
system in 2000 (source: annual report 2000 of REE)
The crucial factor determining marginal generation cost is the utilisation degree of oil- and gas-fired
capacity. Fig. 5.8 shows that in 2000, such capacity has been utilised in Spain in most hours of the
year. To a certain extent, this might be due to technical constraints that have to be taken into account
in generation dispatch, rather than being a result of economic optimisation. However, the following
observations show that in most times, coal-fired and nuclear generation have obviously been fully
utilised so that marginal cost has necessarily been determined by oil- and gas-fired plant:
The preliminary report 2000 on the operation of the Spanish power system, also published by REE on
their web site, contains a chart (fig. 5.9) showing that installed capacity of coal-fired and nuclear gen-
eration amounts to approximately 19.3 GW at the end of 2000. The non-availability of such generation
units due to maintenance and disturbances is normally in the range between 10 and 20 %. Therefore a
power in the range between 15.5 and 17.5 GW can realistically be produced by coal-fired and nuclear
plants in Spain.
Page 67
Analysis of Electricity Network Capacities and Identification of Congestion – Final Report, December 2001 49
53 %
18 %
13 %
17 %Imported coal
Black lignite
Brown lignite
Hard coalCoal
11,542 MW
26%
Hydroelectric16,524 MW
37%
Nuclear7,799 MW
18%
Oil & Gas8,214 MW
19%
Fig. 5.9: Installed generation capacity at the Spanish transmission system on 31st Dec. 2000
(source: preliminary report 2000 of REE on the Spanish power system operation)
Based on the data underlying the diagram in fig. 5.8, that REE has made available to us, we have de-
termined the sorted utilisation curve for the total of coal-fired and nuclear generation. This curve is
shown in fig. 5.10 together with the hourly corresponding levels of oil- and gas-fired generation. This
diagram shows that during the major part of the year, coal-fired and nuclear generation is in the
aforementioned range of practically achievable production levels or only slightly below it. At least in
these periods, there has obviously been hardly any idle coal-fired generation capacity in Spain, so that
oil- and gas-fired units had to be operated, as can also be seen from this diagram. Assuming that the
variable cost of the latter units are similarly high in Spain as in Italy, a reduction in generation cost
could be achieved in these hours if additional power from coal-fired or even nuclear units could be
imported from France across additional transmission capacity, due to the high price spread between oil
and gas on the one hand and hard coal on the other hand. A better impression of the levels of oil- and
gas-fired generation is given by the sorted utilisation curve for this type of generation in fig. 5.11.
Under the assumption that the Spanish generation dispatch structure of 2000 can be considered as
typical, and that other relevant characteristics like the load profile and the oil and gas prices are not too
different in Spain and in Italy, we come to the conclusion that the marginal value of additional trans-
Page 68
50 Analysis of Electricity Network Capacities and Identification of Congestion – Final Report, December 2001
mission capacity from France to Spain may well be in a similar order of magnitude as in the Italian
case.
A more concrete quantification of this value is not possible on the basis of this very aggregate infor-
mation. It is important to note that the range of additional NTC over which savings can be achieved is
likely to be smaller than for Italy, because the power procured from oil- and gas-fired plant in Spain
has been below 5 GW throughout the year 2000 according to fig. 5.10. Nevertheless, we think that the
above considerations are sufficient to justify a more detailed investigation also for this border.
0
5000
10000
15000
20000
25000
0 4000 8000hours 2000 6000
MW
Nuclear + Coal
Fuel+Gas
Fig. 5.10: Utilisation curves of different types of generation at the Spanish electricity transmission
system in 2000, sorted by utilisation of nuclear and coal-fired generation (source of un-
derlying data: REE)
0
1000
2000
3000
4000
5000
0 4000 8000hours 2000 6000
MW
Fuel+Gas
Fig. 5.11: Sorted utilisation curves of oil- and gas-fired generation at the Spanish electricity trans-
mission system in 2000 (source of underlying data: REE)
Page 69
Analysis of Electricity Network Capacities and Identification of Congestion – Final Report, December 2001 51
5.5 Evaluation of transmission capacity auctioning results
The approach presented in sections 5.3 and 5.4 is based on the idea of determining the marginal value
of transmission capacity by simulating generation dispatch. A different and very straightforward ap-
proach with the same objective is to directly observe the value of transmission capacity by analysing
the results of explicit auctions for transmission capacity at borders where such procedures are applied.
Theoretically, the price that market parties are ready to pay for transmission capacity can be expected
to be just as high as the marginal generation cost savings that could be achieved by utilising that ca-
pacity.
We have investigated this approach for two cases where data on auctioning results is available in the
public domain. These cases are the Dutch-German border, where we have concentrated on the auc-
tioning results for the transmission direction from Germany to the Netherlands, and the Danish-
German border which we have analysed for both transmission directions. In both cases, we have in-
cluded hourly price information of the day-ahead auctions, covering the period from Jan. to Sep. 2001
for the Dutch-German border and from July to Aug. 2001 for the Danish-German border.
The results for the Dutch-German border are shown in fig. 5.12, aggregated to monthly totals of
hourly values.
0
2000
4000
6000
8000
10000
12000
Jan Feb Mar Apr May Jun Jul Aug Sep
Eur
o/M
W/m
onth
Transmission price D→NL (all hours)Transmission price D→NL (peak hours: 08.00-20.00)
Fig. 5.12: Monthly totals of hourly day-ahead transmission capacity auctioning results for trans-
mission from Germany to the Netherlands in the period Jan.-Sep. 2001, evaluated for all
hours and for peak hours
Page 70
52 Analysis of Electricity Network Capacities and Identification of Congestion – Final Report, December 2001
When calculating these totals, hours in which the available capacity has not been fully auctioned off
have been represented by a value of zero. Auctioning prices for the opposite transport direction have
not been taken into consideration here. The figure shows that the magnitude of the values assigned to
transmission capacity by participants of the auctioning procedures is well comparable to the results
obtained by model-based simulations for transmission capacity from France to Italy. For the period of
9 months covered here, the cumulated marginal value of transmission capacity amounts to appr.
33,000 Euro/MW, and the yearly value can be extrapolated to be around 40,000 Euro/MW. Fig. 5.12
also shows that this economic value of transmission capacity is practically only related to transmission
during the daily peak hours (08.00-20.00 h). During the night hours, the economic value is close to
zero.
In theory, auctioning prices for transmission capacity are expected to be equal to short-term power
price differentials between the respective markets. To investigate this assumption, we have determined
the hourly price differentials for the day-ahead market between the Dutch power exchange APX and
either of the German power exchanges LPX and EEX. The monthly totals of these price differentials
are shown in fig. 5.13 in comparison to the aggregated transmission prices (for all hours and for peak
hours). Quite obviously, the power price differentials are significantly higher than the transmission
prices, with totals for this 9-month-period amounting to appr. 76,000 Euro/MW.
For analysing this discrepancy, we have produced a diagram showing the relation between transmis-
sion prices and power exchange price differentials by one dot for each pair of hourly values, which is
shown in fig. 5.14 for this border and for the power exchanges APX and EEX. (The same figure for
APX and LPX looks very similar.) Obviously, there is hardly any correlation between these hourly
values. It is beyond our experience to explain this remarkable lack of correlation, and we expect that
additional investigations on possible imperfections of the electricity and transmission markets and on
the adequacy of power exchange prices as a price indicator would be required to come to a satisfactory
explanation.
In the absence of explanations for this observation, we tend to rely rather on the transmission prices
when estimating the value of transmission capacity, because these prices have actually been paid by
market parties, and they are the lower value and thus yield an estimation on the safe side.
Page 71
Analysis of Electricity Network Capacities and Identification of Congestion – Final Report, December 2001 53
0
5000
10000
15000
20000
25000
Jan Feb Mar Apr May Jun Jul Aug Sep
Eur
o/M
W/m
onth
Transmission price D→NL (all hours)Positive price differential APX - LPX (all hours)Positive price differential APX - EEX (all hours)
0
5000
10000
15000
20000
25000
Jan Feb Mar Apr May Jun Jul Aug Sep
Eur
o/M
W/m
onth
Transmission price D→NL (all hours)Positive price differential APX - LPX (all hours)Positive price differential APX - EEX (all hours)
0
5000
10000
15000
20000
25000
Jan Feb Mar Apr May Jun Jul Aug Sep
Eur
o/M
W/m
onth
Transmission price D→NL (peak hours)Positive price differential APX - LPX (peak hours)Positive price differential APX - EEX (peak hours)
0
5000
10000
15000
20000
25000
Jan Feb Mar Apr May Jun Jul Aug Sep
Eur
o/M
W/m
onth
Transmission price D→NL (peak hours)Positive price differential APX - LPX (peak hours)Positive price differential APX - EEX (peak hours)
Fig. 5.13: Monthly totals of hourly day-ahead transmission capacity auctioning results and price
differentials of power exchanges for transmission from Germany to the Netherlands in the
period Jan.-Sep. 2001, evaluated for all hours and for peak hours
Page 72
54 Analysis of Electricity Network Capacities and Identification of Congestion – Final Report, December 2001
0
5
10
15
20
25
30
-10 -5 0 5 10 15 20 25 30
Price Differential APX – EEX [Euro/MWh]
Tra
nsm
issi
on P
rice
D→
NL
[Eur
o/M
Wh]
0
5
10
15
20
25
30
-10 -5 0 5 10 15 20 25 30
Price Differential APX – EEX [Euro/MWh]
Tra
nsm
issi
on P
rice
D→
NL
[Eur
o/M
Wh]
Fig. 5.14: Relation between hourly day-ahead prices for transmission from Germany to the Neth-
erlands and price differentials between APX and EEX in the period Jan.-Sep. 2001
Similar results for the Danish-German border are shown in fig. 5.15 and 5.16, covering both transport
directions because congestion occurs in both directions at this location. The monthly values based on
transmission prices paid are significantly lower at this border than at the Dutch-German border, with
cumulated values for these 2 months amounting to 2,000 Euro/MW for northbound transmission and
only 500 Euro/MW for southbound transmission.
Again, the totals of the price differentials between the relevant power exchanges (in this case the price
area Denmark West of Nordpool, besides LPX and EEX) are considerably higher than those of the
transmission prices. The correlation between hourly transmission prices and power price differentials
is not as weak as in the Dutch case, but still far away from the correlation expected in theory. In par-
ticular, there are many hours with non-zero power price differentials but with transmission prices
around zero.
Page 73
Analysis of Electricity Network Capacities and Identification of Congestion – Final Report, December 2001 55
Transmission price D→DKPrice differential Nordpool – EEXPrice differential Nordpool – LPX
Jul Aug
0
500
1000
1500
2000
2500
3000
3500
4000
Eur
o/M
W/m
onth
0
500
1000
1500
2000
2500
3000
3500
4000
Jul Aug
Transmission price DK→DPrice differential EEX – NordpoolPrice differential LPX – Nordpool
Transmission price D→DKPrice differential Nordpool – EEXPrice differential Nordpool – LPX
Jul Aug
0
500
1000
1500
2000
2500
3000
3500
4000
Eur
o/M
W/m
onth
0
500
1000
1500
2000
2500
3000
3500
4000
Jul Aug
Transmission price DK→DPrice differential EEX – NordpoolPrice differential LPX – Nordpool
Fig. 5.15: Monthly totals of hourly day-ahead transmission capacity auctioning results and price
differentials of power exchanges for transmission between Germany and Denmark in the
period July-Aug. 2001
A clear limitation of this approach as compared to the model-based investigation is that can only yield
information on the marginal value of transmission capacity for the current status of the network, and
not for increments of transmission capacity. If additional information were taken into account, e.g. on
cost curves of the generation systems in the involved markets, on hourly loads in these markets, and/or
on price curves for offer and demand at the power exchanges, we expect that further results could be
obtained about the decline of marginal value when NTC is added. Such investigations would however
go beyond the scope and time frame of this study.
Page 74
56 Analysis of Electricity Network Capacities and Identification of Congestion – Final Report, December 2001
-20
-15
-10
-5
0
5
10
15
20
-20 -15 -10 -5 0 5 10 15 20
Price Differential Nordpool (Price Area Denmark West) – EEX [Euro/MWh]
Tra
nsm
issi
on P
rice
[E
uro/
MW
h]
-20
-15
-10
-5
0
5
10
15
20
-20 -15 -10 -5
-20
-15
-10
-5
0
5
10
15
20
-20 -15 -10 -5 0 5 10 15 20
Price Differential Nordpool (Price Area Denmark West) – EEX [Euro/MWh]
Tra
nsm
issi
on P
rice
[E
uro/
MW
h]
D→DK
DK→D
Fig. 5.16: Relation between hourly day-ahead transmission prices between Germany and Denmark
and price differentials between NordPool (DK West) and EEX in Jul.-Aug. 2001
5.6 Evaluation of publicly available energy forecasts
All the investigations discussed in the sections above focus exclusively on today’s demand for trans-
mission capacity. Of course, model-based investigations could also be carried out for future years,
based on forecasts of the load and generation development, with correspondingly higher uncertainties
regarding all the relevant input quantities, and therefore higher effort related to forecasting, perform-
ing sensitivity analyses and interpreting the results. In the scope of this study, such investigations
could not be carried out.
Instead of this, we have evaluated publicly available documents presenting energy forecasts of differ-
ent institutions for different time horizons to get an impression of relevant future trends. Basically,
these sources include
• a forecast on the power and energy balance for 2001-2003 published by UCTE,
• a similar forecast for the same period prepared by NORDEL,
• another forecast for this period prepared jointly by UCTE, NORDEL, UKTSOA and ATSOI,
• a questionnaire-based forecast prepared by EURELECTRIC for the period from 2000 to 2010, and
Page 75
Analysis of Electricity Network Capacities and Identification of Congestion – Final Report, December 2001 57
• the “European Union Energy Outlook to 2020” published by the European Commission in 1999.
The essential difficulty in interpreting such forecasts with respect to cross-border transmission demand
is that they do not allow to predict the value of transmission capacity, but only to estimate the avail-
able margin of installed generation capacity, i.e. the difference between securely available generation
capacity and load within a specific country at a specific reference point in time. This may be sufficient
to determine the absolute minimum amount of transmission capacity required to fully supply the total
load in each country, but not the amount of capacity required to operate the whole system efficiently.
We have therefore restricted this analysis to the identification of significant changes in generation
capacity and load within the forecast horizons. Certainly it should be noted that new generation capac-
ity need not necessarily be fully utilised, and the utilisation degree of existing generation capacity
might also change when new capacity is added. However it appears reasonable to believe that new
capacity will be efficient enough to be utilised at least to a “normal” extent. All in all, the accuracy of
results of this approach to derive transmission demand should not be overestimated.
Essential results of this “incremental” evaluation are:
• The transmission demand on the bottlenecks from Germany to Denmark and from Sweden to
Norway is likely to increase notably in the next years, while decreasing in the opposite direction,
particularly caused by the load in Norway and Sweden growing faster than the installed generation
capacity.
• The high import demand of the Netherlands is expected to remain constant or even to grow in the
next years, but to decrease significantly in the long term.
• The high import demand of Italy is predicted to decrease gradually in the short and long term.
• The congestion on the border from France to Spain can be expected to be relieved in the next
years due to a fast growth of installed generation capacity in Spain. It is even conceivable that the
dominating power flows on this border change direction as compared to today.
Details on these findings and the sources evaluated can be found in section F.2 of the appendix.
5.7 Determination of network density
The approaches outlined so far have in common that they assess the value of and the demand for
transmission capacity by analysing today’s or future structures of load and generation on an interna-
tional level in order to gain information on actual or desirable cross-border exchange of electricity.
This idea is consistent with the traditional approach of network planning, considering the “task” of the
Page 76
58 Analysis of Electricity Network Capacities and Identification of Congestion – Final Report, December 2001
network as being defined by levels and locations of load and by capacities, locations and dispatch of
generation units. The optimal network structure and capacity is thus regarded a result of existing or
expected load and generation structures.
The problem with this thinking is that in a liberalised power market, the coupling between generation
planning and network planning becomes much looser: network operators usually cannot rely on long-
term plans of the generation companies any more because the latter are either not obliged to submit
such plans or not sufficiently incentivised to adhere to them. In view of the long-term nature of net-
work investments, this leads to growing uncertainty in network planning with particular respect to
generation structures. This problem has been frequently discussed in Europe since liberalisation has
started, and is a fundamental matter of on-going research.
In the light of this development, it appears sensible to give some attention also to the opposite view-
point, regarding the network not as a result but rather as a driving factor of the development of gen-
eration structures. On a European level, this viewpoint could be interpreted as the attempt to create a
more or less homogeneous network in order to provide a level playing field for long-term decisions
about the location of generation capacities. This viewpoint requires to analyse the demand for trans-
mission capacity only on the basis of the desired overall “network density” and the requirements de-
rived from load structures which continue being an input factor of network planning.
The problem of finding an optimal balance between the traditional, i.e. load- and generation-driven
approach to network planning and this new viewpoint is not only an economical but also a political
one, and it is beyond the scope of this study to give recommendations in this respect. Nevertheless, we
demonstrate below a possible approach of investigating network density as one additional factor that
should be paid attention in planning cross-border transmission capacities. The interpretation of the
results shows that this approach yields valuable additional information, irrespective of the difficult
political question of how much weight is put on the objective to achieve a homogeneous network.
Occasionally, the viewpoint of assessing network capacity independently from generation structure
and dispatch is also taken by market participants or TSOs, mostly on a very high aggregation level, for
example relating the sum of NTCs of all borders of a country to the total load of that country. Evi-
dence for this can be found on the website of RTE (F), where such ratios (“taux d’interconnexion”,
being defined as the ratio between cross-border transmission capacity and peak load of a country) are
given for 5 European countries. According to that diagram, the ratios of Spain (0.23) and France (0.30)
are clearly lower than those of Germany (0.79) and Belgium (0.70) which in turn are far below the
figure for Switzerland (2.70).
Page 77
Analysis of Electricity Network Capacities and Identification of Congestion – Final Report, December 2001 59
A drawback of such quantities is that they are obviously influenced by the size and the location of a
country. A small country located in the centre of an interconnected system where a significant part of
the capacity may be used for transits, like Switzerland, is likely to have a much higher ratio than a
large country at the edge of the system or even on a peninsula, like Spain.
We therefore prefer to introduce a new type of quantity to measure the network density at an arbitrary
location of the network, independent from country boundaries. We call this quantity the “(n-1) secure
point-to-point capacity” of the network at a specific location. It can be computed for each single line
of a network, based on a load flow model of the network, and it represents the maximum level of
power (in MW) that could be transported from one terminal station of the respective line to the other
terminal station (irrespective of the direction), starting from an “empty” network state, without violat-
ing the power transfer rating of any other line or transformer. The aforementioned term indicates
• that it relates to the (n-1) secure transmission capacity, which is reflected in the calculation by
simulating an outage of precisely that line for which the network density is computed, and
• that it reflects the network density at one location, or more precisely at the location of two substa-
tions belonging to one line (“point-to-point”), and must therefore actually be regarded a density
value, and not an integral value of transmission capacity for a certain border section. Therefore the
network density values are something completely different from integral capacity values like
NTC, and they must not be confused with the latter, although they are also given in the unit MW.
Once these quantities have been calculated for each single line of an interconnected transmission sys-
tem, they can be aggregated by calculating average values, e.g. for all lines inside a country or all lines
across a specific border section. It is important to note that calculating averages does not create a de-
pendence on sizes or locations of the countries. In other words, if the network had a totally homogene-
ous structure, e.g. made up by vertical and horizontal lines at equal distances and equal ratings over
the whole interconnected system, the average values of network density would also turn out equal for
each country and each border section.
Details of the calculation of such network density quantities can be found in section I.2 of the appen-
dix.
We have carried out this type of investigation for the 380 kV and 220 kV networks of the UCTE sys-
tem excluding Denmark, according to the area covered by the load flow data we have been given. The
results are shown in fig. 5.17, with shades of grey in the range from black to white representing the
range of network density from high to low. (The values used for this diagram have been obtained by
summing up the average network density values for the 380 kV and the 220 kV level that are listed in
appendix I.2.2.)
Page 78
60 Analysis of Electricity Network Capacities and Identification of Congestion – Final Report, December 2001
3000 MW 0 MW1000 MWAverage (n-1) secure point-to-point capacities
(not to be confused with NTC values!)
2000 MW
Fig. 5.17: Average values of transmission network density for countries and border sections
This figure reveals first of all that the network density inside the countries varies considerably from
country to country. This observation shall however not be further discussed here, particularly since
this methodology does not pay attention to differences of the load density among the countries, which
are also an important factor in determining the “optimal” network density.
With a view to cross-border transmission capacity, the results show that there are borders with the
network density being clearly lower than in the adjacent countries, like the French-Spanish border or
the Italian one. If network density were visualised by a 3-dimensional surface covering the area of the
interconnected system, a border like this with comparably low network density would represent a
“notch” in this surface. At such borders, it appears quite sensible from this point of view to increase
transmission capacity in order to improve the homogeneity of the interconnected network.
In contrast to this, there are also borders where network density does not appear much lower than in
the adjacent national systems, although the capacity on these borders may be congested. This is the
case for the Dutch border. In such a case, the benefit of additional interconnection capacity might be
Page 79
Analysis of Electricity Network Capacities and Identification of Congestion – Final Report, December 2001 61
limited because the adjacent national networks might become weaker than the cross-border connec-
tions. This could result in cross-border capacity not being fully usable.
As a conclusion, it can be stated that this approach to analyse network density gives additional insight
into the characteristics of the network structure independently from locations, capacities and dispatch
of generation units. In view of the objective of this study, it is particularly interesting to compare the
network densities inside countries and along border sections. This comparison yields valuable results
in itself, i.e. without having to specify an “optimal” level of network density to be achieved, because it
helps to identify “notches” in the network density distribution as well as locations where capacities
appear already reasonably homogeneous. However, this approach should only be applied to obtain
complementary information besides other approaches to assess demand for transmission capacity.
Especially, due to the high level of aggregation of the results presented, and due to the fact that the
distribution of load density is not taken into account, it should not be expected to yield precise infor-
mation for the assessment of a specific network reinforcement project.
5.8 Conclusions
In the sections above, a number of approaches to investigate the demand for cross-border transmission
capacity have been presented along with exemplary results that could be obtained in this study. We
come to the conclusion that all of these approaches are suited to yield valuable information about the
value and/or the necessity of measures to increase transmission capacity at the investigated borders in
the short and/or long term, but none of them should be applied in an isolated manner. Regarding those
of the critical bottlenecks identified in chapter 4 that have been addressed in the sections above, the
following conclusions can be drawn:
• The marginal economic value of transmission capacity at the Italian border is remarkably high for
the current network status as well as in case of NTC increasing by several GW. Furthermore, this
border clearly represents a “notch” in network density. Therefore, although import demand of Italy
is expected to decrease gradually in the future, it clearly appears recommendable to increase
transmission capacity across this border as far as economically efficient measures can be identi-
fied.
• The French-Spanish border seems to be a similar case, although for this border, we could only
come to the rough estimation that the value of transmission capacity seems to be in a similar order
of magnitude as in the Italian case.
• For the Dutch-German border, auctioning results indicate that the value of transmission capacity
is not much lower than at the Italian border. According to the network density investigation, it ap-
Page 80
62 Analysis of Electricity Network Capacities and Identification of Congestion – Final Report, December 2001
pears however questionable if a significant increase in interconnection capacity would alone be
sensible here. Maybe this would require the internal networks to be reinforced, too, especially on
the German side. In general, measures to increase capacity across this border should primarily aim
at short-term improvements because energy forecasts expect the Dutch import demand to decrease
significantly in the long term.
• The economic value of transmission capacity at the Danish-German border appears to be rather
low in both directions according to auctioning results, so that currently there does not seem to be
much demand for additional capacity. This could change however if the forecasted development of
the West Danish network being increasingly utilised for transits to the Nordic countries should
materialise.
Page 81
Analysis of Electricity Network Capacities and Identification of Congestion – Final Report, December 2001 63
6 General considerations on “soft measures” to increase transmission
capacity
As outlined in section 2.2, the scope of this study comprises the investigation of “soft measures” to
increase cross-border transmission capacity at the critical bottlenecks, supposed to cause only low
cost, as well as investment options for the same objective. In this chapter, we discuss
• in section 6.1 measures which are of a general nature, i.e. related to the overall framework of ca-
pacity determination and allocation, as well as
• in section 6.2 measures aiming at the extension of specific operational limits, i.e. related to more
technical issues.
Considerations on costs of soft measures and legal issues are presented in sections 6.3 and 6.4, respec-
tively. First conclusions on the general suitability of soft measures are given in section 6.5; an evalua-
tion of their potential for capacity increase at specific borders is performed in chapter 8 in conjunction
with the possible network reinforcement measures.
6.1 Principles of capacity determination and allocation
6.1.1 General remarks on the applicability of NTC values
We have already pointed out in section 3.2.1 that the concept of NTC values applied so far by ETSO
implies a fundamental problem related to the existence of “base case exchanges” (BCE) included in
the relevant network model that is used for the NTC determination at least in the UCTE area. On the
one hand, it clearly makes sense to use a “full” rather than an “empty” network model for these calcu-
lations in order to obtain realistic results. On the other hand, the physical situation reflected by the
“full” network model is not unambiguously associated to a single set of BCEs. Therefore, the under-
lying matrix of BCEs is significant for the resulting NTCs, and BCEs can change as a consequence of
changes in trading contracts, without any change of the physical load flow situation.
Due to this problem, it is difficult for market participants to understand the published NTC values and
their interdependencies. This situation is exacerbated by the fact that the TSOs do not base their as-
sessments on a common physical load flow situation, but often on individually adapted scenarios. This
is certainly to be welcomed as an attempt to avoid obviously unrealistic and misleading results or un-
necessarily high TRM values, but – taking into account the considerable effort spent on the creation of
common forecast as well as snapshot models – it also raises the question if there exists at all the one
Page 82
64 Analysis of Electricity Network Capacities and Identification of Congestion – Final Report, December 2001
load flow situation that could achieve a common acceptance to be suitable for NTC assessment at all
relevant borders.
In view of these considerations, we recommend to generally reconsider the concept of “bilateral” NTC
values for the longer term. A reasonable solution to this problem in the short term would be to publish
the assumed matrix of BCE values along with the NTCs. This would provide a possibility to distin-
guish between technical and commercial contributions and, for example, allow a more transparent
comparison of technical capacities between seasons or years. Since BCE is described by a matrix of
aggregated power exchanges per border and, besides, contains realistic, but not real data, confidential-
ity considerations should not stand against such publication.
6.1.2 Co-ordinated capacity allocation
So far, the procedures for allocation of cross-border transmission capacity in the UCTE transmission
system neither take into account the status of capacity allocation at other borders, nor the physical
source and sink areas of transactions for which capacity is requested. This means that significant secu-
rity margins have to be included when determining the allocable capacity, in order that – at least theo-
retically – each conceivable combination of sources and sinks of transactions in the whole system re-
mains feasible.
It is important to note that we cannot assure that these reserves could actually be made available to
market parties if other capacity allocation procedures were applied, because it is possible that the typi-
cal combination of sources and sinks of transactions, i.e. the typical generation dispatch patterns, are
indeed so unfavourable that the reserve margins are already fully utilised. (In this respect, it appears
interesting to ask TSOs to publish statistical data as an evidence of the actual utilisation of the existing
capacity, to increase transparency.) Moreover, it is conceivable that other limiting factors would be-
come critical if such reserves were partly released.
However, it is most likely that a more co-ordinated approach of capacity allocation would at least
make a part of the reserved capacity available. Such an approach might for example be feasible in the
form of “co-ordinated auctioning” as discussed by ETSO [10]. The essential feature of such an ap-
proach would be the simultaneous allocation of capacity on several (or, ultimately, all) relevant bor-
ders, taking into account the physical impact of transactions with specified source and sink areas on
the load flow across each of the relevant interconnections. (The advantage or even necessity to jointly
consider several borders is, at least from the technical point of view, indirectly confirmed by the pres-
ent ETSO practice of declaring some NTC values between groups of countries. This is however a sim-
plified solution which is based on implicit assumptions on the distribution of power sources and/or
Page 83
Analysis of Electricity Network Capacities and Identification of Congestion – Final Report, December 2001 65
sinks among those countries. In contrast, a co-ordinated capacity allocation could explicitly consider
the combined impact of power flows between the individual countries, leaving the actual distribution
up to the market forces.)
To illustrate the advantage of a co-ordinated allocation procedure, a numerical example of three adja-
cent countries is regarded (fig. 6.1). We assume that country C is a high price area with a strong im-
port demand. We further assume that 70 % of the power flow resulting of an import from country A to
country C flow directly across the tie-lines between A and C, whereas 30 % are physically transited
through country B. Similarly, 70 % of the power flow caused by a transfer from B to C are assumed to
go directly across the border B-C, while 30 % are transited through A (fig. 6.1 a).
We assume that the physical transfer limits of the network are reached when 700 MW flow through
either of the border sections A-C and B-C (fig. 6.1 b), whereas there is no relevant flow limitation
between A and B. This means that if the source for imports to C were located either completely in A
or completely in B, a maximum of 1000 MW could be imported, because this would result in a flow of
700 MW (= 70 % of 1000 MW) across the border A-C or B-C, respectively. If, instead of this, the
physical sources of the import were distributed among countries A and B, more power could be im-
ported in total. In the optimal case, with exactly 50 % of the import power being sourced in A and the
other 50 % in B, a total of 1400 MW could be imported, and both interfaces A-C and B-C would be
fully utilised at 700 MW each.
This fact that the maximum allowable import power flow depends on the distribution of the physical
sources of imports can only be reflected properly by a co-ordinated allocation approach, as is demon-
strated below.
With an uncoordinated allocation regime, TSO C has no information on the allocation status of trans-
mission rights at the border between A and B, and therefore cannot judge on the basis of requests for
import capacity at which locations the imports will actually be sourced. To stay on the safe side, C
always has to assume the worst case that all imported power is physically generated completely in
only one of the neighbouring countries, and that the other country is only used for transit (provided
that there is sufficient generation capacity in the neighbouring countries to make this worst case feasi-
ble). Therefore C can only declare an NTC of 1000 MW for the whole of its borders. It does not matter
how this NTC is shared among the border sections A-C and B-C. Suppose for example that C has de-
clared an NTC of 500 MW for either of the two border sections (fig. 6.1 c).
Page 84
66 Analysis of Electricity Network Capacities and Identification of Congestion – Final Report, December 2001
Physical distribution of power flows from a or B to C
A B
C
70 %
30 % 30 %70 %
A B
C
≤ 700 MW ≤ 700 MW
a) b) Physical flow limitations
Assumed network properties
Example ofcommercial allocation
A B
C
500 MW 500 MW
600 MW 400 MW
100 MW
NTC
c)
Outcome of uncoordinated capacity allocation
Resulting power flowsand import sources
A B
C
540 MW 460 MW
~ ~
1000 MW
600 MW 400 MW
d)
Example ofcommercial allocation
A B
C
500 MW 843 MW
600 MW 743 MW
100 MW
e)
Outcome of co-ordinated capacity allocation
Resulting power flowsand import sources
A B
C
643 MW 700 MW
~ ~
1343 MW
600 MW 743 MW
f)
Fig. 6.1: Potential benefit of co-ordinated capacity allocation
Page 85
Analysis of Electricity Network Capacities and Identification of Congestion – Final Report, December 2001 67
Assume now a situation where the generators in country A actually want to produce 600 MW for ex-
port to C. With NTC being 500 MW for either of the border sections, they will have to request for
500 MW of transmission capacity from A to C, and commercially transit the remaining 100 MW
through B, i.e. request for 100 MW of transmission capacity from B to C. In this situation, 400 MW of
transmission capacity would remain available. If we assume that generators in country B want to use
as much as possible transport capacity to also generate power for export to C, they could do so at a
level of precisely 400 MW. As a result of these transactions, however, neither of the transmission in-
terfaces A-C and B-C would be fully utilised (fig. 6.1 d).
If the allocation on all borders was co-ordinated (fig. 6.1 e and f), the actual physical distribution of
sources of the imported power could be taken into consideration. This would require that the requests
for transmission capacity across the border A-B were also known to the TSOs participating in the co-
ordinated allocation (i.e. all TSOs). Based on the information that 600 MW are actually intended to be
produced in country A for export to C, the TSOs can calculate that this would result in a power flow of
600 MW × 70 % = 420 MW across the border A-C, and a power flow of 600 MW × 30 % = 180 MW
across the border B-C. Now generators in country B could be allocated up to 743 MW of transfer ca-
pacity from B to C, which would result in the tie-lines at the border B-C being exactly loaded at their
limit (because 743 MW × 70 % + 180 MW = 700 MW). The total import to C would then be 600 MW
+ 743 MW = 1343 MW, compared to only 1000 MW in the uncoordinated case. (Of course it is im-
portant to note that the total achievable level of import capacity under this regime depends on the ac-
tual distribution of the power sources. When the sources are distributed in the most unfavourable way,
i.e. when the imported power is completely produced in only one of the neighbouring countries, this
approach would also yield only 1000 MW of import capacity.)
With a co-ordinated regime as described above, there would no longer be any incentive for market
parties to apply a “contract path” approach when requesting transmission capacity, because it is not the
path, but rather the source and sink locations (i.e. countries or areas) of transactions being relevant for
the allocation process.
Moreover, the example shows that with the co-ordinated approach the technical restrictions of the
network could be taken into account by means of physical flow limitations (e.g. maximum power flow
through a border section) instead of NTCs (i.e. power exchange between adjacent areas). Such flow
limitations can be defined independently from commercial assumptions. This would have the advan-
tage that the bilateral NTCs used today would become less relevant, and so would the general problem
discussed in section 6.1.1 above. We therefore recommend to proceed with the discussion about such
co-ordinated allocation procedures.
Page 86
68 Analysis of Electricity Network Capacities and Identification of Congestion – Final Report, December 2001
6.1.3 Cross-border congestion management
Congestion management procedures like re-dispatch do by themselves not actually create any addi-
tional physical transmission capacity. They rather aim at compensating the excessive part of transac-
tions across a congested border by initiating counter transactions. Nevertheless, it is worthwhile con-
sidering congestion management policies in the context of maximising available transmission capac-
ity. The crucial point is that the frequency and the magnitude of countermeasures that TSOs are will-
ing to take have an influence on the level of capacity that can be made available to market players
prior to initiating countermeasures.
Quite obviously, it would not be optimal to apply no congestion management at all. This would mean
to reserve significant capacity margins for seldom cases in which all conditions (e.g. dispatch patterns,
network topology) are most unfavourable. On the other hand, it may not be optimal to offer “infinite”
transmission capacity to the market and to control the actual flows completely by congestion manage-
ment. At least in the case of permanently congested interconnections, this would imply congestion
costs that would exceed any economically reasonable level. The optimal balance will therefore usually
be somewhere between these extremes, depending on the characteristics of the specific case. Two
examples might outline in which way the physical amount of cross-border power flows could indeed
be raised if congestion management procedures exist as an option, but are not applied permanently:
• Uncertainty on source and sink locations, network topology etc. is usually considered in the ca-
pacity determination process (i.e. prior to the allocation of capacity) by means of security margins.
In the late operational planning phase, – i.e. after the allocation of capacity and nomination of
relevant exchange programmes and generation schedules – this uncertainty is significantly re-
duced. If during this phase congestion management is a feasible option to react to sporadic unfa-
vourable conditions, the related capacity margins could be permanently lowered, thus leading to
higher allocable capacities.
• If, for example, cross-border re-dispatch is implemented as a quick and reliable measure to be
applied during the operational phase, it can be considered a corrective measure and therefore jus-
tify to tolerate a higher amount of short-term overload on critical branches, thus reducing the ca-
pacity margins devoted to the (n-1) criterion23.
23 Several TSOs who tolerate short-term overload in contingency situations (cf. fig. 3.4) already consider do-
mestic re-dispatch among the list of measures to relieve overloaded network elements. Tie lines however
Page 87
Analysis of Electricity Network Capacities and Identification of Congestion – Final Report, December 2001 69
We expect that it is a difficult and time-consuming process to find the optimal trade-off for the appli-
cation of congestion management, but like the other “soft measures”, it promises to be an efficient way
to increase transmission capacity. In any case, we suppose that this process can only be successful if
market participants are closely involved, because it is ultimately them to benefit from additional
transmission capacity but, at the same time, to compensate TSOs (in whichever way) for the costs of
congestion management.
Two examples might illustrate the variety of approaches that are presently discussed: Statnett (N) and
Svenska Kraftnät (S) are investigating the option to apply counter-trading in order to compensate re-
ductions of cross-border transmission capacity caused by maintenance outages, i.e. not only as a
measure to cope with unforeseeable uncertainties. On the other hand, TenneT (NL), ELIA (B) and the
German TSOs consider cross-border re-dispatch over the Dutch border strictly as a measure to in-
crease the firmness of capacity allocation, i.e. to avoid curtailment due to “force majeure” situations.
Apart from finding the optimal trade-off, it should be noted that the practical implementation of ap-
propriate congestion management procedures implies a variety of difficult issues, like the determina-
tion of optimal countermeasures, the determination and allocation of costs related to these measures,
and measures to avoid misuse through strategic behaviour of generators. These issues are even more
complex in a cross-border transmission context, e.g. due to interference with the secondary control
systems (UCTE only). Details about the implementation of congestion management are however out-
side the scope of this study.
6.1.4 Probabilistic evaluation of operational uncertainties
An indispensable prerequisite of power system operation is that a certain level of network security
must always be maintained. This maxim is respected by all TSOs as one of the major design criteria of
their individual assessment methods for cross-border transmission capacity. Since absolute security
does not exist, the theoretically optimal security assessment criterion would be the overall risk of inse-
cure network states taken by each TSO. Risk could in this case be defined as the probability that “un-
desired” measures have to be taken in the operational phase, multiplied with the cost (or equivalent
damage) caused by such measures, e.g. re-dispatch cost, contractual penalties, or even damage due to
(and other lines close to the borders), which are often the most critical elements for cross-border transmis-
sion, can usually not be relieved as much as internal lines, so that their overload margins can probably not be
fully exploited in many cases. This problem could be overcome by means of cross-border re-dispatch.
Page 88
70 Analysis of Electricity Network Capacities and Identification of Congestion – Final Report, December 2001
supply interruptions. Unfortunately, the extreme complexity of power systems with a variety of sto-
chastic influences and relationships make it impossible to derive this risk from a single formula or
method.
Due to this complexity, the procedures for transmission capacity determination as applied today are
dominated by deterministic approaches, as we have outlined in chapter 3. This includes for example
constant assumptions on “unfavourable” weather conditions, fixed lists of contingencies to be simu-
lated, or an explicit selection of “realistic” generation and load scenarios to be investigated. Many of
the applied rules and principles are the result of long operational experience and the effort to implicitly
reflect a certain risk attitude instead of assuming worst-case conditions. However, the interdependen-
cies between many operational uncertainties are often not taken into consideration by such approaches.
Hence, when applying deterministic methods one accepts a certain level of risk, but does not know
how high it is and how it varies with time. Therefore, we expect that transmission capacity could be
increased24 by applying a more unified approach to the consideration of a variety of operational un-
certainty margins in the sense of a probabilistic risk assessment.
Among the issues that could be included in such an integrated approach to the consideration of uncer-
tainties are:
• assumptions on environmental conditions that influence power transfer limits of lines;
• the selection of investigated load and generation scenarios (see [7] for the relevance of this topic);
• tolerances regarding short-term overload of lines and transformers in contingency cases;
• the selection of failures to be considered in the security analysis; and
• all contributions to the reliability margin TRM which in itself is treated differently from TSO to
TSO as we have pointed out in section 3.2.4.
Several TSOs already cover one ore more of these stochastic influences by means of probabilistic
evaluation, e.g.
24 In the general sense, probabilistic risk assessment may also reveal some cases of high risks taken today justi-
fying a more prudent behaviour in the future. However, experience from other fields where probabilistic
methods have already started to complement or replace deterministic thinking some time ago (e.g. network
planning) shows that in the broad majority of cases actual deterministic approaches tend to be the more re-
strictive ones.
Page 89
Analysis of Electricity Network Capacities and Identification of Congestion – Final Report, December 2001 71
• RTE (F), ELIA (B) and NGC (GB) when deriving assumptions on environmental conditions used
for the determination of thermal current limits (cf. appendix D.1.3),
• REE (E) and TenneT (NL) when determining the amount of inadvertent exchange as one part of
the TRM (cf. appendix D.1.4), and
• RTE (F) when determining the probability of an internal re-dispatch in order to provide a constant
allocable capacity between France and Italy (cf. appendix D.2.9).
However, as we have mentioned above a broadly accepted method for overall risk assessment does not
exist so far. We therefore recommend
1. to more commonly and intensely apply probabilistic assessment with respect to individual aspects
of capacity determination, especially to those issues where examples of successfully implemented
procedures already exist; and
2. to intensify research on a more comprehensive, unified probabilistic assessment of operational
risk.
In section 6.2.1 below, we will indicate by examples how a probabilistic approach to cope with indi-
vidual uncertainties could look like. Those examples show that the fundamental precondition of ap-
plying such an approach is the availability of statistical data on the relevant variables of the transmis-
sion system, of generation and consumption, and of environmental conditions. To our experience, the
policies of TSOs regarding the collection and evaluation of such data are very divergent. For example,
some TSOs have archived network status data from their control centre IT systems (e.g. on an hourly
basis) for several years, whereas other TSOs only keep a small number of representative system snap-
shots that would not allow any statistical analysis.
Therefore a recommendation for a first step towards more probabilistic approaches in this respect
might be to ask TSOs to start (or continue) archiving data about system states and measurements in a
comprehensive way. We think it would also be valuable to make part of the statistical results available
to other TSOs and to the public in order to increase transparency about the relevant uncertainties. It
would for example be interesting to publish the statistical evaluations on which the determination of
TRM is based, in order to justify these values and to make them better comparable to each other.
A further necessary step – which cannot be achieved by the TSOs alone – is the agreement on stan-
dards for quality of supply (or in this case: quality of transmission services). Such standards represent
the criteria against which the results of probabilistic investigations have to be evaluated. In the last
years, the conscience about the necessity of such quantitative standards has increased, and the process
of developing them has started, but a lot of effort regarding their definition, harmonisation and actual
Page 90
72 Analysis of Electricity Network Capacities and Identification of Congestion – Final Report, December 2001
application still has to be done. Of course, a precondition of this is to find political and regulatory
agreement that a harmonisation of such standards is desired, at all, and not regarded an issue for sub-
sidiarity.
6.1.5 Transparency and harmonisation
An issue that is often raised in the context of determination and allocation of transmission capacity is
the potential benefit of additional transparency to be achieved by more comprehensive obligations of
publication for TSOs. A number of such potential obligations that would likely be beneficial for mar-
ket participants and authorities in the context of cross-border transmission capacity have already been
pointed out before, e.g. the BCE values applied for the determination of NTCs, more details about the
methods of capacity determination, the underlying definitions and relevant statistical evaluations, and
retrospective evaluations of the actual utilisation of available capacity.
It has also been mentioned before that on the one hand a strict harmonisation of TSOs’ capacity de-
termination procedures by means of levelling individual parameters should be avoided (cf. section
3.4). On the other hand completely comprehensive rules and criteria for a “benchmarking” of differ-
ences between the individual procedures do not exist, so that a formal regulation of all relevant details
of capacity determination would probably not yield the desired effect. In this context the above-
mentioned kind of publications could, although not directly leading to increased amounts of cross-
border transmission capacity, motivate TSOs to come up with reasonable justifications in case of ob-
viously different approaches. As a consequence, arbitrary or unplausible solutions might at least partly
be avoided or modified. (In the course of executing this study we have in fact experienced in many
discussions that the transparency created by the study itself already promotes such incentives. The
suggested intensified publications could probably steady such developments.)
We have been informed by ETSO members that a new paper on guidelines for cross-border transmis-
sion capacity assessment will soon be finalised and published by ETSO. From a draft version [13] we
could see that the paper is partly in line with our above considerations. It describes many aspects and
options of the assessment procedures in more detail than previous publications, but without forcing
harmonisation. Instead, it aims at achieving full transparency among the TSOs about all relevant de-
tails of capacity assessment, including the differences between the individual solutions. Compared to
the present situation, this declaration of intent can therefore be a significant step forward provided the
proposals are actually adopted by all TSOs. However, transparency towards non-TSO organisations is
not covered by the paper and thus remains an open issue.
Page 91
Analysis of Electricity Network Capacities and Identification of Congestion – Final Report, December 2001 73
There is other information that would clearly be interesting for market participants and valuable for
the interpretation of network-related events, but would at least not directly contribute to the improve-
ment of available capacity, like better information on short-term allocable capacity, and information
on reasons for short-term reductions of available capacity (see also [7]).
Another important aspect is the quality and topicality of publications. An example of this is the list of
cross-border interconnections given in the statistical yearbook of UCTE [4] on which we had based a
number of presentations in the interim report of this study. In the meantime, we have been indicated
by several TSOs that the information in the yearbook is partly incorrect or inaccurate. We think that
such inconsistencies can easily lead to confusion for the market participants and should as far as pos-
sible be avoided.
In general, we have gained the impression that the exchange of information between TSOs about op-
erational conditions of each other’s networks could partly be improved. We have for example been
reported cases where up-to-date information about the switching status of substations located in
neighbouring systems close to the border would be valuable to optimise operation of the own system
and thus to increase available transmission capacity. TSOs have however not given us detailed infor-
mation on such cases to be further analysed.
Another question related to transparency is the benefit of obliging TSOs to publish more about gen-
eration and load forecasts and the extension plans of their networks. We think that such publications
are clearly valuable for the communication between TSOs, regulators and market participants, and for
gathering a feedback on the TSOs’ expectations from other parties. Such publications however do not
contribute themselves to the improvement of available capacity. Therefore we have not discussed de-
tailed requirements to such publications within this study.
6.2 Extension of operational limits
Theoretically, an extension of operational limits will always increase risk and decrease the quality of
supply. However, a divergence of reliability levels, e.g. between different TSOs or between different
points of time, can justify to analyse the applicability of such measures in order to exploit the inherent
potentials of these differences.
6.2.1 Assumptions on environmental conditions
We have emphasised in section 3.2.3 that the definition of assumptions on environmental conditions
like temperature and wind speed has a significant influence on the resulting power transfer limits of
Page 92
74 Analysis of Electricity Network Capacities and Identification of Congestion – Final Report, December 2001
overhead lines, which are in many cases the limiting factors of cross-border transmission capacity. Our
analysis has shown that not only the values assumed for these parameters, but also the degree of dif-
ferentiation e.g. into seasonal values vary considerably from TSO to TSO. A simple harmonisation of
structures and/or values of these parameters will however not be feasible because the environmental
conditions obviously differ from country to country and even within a country. Therefore, rather than
identifying “best practice” parameters, we try to demonstrate probabilistic approaches that could be
applied to determine values for these parameters that lead to a uniform risk level, where risk means the
probability that the conductor temperature of a line exceeds its allowed limit.
It is important to recognise that the increase of the rating of lines does not necessarily lead to an in-
crease of the transmission capacity values by the same percentage. Depending on the critical factors
limiting a transmission capacity, the latter can remain unchanged when line ratings increase, but it can
also increase more than proportionately. This issue will be discussed along with the investigation of
concrete bottlenecks in chapter 8.
Ambient temperature
The relation between the power transfer rating of an overhead line and the assumed ambient tempera-
ture can be derived from physical models. For typical cases, there is a practically linear relation yield-
ing a notable increase of the line rating of around 5 % for each 5 °C of temperature decrease. This
raises the question to which extent this increase could be utilised in the framework of transmission
capacity determination. In principle, this could be done either
• based on statistics, taking into account regular temperature differences between seasons or day
hours, or
• based on forecasts, taking into account the good short-term predictability of temperature.
Probabilistic approach based on temperature statistics
Starting from a situation where a constant temperature assumption is applied throughout the year, a
possible probabilistic approach could look as follows:
1. The present temperature assumption (e.g. 35 °C) is usually a rather high value, but nevertheless
will be exceeded from time to time during hot summer months. This means that a certain prob-
ability of excessive temperature is implicitly accepted today. Using statistical data, this probability
can be quantified.
Page 93
Analysis of Electricity Network Capacities and Identification of Congestion – Final Report, December 2001 75
2. It seems consequent that the accepted probability of excessive temperature in July or August could
also be accepted during the rest of the year. Based on temperature statistics for the other months,
individual monthly temperature assumptions can be found that lead to this constant probability.
This approach is described in more detail in appendix G.1 along with a numerical example based on
exemplary weather data from the area of Aachen, Germany. This rough investigation shows that the
assumed ambient temperature could possibly be decreased by at least 15 °C in winter. Similar prob-
abilistic investigations have been done for the temperature difference between day and night, showing
at least for a summer month a significant difference of about 6 °C.
Obviously these results cannot be directly transferred to other locations in Europe. It may also turn out
that the temperature spread between summer and winter or day and night is not sufficient at some lo-
cations to justify a differentiation of line ratings. We recommend to perform similar statistical investi-
gations for a representative number of locations throughout Europe, and we assume that the required
weather data could be made available. In fact, some TSOs have already done such (e.g. RTE (F),
ELIA (B) and NGC (GB)) or similar (e.g. REE (E)) investigations on at least seasonal variations and
indeed apply differentiated line ratings based on their findings. All these TSOs divide the year into
four or five seasons, although their statistical analyses have mostly been carried out with a higher time
resolution. There seems to be a common cognition that a monthly variation would not yield signifi-
cantly more potential whereas a mere summer/winter differentiation would lead to unnecessarily high
temperature assumptions during winter and mid-seasons. (Although being only exemplary, our own
investigations also confirm this relation.)
A common discussion still seems to be necessary on the accepted level of probability of excessive
temperatures. In this respect, among the TSOs mentioned above probabilities between 3 % and 12 %
are accepted under post-fault conditions. As a further support to this discussion, statistical investiga-
tions can also be used to quantify the influence of the selected probability threshold on the resulting
assumptions for ambient temperatures. An example of this is given in appendix G.2.
Use of temperature forecasts
The fact that ambient temperatures are predictable with good accuracy in the short term (i.e. one to
few days) can be used as an alternative to statistical models when determining transmission capacity
for day-ahead allocation, for example. Depending on the individual conditions this may result in ther-
mal current ratings being more fluctuating than those based on statistics. In order to deal with the inac-
curacy of the temperature forecast, one could either
Page 94
76 Analysis of Electricity Network Capacities and Identification of Congestion – Final Report, December 2001
• apply an uncertainty margin, i.e. an offset of a few °C to be added to the forecast; this offset could
be derived from a probabilistic evaluation of the forecast error, thereby controlling the risk of ac-
tually “excessive” temperatures similarly to the statistical approach described above; or
• rely on operational countermeasures, e.g. re-dispatch; this solution has been chosen by Statnett (N)
and Svenska Kraftnät (S) who actually derive thermal current limits for day-ahead capacities from
forecasted temperatures.
Conclusions on assumptions regarding ambient temperature
The analysis has shown that there exist two concepts for a consideration of variable ambient tempera-
tures: statistical evaluation and temperature forecast. Both of these can be combined with probabilistic
approaches to achieve a quantitative risk evaluation. Moreover, examples of actually applied solutions
as well as our own exemplary statistical investigation indicate the potential for a significant increase of
thermal current limits throughout several months of the year.
From some TSOs we have heard the objection that the practical implementation of seasonal or day-
time variations of line ratings would raise problems e.g. with their control centre IT systems, with the
settings of protection devices, or with technical limitations other than conductor temperature. (These
objections are discussed in more detail when analysing individual border cases in chapter 8.) On the
other hand, the majority of TSOs already apply some kind of differentiation of ambient temperatures
to increase transmission capacity (cf. section 3.2.3). We cannot give a final evaluation of the addi-
tional effort required to solve such practical problems, but we recommend not to reject the whole idea
before comparing the additional effort with the potential economic gain for market participants, which
can be very considerable (see section 5.3).
Wind conditions
Similar to the ambient temperature, also the relation between the power transfer rating of an overhead
line and the assumed wind speed and direction can be derived from physical models. Starting from
typical basic conditions of a wind direction perpendicular to the conductor axis (a “ best case” which
is however assumed by most industry standards) and typical wind speed values of 0.5 or 0.6 m/s, this
relation yields a notable thermal rating increase of about 10 % for a wind speed increase of 0.5 m/s.
For higher wind speed, the relation however becomes less favourable.
The weather data received from the station Sinzenich also allowed us to analyse the statistics of wind
speed. As a general result, it can be stated that the typical assumptions regarding wind speed and di-
rection are not at all worst case assumptions. This means that a certain probability of the conditions
Page 95
Analysis of Electricity Network Capacities and Identification of Congestion – Final Report, December 2001 77
being worse is implicitly accepted, same as in the case of the ambient temperature. In principle, simi-
lar considerations as discussed in the previous section can therefore be made for the assumed wind
conditions, too.
Regarding the average wind speed, the results of our investigations do not seem to justify a seasonal
differentiation of the respective assumptions, but differences between day and night can be found at
least in summer. However, the geographical location is usually much more significant for the average
wind speed than the time of day or year [11]. In addition, the high short-term variability of wind speed
must be taken into account to reflect that conductors might get overheated after a certain duration of
calm.
Moreover, the cooling effect of wind is highly dependent on the angle between wind speed and con-
ductor. Therefore, the potential to increase current limits by considering statistical properties of wind
conditions is restricted to individual straight routed lines at locations of relatively constant wind direc-
tion and high average wind speed.
Nevertheless, a combined analysis of the probability distributions of ambient temperature and wind
speed can be valuable to determine the probability that both parameters exceed the given thresholds at
the same time. (This technique is, for example, applied by RTE (F) and NGC (GB).)
6.2.2 Temporary overload and corrective measures
We have pointed out in section 3.2.3 that several TSOs tolerate a certain percentage of post-fault
overload on overhead lines and/or transformers when determining cross-border transmission capacity.
Since post-fault situations are practically always those which actually limit the power transfer, this
tolerance has the same effect on the resulting capacity as an increase of normal operating limits by the
same amount25. However, overload is usually only accepted when it can be relieved by the TSO
through corrective measures. Referring to this prerequisite, the main argument against the application
of overload tolerances is that the availability of corrective measures is difficult to assess for each rele-
vant contingency and might not be constantly guaranteed (e.g. because it depends on the operation of
certain generators needed for re-dispatch).
25 Experience from our load flow based investigations (cf. appendix H) indicates that this is at least valid for the
usually tolerated amounts of post-fault overload of about 10-20 %. Only when this threshold is increased
much further, pre-fault limits may become the most critical ones.
Page 96
78 Analysis of Electricity Network Capacities and Identification of Congestion – Final Report, December 2001
Most TSOs who do tolerate post-fault overload indeed specify an upper limit (being derived e.g. from
considerations on equipment damage) which is subject to reduction if in the individual case only a
smaller amount of overload can be relieved. We have no information how much overload could actu-
ally be tolerated in the critical situations limiting the transmission capacity. While it could be valuable
to ask TSOs to provide such information (e.g. as a matter of transparency or to support a discussion on
extended corrective measures like cross-border re-dispatch), we have no reason to believe that those
TSOs considering post-fault overload do not benefit from it in terms of increased transmission capac-
ity. Similar to the consideration of variable ambient temperature (see above), we therefore recommend
to not generally reject the idea, but progressively investigate its potential as one further “soft meas-
ure”.
6.2.3 Neglecting rare failures
We have outlined in section 6.1.4 that an envisaged probabilistic approach towards the consideration
of operational uncertainties should comprise the selection of failures to be considered in the security
assessment criterion according to their associated risk, i.e. their frequency and the severity of their
consequences. So far, such considerations are rather implicitly taken into account in the selection of
considered failures (cf. section 3.2.2). Consequently, we can only draw qualitative conclusions from
the observed differences between the individual TSOs’ approaches.
Regarding bus bar failures, these are usually only taken into consideration when their potential con-
sequence is a loss of stability, i.e. a certainly very severe impact which might result in an uncontrolla-
ble blackout. This is the case for the NORDEL TSOs. In the case of TenneT (NL) who also include
such failures in their calculations, these failures are not the critical factor which actually limits cross-
border transmission capacity. Consequently, we do not see a potential for an increase of transmission
capacity by less strict consideration of this failure type.
Some TSOs – RTE (F), Verbund APG (A), GRTN (I), German and Swiss TSOs and possibly Eltra
(DK) – consider generator outages by including a margin for the resulting cross-border transports of
reserve power in the TRM26 (e.g. according to reserve contracts). Since TRM is directly subtracted
from the total transfer capacity TTC, the inclusion in the TRM implies the simultaneous occurrences
of a generator outage and a failure of the network element which has the limiting effect on TTC.
26 Stricly speaking, Eltra consider no TRM; i.e. however that uncertainties are implicitly included in the TTC.
Page 97
Analysis of Electricity Network Capacities and Identification of Congestion – Final Report, December 2001 79
Therefore, this procedure constitutes a de-facto (n-2) criterion whose necessity is to be generally
questioned. We can however on most borders not quantitatively evaluate the benefit of dropping this
criterion because of the general lack of transparency regarding the TRM assessment (cf. section 3.2.4).
The consideration of a simultaneous double circuit outage (i.e., another (n-2) criterion) is in one case
– the French-Italian tie line Albertville-Rondissone – actually limiting the cross-border transmission
capacity. This failure might – if not taken into account in security analysis – lead to severe conse-
quences in the form of load shedding in Italy due to the subsequent tripping of all tie lines. The reason
for taking it into account was a severe disturbance of that kind in 1989. However, a number of argu-
ments justify to re-discuss the criterion:
• As a consequence of the 1989 disturbance, automatic devices have been installed which quickly
reclose the circuits after tripping due to lightning. Although double tripping occurs three to five
times a year, there has so far only been one case where only one circuit could be reclosed. Due to
the automatic devices, no permanent double failure has occurred since 1989 according to RTE
(F)27. Statistics provided by GRTN indicate however four “permanent double outages” since 1990.
(On the other hand, the (n-2) criterion may indirectly help to protect adjacent borders as has been
experienced in the case of a Swiss-Italian tie line failure in 2000.)
• Load shedding can be assigned selectively to individual loads. This means that it could at least
partly be performed by switching off large industrial customers who have agreed on this procedure
realising its rare application in conjunction with the permanent economical benefit of lower elec-
tricity prices. We have been told by a large consumer that they would indeed accept such proce-
dures.
• GRTN are responsible for the security of supply in Italy. Since there exist no specific legal regu-
lations regarding the security criteria, GRTN tend to be prudent in order to avoid liability conse-
quences. Therefore, even if technical considerations suggested that the (n-2) criterion could be
dropped, a political initiative would additionally be needed in order to legally protect GRTN, e.g.
by confirming that a certain residual risk of load shedding is considered acceptable.
27 Moreover, we have been informed that it should even be possible to practically completely avoid double
tripping due to lightning by designing the isolation so that one circuit “attracts” the lightning when it hits the
tower.
Page 98
80 Analysis of Electricity Network Capacities and Identification of Congestion – Final Report, December 2001
We cannot give a final judgement here regarding the acceptability of dropping the (n-2) criterion on
the French-Italian tie line. However, we believe that this “soft measure” is at least worth considering.
As an additional contribution to this topic, we have therefore assessed its impact on the Italian import
capacity, which will be further discussed in section 8.3 in the context of alternative measures to in-
crease capacity at this border.
6.3 Costs of soft measures
Although the so-called soft measures require no investment in network equipment, they are not for
free. Two types of costs can be distinguished:
• The implementation of a soft measure might require feasibility and parameterisation studies (e.g.
to determine adequate figures for seasonally variable thermal currents), modifications of IT sys-
tems or of operational procedures etc. While it is not possible to determine the costs of specific
measures within this study, we believe that in general, such “organisational costs” are relatively
low and can be neglected.
• After increasing the transmission capacity by means of a soft measure, the market players will try
to benefit from this and utilise the new capacity. This leads to a higher loading of network ele-
ments and therefore increases the level of losses. We consider the associated loss costs an indirect
consequence of the respective soft measure that needs to be taken into account when comparing it
to reinforcement projects (which cause similar effects). For the border-wise considerations (chap-
ter 8) the loss costs of soft measures have therefore been estimated equally to those of reinforce-
ment measures, following the method described in section 7.2.
6.4 Legal issues
Throughout our study, our investigations and recommendations have mainly been based on technical
and occasionally also regulatory aspects. However, several TSOs have also indicated legal issues that
can be obstacles to the implementation of approaches that are already applied in other countries or that
are suggested on the basis of our results. Examples of such regulations in laws or binding standards are
• definitions on the maximum conductor temperatures and the minimum clearance to ground as well
as assumptions on environmental parameters to be taken into account in the line ratings, and
• specific technical requirements (i.e. regarding redundancy or diversity) to be taken into account in
the design and dimensioning of network equipment.
Page 99
Analysis of Electricity Network Capacities and Identification of Congestion – Final Report, December 2001 81
The more binding such deterministic requirements are, the less opportunities will TSOs have to apply
probabilistic approaches as we have suggested. In this document we give examples of some legal is-
sues indicated to us by the TSOs (cf. e.g. sections 6.2.3, 8.5.1, and 8.5.2); we can however not give a
complete overview of the relevant legal requirements and appropriate steps towards harmonisation.
Only the TSOs themselves will be in a position to point out the relevant regulations when they are
confronted with the approaches that are investigated in this study.
6.5 Conclusions
In this chapter we have presented a variety of “soft measures” that could help increasing the cross-
border transmission capacities without physical reinforcements. Among these, co-ordinated capacity
allocation, cross-border congestion management and probabilistic assessment of operational risk are of
a fundamental, conceptual nature. Therefore, a concrete realisation will need further discussion, re-
search analysis and at least partly the additional engagement of regulators or other authorities. In some
aspects (e.g. cross-border re-dispatch, probabilistic uncertainty evaluation) a number of TSOs have
already gathered experience which could be used as a starting point for further development. We rec-
ommend to encourage such development although – or maybe even because – it is not possible to
quantify the potential benefit of such general measures in terms of capacity or economic welfare at
present.
There are other measures – especially some ways in which the transparency of capacity determination
could be increased – which could be implemented immediately; yet, their effect on the amounts of
cross-border capacity is a rather indirect one.
The third group of soft measures is related to the extension of operational limits. Here, we can con-
clude that especially the consideration of the variability of ambient temperature and the acceptance of
short-term overload in contingency situations deserve further analysis. In the specific case of the
French-Italian border, the abolishment of the (n-2) criterion should also be taken into consideration.
Technically, this group of measures can be implemented by merely modifying parameters of the ex-
isting capacity assessment procedures. Therefore, the achievable magnitude of transmission capacity
gain can be roughly estimated for each individual case, e.g. by means of load flow calculations. The
results of such analyses are presented in the context of the border-wise considerations in chapter 8,
thereby respecting for each border that some of the adjacent TSOs might already have implemented
some of these measures.
Page 100
82 Analysis of Electricity Network Capacities and Identification of Congestion – Final Report, December 2001
7 General considerations on network reinforcement measures
In this chapter we discuss possibilities to increase cross-border transmission capacity by means of
reinforcement measures. These are measures which – in contrast to the “soft measures” investigated in
the previous chapter – constitute an investment in new or upgraded network equipment.
Section 7.1 gives an overview on possible kinds of reinforcement measures and their applicability for
the different critical factors which limit cross-border capacity in Europe. In section 7.2 we describe the
economic assessment model that we have used for an evaluation of alternative measures. General con-
siderations on the feasibility of reinforcements are presented in section 7.3, and section 7.4 describes
in which way we have used the list of TEN projects of common interest as a basis for the analysis of
possible measures to relieve the critical bottlenecks.
Due to the large number of case-specific influences, a comprehensive evaluation of reinforcement
measures cannot be done in a general way. A comparative assessment of reinforcements is therefore
provided in the course of the border-wise considerations in chapter 8.
7.1 Overview on possible reinforcement measures
Generally, the following options for network reinforcement appear worth considering, distinguished
according to the type of technical limit that actually determines the maximum capacity of the inter-
connection under investigation:
• As far as thermal current limits constitute the critical factor, reinforcement measures (other than
the construction of new lines; see below) can either be taken to increase current limits of individ-
ual lines or to optimise the distribution of load flows such as to decrease loading of the most criti-
cal network branches. Depending on the prevailing conditions, the transmission capacity of a line
may be increasable by
o shortening insulators,
o increasing the tensile stress of conductors,
o heightening towers,
o exchanging under-dimensioned substation equipment (e.g. disconnectors or measuring trans-
formers), or
o installing conductors with higher loadability.
Usually, one of the first three options is taken into consideration to exploit the full thermal poten-
tial of the existing conductors. The ratings of substation equipment have not been reported a criti-
Page 101
Analysis of Electricity Network Capacities and Identification of Congestion – Final Report, December 2001 83
cal factor for cross-border transmission capacity at present. When they become critical after a rein-
forcement, their exchange is often considered a natural necessity involving relatively low costs
and effort. In contrast to this, the effort of installing new conductors can imply the complete re-
construction of the line.
The following types of network equipment can potentially be applied to influence the distribution
of load flows:
o phase shifting transformers to control active and reactive power flows,
o series capacitors or series reactors to adjust the impedances of network branches, and
o FACTS elements (including DC links) to control voltage, active or reactive power flows very
quickly using power electronics. (Due to their high costs, FACTS elements are normally only
applied in case of extraordinary requirements to dynamic behaviour, or if several types of lim-
its become relevant simultaneously.)
From our discussions with TSOs we understand that phase shifting transformers are usually the
preferred option among these. While series capacitors or series reactors can be operated less flexi-
bly, the extreme flexibility of FACTS elements is not deemed necessary, so that they are too ex-
pensive.
Therefore, only phase shifting transformers are further taken into consideration as measures to in-
fluence the distribution of load flows.
• In case voltage limits or voltage stability are the determining factor for transmission capacity,
additional sources of reactive power like shunt capacitors or reactors or FACTS elements can be
installed at critical locations to smoothen the steady-state voltage profile and to increase reserves
against the loss of voltage stability.
• To overcome limitations caused by problems to maintain static stability, devices like series ca-
pacitors or FACTS elements can be taken into consideration to lower line impedances or improve
damping of power oscillations.
• Apart from the above options, the construction of new lines or the installation of new transformers
can be adequate measures to increase transmission capacity in either of the aforementioned cate-
gories of limitations.
As mentioned earlier, a case independent evaluation of the general applicability of reinforcement
measures is not possible, since the effort and benefit of implementing such measures depends on the
individual network topology, the load and generation distribution, the critical factor (or factors) for
transmission capacity, case-specific economic and feasibility aspects etc. This is in line with the ob-
Page 102
84 Analysis of Electricity Network Capacities and Identification of Congestion – Final Report, December 2001
servation that practically every kind of measure in the above list has been or is taken into considera-
tion by at least one of the TSOs to increase cross-border transmission capacity. Consequently, we have
evaluated only individual reinforcement measures in the course of the border-wise investigations
which are presented in chapter 8. As a preparation of this evaluation, the basis for our economic as-
sessment as well as general remarks on feasibility of reinforcements are provided in the following
sections.
7.2 Economic assessment
7.2.1 Cost determination
Our economic assessment of measures to increase cross-border transmission capacity is based on the
consideration of the associated costs as well as the resulting benefit. As regards costs, three contribu-
tions are taken into account:
• investment costs,
• maintenance costs, and
• costs of losses.
It is important to note that the economic assessment basically focuses on facilitating a comparison of
the costs of alternative measures to increase transmission capacity. Therefore we have applied a uni-
form cost model for all investigated measures. Information on the assumed investment and mainte-
nance costs is given in appendix H. The other relevant figures of the cost model are included in the
following subsections.
Investment costs
In order to make the investment costs of reinforcement measures comparable to each other as well as
to other economic quantities presented in this report, our assessment is based on annuities. This means
that the investment costs ic have to be transformed into annual investment costs ic� by dividing them
by the present value factor β :
a1twitht
cc 0
0
ii =
⋅β=�
To calculate the present value factor the interest rate i and the depreciation period of network elements
t are needed:
Page 103
Analysis of Electricity Network Capacities and Identification of Congestion – Final Report, December 2001 85
( )a1t,1iqwith
1qq
1q0
t
t
t
t
0
0
=+=
−⋅
−=β
In principle, the interest rate is based on that of capital investments with low risk, and the depreciation
period represents the expected duration of usage. Both of these quantities are subject to an individual
estimation of TSOs (and maybe regulators), taking account of the actual risk estimation, the financial
background, technical characteristics of the equipment applied, etc. To get a realistic overview on the
interest rates and the depreciation periods actually used by TSOs, related questions were included in
our second questionnaire (cf. appendix K). While several TSOs refused to disclose these data referring
to confidentiality matters, three TSOs provided detailed figures which are shown in table 7.1. In the
rightmost column, the values used for our economic assessments are shown. To avoid an underestima-
tion of the costs of reinforcement projects, we have decided to choose those values that lead to the
lowest present value factor.
ELIA Statnett Svenska Kraftnät this report
interest rate I 8.6% 7% 8.5% 8.6%
depreciation period tsubstations/transformerslines
25a40a
50a70a
30a40a
25a
present value factor βsubstations/transformerslines
10.111.2
13.814.2
10.711.3
10.1
Table 7.1: Interest rates and depreciation periods used by some TSOs and assumptions used for
economic assessment in this report
Maintenance costs
A common practice in network planning studies is to estimate the maintenance costs of a network
element by a fixed percentage of the investment costs. This percentage is often referred to as the
maintenance cost factor. It may vary for lines, transformers and substation equipment.
Costs of losses
The implementation of a measure to increase cross-border transmission capacity influences the trans-
mission losses of the interconnected system. Two different contributions can be distinguished:
Page 104
86 Analysis of Electricity Network Capacities and Identification of Congestion – Final Report, December 2001
• By installing a new network element, new transmission capacity is made available. The present
load flow is changed even if the market does not react to this new capacity. (For example, a new
transmission line could lead to a more equalised load flow distribution, thereby decreasing the to-
tal amount of losses.) The associated losses are in the following referred to as “incremental capac-
ity provision losses”. For soft measures, these incremental losses are zero.
• After provision of new capacity, the generation dispatch on both sides of the border might change
as the capacity is utilised. Again the load flow and the loss level will change. The difference be-
tween losses in the resulting status and losses before implementation of the measure will in the
following be referred to as “incremental capacity utilisation losses”.
To determine the loss costs, the level of losses must be obtained from load flow calculations. There-
fore, we could calculate loss costs only for those three critical borders which are contained in the load
flow data that has been provided to us by ETSO (cf. appendix I.1). Furthermore, our calculations have
been restricted to a single peak load situation for reasons regarding data availability and time con-
straints. To reflect the variability of network loading and losses, the peak-load losses have been multi-
plied with an “equivalent utilisation period” of 5000 hours per year. Owing to the fact that this is a
rough estimate, we have restricted statements regarding a ranking of different measures to those cases
where a variation of this figure indicated no change of the ranking order.
It is very complex to predict to which extent additional transmission capacity will by used, because
this depends on the generation mix on both sides of the bottleneck, the market and congestion man-
agement rules etc. We have therefore decided to calculate an upper bound of the “incremental capacity
utilisation losses” by assuming a full utilisation of any new transmission capacity, i.e. by applying the
same equivalent utilisation period as for the base case.
Finally, the losses (in MWh/year) have to be multiplied with a per-unit cost figure in order to obtain
the associated costs (in Euro/a). Regarding per-unit costs of losses, we have again been able to use
information from three TSOs (cf. table 7.2). For our investigations, the mean value of these figures has
been used.
ELIA Statnett Svenska Kraftnät this study
per-unit costs of losses 37 Euro/MWh 25 Euro/MWh 44.5 Euro/MWh 30 Euro/MWh
Table 7.2: Per-unit costs of losses applied by some TSOs and assumption used for economic assess-
ment in this report
Page 105
Analysis of Electricity Network Capacities and Identification of Congestion – Final Report, December 2001 87
7.2.2 Evaluation criteria
For a comparison of individual measures to increase transmission capacity, we relate the costs of a
measure to its benefit in terms of additional capacity. Parallel to the distinction of two different types
of loss costs (see above), two different cost/benefit ratios can be determined:
• The “provision cost/benefit ratio” describes the marginal costs (i.e. costs per added MW of capac-
ity) of implementing the measure, i.e. of providing additional capacity without regarding its utili-
sation.
• The “utilisation cost/benefit ratio” constitutes an upper estimation of the marginal costs that would
accrue if the additional capacity of the measure would be fully utilised.
We have calculated both ratios for all reinforcement and soft measures that have been analysed for the
critical bottlenecks in chapter 8. These calculations have been based on the figures stated in the pre-
ceding subsections as well as on investment cost assumptions (cf. appendix H) which we have ob-
tained from discussions with network equipment manufacturers and from network planning studies
that we have carried out for numerous TSOs.
Although these calculations reach a considerable level of detail, we have already mentioned a number
of aspects which limit their accuracy. To avoid a misinterpretation of the results, we have not used
them to rank individual measures, but rather tried to detect groups of measures which have similar
cost/benefit ratios. The threshold for the formation of groups has been adjusted in the individual case,
e.g. to reflect particular uncertainties about the cost or benefit estimates at a certain border. To summa-
rise, this means that only significant differences between the cost/benefit ratios of individual
measures have been used as an evaluation criterion.
A comparison of the “provision cost/benefit ratio” and the “utilisation cost/benefit ratio” for all proj-
ects has shown that these criteria do – with one exception – not lead to different conclusions regarding
the ranking of measures according to the above procedure. Therefore, only the “utilisation cost/benefit
ratio” – being the higher value – is indicated in the following and referred to as “cost/benefit ratio” for
simplicity.
7.3 Feasibility issues
It should be noted that the decision to implement a reinforcement measure cannot be taken by a TSO
alone. Besides any technical and economical considerations, the question if a reinforcement measure is
granted authorisation can be a crucial aspect. In general, measures that concentrate on a specific loca-
tion – e.g. installation of a transformer – face only little authorisation problems. In contrast, the
Page 106
88 Analysis of Electricity Network Capacities and Identification of Congestion – Final Report, December 2001
authorisation procedures to obtain rights of way for new lines can be very long and their outcome is
often uncertain. Also a heightening of towers might be impeded by authorisation difficulties which in
some countries are reported to come close to those of new lines. From our discussions with TSOs we
have the impression that the influence of authorisation procedures on the selection of measures differs
notably between countries.
Authorisation difficulties are, unless a project is definitely cancelled, no objective evaluation criterion.
Nevertheless, we refer to such aspects during the analysis of individual reinforcement measures in
chapter 8, because they may provide an explanation for the consideration of alternative measures at the
same border.
7.4 TEN projects of common interest
Today more than 50 projects in the electricity supply sector in Europe are supported by the Trans-
European Networks (TEN) programme. It has been one of the tasks of this study to review this list, i.e.
to identify those projects that are most likely suited to significantly reduce congestion at the most criti-
cal European borders. As a first step, we have reduced the complete list of projects supported by the
TEN programme to those projects
• that are roughly related to one of the critical bottlenecks as identified in chapter 4 and
• that have not yet been completed.
This reduced list has been discussed with the TSOs concerned. These discussions have shown that
some of the projects
• do not directly increase the transmission capacity on the critical borders (and, if applicable, in the
critical direction) or
• had already been replaced by alternative projects which aim at the same purpose.
The remaining projects have been analysed in detail along with other projects that are not supported by
the TEN programme. The results of this analysis can be found in chapter 8; in the lists of investigated
measures, TEN projects are marked.
Page 107
Analysis of Electricity Network Capacities and Identification of Congestion – Final Report, December 2001 89
8 Evaluation of measures to increase individual cross-border capacities
8.1 Overview
In this chapter, measures to increase cross-border transmission capacity are discussed and evaluated
for each of the five borders that have been identified as the most critical ones in chapter 4:
• From the list of soft measures we have, wherever applicable, regarded those which can be as-
sessed in a case-specific way, i.e. the increase of thermal current ratings for normal operation (e.g.
due to consideration of lower temperature in winter) or for contingency situations (i.e. due to tol-
erating short-term overload), the exclusion of reserve power transport from TRM and the abolish-
ment of the (n-2) criterion at the French-Italian border. (For the other, more conceptual soft meas-
ures, general conclusions have already been drawn in chapter 6; in the following sections, they are
only mentioned when considered especially applicable.)
• For each border, we have selected reinforcement measures based on the list of TEN projects of
common interest, on information received from the TSOs, and on our own considerations.
Our evaluation of alternative measures is mainly based on their benefit in terms of additional cross-
border transmission capacity and, especially for the reinforcement projects, on rough cost estimations.
Moreover, feasibility and authorisation situation have been taken into account.
8.2 Significance of load flow based investigations as evaluation criterion
For three of the critical borders we have been able to perform technical analyses by means of load
flow simulations based on data provided by ETSO. These investigations have been used to roughly
quantify the additional transmission capacity yielded by each measure as well as the additional oper-
ating costs in terms of losses. They are described in detail in appendix H, including for each measure
an analysis of its impact on the regional load flow situation which can be useful to understand the rea-
sons for different capacity gains of the individual measures. Further quantitative information on the
benefit of measures has partly been provided by the TSOs.
It must be emphasised that the significance of our load flow simulations must not be overestimated.
Due to the tight time frame of the investigations, all assessments had to be based on one single base
case load flow situation, namely the common UCTE peak load forecast for January 2001. Also the
modelling of individual TSO-specific details of the capacity determination procedures had to be sim-
plified, although such details may have a considerable effect on the resulting capacity. Consequently,
we strictly dissuade from interpreting the additional capacity figures that have been obtained
Page 108
90 Analysis of Electricity Network Capacities and Identification of Congestion – Final Report, December 2001
from these investigations as certainly achievable gains of allocable capacity. Since we have only
determined incremental capacities (i.e. a relative assessment without recalculating the absolute NTCs
for base case conditions), we are however confident that these figures can be used to roughly
compare the benefit of different measures. In order to respect the undoubted inaccuracies, we have
drawn conclusions only from clearly visible differences. Nevertheless, such conclusions may still be
misleading in some cases. The clarification of such issues must be left to further discussion.
8.3 France/Switzerland/Austria(/Slovenia) → Italy
The present network and congestion situation at these borders is described in appendix E.10. The
benefit evaluation of the investigated measures is partly based on load flow simulations. For two rea-
sons, these investigations for this bottleneck may lack a certain degree of completeness:
• Due to the nature of the specific base case load flow situation that we have received from ETSO
and the very limited time frame for our investigations, we had to restrict the analysis of measures
at the western border section to their effect on the transmission capacity from France to Italy.
Taking into account the differences in generation costs (cf. section 5.3), we consider this direction
of incremental power transfer a reasonable assumption. On the other hand, it may not reveal the
full potential of some measures to increase capacity from different directions, e.g. Switzerland.
This fact will however be taken into account in our evaluation.
• According to statements from many TSOs, the Slovenian transmission grid and its interconnec-
tions to Austria and Italy have a great relevance for the assessment of congestion at the eastern
section of the Italian border. Slovenia is however outside the scope of this study. Consequently,
our analysis in this region is restricted to the Austrian-Italian border.
Further information on the technical analyses as well as the above restrictions can be found in appen-
dix I.3.2.
8.3.1 Soft measures
As we have pointed out in section 3.2.2, the double circuit tie line from Albertville (F) to Rondissone
(I) is the only case in Europe where the explicit application of an (n-2) criterion limits the cross-border
transmission capacity.
• According to our simulations, the abolishment of the (n-2) criterion for the Albertville-
Rondissone tie line might yield a transmission capacity gain of 900 MW. Further import would
then be limited by congestion in the Italian 220 kV grid. We have already discussed the pros and
cons of this measure as well as the prerequisites for its implementation in section 6.2.3.
Page 109
Analysis of Electricity Network Capacities and Identification of Congestion – Final Report, December 2001 91
Regarding operational limits of overhead lines, RTE (F), GRTN (I) and the Swiss TSOs consider vari-
able ambient temperatures as well as short-term overloading after failures. In Italy, the former is how-
ever only true for the tie lines, while internal lines have a constant thermal rating throughout the year.
Also Verbund APG (A) apply constant assumptions on environmental conditions.
• According to statements from the TSOs, internal bottlenecks in the Italian grid are often the reason
for congestion. In our simulations this could be confirmed, at least if the (n-1) criterion is applied
for the Albertville-Rondissone tie line (see above). An increase of thermal current limits of in-
ternal Italian lines by 5 %28 in cold seasons could then yield additional 200 MW of transmission
capacity.
The implementation of this measure seems to be delayed by formal reasons as a consequence of
the separation of responsibilities between GRTN and the network owners (cf. section 3.2.1). While
TERNA, the largest network owner, have told us that they have provided differentiated summer
and winter limits, GRTN claim that they at least have no officially usable data, because the neces-
sary agreement (“convenzione tipo”) has not been signed yet.
• Regarding the transmission capacity from Austria to Italy, our load flow simulations indicate that
theoretically, an increase of the thermal current limit of the tie line from Lienz (A) to Sover-
zene (I) by 10 %29 would yield an additional capacity of 200 MW. Practically however, allocable
capacity between these two countries is limited to the capacity of the tie line by a UCTE rule [2]
(cf. section 3.3). Hence this measure would only yield about 25 MW of additional allocable ca-
pacity.
• Despite the limitation of the allocable capacity from Austria to Italy by the UCTE rule, the Lienz-
Soverzene tie line is frequently congested. According to Verbund APG, this is caused by contract
path transactions, e.g. from Poland or Czechia via Germany and Switzerland to Italy. Taking into
account these two aspects, it seems to be promising to reconsider the present capacity allocation
regime. A stronger co-ordination of the allocation at the involved borders might help to keep
track of parallel flow originators and thereby help decreasing uncertainty margins as well as the
operational risk.
28 See appendix I.3.2 for an explanation of the limitation to 5 %.
29 See appendix I.3.2 for an explanation of the limitation to 10 %.
Page 110
92 Analysis of Electricity Network Capacities and Identification of Congestion – Final Report, December 2001
8.3.2 Network reinforcement
The following projects have been investigated for the French-Italian border (see also fig. 8.1):
• TEN project: Construction of a new 380 kV tie line between Grande Île (F) and Piossasco (I)
According to our load flow investigations as well as a statement from GRTN, this project would
yield an additional transmission capacity of 1400 MW. Although being already authorised by
French authorities, the project is suspended because of authorisation problems in Italy.
France
Switzerland
Italy
Le Broc-Carros
Camporosso
Piossasco
Praz
Albertville Ospiate Boviso
BaggioTurbigo
Lavorgo
Airolo
Genissiat
ChippisRobbia S. Fiorano
GorlagoMilan areaGrand-Ile
Le Chaffard
Filisur
LaufenburgGrynau
Turin area
Rondissone
Quart
Venaus
Avise
Piedilago
Chamoson
380 kV
reinforcementproject
220 kV
phase shifter
Fig. 8.1: Investigated reinforcement projects at French-Italian and Swiss-Italian borders
• TEN project: Installation of a phase shifting transformer in La Praz (F)
This project is already in the realisation phase and planned to be accomplished by September
2002, according to RTE. It was initiated as a consequence of the rejection of the Grande Île-
Page 111
Analysis of Electricity Network Capacities and Identification of Congestion – Final Report, December 2001 93
Piossasco project. Our load flow simulations indicate that a capacity gain of 1600 MW might be
achieved by the transformer, which would however be reduced to 1000 MW if the (n-2) criterion
for Albertville-Rondissone was replaced by (n-1). In this context, RTE emphasise that a more pre-
cise model of the transformer’s properties and operational aspects (e.g. on-load tap changing re-
strictions) would yield a significantly lower value.
The following two projects are related to the Swiss-Italian border (see also fig. 8.1). In the load flow
scenario that we have analysed, the phase shifting transformer in La Praz is a prerequisite for any fur-
ther transmission capacity gain and therefore assumed to be installed prior to each of the projects.
(This is a realistic assumption because of the progress of the transformer project (see above). On the
other hand, the transformer might not be absolutely necessary if different base case scenarios and other
incremental power sources than France were considered.)
• TEN projects: Construction of new tie line from Airolo (CH) via Piedilago (I) to Turbigo (I)
In order to achieve a significant transmission capacity gain from France to Italy, this project must
– according to our load flow investigations – be realised in combination with a new Swiss
380 kV connection between Chippis and Airolo and an Italian 380 kV line between Turbigo
and Ospiate (the latter one corresponding to the TEN project Turbigo-Rho). (Although this neces-
sity may be partly caused by our scenario, i.e. by the additional French exports leading to west-
east transit flow through Switzerland, a missing 380 kV west-east link – in this case from Chamo-
son to Chippis – is also agreed to be urgently needed by the Swiss TSOs who refer to parallel
flows due to lacking Italian connections between Turin and Milan.)
Our load flow simulations indicate that this reinforcement may yield a transmission capacity in-
crease of 800 MW in addition to the one achieved by the La Praz phase shifter alone. GRTN esti-
mate an identical gain of 800 MW from the this interconnection. According to Swiss TSOs, con-
struction work in Switzerland (i.e. about 20 of 200 km) has – on the basis of old contracts with
Italian utilities – already been accomplished, whereas GRTN state that this tie line is not being
pursued anymore, because they consider the Robbia-San Fiorano project (see below) more likely
to be authorised.
• TEN project: Construction of new tie line between Robbia (CH) and San Fiorano (I)
According to our load flow investigation, this tie line yields an additional transmission capacity of
400 MW more than the La Praz phase shifter alone. If – similar to the previous project – the rein-
forcement is complemented by a new 380 kV line between Chippis (CH) and Airolo (CH), this
gain estimate increases to 1100 MW. For the tie line alone, the Swiss TSOs estimate a capacity
gain of 1000 MW, while GRTN expect 700 MW. The tie line, considered by GRTN more likely to
Page 112
94 Analysis of Electricity Network Capacities and Identification of Congestion – Final Report, December 2001
be granted authorisation than the one from Airolo to Turbigo, has also been partly completed on
the Swiss side.
Italy
Robbia S. Fiorano
Gorlago
Filisur
Germany
Austria
SloveniaSoverzene
LienzLienz
Redipuglia
DivacaCordignano
Tauern
ObersielachWesttirol
Kainachtal
Südburgenland
380 kV
reinforcementproject
220 kV
Fig. 8.2: Investigated reinforcement projects at Austrian-Italian border
At the Austrian-Italian border, there is – taking into account the network topology on both sides of the
border – only one reasonable option for a new interconnection (see also fig. 8.2):
• Construction of a 380 kV tie line from Lienz (A) to Cordignano (I)
Our load flow simulations indicate for a single circuit line a capacity gain of 600 MW which is
just in-between the estimates of Verbund APG (500 MW) and GRTN (700 MW). In contrast, if
the UCTE rule for capacity allocation [2] is taken into account (cf. related soft measures above),
Page 113
Analysis of Electricity Network Capacities and Identification of Congestion – Final Report, December 2001 95
the only benefit of the new line would be that the capacity of the existing 220 kV line could be al-
located as firm capacity30.
According to Verbund APG, the capacity gain of a double circuit 380 kV tie line would amount to
1200-1500 MW if the project was combined with the planned construction of the internal Austrian
connection between Südburgenland and Kainachtal. We could however not investigate this alter-
native due to its strong interference with the Slovenian grid.
After a long pause, recent contacts between GRTN and Verbund APG have taken place with re-
spect to this project, so that a realisation is now deemed possible until 2005 or 2006. Delays are
however foreseen with respect to the difficult route finding in Italy (because of strict regulations
for electromagnetic interference) and a lack of experience with new authorisation procedures in
Austria.
8.3.3 Evaluation
An abolishment of the (n-2) criterion for the Albertville-Rondissone tie line would yield a notable
transmission capacity gain. Our economic assessment shows that this gain could be achieved with a
cost/benefit ratio of less than 5,000 Euro/MWa. Taking these results into account as well as the argu-
ments given in section 6.2.3, the abolishment of this (n-2) criterion should be sincerely considered. We
have the impression that a political backing of this measure is one of the most essential aspects. Also
the second promising soft measure, i.e. the consideration of different ambient temperatures for internal
Italian lines, seems to be blocked by rather formal than technical reasons.
Regarding reinforcement on the French-Italian border, the cost/benefit ratio is – due to the lower
losses – more favourable for the new tie line from Albertville to Piossasco than for the phase shifting
transformer that will be installed in La Praz, especially since our load flow simulations might have
overestimated the benefit of the latter project. Both projects are below 10,000 Euro/MWa.
The two reinforcement projects on the Swiss-Italian border have high costs because of the long dis-
tances between the substations as well as the necessity of additional reinforcements of internal Swiss
or Italian routes. Consequently, their cost/benefit ratios as obtained from our load flow based analysis
30 The reason for this phenomenon is that the new tie line itself would constitute the severest (n-1) contingency.
Since the (n-1) criterion must be taken into account for the firm allocation of capacity, only the existing
220 kV line would remain to determine the maximum allocable capacity according to the UCTE rule [2].
Page 114
96 Analysis of Electricity Network Capacities and Identification of Congestion – Final Report, December 2001
seem to be about twice as high as those of the projects at the French border. On the other hand, this
analysis has been focused on transports from France to Italy. Import capacity from other sources, e.g.
Switzerland or Germany, might benefit stronger from these projects (although our results in terms of
additional capacity are close to those provided by the TSOs) or might not require the Chippis-Airolo
reinforcement. Moreover, the Swiss parts of the tie lines have already been completed or partly built,
so that our investment costs might be overestimated. For these reasons it is not possible to derive a
clear preference for investment at one border or the other nor for one of the two Swiss-Italian projects.
The soft measure of applying seasonally differentiated temperature assumptions for critical Austrian
lines should be further pursued, especially since Verbund APG have signalled openness to such con-
siderations. The benefit of any soft measure is however dependent on the development of the alloca-
tion regime. Although the allocable capacity is presently limited to a low value by the aforementioned
UCTE rule, the tie line to Italy is often congested due to the significant influence of parallel flows.
Therefore, a stronger co-ordinated capacity allocation seems to be worth considering.
Moreover, the frequent overload of the only Austrian-Italian tie line – which at present can only be
relieved by directional operation, i.e. by impeding the line from serving its interconnection function –
provides some indication that a physical reinforcement seems to be necessary. The cost/benefit ratio of
14,000 Euro/MWa for the investigated Lienz-Cordignano project is similar to that of the reinforce-
ments at the other borders. However, a final evaluation of the eastern part of the Italian border has not
been possible in this study because of the exclusion of the important Slovenian grid.
8.4 Germany ↔ Denmark
A description of the present situation at this border can be found in appendix E.8.
8.4.1 Soft measures
Taking into account that the actual technical capacity limit in southbound direction is not certain due
to a missing new stability study and that there have been contradictory TSO statements regarding the
reason for the northbound capacity limit (cf. appendix E.8), it is difficult to estimate the benefit of soft
measures for this border. In the first place, it seems highly recommendable to carry out the necessary
studies and provide further clarification on these issues. From the present point of view, one may con-
sider the following measures:
• A new study could be launched by the TSOs in order to clarify the persistence of the static stabil-
ity problems. If this study indicated that the new power system stabilisers in Denmark have solved
the problems, the southbound transmission capacity could be raised by 200 MW with respect to
Page 115
Analysis of Electricity Network Capacities and Identification of Congestion – Final Report, December 2001 97
the Eltra (DK) grid. (Internal restriction in the E.ON Netz (D) grid might however reduce this
gain.)
• If further clarification shows that northbound capacity is indeed reduced because of a margin for
reserve power transport, this constitutes a de-facto (n-2) criterion. By dropping this criterion, the
capacity could be increased by this margin which amounts to a few hundred MW according to
E.ON Netz (D).
• A consideration of variable ambient temperatures in order to increase thermal current limits will
have no benefit as long as stability sets the capacity limit. This is however not certain (see above).
Even if thermal limits are the most critical ones, the benefit would be questionable because Eltra
states that internal 150 kV cables constitute the critical bottlenecks (and ground temperature is less
variable than air temperature).
On the other hand, Eltra states that there is such a benefit, but it is compensated by the uncertainty
of wind generation which is higher in winter. Since Eltra apply no TRM, this uncertainty is im-
plicitly considered in TTC calculation by considering constant thermal current limits.
An increase of transparency is certainly needed to clarify this issue. If an explicit TRM was de-
clared which deals with the uncontrollable uncertainties – and which could vary throughout the
year – the use of other measures could also be assessed in an explicit and more objective way.
E.ON Netz have expressed fundamental doubts regarding the applicability of soft measures to increase
the utilisation of the existing grid. They refer to the enormous level of operational uncertainty. These
uncertainties are mostly caused by the large amount of highly fluctuating wind power generation.
Moreover, some SPS mechanisms implemented as soft measures by NORDEL TSOs (cf. section
3.2.2) have a significant, yet unpredictable impact on the load flow in the E.ON Netz grid. Therefore,
according to E.ON Netz, those operational margins that would be reduced by soft measures must not
be used up in the capacity allocation phase, because they are needed for reactions in the operational
phase.
We certainly respect that for these reasons, operational uncertainty may be particularly high with re-
spect to power flows in this region. But we recommend to separate the consideration of uncertain in-
fluences (ideally by a probabilistic approach) from the definition of technical limits, in order that the
latter can be exploited more efficiently, including the application of soft measures like the considera-
tion of variable ambient temperatures. This would not necessarily lead to higher capacities; it might
even reveal periods during which currently a too high risk is taken (e.g. in summer when thermal lim-
its have to be obeyed more strictly than in winter). But it would facilitate a more transparent allocation
between limitations of transmission capacity and their causation. For example, the explicit declaration
Page 116
98 Analysis of Electricity Network Capacities and Identification of Congestion – Final Report, December 2001
of higher uncertainties could make the undoubted operational consequences of aspects like wind gen-
eration more transparent and could improve the acceptance of the resulting restrictions of allocable
transmission capacity.
8.4.2 Network reinforcement
Several reinforcement projects which could increase the transmission capacity are currently planned
by the TSOs (see also fig. 8.3):
• TEN project: Upgrade of 220 kV tie line between Flensburg (D) and Kassø (DK) to 380 kV
Eltra are confident that this project can be realised because authorisation on the Danish side will
probably be granted. E.ON Netz state that the investigations on feasibility as well as benefit of the
reinforcement are still in progress. Therefore, no official information as to the potential capacity
gain is available.
It should be noted that the reinforcement of the Kassø-Flensburg section will probably only yield
more cross-border transmission capacity if the 380 kV connection is extended southwards to the
Hamburg area.
• Installation of a second circuit between Kassø (DK) and Tjele (DK)
According to Eltra, the realisation of this project is uncertain; concrete extension plans are pres-
ently mainly pursued for the subsection between Kassø and Endrup. This project would relieve the
Danish 150 kV grid from transmission tasks and therefore lead to an increase of cross-border
transmission capacity. The magnitude of this gain depends on the realisation of the tie line rein-
forcement (see above) because the tie line section will then become the most critically loaded grid
area.
In order to carry two circuits, all towers of the existing line will have to be replaced. On the other
hand, neither a long-term outage of the existing line nor the re-construction on new rights of way
are feasible. The outage during the construction period will however become feasible after con-
struction of the new 380 kV line Trige-V. Hassing (see next project below).
• New 380 kV line between Trige (DK) and V. Hassing (DK)
Authorisation for this project is reported to be probable so that the construction might be finished
by the end of 2003. It will close an obvious gap in Eltra’s 380 kV grid, thus possibly relieving the
150 kV grid. Eltra state that nevertheless, it will not directly help to increase cross-border trans-
mission capacity to or from Germany.
Page 117
Analysis of Electricity Network Capacities and Identification of Congestion – Final Report, December 2001 99
• Reinforcement of the 110 kV grid of E.ON Netz
Due to missing authorisation, E.ON Netz have given up the 380 kV project Lübeck-Krümmel
which had been planned as a connection of the “Baltic Cable” DC link from Sweden to the conti-
nental 380 kV grid (cf. appendix E.9). Instead, reinforcement of the regional 110 kV grid is
planned to allow the full utilisation of the cable. This reinforcement could, according to E.ON
Netz, also have a minor benefit for the transmission capacity to and from Denmark.
Tjele
V.Hassing
Trige
Kasso
Landerupgard
Flensburg
Audorf
Hamburgarea
LübeckKrümmel
Bjaverskov
Bentwisch
Germany
Denmark
Herrenwyk
380 kV
reinforcementproject
HVDC
220 kV
Görries
Fig. 8.3: Investigated reinforcement projects at German-Danish border
8.4.3 Evaluation
The first step towards more capacity at the German-Danish border should be the clarification which
significance the former stability limitations still have and which role the de-facto (n-2) reserve margin
Page 118
100 Analysis of Electricity Network Capacities and Identification of Congestion – Final Report, December 2001
and/or the thermal limitations of the Danish 150 kV grid play. Depending on the outcome of this step,
soft measures might yield several hundred MW of cross-border capacity. Especially after the foresee-
able accomplishment of the Trige-V. Hassing connection, Eltra could investigate the possibility to
increase capacity by adjusting the 150 kV grid topology in contingency situations.
After application of the soft measures (and provided that the stability limits are not critical any more),
the cross-border capacity comes close to the algebraic sum of the thermal tie line ratings (respecting
the possibility of an outage of the strongest circuit). Therefore, a significant further capacity increase
can only be achieved by the upgrade project for the 220 kV tie line, probably in combination with
additional reinforcement in Germany (380 kV connection from Flensburg to Hamburg area) and Den-
mark (Kassø-Tjele). According to Eltra, the implementation of all discussed reinforcement projects
would yield a capacity gain of about 1300 MW. This results in a cost/capacity ratio estimate (under
neglecting of incremental losses, because we could not calculate them for this border) of
20,000 Euro/MWa. Such reinforcement would however need strong political support.
8.5 Belgium/Germany → Netherlands & France → Belgium
A description of the present situation at these borders can be found in appendices E.5 and E.7. The
benefit evaluation of the investigated measures is partly based on load flow simulations. To reflect the
variability and uncertainty as regards the location of power sources and sinks, the assessment is related
to transports from Germany to the Netherlands, from France to the Netherlands and from France to
Belgium and the Netherlands. As a general finding, the investigations show that the benefit of most
measures depends significantly on the considered source/sink combination. For more detailed infor-
mation on the technical impact of each project and the reasons for the different capacity gain esti-
mates, please refer to appendix I.3.3.
8.5.1 Soft measures
Besides the technical limitations set by individual network elements, power trade in this area is today
significantly restricted by two organisational aspects:
1. Due to the poor predictability of future power sources and the inability to track or control them
with the existing “contract path” based allocation scheme, allocable capacity is determined as a
single import (and export) capacity to the Netherlands, using the smallest capacity value obtained
from the assessment of a variety of scenarios.
2. Power trade between Germany and Belgium is only possible via France or the Netherlands. This is
because there is no direct Belgium-German tie line, which would be the prerequisite for direct
Page 119
Analysis of Electricity Network Capacities and Identification of Congestion – Final Report, December 2001 101
trade according to the present UCTE rules [2]. The southern Belgian border is currently practically
blocked by long-term contracts. The alternative, i.e. a transfer via the Netherlands, would formally
constitute a subsequent import and export and therefore be subject to the joint auction. Technically
however, there are Belgian and German tie lines to the Netherlands that end in the same Dutch
substation (Maasbracht). As a consequence, the electrical distance between Germany and Belgium
is low compared to the formal burden for power trade.
Both of these aspects could be affected by the implementation of a more co-ordinated capacity alloca-
tion. As we have mentioned earlier (cf. section 6.1.2), the “co-ordinated auction” approach as dis-
cussed by ETSO [10] takes into account the physical source and sink areas; moreover, it ensures equal
treatment of power transfers between all participating areas, whether adjacent or not. It is however not
possible to explicitly quantify the benefit of such an organisational measure.
Besides these general considerations, we have investigated the following technical soft measures:
• Regarding the consideration of seasonally variable thermal current limits and the acceptance of
short-term overload in (n-1) situations, ELIA (B) and RTE (F) are applying both measures, while
TenneT (NL) and the German TSOs only consider short-term overload of 10 % and about 5 %, re-
spectively. Our load flow investigations indicate that an additional capacity of up to 600 MW from
Germany to the Netherlands might be achieved if 110 % of the present current limits were ac-
cepted by TenneT and the German TSOs. For current limits of 120 %, up to 1000 MW seem to be
possible. Two alternative measures for such an increase of thermal current limits are possible:
o Current limits for short-term overload could be raised. This would make the additional capac-
ity available all year round, but would require the availability of options to relieve overload
after contingencies. Since the German-Dutch tie lines seem to be often the most critical lines,
this could imply that real-time cross-border re-dispatch would have to be used for the relief.
However, the TSOs’ presently consider cross-border re-dispatch only as a measure to increase
the firmness of the transmission service.
o Thermal limits for normal operation could be raised by considering variable ambient tem-
peratures. In this case, the amount of additional capacity would depend on the time of year and
Page 120
102 Analysis of Electricity Network Capacities and Identification of Congestion – Final Report, December 2001
be zero in summer31. Moreover, the possible current increase would then probably be re-
stricted to 10-15 % (taking into account the experience from RTE and ELIA).
TenneT state that the critical bottlenecks with respect to thermal current limits are presently outside
their system, i.e. on foreign lines or the foreign part of tie lines. This is also confirmed by our – al-
though simplified – load flow investigations. Consequently, the benefit of this soft measure de-
pends mainly on the German TSOs. These have however expressed strong objections against an in-
crease of current limits by either of the above alternatives, based on several arguments that are pre-
sented below along with discussions from our point of view:
o Argument: Due to high operational uncertainties (e.g. due to the fluctuation of wind power
generation), such measures must not be considered in the determination of allocable capacity,
but left as a reserve margin for the operational phase.
Discussion: As already mentioned with respect to the German-Danish border (cf. section
8.4.1), we believe that an explicit separation of uncontrollable uncertainties from the technical
operating limits would allow a more transparent discussion of this aspect. For example, the
application of constant thermal ratings throughout the year means that a higher risk of actually
excessive conductor sag is taken in summer than in winter. There seems however to be no rea-
son to have higher operational reserves in winter than in summer32. Consequently, as we as-
sume that the present figures for allocable capacity are based on uncertainty margins that are
considered to yield an acceptable risk in summer, an increase of winter current limits would
only level this part of the overall risk.
o Argument: In general, transmission lines have been designed such that substation and other
equipment (e.g. disconnectors, line traps, clamps) have only slightly higher current limits than
the conductors, thereby impeding a significant increase of current ratings. Moreover, the het-
erogeneity of topography along the lines makes it difficult and unreliable to determine the
31 A day/night variation of current limits would – apart from the increased operational effort – be ineffective
because congestion in this area mostly occurs during daytime.
32 At least it would be astonishing if eventual additional operational reserve requirements would exactly com-
pensate the possible capacity increase due to lower ambient temperature. If there are actually time variant un-
certainties, these could be explicitly declared as such and might compensate parts of the capacity gained by
soft measures (or even lead to lower capacity if an explicit risk assessment reveals periods of too high risk
taken today).
Page 121
Analysis of Electricity Network Capacities and Identification of Congestion – Final Report, December 2001 103
“critical spot” of each line. These aspects are exacerbated by the fact that not only tie lines, but
also all internal lines would have to be taken into account.
Discussion: We cannot finally evaluate these general statements. However, exchanging sub-
station equipment is not a matter of feasibility, but of costs (if necessary in too many cases).
Hence, we recommend to analyse – e.g. on the basis of statistical load flow data – how many
lines would actually need an increased current limit and which of these are actually affected
by the mentioned limitations. Similarly the topographical considerations do not fundamentally
question the applicability of such measures, as the experience of other TSOs shows, and they
could eventually be focused on a limited number of lines.
o Argument: For liability reasons, the official industry standards – which have a legally binding
character in Germany – must be obeyed. These standards demand the consideration of con-
stant assumptions on environmental conditions.
Discussion: We cannot judge if the consideration of variable ambient temperature would im-
pose a legal risk on the German TSOs. If this is the case, it still does not justify to drop this
soft measure completely. It rather gives rise to the question if the standards are still adequate
in the light of scientific progress as well as the fact that several European TSOs are consider-
ing variable environmental conditions and have in the majority not encountered such legal
problems nor an increase of related accidents. An eventually necessary modification of indus-
try standards could however take several years.
• As a corrective measure, i.e. a reaction to a specific contingency, the bus bar coupling in the
Uchtelfangen (D) substation could be opened in case of a failure of one circuit of the critical tie
line from there to Vigy (F)33. The possible benefit of this measure in terms of additional transmis-
sion capacity from France seems to depend considerably on the regarded sink, with a range from
100 MW to 500 MW according to our load flow simulations. The applicability of such measures
to be considered in the capacity determination phase is however doubted by the German TSOs (cf.
discussion of previous soft measure).
• The question has been raised whether it would be useful in the international context to couple the
220 kV networks of SOTEL (L) and CEGEDEL (L) in order to create an additional link from
Germany via Luxembourg to Belgium. Besides local objections against such a measure, it would
33 Similar corrective measures are presently applied and considered during allocable capacity determination by
RTE and ELIA.
Page 122
104 Analysis of Electricity Network Capacities and Identification of Congestion – Final Report, December 2001
in fact have an adverse effect, because the rather weak 220 kV connection would be easily over-
loaded and impede the exploitation of the potential of 380 kV connections in that region.
8.5.2 Network reinforcement
There are several projects related to the transmission capacity between France, Belgium, the Nether-
lands and Germany which are being or have been discussed by the involved TSOs. Most of them con-
stitute a strengthening of existing interconnections, which seems logical because on the one hand,
authorisation is usually more difficult to acquire if completely new routes are applied for, and on the
other hand the number of existing interconnections in that region is relatively high.
As an exception to this, the question of the benefit of a new tie line connecting Germany and Belgium
is sometimes raised. As we have pointed out in section 8.5.1 above, we believe that the missing op-
portunity of direct trade between these countries is in the first place not a technical but rather an or-
ganisational issue for which a co-ordinated capacity allocation would probably be the most favourable
solution.
The following projects have thus been investigated (see also fig. 8.4):
• The voltage profile in the Netherlands is reported to be relatively low and may become critical
when imports are increased by whatsoever measure. TenneT (NL) plan to improve the voltage
situation by means of shunt capacitors (1500 Mvar capacity, commissioning scheduled for
2003). Probably, this investment will be necessary to realise any significant capacity gain by
means of the other (soft as well as reinforcement) measures, although we could not explicitly as-
sess this necessity for technical reasons related to the provided load flow data (cf. appendix I.3.1).
• Installation of two phase shifting transformers in Meeden (NL)
This project is currently in the construction phase, commissioning is scheduled for the second half
of 2002. Through this measure, TenneT aim at increasing the import capacity from Germany by at
least 1000 MW, a figure that has also been confirmed by a scenario study carried out by TenneT,
RWE Net (D) and E.ON Netz (D). The German TSOs remark however that a more detailed study
of operational issues might yield a lower capacity gain. Our own load flow simulations show an
increase of 700 MW.
German TSOs have raised the question if the problem which the planned phase shifting transform-
ers address – i.e. the unequal loading of the different German-Dutch tie lines – could also or even
better solved by means of internal reinforcement of the Dutch transmission grid. We have however
not investigated this alternative since the transformers are already being built.
Page 123
Analysis of Electricity Network Capacities and Identification of Congestion – Final Report, December 2001 105
While the Meeden project only affects the capacity from Germany to the Netherlands, the following
reinforcement options are related to the transmission capacity from France to either the Netherlands or
Belgium and the Netherlands:
Conneforde
Maasbracht
Siersdorf Rommerskirchen
VigyUchtelfangen
Meeden
Diele
Hengelo
Gronau
Achene
Lonny Aubange
Moulaine
Avelin
Avelgem
Germany
Netherlands
Belgium
France
NiederlangenZwolle
Gramme
380 kV
reinforcementproject
220 kV
phase shifter
LUX
Fig. 8.4: Investigated reinforcement projects at borders between France, Belgium, Germany and
the Netherland
Page 124
106 Analysis of Electricity Network Capacities and Identification of Congestion – Final Report, December 2001
• Reconstruction of the French part of the tie line from Vigy (F) to Uchtelfangen (D)
This reinforcement, which is very likely to be realised according to RTE, will increase the thermal
current limit by about 20 % to 2100 A per circuit34. As for the soft measure to open the bus bar
coupling in Uchtelfangen in contingency cases (see previous section), the possible capacity gain
varies significantly with the considered power sink and could, according to our simulations, be
between 100 MW and 700 MW.
• TEN-Project: Upgrade of 220 kV tie line from Moulaine (F) to Aubange (B) to 380 kV
This reinforcement would relieve the 220 kV network in northern France as well as the critical
380 kV tie line between Vigy and Uchtelfangen. On the Belgian side, the project is already com-
pleted (with one of the possible two circuits), whereas realisation in France was stopped by
authorisation problems. Our investigations indicate that the additional capacity could be between
400 MW (France to the Netherlands) and 1200 MW (France to Belgium and the Netherlands).
• Installation of a second circuit between Lonny (F) and Gramme (B)
Taking into account the authorisation problems of the Moulaine-Aubange upgrade, ELIA consider
this project as a possible alternative. Regarding the achievable capacity gain, our investigations
confirm this view, i.e. we have obtained very similar figures of 300 MW (France to the Nether-
lands) and 1100 MW (France to Belgium and the Netherlands). Unfortunately, this project has
high investment costs because the towers must be rebuilt and the necessary extension of the
Gramme substation would be complicated.
• Installation of a second circuit between Avelin (F) and Avelgem (B)
The towers of this tie line are already designed for two circuits, so that the upgrade is considered
by ELIA to be realisable soon. Moreover, the investment costs are much lower than for a complete
reconstruction. On the other hand, our investigations lead to the conclusion that the capacity gain
of this project is relatively low (200 MW to 300 MW).
34 Regarding only the conductors, even 3400 A seem to be possible. The 2100 A limit is set by the differential
protection devices because the simultaneous application of French and German rules and standards impedes
any higher current. According to our simulations, this seems to be no restriction for the capacity from France
to the Netherlands, although this might change when higher power transfer from France to Germany was as-
sumed.
Page 125
Analysis of Electricity Network Capacities and Identification of Congestion – Final Report, December 2001 107
• Installation of phase shifting transformers at French-Belgian or Belgian-Dutch border
ELIA (B) are currently looking into the possibilities of such measures. By improving the power
flow distribution, ELIA estimate that a few hundred MW of additional capacity from France could
be achieved. Due to time constraints, we could not analyse such projects by means of load flow
simulations. However, we believe that the potential capacity gain sounds realistic if for example –
especially when the Avelin-Avelgem and Vigy-Uchtelfangen tie lines are reinforced – the weak
220 kV interconnection Moulaine-Aubange can be protected in order to better exploit the capacity
of the 380 kV grid.
8.5.3 Evaluation
Due to the presently high uncertainty margins related to unclear power source and sink locations as
well as a missing direct link between Belgium and Germany, the conceptual soft measure of perform-
ing a co-ordinated capacity allocation, e.g. by means of “co-ordinated auctioning” [10], seems to be
particularly valuable at the borders between the Netherlands, Belgium and their neighbours.
Regarding the more concrete measures, the economic analysis shows that the cost/benefit ratio is
rather similar for almost all described projects and lies in a range from about 10.000 to
15,000 Euro/MWa. Due to their higher incremental losses, even the soft measures are only slightly
less expensive than the reinforcement projects. Taking into account the inevitable inaccuracies of our
calculations, the economic assessment does not provide a clear justification to prefer or reject individ-
ual projects35. The only exception is the reinforcement project for the Lonny-Achène-Gramme inter-
connection which bears the highest absolute investment costs and also the highest cost/benefit ratio
(about twice as high as the most expensive alternative).
Hence, the remaining evaluation criteria are feasibility and absolute capacity gain. Regarding capacity
from France to the north, the already initiated reinforcement project of the Vigy-Uchtelfangen tie line
35 This is however different when the “provision cost/benefit ratio” is considered instead of the “utilisation
cost/benefit ratio”. For the Moulaine-Aubange reinforcement the “provision cost/benefit ratio” is signifi-
cantly lower than for all alternatives, because it relieves the French 220 kV grid and thus yields considerable
loss savings – as long as the additional capacity is not used.
Page 126
108 Analysis of Electricity Network Capacities and Identification of Congestion – Final Report, December 2001
is considered to be realised soon and may yield around 700 MW additional capacity from France to
the Netherlands. Even quicker, the soft measure of opening the bus bar coupling in Uchtelfangen (D)
in contingency cases could yield at least a part of the capacity gain, e.g. until the reinforcement is fin-
ished.
If not only the Netherlands, but also Belgium is considered to increase its import, reinforcement of the
direct border between France and Belgium is needed, because the potential of soft measures is already
exploited. Here, the TEN project to upgrade the Moulaine-Aubange tie line to 380 kV yields by far the
highest capacity gain (if the much more expensive Lonny-Achène-Gramme reinforcement is ne-
glected). In contrast, the installation of a second circuit between Avelin and Avelgem seems to be
easier to realise and could therefore be an alternative if the authorisation problems for Moulaine-
Aubange persist. Especially in this case, i.e. after reinforcement of Avelin-Avelgem and probably also
Vigy-Uchtelfangen, the installation of additional phase shifters at one of the Belgian borders may be a
good alternative to achieve further transmission capacity.
As regards the capacity from Germany to the Netherlands, the phase shifter project in Meeden, which
is already being realised, will yield a notable increase of 700 MW (according to our simulations) to
1000 MW (according to TenneT). Further notable capacity increase might be achieved at least during
cold seasons by increasing thermal current limits in Germany. Legal obstacles might however consid-
erably delay this soft measure.
8.6 France → Spain
A description of the present situation at this border can be found in appendix E.3. Our analysis of
measures to increase the transmission capacity from France to Spain is partly based on load flow
simulation which are described in detail in appendix I.3.4.
8.6.1 Soft measures
Both REE (E) and RTE (F) consider seasonally differentiated ambient temperatures based on geo-
graphically differentiated weather statistics. Besides, temporary post-fault overloading is tolerated for
internal lines and transformers by REE and for all network elements by RTE. The following soft
measures are therefore considered:
• The question might be raised if REE could accept temporary overloading of the tie lines to France.
The reason for not doing so at present is the risk of a split of the Iberian peninsula from the UCTE
system caused by subsequent tie line tripping if such overload cannot be relieved.
Page 127
Analysis of Electricity Network Capacities and Identification of Congestion – Final Report, December 2001 109
One could argue that the same risk applies to GRTN (I) who nevertheless accept up to 20 % over-
load if relievable. In the Italian case, this can in principle be achieved by means of internal re-
dispatch although we have no information how much relief is actually achieved (note that the
20 % are an upper bound). Such internal re-dispatch would however be probably ineffective at the
French-Spanish border. This is because after an outage only three tie lines remain of which one is
controlled by a phase shifting transformer; this leaves only minor potential to improve the distri-
bution of the cross-border power flow.
Consequently, in contrast to the Italian border, cross-border congestion management would be re-
quired to be implemented as an operational procedure to relieve overload in real time. Such proce-
dure is however presently not practised in Europe and is subject to a number of open questions (cf.
section 6.1.3)
• At present, REE’s weekly and daily cross-border transmission capacity assessment is based on a
reduced network model that contains only a reduced representation of the French transmission grid
(cf. appendix D.2.2). By using more recent load flow data from the new DACF procedure (cf. sec-
tion 3.2.1), REE plan to reduce the uncertainty about generation dispatch and topology in France,
which might result in the possibility to decrease the TRM by about 100 MW (leading to an in-
crease of allocable capacity by the same amount). The evaluation of the applicability of the DACF
data is scheduled to be finished in 2002.
8.6.2 Network reinforcement
At present, the Spanish and French transmission grids are interconnected by four tie lines. The fol-
lowing measures aim at improving the utilisation of this existing infrastructure (see also fig. 8.5):
• Installation of an additional 380/220 kV transformer in Vic (E)
According to our simulations, this project (scheduled for 2002) yields an incremental transmission
capacity of 100 MW when realised alone. In addition, it may help increasing the benefit of other
projects, because it addresses the general problem of overloading the existing transformer by any
additional import via the eastern interconnection.
• Reinforcement of the 380 kV tie line from Cantegrit (F) to Hernani (E)
The transfer rating of this line is presently limited by the conductor sag. By heightening the towers
and increasing the tensile stress of the conductors (scheduled for 2002), higher conductor tem-
peratures will be possible. According to REE, this will increase the cross-border transmission ca-
pacity by 200 MW if combined with the new transformer in Vic (see above). (We could not simu-
late the effect of this reinforcement because this tie line was not critical in the base case provided.)
Page 128
110 Analysis of Electricity Network Capacities and Identification of Congestion – Final Report, December 2001
Baixas
Juia
Vic
Cubnezais
Hernani
Cantegrit
G. Barcina
La Serna
Marsillon
Cazaril
SentmenatAsco
AragonBescano
La Plana
Pierola
Verfeil
Spain
France
Gaudière
380 kV
reinforcementproject
220 kV
phase shifter
Mouguerre
Pragneres
Fig. 8.5: Investigated reinforcement projects at French-Spanish border
• Reinforcement of French 220 kV line Cantegrit-Mougerre
This measure could reduce the loop flows on the 220 kV interconnection to Arkale (E). If it cannot
be realised because of authorisation problems, REE consider the installation of a phase shifting
transformer in Arkale instead. The expected transmission capacity gain is about 100 MW. As a
third measure that can reduce the loop flows, an additional substation within the present tie line
Cantegrit-Hernani is planned by RTE to supply the Bayonne area.
• Installation of shunt capacitors in Bescano (E)
This measure would solve the voltage problems that today limit Spanish import in peak load peri-
ods. Its necessity depends however on the realisation of the Baixas-Bescano-Sentmenat project
(see below for further discussion).
Page 129
Analysis of Electricity Network Capacities and Identification of Congestion – Final Report, December 2001 111
• TEN-Project: Construction of new internal line Musquiz-Pta Ceballos-Santurce
We have been informed that this project aims at increasing the Spanish export capacity from the
Basque Country rather than the import capacity. The project might be realised in 2002 or 2003.
Besides the plans to improve the use of the existing tie lines, there are three measures regarding new
interconnections between France and Spain (see also fig. 8.5):
• Completion of the double circuit 380 kV tie line from Cazaril (F) to Aragon (E)
After construction work on the Spanish side had already begun, this project was cancelled by the
French prime minister in 1996. According to our simulations, it may yield a transmission capacity
gain of about 1400 MW. Besides, it would create an additional transmission axis between the ex-
isting ones at the two coasts; therefore, it seems to have, in contrast to the following project, a
rather moderate influence on the power flows inside France.
• TEN projects: Construction of a new 380 kV substation in Bescano (E) with connections to
Baixas (F) and Sentmenat (E)
This project (currently scheduled for 2005) might be easier to realise than the Cazaril-Aragon
route, because the line will be parallel to the new TGV track Perpignan-Barcelona and seems to
have strong political support. REE points out that the benefit of the cross-border section Baixas-
Bescano can only be achieved if the internal continuation to Sentmenat is also built. Besides, this
internal line will solve the voltage problems in the region so that the investment in shunt capaci-
tors (see above) can be avoided.
Our simulations show for this project a capacity gain of 1300 MW which is close to the 1200 MW
as stated by REE and RTE. According to RTE, additional internal reinforcement in France may be
necessary to realise this gain.
• Construction of a double circuit 380 kV tie line between Marsillon (F) and La Serna (E)
Looking at the topology of the 380 kV grid on both sides of the border, this connection might pro-
vide a plausible alternative for a new, central transmission axis besides the Cazaril-Aragon project
mentioned above. This project is however not being planned by the TSOs. Our load flow investi-
gations indicate a transmission capacity gain of 900 MW which is limited by the Spanish internal
220 kV grid.
Page 130
112 Analysis of Electricity Network Capacities and Identification of Congestion – Final Report, December 2001
8.6.3 Evaluation
At this border, the potential for soft measures is rather low. About 100 MW additional capacity seems
however possible and might – depending on the outcome of REE’s current study – be made available
in 2002.
Minor reinforcement measures – aiming at improving the utilisation of the four existing interconnec-
tions – could yield additional transmission capacity of about 300 MW. Of this potential, 200 MW will
probably be made available in 2002 (new transformer in Vic, reinforcement of Cantegrit-Hernani
line). The cost/benefit ratio of these measures is very moderate with an amount of below
10,000 Euro/MWa. The remaining 100 MW are delayed because the selection of the best measure to
take in order to reduce the loop flows on the Atlantic coast depends on the authorisation procedure for
internal French reinforcement between Cantegrit and Mougerre.
Any significant increase in transmission capacity gain clearly requires the construction of new tie
lines. We have investigated three alternatives which all bear a cost/benefit ratio around
20,000 Euro/MWa, being considerably higher than for the “minor” measures because of the length of
the new lines. From these three alternatives, the Baixas-Bescano-Sentmenat project seems to be the
most realisable and yields additional transmission capacity of about 1200 to 1300 MW. Being dis-
cussed for commissioning by 2005, we recommend to pursue the construction of the internal part be-
tween Sentmenat and Bescano with high priority because it can avoid the need for shunt capacitors
which would not be required any more after completion of the tie line project.
To obtain further transmission capacity, the Cazaril-Aragon project, being even partly realised, seems
to provide the highest capacity gain (1400 MW according to our investigations). If the authorisation
difficulties of this project persist, an alternative route may be from Marsillon to La Serna. To obtain a
similar capacity gain, however, measures to relieve the Spanish 220 kV grid between La Serna and
Aragon seem to be necessary.
8.7 Norway ↔ Sweden
The network and congestion situation at this border is described in appendix E.14. Based on this
analysis and on our discussions with Svenska Kraftnät (S) and Statnett (N), the starting point for the
evaluation of measures to increase capacity at this border can be characterised by four aspects:
1. The demand for capacity is fluctuating in the short term (i.e. from one year to the next) with re-
spect to amount and direction.
Page 131
Analysis of Electricity Network Capacities and Identification of Congestion – Final Report, December 2001 113
2. The TSOs report less authorisation problems than most others. In contrast to some other borders,
there do not seem to exist lists of planned, but postponed projects and lists of several alternatives
for the same objective, as is the case in other countries due to authorisation problems.
3. In recent years, the transmission capacity has been steadily increased by very different kinds of
measures.
4. Market simulations carried out by Statnett (N) have indicated that new tie lines may not necessar-
ily be economically efficient.
Consequently, the following measures, being mostly based on information from the two involved
TSOs, focus on improving the utilisation of the existing interconnections.
8.7.1 Soft measures
When calculating allocable capacity (which in the Nordic market must only be done one day ahead of
operation), both Svenska Kraftnät and Statnett use temperature forecasts to derive the thermal current
limits of overhead lines and consider short-term overload after failures. Moreover, the critical factor
for transmission capacity is in most cases stability rather than thermal current limits. Hence, the fol-
lowing soft measures are taken into consideration:
• By installing a special protection system (SPS) – i.e. automatic, centralised generation discon-
nection (600 MW) after certain failures –, capacity at the northern border section can be raised.
A similar system is already in use to increase the capacity in the south. At present, studies for the
parameterisation of the SPS are carried out.
• Svenska Kraftnät are investigating the possibility to use wind speed forecasts in order to in-
crease thermal current limits of critical lines in south-western Sweden. As we have pointed
out in section 6.2.1, increased wind speed assumptions yield significantly higher thermal current
limits, but the predictability of wind speed and direction is in general very poor. The line which is
investigated by Svenska Kraftnät seems to be an exception to this rule because of its geographical
location close to the coast, its straight routing and the prevailing wind conditions. The outcome of
the investigation is however not yet certain.
8.7.2 Network reinforcement
The following reinforcement measures are currently executed, planned or investigated (see also fig.
8.6):
Page 132
114 Analysis of Electricity Network Capacities and Identification of Congestion – Final Report, December 2001
Osloarea
StockholmBorgvik
Nea
JärpströmmenTrondheim
Letsi
Ofoten
Kristiansand
Norway
Sweden
Göteborg
Skogssäter
400 kV
reinforcementproject
300 kV
HVDC
220 kV
Grundfors
Røssåga
Hasle
phase shifter
Fig. 8.6: Investigated reinforcement projects at Norwegian-Swedish border
• TEN project: Reinforcement of existing tie line Nea-Jarpströmmen
By heightening the towers, the capacity of this line will be increased by 120 MVA. The project is
scheduled to be completed in 2001.
• TEN project: Reinforcement of interconnection from Røssaga (N) to Grundfors (S)
This project comprises actually two different measures. To increase the transmission capacity
from Norway to Sweden, the transformer in Grundfors – being presently more critical than the
conductors – will be replaced in 2002. Transmission in the other direction is restricted by thermal
current limits in Norway which are planned to be raised by heightening of the towers. Each meas-
ure is expected to increase the transmission capacity in the respective direction by 100 MW.
• TEN project: Reconstruction of Borgvik (S) substation and associated reinforcements
This project comprises the heightening of towers of several lines at the border to Norway as well
as a reconstruction of the Borgvik substation. The latter is necessary to connect a line to the sub-
Page 133
Analysis of Electricity Network Capacities and Identification of Congestion – Final Report, December 2001 115
station that formerly bypassed it. Regarding the lines, especially the Borgvik-Hasle connection
must be reinforced to withstand the outage of the Skogssäter-Hasle line. This project, which is
scheduled to be accomplished soon, will increase the transmission capacity from Sweden to south-
ern Norway by 350 MW.
• Installation of shunt capacitors in Malmö (S) and Karlshamn (S)
These reactive power sources (400 Mvar each) are taken into consideration as a reaction to the
planned shutdown of the second block of the Barsebäck nuclear power plant. This shutdown will
lead to a lack of reactive power which could be compensated by the new capacitors in order to
avoid a reduction of transmission capacities.
• Installation of shunt capacitors near Oslo (N)
As we have been informed by Statnett (N), the voltage stability problem being critical for trans-
mission capacity from southern Norway to Sweden is actually an internal Norwegian limitation.
Power flow from the south-western Norwegian hydro units mostly supplies the Oslo load centre
and is partly transported further to Sweden. The location of critical voltages is therefore the Oslo
region where Statnett plans to install capacitors of 200 Mvar by the end of 2001 and additional
400 Mvar in 2002. We have no information on the expected transmission capacity gain.
• Upgrade of 300 kV line west of Oslo (N) to 400 kV
This project is a more structural, fundamental approach to improving the voltage stability in the
Oslo region. According to Stattnett, it may yield about 500 MW of additional transmission capac-
ity to Sweden and could eventually be realised by 2004. Realisation is however not yet certain.
• Installation of a phase shifting transformer to control power flow on Lillehammer-
Sunndalsora connection (N)
This measure is currently investigated by Statnett. It aims at indirectly controlling the power flow
distribution between the central and southern border sections. Our analysis of physical tie line
loadings (cf. appendix E.14) shows that for example in 2001, the Nea-Järpströmmen tie line was
more frequently congested than the southern interconnection. In this case, a phase shifting trans-
former could indeed have raised overall cross-border power transfer.
8.7.3 Evaluation
Some of the mentioned measures – including the TEN projects – will be implemented soon and step-
wise increase the transmission capacity between Norway and Sweden. Further capacity gain can be
expected from soft measures, especially from the SPS at the northern border section. The implementa-
Page 134
116 Analysis of Electricity Network Capacities and Identification of Congestion – Final Report, December 2001
tion of further reinforcement measures seems to not depend on authorisation or other feasibility as-
pects, but mostly on the necessity of additional capacity which is at least partly assessed by means of
market models.
Page 135
Analysis of Electricity Network Capacities and Identification of Congestion – Final Report, December 2001 117
9 Conclusions
In this chapter, we present the overall conclusions of both phases of this study, subdivided into three
parts. In section 9.1, we present observations about the approaches to the determination of cross-
border transmission capacity applied by TSOs today, and about critical bottlenecks in the investigated
transmission systems. These observations form the basis of recommendations given in sections 9.2 and
9.3, whereby section 9.2 focuses on general possibilities of improvement and section 9.3 summarises
our case-specific findings regarding the necessity and possibilities to increase capacity at the critical
bottlenecks.
It should be kept in mind that strictly speaking, our general observations and recommendations relate
only to cross-border transmission between the EU member states plus Norway and Switzerland, ex-
cluding the electrically isolated countries of Ireland and Greece. This limitation of the geographical
scope has been considered unfavourable by many of our discussion partners with particular respect to
the important borders to the CENTREL area and Slovenia. However, we are confident that our general
conclusions can also be applied as a basis for similar considerations at those borders. Of course, case-
specific recommendations cannot be extrapolated to other borders.
In the section about case-specific possibilities of improvement, we indicate, as far as possible, priori-
ties that we would assign to alternative measures on the basis of our investigations. Thereby we have
followed the basic principle that measures that can be implemented in the short term – i.e. so-called
soft measures, but also investments other than new lines – take priority over projects including the
construction of new lines which is often subject to long periods for authorisation and implementation.
9.1 Observations
A first essential observation that should be highlighted about the assessment of cross-border transmis-
sion capacity is the difference between indicative, non-binding NTC values published by ETSO and
capacity values used for the actual allocation of transmission rights at individual borders. While the
latter ones are ultimately more relevant for market participants, a set of common rules regarding de-
termination methods exists only for the NTC values. Since the degree of coherence between NTCs and
allocable capacities differs considerably from TSO to TSO, the discussion on the further development
of rules and standards for capacity determination should not only be focused on the official ETSO
NTCs.
Regarding the current status of approaches to capacity determination, we have found out that essen-
tially, there exists a uniform basic concept applied by all TSOs. There is however significant space for
individual interpretation and parameterisation of this concept. This leads to a large variety of the con-
Page 136
118 Analysis of Electricity Network Capacities and Identification of Congestion – Final Report, December 2001
crete details of the actually applied approaches, which not only makes their comparison very difficult,
but also can have a considerable impact on the resulting capacity values. Ultimately, these differences
reflect diverging approaches and criteria for the assessment of numerous operational sources of un-
certainty like the availability of network and generation equipment, the environmental conditions and
the distribution of load and generation. Proposals aiming at mitigating this diversity will be discussed
in the following sections.
As regards the identification of bottlenecks in the European transmission systems, a uniform quantita-
tive evaluation of congestion severity is not feasible, among others due to variations in market rules
and allocation principles. However, we could gather sufficient information on the frequency and se-
verity of congestion to come to a relatively clear distinction between critical and less critical bottle-
necks. Taking into account that we have excluded bottlenecks that can only be relieved by adding new
DC sea cables which is on the one hand a very expensive and long-term measure and whose impact on
available capacity can on the other hand be determined very easily, we have identified the following
five interconnections as being relevant for the further investigation:
• France → Spain,
• France → Belgium & Belgium/Germany ↔ Netherlands (to be analysed in combination),
• Denmark ↔ Germany,
• France/Switzerland/Austria(/Slovenia) → Italy, and
• Norway ↔ Sweden.
9.2 General recommendations
Before discussing details about general possibilities to improve the determination and thus the utilisa-
tion of transmission capacity, it should be pointed out that our investigation has revealed a fundamen-
tal problem regarding the applicability and meaningfulness of bilateral capacity values, be it NTCs or
allocable capacities. This problem relates to the existence of “base case exchanges” (BCE) included in
the relevant network model that is used for capacity determination. On the one hand, it clearly makes
sense to use a “full” rather than an “empty” network model for these calculations in order to obtain
realistic results. On the other hand, the physical situation reflected by the “full” network model is not
unambiguously associated to a single set of BCEs. Therefore, the underlying matrix of BCEs is sig-
nificant for the resulting NTCs, and BCEs can change as a consequence of changes in trading con-
tracts, without any change of the physical load flow situation.
Page 137
Analysis of Electricity Network Capacities and Identification of Congestion – Final Report, December 2001 119
To mitigate this problem that implies difficulties for market participants to understand the published
capacity values and their interdependencies, we recommend as an immediate improvement to request
TSOs to publish along with NTC values the underlying assumptions for BCE. As a long term solution,
we recommend to strive for a more co-ordinated concept of transmission capacity allocation across
borders. One possible approach for this might be the idea of “co-ordinated auctioning” as discussed on
the ETSO level since some time.
Coming back to the methods for capacity determination, we have stated above that a variety of de-
tailed aspects are treated very differently among TSOs. At a first glance, the idea might appear attrac-
tive to identify the “best practice” with respect to each of these aspects and thus to derive an “optimal”
approach. Due to the strong interdependencies between these methodical aspects, an isolated harmoni-
sation of single aspects could however have an adverse effect on the consistency of the overall ap-
proaches. Even the total harmonisation of the methods would probably not lead to a uniform “quality
level” of transmission services, because it would neglect the obvious differences between the struc-
tures of networks, load and generation as well as market rules.
Instead, it would be more adequate to put this “quality level” in the focus of consideration and investi-
gate the way in which it is influenced by the single aspects of capacity determination. From the view-
point of a TSO, this “quality level” can be regarded equivalent to a risk level, with risk being defined
as the probability that “undesired” measures have to be taken in the operational phase, multiplied with
the cost or damage caused by such measures, e.g. re-dispatch cost, contractual penalties, or even dam-
age due to supply interruptions. An ultimate goal would thus be to define a desired level for this risk
and to design the capacity determination methods such that this level is exactly reached, taking into
account the case-specific conditions of the network etc. This would leave the specification of single
aspects up to subsidiarity, but harmonise the resulting quality level as seen by the network users.
The first step of investigating the risk level as defined above would be to analyse the relevant factors
that contribute to this risk or give TSOs the opportunity to influence it. In our view, at least the fol-
lowing categories of factors should be distinguished:
• physical limitations and industry standards related to the operation of network components,
• uncertainties (e.g. on environmental conditions) associated to the specification of operational lim-
its of network components (e.g. thermal current limits) in order to fulfil the physical constraints
and industry standards,
• uncertainties related to the availability of network and generation components,
• uncertainties related to the system status like the load and generation situation, inadvertent ex-
change etc., and
Page 138
120 Analysis of Electricity Network Capacities and Identification of Congestion – Final Report, December 2001
• degrees of freedom that TSOs can use in network operation to avoid the occurrence of deficits of
transmission quality or at least to reduce their negative effects, e.g. corrective switching or re-
dispatch.
Our analysis has shown that TSOs so far do not completely and consequently separate the assessment
of these factors in their capacity determination processes. For example, some TSOs argue that reserve
margins included in their specification of line ratings should be maintained in order to compensate for
uncertainties related to the load and generation situation.
We believe that a better separation of different influences is important to achieve more transparency
about the risk level that is actually accepted today as a consequence of the prevailing capacity deter-
mination methods. Of course, this does not by itself lead to any change of the results of capacity de-
termination, but it facilitates a more focused analysis of the single aspects in order to identify possible
improvements. Regarding the above example, a separated analysis might for instance reveal that the
relation between the implicit reserve margins in the line ratings and the volatility of load and genera-
tion varies considerably over time. This would mean that the accepted risk level also fluctuated over
time.
However, even if this recommendation is fulfilled – i.e. if all TSOs separate the assessment of the
different influence factors properly and in a harmonised way – the vision of a unified quantitative risk
assessment as outlined above can practically not be realised in the short term, for several reasons:
• A commonly accepted target level for this risk is not at all specified so far. There are only vague
impressions about the requirements of network users to transmission quality. The specification of
such a target level cannot be done by TSOs themselves, but has to involve close consultation with
market participants who ultimately benefit from transmission quality and bear the related costs.
• An essential prerequisite of such risk assessment is the availability of comprehensive statistical
data on the relevant influence factors. A considerable part of this data, e.g. historical load flow
data, can only be provided by TSOs. As far as we know, many TSOs do not have a sufficient vol-
ume of such data available to perform statistical evaluations.
• The probabilistic methods needed to assess the overall operational risk under consideration of all
relevant contributions are not yet developed.
Nevertheless, we consider it important to develop the idea of risk-oriented approaches to capacity de-
termination. As long as an overall risk cannot be quantified, concrete efforts should be spent on an
improved assessment of single contributions, as far as possible on a probabilistic basis. Even without
having defined target levels for these risk contributions, improvements could be achieved by levelling
Page 139
Analysis of Electricity Network Capacities and Identification of Congestion – Final Report, December 2001 121
the partial risks over time or among TSOs. Below, we indicate some examples that we consider prom-
ising, partly because they are already practised by some TSOs:
• The actual transmission capacity of overhead lines varies over time, because it depends on the
prevailing environmental conditions. Yet, some TSOs apply constant assumptions on these condi-
tions throughout the year. Being no worst case assumptions, this implies that, e.g. during the
summer months, a certain probability of actually excessive line loading is accepted. By using me-
teorological statistics, variable thermal currents can be derived that level this probability over the
year, allowing for higher utilisation of the network in colder seasons. Moreover, weather forecasts
can be used to adapt thermal ratings for the determination of capacity for day-ahead allocation.
Encouraged by the good experience of several TSOs with the application of variable environ-
mental assumptions, we recommend to more commonly apply such methods, and to progressively
strive for overcoming prevailing obstacles (e.g. under-dimensioned substation equipment, legal re-
strictions). Besides, a harmonisation of the individual probability thresholds as well as the consid-
ered influence parameters seems to be necessary and feasible, given the probabilistic nature of the
statistical assessment.
• It is commonly accepted that the uncertainties related to the availability of network and generation
equipment are assessed by means of deterministic criteria, such as the (n-1) principle. The con-
crete specification of this general criterion requires a decision which failure conditions are actually
to be taken into account, whereby this selection is usually based on an implicit evaluation of their
probabilities and consequences, i.e. the associated risk. This risk depends not only on the failure
type, but also on the specific network conditions. In our analysis of TSOs’ security criteria, we
have found a common basis, but also significant differences between the regarded failure types.
However, most of these differences either have no impact on the cross-border transmission ca-
pacities or can be justified by the implied risk. Yet there is one example where we recommend a
discussion on the abolishment of a currently practised (n-2) criterion; this case is further outlined
below in the context of specific recommendations for the Italian border. Moreover, some TSOs do
not (or not only) consider generator outages in their deterministic security analysis, but (also) in
the general security margin TRM. This overlapping of different uncertainty aspects can create a
de-facto (n-2) criterion. These cases are thus examples where a consequent separation of the dif-
ferent uncertainty factors would increase transparency and facilitate a discussion on the necessity
of the present criteria.
• Regarding the degrees of freedom that TSOs can use in network operation to avoid the occurrence
of deficits of transmission quality, our analysis has revealed two fields for possible improvement:
o We have found out that internal re-dispatch is already applied by several TSOs, while cross-
border congestion management exists only in a few cases and for diverging purposes (ranging
Page 140
122 Analysis of Electricity Network Capacities and Identification of Congestion – Final Report, December 2001
from making existing capacities firmer to increasing allocable capacity during periods of net-
work maintenance). We recommend to aim at a more common application of cross-border
congestion management. It is important to note that such procedures can indeed increase the
overall amount of physically transported energy, because the availability of such procedures as
an occasional countermeasure against a specified factor of uncertainty allows to permanently
neglect this uncertainty during the determination of allocable capacity. However, the practical
implementation of cross-border congestion management implies a variety of difficult issues
which require further investigation.
o Another relevant degree of freedom is the availability of corrective measures that can be ap-
plied to relieve post-fault overload of network elements in the short term. While such meas-
ures are commonly applied in the operational phase, some TSOs do not consider their avail-
ability when determining transmission capacity, stating that these measures are needed to cope
with unforeseen operational conditions. We believe that this is again a matter for the separa-
tion between different influencing factors of the operational risk, and that the availability of
corrective measures should be considered as explicitly as possible.
In both aspects, it is at present not possible to come up with more concrete, e.g. quantitative, rec-
ommendations, because they depend on network- and TSO-specific preconditions. However, ex-
perts’ working groups existing in the different TSOs’ associations could be asked to work towards
a stronger harmonisation of these issues.
Throughout our study, our investigations and recommendations have mainly been based on technical
and occasionally also regulatory aspects. However, several TSOs have also indicated legal issues that
can be obstacles to the implementation of approaches that are already applied in other countries or that
are suggested on the basis of our results. The more binding such legal requirements are, the less op-
portunities will TSOs have to apply improvements that we suggested. In this report, we have occa-
sionally mentioned examples of legal issues that have been indicated to us by the TSOs. We can how-
ever not give a complete overview of the relevant legal requirements and appropriate steps towards
harmonisation. Only the TSOs themselves will be in a position to point out the relevant regulations
when they are confronted with the approaches that have been investigated in this study.
An issue that is often raised in the context of determination and allocation of transmission capacity is
the potential benefit of additional transparency to be achieved by more comprehensive obligations of
publication for TSOs, such as more details about the methods of capacity determination, the underly-
ing definitions and relevant statistical evaluations, and retrospective evaluations of the actual utilisa-
tion of available capacity. Today, the quality and quantity of such information varies considerably
among the TSOs. It is clear that such kind of publication would not directly influence the amounts of
Page 141
Analysis of Electricity Network Capacities and Identification of Congestion – Final Report, December 2001 123
transmission capacity. However, as long as an objective method for the risk assessment as envisaged
above does not exist, such obligation for publication could motivate TSOs to come up with reasonable
justifications in case of obviously different approaches. As a consequence, arbitrary or unplausible
solutions might at least partly be avoided or modified.
9.3 Recommendations for individual borders
This section presents our case-specific findings regarding the necessity and possibilities to increase
capacity at the critical bottlenecks. We have sorted the bottlenecks in decreasing order by their priority
regarding the urgency of capacity demand.
9.3.1 France/Switzerland/Austria(/Slovenia) → Italy
The marginal economic value of transmission capacity at the Italian border is remarkably high (about
70,000 Euro/MWa) for the current network status as well as in case of capacity increasing by several
GW. Furthermore the network density at this border is significantly lower than that of the surrounding
networks. Therefore, although import demand of Italy is expected to decrease gradually in the future,
it is clearly recommendable to consider not only short-term measures, but also the construction of new
lines in order to increase transmission capacity across this border.
Regarding soft measures, we recommend to sincerely consider the abolishment of the (n-2) criterion
for the French-Italian double circuit tie line. It could yield several hundred MW of additional capacity
at a cost of about 5,000 Euro/MWa, taking into account the increase of losses due to the utilisation of
the additional capacity. Another promising soft measure is the consideration of different ambient tem-
peratures for internal Italian lines. Due to the separation of responsibilities in Italy, both measures
would probably require involvement from the political/regulatory side.
A new phase shifter in La Praz (TEN project) will yield several hundred MW of additional capacity by
late 2002 at a cost/benefit ratio of about 10,000 Euro/MWa. To further increase capacity, new tie lines
could be installed at the French (TEN project), Swiss (two alternative TEN projects) or Austrian bor-
der, each yielding 500-1400 MW of additional capacity at average costs far below the marginal value
of capacity. Especially the Swiss-Italian projects might need additional reinforcements in Italy (TEN
project) and possibly inside the Swiss grid. Our necessarily rough cost/benefit estimations do not al-
low for deriving a clear economic preference for one of these projects, so that the feasibility in terms
of authorisation procedures becomes the crucial criterion.
Page 142
124 Analysis of Electricity Network Capacities and Identification of Congestion – Final Report, December 2001
Our investigations on the Austrian-Italian border have been limited because of the exclusion of the
important Slovenian grid. However, it seems that a stronger co-ordination of capacity allocation in the
region is worth considering. This would help to control the notable parallel flows through Austria and
also allow capacity to benefit more substantially from soft measures like the increasing of thermal
current limits in winter.
9.3.2 France → Spain
For this border, we could only perform rough estimations of the capacity demand. From these estima-
tions we conclude that the marginal economic value of cross-border capacity could have a similar or-
der of magnitude as at the Italian border. Moreover, the network density is also at this border signifi-
cantly lower than in the two adjacent networks. On the other hand, an increase of transmission capac-
ity will probably lead to a steeper decline of its marginal value than on the Italian border. To conclude,
we consider it justified to take the construction of new lines into consideration, but the overall priority
of this bottleneck is somewhat lower than for the Italian one.
The need for network reinforcement is underlined by the low potential of soft measures which is
mainly caused by the geographical situation as well as the fact that many of the potential measures are
already applied. While in the short-term, a few minor reinforcements could yield additional 300 MW
at below 10,000 Euro/MWa, a significant capacity increase can only be achieved by constructing new
tie lines. We have investigated three alternatives which all bear a relatively high cost/benefit ratio
around 20,000 Euro/MWa. Of these alternatives, the Baixas-Bescano-Sentmenat TEN project, yielding
about 1200 MW, seems to be the most realisable one (by 2005). Among the remaining projects, the
Cazaril-Aragon tie line would, according to our load flow simulations, yield a higher capacity gain,
but has been stopped for a lack of authorisation. If these difficulties persist, an alternative route may
be from Marsillon to La Serna.
9.3.3 Belgium/Germany → Netherlands & France → Belgium
Our analysis of auctioning results at the Dutch borders indicates a considerable value of transmission
capacity from Germany to the Netherlands in the magnitude of 40,000 Euro/MWa. TenneT (NL) has
in its latest capacity plan assumed a maximum import demand of 5000 MW, i.e. about 1400 MW more
than available today. Long-term forecasts indicate however a decrease of import demand. Therefore, a
high priority should be assigned to short-term measures. This is underlined by the fact that the network
density of the border section is similar to that of the adjacent networks, so that a construction of new
tie lines would probably cause the need for additional internal reinforcements.
Page 143
Analysis of Electricity Network Capacities and Identification of Congestion – Final Report, December 2001 125
Concluding from our investigations, there are two short-term measures that could significantly in-
crease the transmission capacity from Germany to the Netherlands. The phase shifter project in
Meeden, which is already being realised, will yield a notable increase in the magnitude of 700-
1000 MW at a cost/benefit ratio of about 10,000 Euro/MWa. Further notable capacity increase might
be achieved at least during cold seasons by increasing thermal current limits in Germany. Legal obsta-
cles might however considerably delay this soft measure.
The Belgian grid partly hosts transits from France to the Netherlands (as does the German grid).
Physical transmission to the Belgian grid is only congested at the southern border. The practical access
is however further restricted because there is no direct German-Belgian interconnection which would
be formally necessary to bypass the expensive auction to the Netherlands.
With respect to this problem, a more co-ordinated capacity allocation, e.g. by means of “co-ordinated
auctioning” as discussed by ETSO, could be particularly useful to improve the utilisation of the exist-
ing network in this region.
Regarding the southern access to Belgium, our analysis shows that most alternative projects bear a
similar cost/benefit ratio between 10,000 and 15,000 Euro/MWa. The evaluation of individual meas-
ures depends therefore on the feasibility, but also on the considered sink location of exported power:
• To increase power transmission from France to the Netherlands, the already initiated reinforce-
ment of the French-German(!) tie line Vigy-Uchtelfangen may, as our simulations show, yield
about 700 MW of additional capacity. The soft measure of opening the bus bar coupling in Uchtel-
fangen in contingency cases could provide at least a part of that capacity even sooner.
• If not only the Netherlands, but also Belgium is considered to increase its import from France,
reinforcement on the French-Belgian border is needed, because the potential of soft measures is al-
ready exploited. Here, the Moulaine-Aubange reinforcement to 380 kV (TEN project) yields by
far the highest capacity gain (more than 1000 MW according to our simulations), whereas the al-
ternative, i.e. a second circuit between Avelin and Avelgem, seems to be easier to realise.
9.3.4 Germany ↔ Denmark
The evaluation of auctioning results reveals that the economic value of transmission capacity at this
border is in both directions rather low compared to the borders of the Netherlands and Italy, for exam-
ple. As a conclusion, there seems to be no urgent need for a notable addition of transmission capacity.
In the medium term however, stronger transits through Denmark to Sweden and Norway might exac-
erbate the congestion. Moreover, the fluctuations of wind energy will gain relevance.
Page 144
126 Analysis of Electricity Network Capacities and Identification of Congestion – Final Report, December 2001
Nevertheless, a short-term increase of capacity might be possible by means of soft measures, including
the abolishment of a possible de-facto (n-2) reserve margin and the consideration of variable ambient
temperatures. Prior to such considerations, the involved TSOs should however focus on clarifying
which physical criterion actually limits the capacity today and in which way the reserve for generator
outages is considered in the process of capacity determination and/or allocation.
A significant increase of capacity would probably require a major reinforcement, including the TEN
project Flensburg-Kassø, but also further reinforcements inside both adjacent countries. Besides the
difficult authorisation situation for at least a part of these projects, the estimated cost/benefit ratio of
about 20,000 Euro/MWa does hardly justify such measures in the view of the present economic value
of capacity.
9.3.5 Norway ↔ Sweden
This bottleneck is characterised by a fluctuating transmission capacity demand (depending on the
year-by-year development of hydraulic resources). In recent years, the transmission capacity has been
steadily increased. Moreover, market simulations have indicated that new tie lines may not necessarily
be economically efficient. Regarding the development of capacity demand on this border, we have
drawn only rough conclusions from publicly available forecast documents. It is expected that espe-
cially in Norway generation capacity will grow slower than load, which can be interpreted as a ten-
dency towards gradually increasing demand for import from Sweden (and Denmark).
Our analysis has shown that a number of measures are presently realised or concretely planned on all
three border sections. Some of these measures – including three TEN projects – will be implemented
soon and stepwise increase the transmission capacity between Norway and Sweden. Further capacity
gain can be expected from soft measures, especially from the SPS at the northern border section. The
implementation of further reinforcement measures seems to not depend on authorisation or other fea-
sibility aspects, but mostly on the necessity of additional capacity which is at least partly assessed by
means of market models.
Page 145
Analysis of Electricity Network Capacities and Identification of Congestion – Final Report, December 2001 127
10 References
[1] Haubrich, H.-J.; Fritz, W.; Vennegeerts, H.
Cross-Border Electricity Transmission Tariffs
Study by order of the European Commission, Aachen, April 1999
[2] UCTE
Summary of the current operating principles of the UCPTE
http://www.ucte.org, February 1999
[3] NORDEL
Annual Report 2000
http://www.nordel.org
[4] UCTE
Statistical yearbook 1999
http://www.ucte.org
[5] ETSO
Definitions of Transfer Capacities in liberalised Electricity Markets
http://www.etso-net.org, April 2001
[6] ETSO
Net Transfer Capacities (NTC) and Available Transfer Capacities (ATC) in the Internal
Market of Electricity in Europe (IEM) – Information for User
http://www.etso-net.org, March 2000
[7] Haubrich, H.-J.; Fritz, W.
Audit of the Process of Determination of Available Cross-Border Electricity Transmission
Capacity in the Netherlands
Audit commissioned by DTe (Dutch energy regulation authority), http://www.nma-
dte.nl/pdf/Audit_TU-Aken.PDF, February 2001
[8] IEC 354
Loading guide for oil-immersed power transformers
2nd edition, 1991
Page 146
128 Analysis of Electricity Network Capacities and Identification of Congestion – Final Report, December 2001
[9] European Commission
Energy in Europe – European Union energy outlook to 2020
Office for Official Publications of the European Communities, Luxembourg 1999
[10] ETSO
Co-ordinated Auctioning – A market-based method for transmission capacity allocation in
meshed networks
Final Report, http://www.etso-net.org, April 2001
[11] Troen, I.; Petersen, L.
European Wind Atlas
Riso National Laboratory Roskilde, Denmark, 1989
[12] UCTE
Statistical yearbook 2000
http://www.ucte.org
[13] ETSO
Procedures for Cross-border Transmission Capacity Assessments
Final Draft, October 2001