Page 1
ANALYSIS OF ELECTROMIOGRAPHIC SIGNALS
FROM THE FLEX-EXTENSION MOVEMENT OF THE
KNEE
Edwin Guerrero, Iván Iglesias
Carrera de Ingeniería en Mecatrónica, FICA, Universidad Técnica del Norte, Av. 17 de Julio, Ibarra, Ecuador
[email protected] , [email protected]
Abstract. This paper shows the development of analysis
of electromyographic signals (EMG) from thigh muscles. It
aims to characterize, through software, EMG signals in the
time domain, focused on devices for the help of people with
physical disabilities, helping the process of training orthoses
or myoelectric prostheses.
Currently commercial orthoses or prostheses that have
greater control compared to conventional devices, which can
execute more precise movements, but, disabled people have
more access to common prostheses because they are not as
costly as high technology ones. For this reason, this
investigation tries to generate technology in our own
environment and not depend on the foreigner, and so, to be
able to adapt the devices of assistance to the needs of the
population with prices that can be accessible, mainly focused
to Zone 1, Where in Imbabura we can find 4826 people with
physical disabilities.
As result of the investigation, a graphical user interface
was obtained able to obtain characteristics of the EMG
signal in the time domain given a region of interest that will
help the process of training and control of a prosthesis driven
by EMG signals generated by the muscles of the thigh.
Keywords
Characteristics, time domain electromyography,
graphic interface, muscles, prosthesis, software,
1. INTRODUCTION
Inside of the field of medicine, can found biological
signals produced by the muscles of the body, such as the
electromyographic (EMG) signal, which is oriented to the
diagnosis of neuromuscular diseases as well as muscular
treatments. The EMG signal can obtained from voluntary
movements or contractions making possible its
implementation in intelligent prostheses, contributing to
improve the quality of life of people who have suffered
partial or total loss of limb. With proper control and training,
myoelectric prostheses can replace the lost limbs totally or
partially, creating an artificial limb as if it were a real one.
This paper presents a way to characterize, in the time
domain, the electromyographic signals of the thigh muscles
involved in the flex-extension movement of the knee. Using
a graphical user interface capable of monitoring and
analyzing these signals, where, preliminary tests performed
on healthy people, both men and women of different ages.
ELECTROMIOGRAPHY
Electromyography is a record of muscular electrical
activity, and therefore constitutes an extension of the physical
examination and a test in the integrity of the motor system, a
representation of this electrical activity can observed in
Figure 1.1. It can said that surface electromyography
(EMGS), sometimes-called kinesiological
electromyography, is the electromyographic analysis that
allows collecting the electrical signal of a muscle in a moving
body. The main purpose of this type of measurement is to
know the activity of one or several muscles in a concrete
action [1].
Figure 1.1 Muscular activity for spontaneous spinal cord
in the lower lumbar vertebrae [2].
Characteristics of the EMG signal
Between the important aspects of the EMG signal, it can
mentioned that it has a random amplitude in nature and can
reasonably represented by a Gaussian distribution function.
Page 2
This amplitude may range from 0 to 10 [mV] (peak to peak)
or from 0 to 1.5 [mV] (rms), the usable power of the signal
being limited to the frequency range 0 to 500 [Hz] [3].
From the most relevant information of the EMG signals
is in an oscillating frequency between 50 and 150 Hz, it
follows that the appropriate sampling frequency must not be
less than 300 Hz [4].
2. METHODOLOGY
2.1 EMG SIGNALS CONDITIONING CARD
The following steps used from the EMG signal
conditioning card:
Pre-amplification stage.
Butterworth band pass filter of fourth order
from 20 to 500 [Hz].
Notch filter of 60 [Hz] with bandwidth of 2
[Hz].
Final amplification stage.
3. DEVELOPMENT OF THE USER'S GRAPHIC
INTERFACE
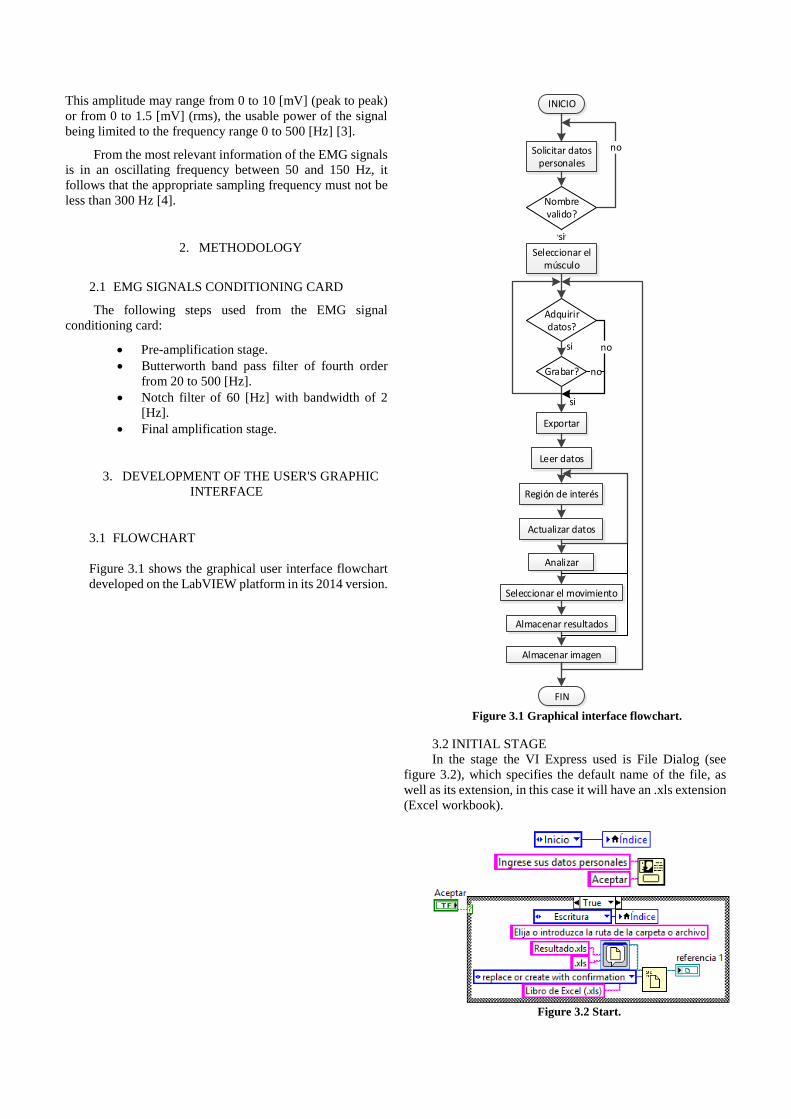
3.1 FLOWCHART
Figure 3.1 shows the graphical user interface flowchart
developed on the LabVIEW platform in its 2014 version.
INICIO
Solicitar datos personales
si
Seleccionar el músculo
Nombre valido?
no
Adquirir datos?
Grabar?
si
Exportar
si
Leer datos
Región de interés
Actualizar datos
Analizar
Seleccionar el movimiento
Almacenar resultados
Almacenar imagen
FIN
no
no
Figure 3.1 Graphical interface flowchart.
3.2 INITIAL STAGE
In the stage the VI Express used is File Dialog (see
figure 3.2), which specifies the default name of the file, as
well as its extension, in this case it will have an .xls extension
(Excel workbook).
Figure 3.2 Start.
Page 3
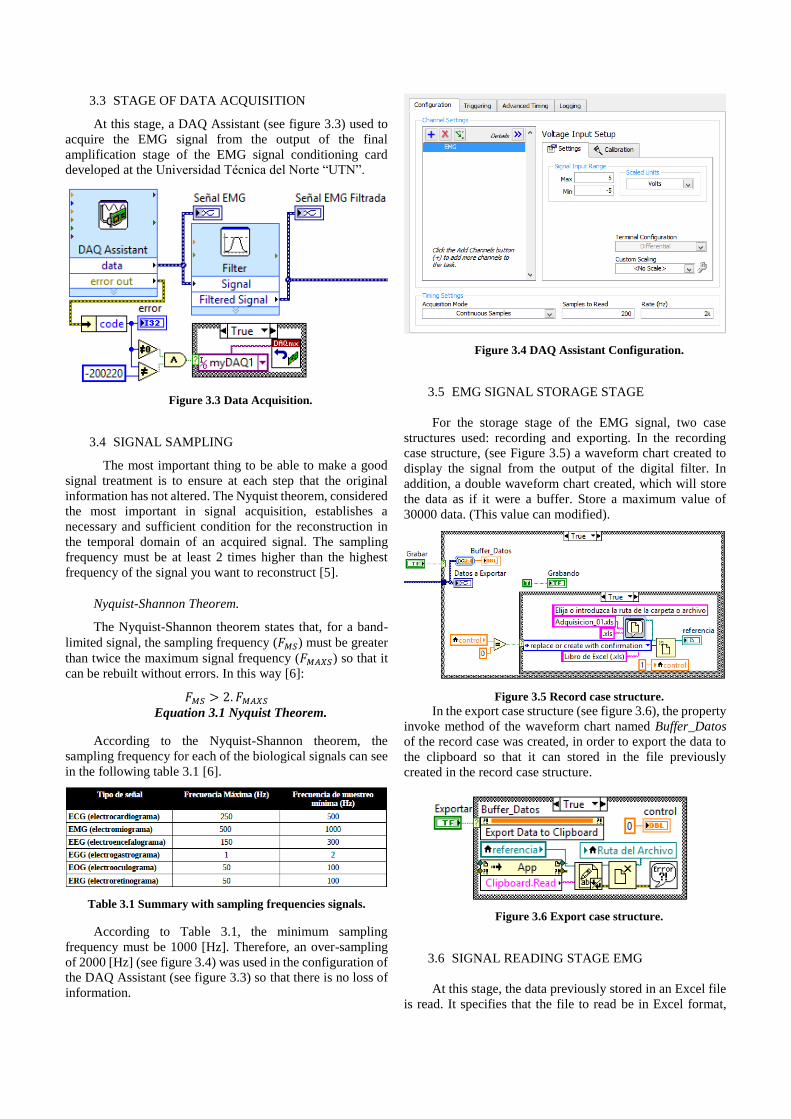
3.3 STAGE OF DATA ACQUISITION
At this stage, a DAQ Assistant (see figure 3.3) used to
acquire the EMG signal from the output of the final
amplification stage of the EMG signal conditioning card
developed at the Universidad Técnica del Norte “UTN”.
Figure 3.3 Data Acquisition.
3.4 SIGNAL SAMPLING
The most important thing to be able to make a good
signal treatment is to ensure at each step that the original
information has not altered. The Nyquist theorem, considered
the most important in signal acquisition, establishes a
necessary and sufficient condition for the reconstruction in
the temporal domain of an acquired signal. The sampling
frequency must be at least 2 times higher than the highest
frequency of the signal you want to reconstruct [5].
Nyquist-Shannon Theorem.
The Nyquist-Shannon theorem states that, for a band-
limited signal, the sampling frequency (𝐹𝑀𝑆) must be greater
than twice the maximum signal frequency (𝐹𝑀𝐴𝑋𝑆) so that it
can be rebuilt without errors. In this way [6]:
𝐹𝑀𝑆 > 2. 𝐹𝑀𝐴𝑋𝑆
Equation 3.1 Nyquist Theorem.
According to the Nyquist-Shannon theorem, the
sampling frequency for each of the biological signals can see
in the following table 3.1 [6].
Table 3.1 Summary with sampling frequencies signals.
According to Table 3.1, the minimum sampling
frequency must be 1000 [Hz]. Therefore, an over-sampling
of 2000 [Hz] (see figure 3.4) was used in the configuration of
the DAQ Assistant (see figure 3.3) so that there is no loss of
information.
Figure 3.4 DAQ Assistant Configuration.
3.5 EMG SIGNAL STORAGE STAGE
For the storage stage of the EMG signal, two case
structures used: recording and exporting. In the recording
case structure, (see Figure 3.5) a waveform chart created to
display the signal from the output of the digital filter. In
addition, a double waveform chart created, which will store
the data as if it were a buffer. Store a maximum value of
30000 data. (This value can modified).
Figure 3.5 Record case structure.
In the export case structure (see figure 3.6), the property
invoke method of the waveform chart named Buffer_Datos
of the record case was created, in order to export the data to
the clipboard so that it can stored in the file previously
created in the record case structure.
Figure 3.6 Export case structure.
3.6 SIGNAL READING STAGE EMG
At this stage, the data previously stored in an Excel file
is read. It specifies that the file to read be in Excel format,
Page 4
besides indicating the path of the file (see figure 3.7). It
mentions the Excel sheet where the data to be exported is
found (in the case it is sheet 0).
Figure 3.7 Export case structure.
3.7 DATA UPDATE STAGE
In order to extract only a part of the signal to analyze, a
new reading of the file containing the data made, indicating
the new beginning and end of the reading. The property node
tool used to create start & end cursors and thus restrict the
range to be read (see figure 3.8).
Figure 3.8 Updated reading of the EMG signal.
3.8 SIGNAL ANALYSIS STAGE EMG
Once the updated data extracted, a wave generated with
the data, and then the following blocks used to obtain the
characteristics required for the analysis. In obtaining
characteristics of the EMG signal, the case structure shown
in Figure 3.9 used.
Figure 3.9 Analysis of the EMG signal.
3.9 RESULTS STORAGE STAGE
The file created in the initial stage used to store the
personal data and the results obtained from the analysis. The
patient's personal data are stored, in addition to the results
obtained from the analysis performed on the EMG signal in
text format (see figure 3.10) in the previously created file.
Figure 3.10 Analysis of the EMG signal.
4. RESULTS OBTAINED.
The results obtained according to the ages of the male
patients are below.
4.1 AMPLITUD
Figure 4.1 shows the amplitude values of the patients,
obtained from the EMG signal of the study muscles, effecting
the gait movement, where it can see that the muscle that
generates the maximum amplitude value is the vast mean of
A 10 year old boy.
Figure 4.1 Amplitude of the EMG signal making the walk
motion.
Figure 4.2 shows the amplitude values of the patients,
obtained from the EMG signal of the study muscles, making
the movement of getting up from a chair, where it can see that
the muscle that generates the maximum amplitude value is
the vast lateral of an adult of 48 years.
Page 5
Figure 4.2 Amplitude of the EMG signal performing the
movement of getting up from a chair.
Figure 4.3 shows the amplitude values of the patients,
obtained from the EMG signal of the study muscles, making
the movement of sitting in a chair, where it can see that the
muscle that generates the maximum amplitude value is the
vast lateral of an adult of 48 years.
Figure 4.3 Amplitude of the EMG signal making the
movement of sitting in a chair.
4.2 MAXIMUM VALUE
Figure 4.4 shows the maximum values of the patients,
obtained from the EMG signal of the study muscles, effecting
the walking movement, where it can see that the muscle that
generates the maximum value of the signal is the vast mean
of A 10 year old boy.
Figure 4.4 Maximum value of the EMG signal making
the movement.
Figure 4.5 shows the maximum values of the patients,
obtained from the EMG signal of the study muscles, making
the movement of getting up from a chair, where it can see that
the muscle that generates the maximum value of the signal is
the vast lateral of an adult of 48 years.
Figure 4.5 Maximum value of the EMG signal
performing the movement of getting up from a chair.
Figure 4.6 shows the maximum values of the patients,
obtained from the EMG signal of the study muscles, making
the movement of sitting in a chair, where it can see that the
muscle that generates the maximum value of the signal is the
vast lateral of an adult of 48 years.
Figure 4.6 Maximum value of the EMG signal making
the movement of sitting in a chair.
4.3 MINIMUM VALUE
Figure 4.7 shows the minimum values of the patients,
obtained from the EMG signal of the study muscles, effecting
the walking movement, where it can see that the muscle that
generates the minimum value of the signal is the vast mean
of an adult of 48 years.
Page 6
Figure 4.7 Minimum value of the EMG signal making the
walking movement.
Figure 4.8 shows the minimum values of the patients,
obtained from the EMG signal of the study muscles, making
the movement of getting up from a chair, where, it can see
that the muscle that generates the minimum value of the
signal is the vast lateral of an adult of 48 years.
Figure 4.8 Minimum value of the EMG signal performing
the movement of getting up from a chair.
Figure 4.9 shows the minimum values of the patients,
obtained from the EMG signal of the study muscles, making
the movement of getting up from a chair, where, it can see
that the muscle that generates the minimum value of the
signal is the vast lateral of an adult of 48 years.
Figure 4.9 Minimum value of the EMG signal making the
movement of sitting in a chair.
4.4 WAVE LENGTH
Figure 4.10 shows the wavelength values of the
patients, obtained from the EMG signal of the study muscles,
making the walking movement, where it can see that the
muscle that generates the maximum wavelength value is the
rectus femoris of A 10 year old child.
Figure 4.10 Wavelength of the EMG signal making the
walking movement.
Figure 4.11 shows the wavelength values of the
patients, obtained from the EMG signal of the study muscles,
effecting the movement of getting up from a chair, where it
can see that the muscle that generates the maximum value of
length is the rectus femoris of A 10 year old boy.
Figure 4.11 Wavelength of the EMG signal performing
the movement of getting up from a chair.
Figure 4.12 shows the wavelength values of the
patients, obtained from the EMG signal of the study muscles,
making the movement of sitting in a chair where, it can see
that the muscle that generates the maximum value of length
of Wave is the rectus femoris of A 25 year old.
Page 7
Figure 4.12 Wavelength of the EMG signal performing
the movement of sitting in a chair.
4.5 RMS VALUE
Figure 4.13 shows the RMS values of the patients,
obtained from the EMG signal of the study muscles, making
the walking movement, where it can see that the muscle that
generates the maximum RMS value is the vast medialis of A
10 year old boy.
Figure 4.13 RMS value of the EMG signal making the
walking movement.
Figure 4.14 shows the RMS values of the patients,
obtained from the EMG signal of the study muscles, making
the movement of getting up from a chair, where it can see that
the muscle that generates the maximum RMS value is the vast
lateral in a young person of 25 years and in an adult of 48
years old.
Figure 4.14 RMS value of the EMG signal performing
the movement of getting up from a chair.
Figure 4.15 shows the RMS values of the patients,
obtained from the EMG signal of the study muscles, making
the movement of sitting in a chair, where, it can see that the
muscle that generates the maximum RMS value is the vast
lateral of an adult of 48 years old.
Figure 4.15 RMS value of the EMG signal making the
movement of sitting in a chair.
4.6 STANDARD DEVIATION
Figure 4.16 shows the standard deviation values of the
patients obtained from the EMG signal of the study muscles,
performing the walking movement, where it can see that the
muscle that generates the maximum value of standard
deviation is the vast medialis of A 10 year old boy.
Figure 4.16 Standard deviation of the EMG signal
making the walking movement.
Figure 4.17 shows the standard deviation values of the
patients, obtained from the EMG signal of the study muscles,
making the movement of getting up from a chair, where it can
see that the muscle that generates the maximum value of
standard deviation is the vast lateral of a 25 year old and a 48
year old.
Page 8
Figure 4.17 Standard deviation of the EMG signal
making the movement of getting up from a chair.
Figure 4.18 shows the standard deviation values of the
patients, obtained from the EMG signal of the study muscles,
making the movement of sitting in a chair, where it can see
that the muscle that generates the maximum value of standard
deviation is the vast lateral of an adult of 48 years.
Figure 4.18 Standard deviation of the EMG signal
making the movement of sitting in a chair.
5. RESULTS AND DISCUSSIONS
Initially, performance tests of the duplicate EMG signal
conditioning card performed to debug errors. Once verified
the correct operation of the card integrated with the data
acquisition card NI MyDAQ, and through the software of
LabVIEW could observe the EMG signal with its
characteristics.
A graphical user interface created in the LabVIEW
software that will carry out the respective analysis of the
statistical parameters mentioned above.
Once corrected the errors generated by the graphical
interface, preliminary tests performed with a thigh muscle
performing a contraction (see figure 5.1), in this case, the
rectus femoris selected.
Figure 5.1 Test of contraction with the rectus femoris
muscle.
Signal storage tests performed on a waveform chart
that will simulate data buffering (see Figure 5.2).
Figure 5.2 Recorded data.
Later tests performed on the restriction of the start and
end of the movement in interest and processing of data (see
Figure 5.3).
Figure 5.3 Restriction of the region of interest and
statistical results.
6. CONCLUSIONS
The application allows obtaining from the quadriceps
muscles, executing three types of movements, statistical data
of amplitude, maximum values, minimum values,
wavelength, RMS value and standard deviation of the EMG
signal.
The designed graphical interface allows obtaining the
characteristics of an electromyographic signal, given a
previously selected region of interest.
Using the Excel functions, from the application it is
possible to generate reports, as well as store the data of the
acquired signal and the obtained results.
Page 9
To avoid a saturation in data acquisition, we used the
National Instruments recommendation to use a ratio of 1/10
between the number of samples and the sampling frequency,
respectively.
During the walking movement, it was possible to see
that the data of the patients of 10 and 48 years were the
highest in relation to the patients of 18 and 25 years. This is
because the first patients did not have previous training doing
this type of movement.
When performing the movement of getting up and
sitting in a chair, analyzing the vastus lateralis and vastus
medialis muscle, it could evidence that there is an upward
growth in the value of the statistical data, except in the results
of wavelength.
7. BIBLIOGRAPHIC REFERENCES
[1] N. Massó, F. Rey, D. Romero, G. Gual, L.
Costa y A. Germán, Aplicaciones de la
electromiografía de superficie en el deporte,
Barcelona: apunts, 2010.
[2] J. G. Pickar, Efectos neurofisiológicos de la
manipulación vertebral, Iowa : The Spine Journal,
2002.
[3] G. De Luca, Fundamental Concepts in EMG
Signal Acquisition, Delsys Inc., 2003.
[4] R. R. Rubio, 03 Mayo 2016. [En línea].
Available:
http://www.encuentros.uma.es/encuentros53/aplicac
iones.html.
[5] J. Alvarado Reyes y C. Stern Forgach, Un
complemento al teorema de Nyquist, México:
Universidad Nacional Autonoma de México, 2010.
[6] J. Calle Plaza, Sistema inalámbrico y
multicanal para monitorización de señales biológicas
en tiempo real., Madrid: Universidad Rey Juan
Carlos., 2010.
[7] CONADIS, «Una mano para la inclusión,» 14
08 2015. [En línea]. Available:
http://prometeo.educacionsuperior.gob.ec/una-
mano-para-la-inclusion/.
[9] SENIAM, «Surface Electromyography for the
Non-Invasive Assessment of Muscles,» 2015. [En
línea]. Available: http://www.seniam.org/. [Último
acceso: 06 Enero 2015].
[10] J. V. Basmajian y C. J. De Luca, Muscles
Alive, Fifth ed., Baltimore: Williams and Wilkins,
1985.
[11] K. L. Moore, A. F. Dalley and A. Agur,
Anatomía con orientación clínica, Seventh ed.,
China: Wolters Kluwer Health, S.A., Lippincott
Williams & Wilkins, 2013.
[12] Ministerio de Salud Pública, «Consejo
Nacional para la Igualdad de Discapacidades,» 2015.
[En línea]. Available:
http://www.consejodiscapacidades.gob.ec/wp-
content/uploads/downloads/2015/04/registro_nacio
nal_discapacidades.pdf. [Último acceso: 29 Mayo
2015].
[13] Organización Mundial de la Salud, «Informe
mundial sobre la discapacidad,» 2011. [En línea].
Available:
http://www.who.int/disabilities/world_report/2011/
es/. [Último acceso: 10 Diciembre 2014].
[14] D. Graupe y W. K., Functional Separation of
EMG Signals via ARMA Identification Methods for
Prosthesis Control Purposes, IEEE Transactions on,
1975.
[15] S. FERGUSON y R. DUNLOP, Grasp
Recognition From Myoelectric Signals, New
Zealand, 2002.
[16] A. Chan y K. Englehart, Continuous
myoelectric control for powered prostheses using
hidden Markov models, IEEE Transactions on,
2005.
[17] E. J. Bronzino J., INTRODUCTION TO
BIOMEDICAL ENGINEERING, Elsevier, 2012.
[18] R. Churchill, Series de Fourier y Problemas de
Contorno, New York: McGraw-Hill, 1978 .
[19] M. R. Guglielminotti P, Effect of electrode
location on surface myoelectric signal variables: a
simulation study, Florence: 9th Int. Congress of
ISEK, 1992.
[20] Y. Singh, ANALYSIS AND
CLASSIFICATION OF EMG SIGNAL USING
LabVIEW WITH DIFFERENT WEIGHTS, Punjab,
India: Department of Electrical and Instrumentation
Engineering, 2013.
[21] E. J. C. R. I. P. E. J. P. Harold A. Romo,
Análisis de Señales EMG Superficiales y su ,
Medellin: Revista Avances en Sistemas e
Informática, 2007.
[22] G. D., Theory of communication., J Inst Elect
Eng, 1946.
[23] O. Tabernig, Eliminación de la respuesta
muscular evocada del electromiograma de superficie
de un músculo estimulado eléctricamente, Entre
Ríos, Argentina: Universidad Nacional de Entre
Ríos, 2004.
Page 10
[24] M. A. V. Aparicio, Técnicas instrumentales de
diagnóstico y evaluación en rehabilitación, Madrid:
J I Ibarra Lúzar Rehabilitación, 2005.
[25] WOLFRAM, «WOLFRAM
MATHEMATICA,» 15 Noviembre 20015. [En
línea]. Available:
http://www.wolfram.com/mathematica/new-in-
8/wavelet-analysis/visualize-wavelet-transform-
using-common-y-axis-pl.es.html.
[26] Á. Orozco, G. Betancourt y E. Suárez,
Determinación de movimientos a partir de señales
electromiográficas utilizando máquinas de soporte
vectorial., Pereira, Colombia: Universidad
Tecnológica de Pereira, 2004.
[27] M. Raez., M. Hussain. y F. Mohd-Yasin,
Techniques of EMG signal analysis: detection,
processing, classification and applications,
Malaysia, 2006.
[28] F. H. Maldonado, Modelos de gestión para
médicos de familia, Madrid: Ediciones Díaz de
Santos, 2005.
[29] D. M. M. Reyna, ELECTROMIOGRAFIA,
Guatemala: UNIVERSIDAD DE SAN CARLOS
DE GUATEMALA, 2015.
[30] R. B. Navarro, ELECTROMIOGRAFÏA, Entre
Ríos, Argentina: UNIVERSIDAD DE ALCALÁ,
2015.
[31] J. G. Webster, Encyclopedia of Medical
Devices and Instrumentation, vol. 1, New Jersey:
John Wiley & Sons, Inc., 2006.
[32] F. Cadena, «TARJETA DE
ACONDICIONAMIENTO PARA PRÓTESIS DE
RODILLA ACCIONADA POR SEÑALES
ELECTROMIOGRÁFICAS,» Ibarra, 2015.
[
[33]
DALCAME, «Dalcame. Grupo de
Investigación Biomédica,» 16 Julio 2016. [En línea].
Available:
http://www.dalcame.com/emg.html#.V4p6XUZ97I
U.