Analysis of Endocrine Disruption in Southern California Coastal Fish using an Aquatic Multi-Species Microarray Michael E. Baker 1,* , Barbara Ruggeri 2,3 , L. James Sprague 2 , Colleen Eckhardt 2 , Jennifer Lapira 2 , Ivan Wick 2 , Laura Soverchia 2,3 , Massimo Ubaldi 3 , Alberta Maria Polzonetti-Magni 3 , Doris Vidal-Dorsch 4 , Steven Bay 4 , Joseph R. Gully 5 , Jesus A. Reyes 6 , Kevin M. Kelley 6 , Daniel Schlenk 7 , Ellen C. Breen 8 , Roman Šášik 2,9 , Gary Hardiman 1,2,* 1 Dept of Medicine, University of California, La Jolla, CA, USA 2 BIOGEM, School of Medicine, University of California, La Jolla,, CA, USA 3 Department of Experimental Medicine and Public Health, University of Camerino, Italy, 4 Southern California Coastal Water Research Project, Costa Mesa, CA, USA 5 Los Angeles County Sanitation Districts, Whittier, CA 6 Environmental Endocrinology Laboratory, California State University, Long Beach, CA, USA 7 Department of Environmental Sciences, University of California, Riverside, CA, USA 8 Division of Physiology, University of California, La Jolla, CA, USA 9 Moore’s Cancer Center, University of California, La Jolla, CA, USA E-mail addresses Michael E. Baker [email protected]Barbara Ruggeri: [email protected]L. James Sprague: [email protected]Colleen Eckhardt: [email protected]Jennifer Lapira: [email protected]Ivan Wick: [email protected]Laura Soverchia: [email protected]Massimo Ubaldi: [email protected]Alberta Maria Polzonetti-Magni: [email protected]Doris Vidal-Dorsch: [email protected]Steven Bay: [email protected]Joseph R. Gully: [email protected]Jesus A. Reyes: [email protected]Kevin M. Kelley: [email protected]Daniel Schlenk: [email protected]Ellen C. Breen: [email protected]Roman Šášik: [email protected]Gary Hardiman: [email protected]Nature Precedings : hdl:10101/npre.2009.2823.1 : Posted 28 Jan 2009
Transcript
Analysis of Endocrine Disruption in Southern California Coastal Fish using an Aquatic
Multi-Species Microarray
Michael E. Baker1,*, Barbara Ruggeri2,3, L. James Sprague2, Colleen Eckhardt2, Jennifer
Lapira2, Ivan Wick2, Laura Soverchia2,3, Massimo Ubaldi3, Alberta Maria Polzonetti-Magni3,
Doris Vidal-Dorsch4, Steven Bay4, Joseph R. Gully5, Jesus A. Reyes6, Kevin M. Kelley 6,
Daniel Schlenk7, Ellen C. Breen8, Roman Šášik2,9 , Gary Hardiman1,2,*
1Dept of Medicine, University of California, La Jolla, CA, USA
2BIOGEM, School of Medicine, University of California, La Jolla,, CA, USA 3Department of Experimental Medicine and Public Health, University of Camerino, Italy,
4Southern California Coastal Water Research Project, Costa Mesa, CA, USA 5Los Angeles County Sanitation Districts, Whittier, CA
6Environmental Endocrinology Laboratory, California State University, Long Beach, CA, USA 7Department of Environmental Sciences, University of California, Riverside, CA, USA
8Division of Physiology, University of California, La Jolla, CA, USA 9Moore’s Cancer Center, University of California, La Jolla, CA, USA
Gasterosteiformes [sticklebacks] three spined stickleback
Zeiformes [dories]
Beryciformes [beryciforms]
Stephanoberyciformes [stephanoberyciforms]
Cyprinodontiformes [killifishes]
Beloniformes [beloniforms] medaka
Atheriniformes [silvers ides]
Mugiliformes [mullets]
Lophiiformes [anglerfishes]
Batrachoidiformes [toadfishes]
Gadiformes [cods] cod
Ophidiiformes [ophidiform eels]
Percopsiformes [trout-perches]
Polymixiiformes [beardfishes]
Lampridiformes [lampridiforms]
Myctophiformes [myctophiforms]
Aulopiformes [aulopiforms]
Ateleopodiformes [jellynose fishes]
Stomiiformes [stomiiforms]
Salmoniformes [salmon] trout salmon
Osmeriformes [smelts]
Esociformes [pikes]
Gymnotiformes [knifefishes]
Siluriformes [catfishes]
Characiformes [characiforms]
Cypriniformes [minnows] Danio carp
Gonorynchiformes [gonorynchiforms]
Clupeiformes [herrings]
Saccopharyngiformes [swallowers]
Anguilliformes [anguilliform eels]
Albuliformes [albuliforms]
Elopiformes [elopiforms]
Osteoglossiformes [bonytongues]
Amiiformes [bowfins]
Semionotiformes [gars]
Acipenseriformes [sturgeons]
Polypteriformes [bichirs]
1
2
Figure 1. Flatfish (Pleuronectiformes) in an evolutionary context. Adapted from the phylogeny at http://cichlidresearch.com/fish_html/cactinop.html (Nelson 2006). Tetraodontiformes (Fugu, Tetraodon) and Perciformes (cichlid, tilapia, sea bass, seabream, perch) are close phylogenetic relatives of Pleuronectiformes (turbot, halibut, sole), Box 1. Cypriniformes (zebrafish) are distant phylogenetic relatives, Box 2.
Nature Precedings : hdl:10101/npre.2009.2823.1 : Posted 28 Jan 2009
6
MATERIALS AND METHODS
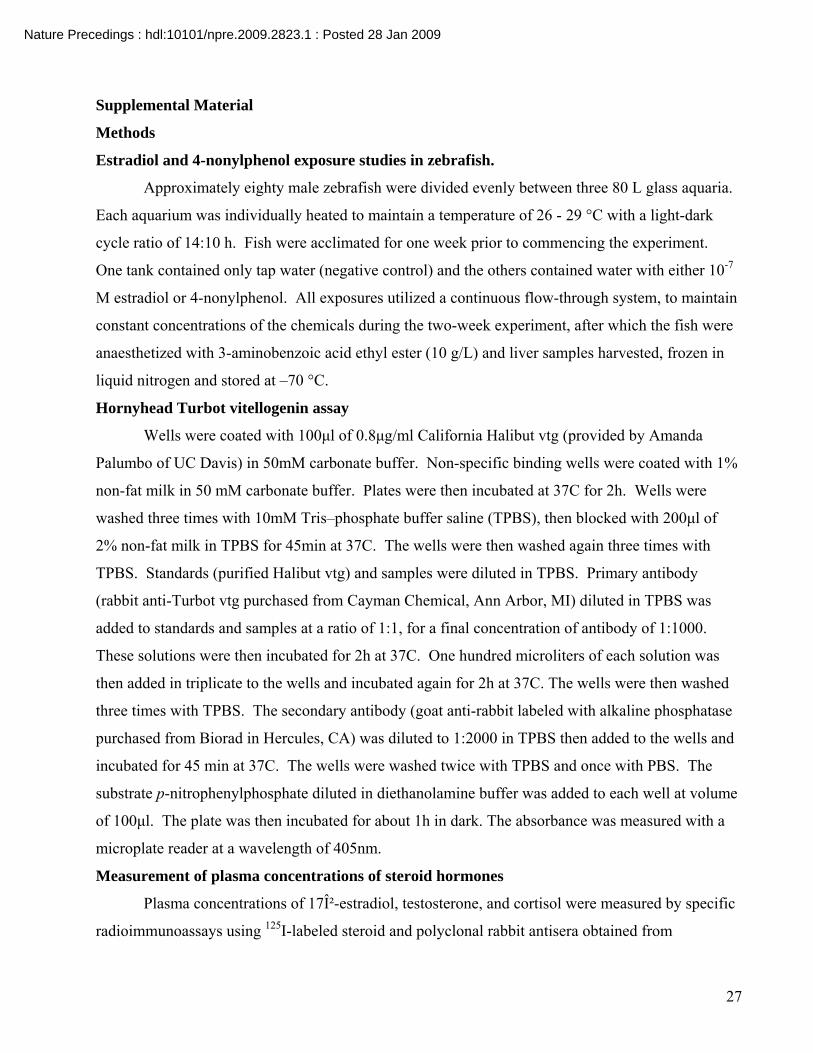
Estradiol and 4-nonylphenol exposure studies in zebrafish.
Details of exposure of zebrafish to estradiol and 4-nonylphenol are described in the
Supplemental Methods, See Supplemental Material.
Hornyhead Turbot vitellogenin and estradiol assay Details of the measurements of
vitellogenin, estradiol, cortisol and testosterone (Kelley et al. 2001; Rempel et al. 2006) are
described in the Supplemental Methods, See Supplemental Material.
Environmental hornyhead turbot sample collection
Male hornyhead turbot were collected off of the coast of Southern California as part of a
Southern California regional marine monitoring study (Bight Field Sampling and Logistics
Committee 2003). Livers from 3 individual fish from a station near Orange County Sanitation
District outfall and four individuals from a monitoring station near Los Angeles County
Sanitation District outfall were used for microarray analysis. These fish exhibited morphological
abnormalities, high levels of vitellogenin and estradiol, low levels of cortisol, and histological
abnormalities, such as the presence of immature oocytes (eggs) within the testis (Table 1).
Table 1. Characteristics of hornyhead turbots sampled. Individuals with morphological abnormalities induced by EDs were chosen for microarray experiments. Cortisol, estradiol, insulin like growth factor (IGF-1), thyroxine (T4), vitellogenin (VTG) levels are indicated. Morphological lesions (not caused during capture) and maturity stages are noted.
aldosterone (MR), thyroid hormone (THRA/TRα;THRB/TRβ), retinoids (RAR, RXR) and vitamin
D (VDR), and other nuclear receptors: farnesoid X receptor (FXR), and pregnane X receptor
(PXR), hydroxysteroid dehydrogenases and the enzymes involved in detoxification (CYP1A1,
CYP3A) were represented (See Supplemental Material, Table 1). This provided a diagnostic tool
for measuring altered expression of genes that are important in several endocrine pathways in
fish, which increased the scope of detection for the presence of endocrine disruptors in coastal
waters off of southern California.
Nature Precedings : hdl:10101/npre.2009.2823.1 : Posted 28 Jan 2009
10
A challenge in developing this platform was the paucity of available sequence
information for hornyhead turbot in GenBank. To overcome this problem, we searched
GenBank for sequences in other fish to find regions of sequence conservation that could used to
construct a microarray slide that could detect altered gene expression in multiple fish species.
Fortunately, the genomes of two Tetraodontiformes, Fugu and Tetraodon, have been sequenced.
Moreover, many genes from various Perciformes were in GenBank. Tetraodontiformes and
Perciformes are phylogenetically close to Pleuronectiformes as shown in Figure 1. Also of
importance was the extensive catalog of sequenced genes from zebrafish, which is distant from
of Pleuronectiformes. Sequences conserved in zebrafish, Fugu, Tetraodon and various
Perciformes were likely to be conserved in turbot. A schematic representation of the design and
application of the multi-species microarray to monitor xenobiotic exposure is shown in Figure 2.
Figure 2. Development of a Multi-Species Endocrine Microarray for environmental monitoring. Schematic representation of the design and application of a microarray based test to monitor xenoestrogen exposure.
Nature Precedings : hdl:10101/npre.2009.2823.1 : Posted 28 Jan 2009
11
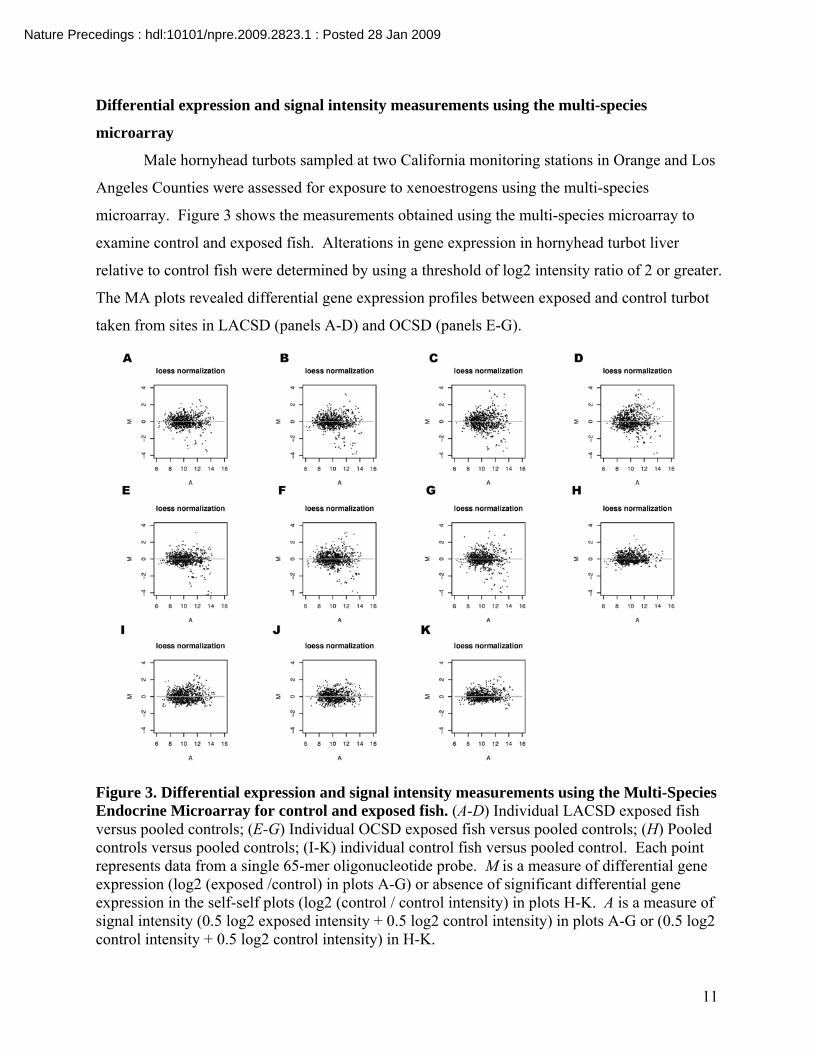
Differential expression and signal intensity measurements using the multi-species
microarray
Male hornyhead turbots sampled at two California monitoring stations in Orange and Los
Angeles Counties were assessed for exposure to xenoestrogens using the multi-species
microarray. Figure 3 shows the measurements obtained using the multi-species microarray to
examine control and exposed fish. Alterations in gene expression in hornyhead turbot liver
relative to control fish were determined by using a threshold of log2 intensity ratio of 2 or greater.
The MA plots revealed differential gene expression profiles between exposed and control turbot
taken from sites in LACSD (panels A-D) and OCSD (panels E-G).
Figure 3. Differential expression and signal intensity measurements using the Multi-Species Endocrine Microarray for control and exposed fish. (A-D) Individual LACSD exposed fish versus pooled controls; (E-G) Individual OCSD exposed fish versus pooled controls; (H) Pooled controls versus pooled controls; (I-K) individual control fish versus pooled control. Each point represents data from a single 65-mer oligonucleotide probe. M is a measure of differential gene expression (log2 (exposed /control) in plots A-G) or absence of significant differential gene expression in the self-self plots (log2 (control / control intensity) in plots H-K. A is a measure of signal intensity (0.5 log2 exposed intensity + 0.5 log2 control intensity) in plots A-G or (0.5 log2 control intensity + 0.5 log2 control intensity) in H-K.
Nature Precedings : hdl:10101/npre.2009.2823.1 : Posted 28 Jan 2009
12
We employed normal quantile (q-q) plots to examine more closely differences in
expression between the control and exposed fish (Figure 4). The q-q plots in Figure 4 examined
the distribution of the log2 (exposed/control) fold changes and the deviation from a normal
Gaussian distribution. When a data set is derived from the Gaussian distribution, the normal-
quantile plot is a straight line. The nature of plots in panels H-K shows that the observed log2
ratio between control fish, both pooled and individual controls is reasonably close to a Gaussian.
This distribution is due to individual variation in fish combined with unavoidable random
experimental errors.
Figure 4. Normal-quantile-quantile (q-q) plots of Multi-Species Endocrine Microarray data. Q-Q plots were constructed to determine if control and exposed fish data sets derived from populations have a common distribution. (A-D) Individual LACSD exposed fish versus pooled controls; (E-G) Individual OCSD exposed fish versus pooled controls; (H) Pooled controls versus pooled controls; (I-K) individual control fish versus pooled control. The q-q plots examined the distribution of the log2 (exposed/control) fold changes and the deviation if any from a normal Gaussian distribution. A 45-degree reference line was plotted. When the two data sets derived from a population with the same distribution, the points fall approximately along this reference line, as is the case with the control samples data populations, both pooled
Nature Precedings : hdl:10101/npre.2009.2823.1 : Posted 28 Jan 2009
13
and individual (I-K). When the two data sets derived from populations with different distributions, the data deviated from this reference line (A-G). Exposed samples differ from the control, with a sharp rise observed in the quantile curve at log2 ratio values of 2, indicating the presence of large log2 ratios and differences in gene expression.
When the log2 ratio is taken between exposed and control fish (panels A-G), the curved
ends of the q-q line indicate the presence of heavy tails in the distribution of log2
(exposed/control). The exposed samples clearly differ from the control samples. Specifically,
the sharp increase in the quantile curve at log2 ratio of about 2 suggests that genes with |log2
(exposed/control)| > 2 show significant regulation in the LACSD (panels A-D) and OCSD
(panels E-G) exposed fish compared to controls, in agreement with the MA plots in Figure 3.
Gene expression patterns in male turbot from Southern California coastal regions.
A heat map of selected genes that were either strongly down-regulated or up-regulated in
fish collected near the Orange County Sanitation District and Los Angeles County Sanitation
District outfalls relative to controls is shown in Figure 5. Fish sampled at both impacted sites
exhibited strong increases in expression of CYP3A, RXR, ERβ, Vtg2 and MR relative to control
fish. The VDR was up-regulated and transcripts encoding FXR and PPARα were down-regulated
compared to control fish. Additionally, thyroid receptor α and β mRNAs were down-regulated.
Nature Precedings : hdl:10101/npre.2009.2823.1 : Posted 28 Jan 2009
14
Figure 5. Gene expression profiling of turbots for exposure to endocrine disruptors. Gene expression changes were investigated in male turbot liver collected in two coastal monitoring stations in Orange County (OCSD) and Los Angeles County (LACSD) in California that are considered contaminated. Control fish were obtained from a monitoring station in Dana Point a relatively non-impacted area and maintained in a clean-water laboratory for four weeks. Fold changes observed between exposed and control fish are depicted as a heat map. LACSD and OCSD data derived from four and three independent biological replicate microarray experiments respectively. Quantitative RT-PCR analysis of turbot gene expression.
In order to use qRT-PCR to determine if the microarray data was accurately monitoring
changes in hepatic gene expression in the turbot, we cloned, via reverse transcriptase PCR,
Nature Precedings : hdl:10101/npre.2009.2823.1 : Posted 28 Jan 2009
15
partial fragments corresponding to highly conserved regions in the 28S rRNA, CYP3A, TRβ,
Vtg1 and Vtg2. Identities of the fragments were confirmed by DNA sequencing and sequence
data has been deposited in the NCBI Database (accession numbers pending). These short turbot-
specific sequences were used for SYBR green quantitative PCR experiments on individual turbot
from impacted regions. As shown in Figure 6, the greatest differences were observed with the
Vtg1 and Vtg2 transcripts, with greater than a 15-fold induction observed in one turbot. TRβ was
down-regulated in two control fish examined. CYP3A was up-regulated in three fish. Thus,
these qRT-PCR data validate the microarray analysis for these genes.
Moreover, vitellogenin 1 (Vtg 1) in control turbot is 0.0037 ng/μg protein, as determined
by an ELISA assay. Thus control male turbot have from 27-fold to 700-fold lower vitellogenin
levels that found turbot collected from polluted sites in Orange County and Los Angeles County
(Table 1). The agreement between vitellogenin measured with the ELISA assay and with the
qRT-PCR analysis (Figure 6) gives us confidence in qRT-PCR analyses of other genes in male
turbot taken from polluted sites.
Nature Precedings : hdl:10101/npre.2009.2823.1 : Posted 28 Jan 2009
Figure 6. Validation of Multi-Species
Endocrine Microarray
SYBR green qPCR for (A) Vitellogenin 1
(B) Vitellogenin 2 (C) Thyroid hormone
receptor β (D) CYP3A specific transcripts in
livers from control C and exposed E
hornyhead turbot. The 18S rRNA served as
an internal control for normalization. Mean
values from triplicate measurements were
plotted. Fold changes relative to control fish
are plotted. Vitellogenin 1 and Vitellogenin
2 transcripts were strongly up-regulated
(>15 fold) in one exposed fish. TRβ was
down-regulated in two control fish
examined. CYP3A was up-regulated in three
fish and down-regulated in one fish.
Gene expression patterns in zebrafish exposed to estradiol and 4 nonylphenol
Alterations in gene expression in zebrafish liver were investigated using the multi-species
microarray after exposing fish for two weeks to either the xenoestrogen 4-nonylphenol or estradiol at
Nature Precedings : hdl:10101/npre.2009.2823.1 : Posted 28 Jan 2009
17
10-7M. These experiments were carried out to determine if probes designed from conserved
sequences from Tetraodoniformes and Perciformes could hybridize to genes in zebrafish
(Cypriniformes), which are distant relatives of Pleuronectiformes (Figure 1).
Figure 7. Cross species applicability of the Multi-Species Endocrine Microarray Alterations in gene expression in zebrafish liver after a two week exposure to either 4-nonylphenol or estradiol using the multi-species endocrine microarray. Fold changes between exposed and
Nature Precedings : hdl:10101/npre.2009.2823.1 : Posted 28 Jan 2009
18
control fish are depicted as a heat map. Data derived from four independent biological replicate microarray experiments.
The data in the heat map in Figure 7 show that estradiol produced a broader and higher
response than 4-nonylphenol. Both treatments induced strong up-regulation of vitellogenin, several
nuclear receptors, proteins involved in oogenesis and in steroid metabolism. Amongst these, the
FXR transcript was the most up-regulated. Other transcripts that were strongly up-regulated
included the PR, the MR, PPARα, PXR, RXRα, TRα and GR. Other transcripts were down-regulated
by treatment with estradiol and 4-nonylphenol including ERα, the glucose transporter (GLUT), an
insulin-like growth factor binding protein (IGFBP) (Kelley et al. 2002) and the 11β-hydroxysteroid
dehydrogenase-type3 (11βHD3) (Baker 2004). Estradiol also induced a strong decrease in both
CYP3A and ERα expression. Although CYP3A expression was down-regulated in 4-nonylphenol
treated fish, the response was muted compared to estradiol.
DISCUSSION
There is an increasing demand for robust bioassays that provide a comprehensive assessment
of the effects of chemical contaminants in aquatic populations. Ideally suited for this purpose are
microarrays because they can detect changes in many genes in a single tissue sample, providing
snapshots of alterations in endocrine pathways in normal and contaminated fish. This knowledge
identifies gene families and biochemical pathways that are affected, in addition to those identifying
those that remain unaffected (Vilo and Kivinen 2001). A challenge in developing a microarray
platform to study alterations in gene transcription in sentinel coastal species was the paucity of
genomic sequence data. To overcome this obstacle, we constructed a 65mer oligonucleotide-based
microarray containing conserved sequences from genes of interest. The novelty of this platform is
that it used highly conserved probes from several fish species, permitting application of the array to
studies involving turbot and zebrafish. We used 65-mers to accommodate sequence differences,
polymorphic regions, and species specific codon usage. We reasoned that this approach would be
successful, as it has been previously demonstrated that oligonucleotides 50 nucleotides in length can
hybridize to RNA sequences that differ by 15% in their overall sequence (Li et al. 2005; Nielsen et
al. 2003). The array focused on key targets with defined roles in endocrine pathways and processes,
in addition to biomarkers for contaminant exposure.
Nature Precedings : hdl:10101/npre.2009.2823.1 : Posted 28 Jan 2009
19
The multi-species microarray assessed alterations in hepatic gene expression in male
hornyhead turbots that were collected during a regional marine monitoring study at two monitoring
stations in the Southern California Bight 2003 Survey that are considered impacted by pollution
(Bight Field Sampling and Logistics Committee 2003). The assessed fish had been previously
examined for exposure to xenoestrogens using the classical biomarker vitellogenin, measurements of
plasma levels of testosterone and estradiol, as well as anomalies in gonadal morphology (Deng et al.
2007; Rempel et al. 2006).
Microarray analysis of turbot exposed to pollutants.
Microarray analysis detected differences in hepatic gene expression patterns in exposed
turbot from the two monitoring areas compared to control individuals. Exposed turbot showed up-
regulation of CYP3A and RXR. Interestingly, thyroid receptors α and β were down-regulated in fish
from both monitoring areas indicating the presence of compounds that are able to interfere with the
thyroid response.
Another example of the utility of microarray analysis of fish from polluted areas can be seen
in a study of male flounder collected from an impacted site (Tyne) and a reference site (Alde) in the
United Kingdom (Williams et al. 2003). Eleven transcripts were differentially expressed between
male flounder collected from an impacted site relative to a reference site. Seven transcripts were
more highly expressed in the Tyne male fish (CYP1A1, UDPGT, α-2HS-glycoprotein,
dihydropyrimidine dehydrogenase, Cu/Zn SOD, aldehyde dehydrogenase and paraoxonase), while
four transcripts (Elongation factor 1 (EF1), EF2, Int-6 and complement component C3 mRNA) were
found to be significantly less abundant in the Tyne male fish (Williams et al. 2003).
Microarray analysis of zebrafish exposed to estradiol and 4-nonylphenol
We observed differences between estradiol and 4-nonylphenol in the strength of the estrogen-
like response, which we attribute to 4-nonylphenol having a low affinity for the ER (Kuiper et al.
1997). The data on gene expression in zebrafish provide another validation of the multi-species
microarray and demonstrate its potential for investigating gene expression in Pleuronectiformes and
Perciformes.
We found up-regulation of vitellogenin, PR, RXR and ERβ transcripts in male zebrafish
exposed to both estradiol and 4-nonylphenol. Up-regulation of vitellogenin and PR are well-
established responses to estrogens. And RXR has been shown to be upregulated by bisphenol A, an
estrogenic chemical in murine embryos (Nishizawa et al. 2005). ERβ expression, has previously
Nature Precedings : hdl:10101/npre.2009.2823.1 : Posted 28 Jan 2009
20
been shown to be increased upon exposure to xenoestrogens in zebrafish (Islinger et al. 2003) and to
4-nonylphenol in many fish species (Soverchia et al. 2006). Up-regulation of ERβ was reported
following exposure to alkylphenols in juvenile goldfish, medaka, rainbow trout and zebrafish (Inui et
al. 2003; Islinger et al. 2003; Soverchia et al. 2006; Vetillard and Bailhache 2006) indicating that
that it can be considered a biomarker for xenoestrogen exposure.
ERα expression was repressed with both estradiol and 4-nonylphenol treatments. Distinct
patterns of expression for ERα and ERβ have been documented in fish (Choi and Habibi 2003), but
differences in the interaction of xenoestrogens with the two subtypes of estrogen receptors have not
been well characterized.
Following exposure to 4-nonylphenol a modest repression of CYP3A was observed in
zebrafish. A strong repression of CYP3A mRNA however was observed following estradiol
exposure. Similar results have been reported in trout (Pajor et al. 1990), suggesting an important
role of the sex hormones in CYP3A expression, which is further supported by the sexually dimorphic
expression of CYP3A genes reported in many fish species (Hasselberg et al. 2004; Hegelund and
Celander 2003).
Interestingly, expression of the PXR, a sensor for xenobiotics (Moreau et al. 2008; Xie et al.
2000), was induced by both compounds. PXR mediates the effects of 4-nonylphenol on the
activation of CYP3A genes in mouse, rat and humans (Masuyama et al. 2000; Masuyama et al. 2002).
In juvenile Atlantic salmon, increases in PXR and CYP3A transcript levels were observed following
4-nonylphenol exposure suggesting a similar mechanism to that reported in the mammalian systems
(Meucci and Arukwe 2006). Furthermore hepatic expression of CYP3A is induced by the
organochlorine pesticide methoxychlor in male largemouth bass Micropterus salmoides (Blum et al.
2008).
We also found strong activation of FXR, PPAR and RXRα expression in zebrafish exposed to
estradiol or 4-nonylphenol, which indicates xenoestrogens can affect a variety on physiological
pathways. PPAR is involved in the regulation of lipid metabolism-related genes and its interaction
with xenobiotic compounds is thought to be responsible for alterations in adipogenesis and diseases
such as obesity in humans (Grun and Blumberg 2006). FXR is strongly activated by bile acids and
serves as a central coordinator for bile acid biosynthesis metabolism and transport. Possible
interaction of xenobiotics with FXR could lead to changes in bile acid homeostasis and hepatic
toxicity. Our finding that that FXR was up-regulated in zebrafish exposed to estradiol and 4-
Nature Precedings : hdl:10101/npre.2009.2823.1 : Posted 28 Jan 2009
21
nonylphenol has not been reported previously in any fish. This finding demonstrates the utility of
microarrays in uncovering the effects of hormones and chemicals, which can subsequently be used
to construct a profile for exposure to a given chemical.
Of practical importance for the analysis of zebrafish exposed to estradiol and 4-nonylphenol
is that zebrafish belongs to the order Cypriniformes and is phylogenetically distant from
Tetraodoniformes, Perciformes and Pleuronectiformes, whose sequence information were used to
guide the design of the array probes. Thus, the data obtained from the zebrafish experiments
indicated that the multi-species microarray possesses cross-species utility.
CONCLUSIONS
The results obtained using the multi-species microarray to assess male hornyhead turbots in
two coastal areas considered impacted by pollution revealed the presence of a mixture of endocrine
disruptors containing xenoestrogens and most likely xenobiotics capable of interacting with the
thyroid system. These results highlight the utility of the multi-species microarray as a diagnostic for
the presence of endocrine disruptors in the aquatic environment. The broad use of the multi-species
microarray to study the effects of environmental chemicals on fish was demonstrated in its
application to zebrafish exposed to chemicals in a laboratory and a sentinel species (Pleuronichthys
verticalis) collected near municipal wastewater discharge sites. The results presented here
demonstrate the feasibility adding other genes of interest in fish physiology to a second generation
multi-species microarray for assessing effects in exposed fish.
ACKNOWLEDGEMENTS: This work was supported in part by NIH/NIDDK - Award 1 P30
DK063491-03, a contract from OCSD and LACSD administered via SCCWRP and USC Sea Grant
Program (NOAA grant #NA06OAR4170012, CFDA No. 11.417, Project CE-17). The authors
would like to thank the assistance of the Los Angeles County Sanitation Districts and Orange
County Sanitation District. Partial funding for this project was provided by the Los Angeles County
Sanitation Districts. The multi-species microarray was jointly developed in the Baker