THE IMPACT OF RESTRICTIONS AND ENTITLEMENTS ON THE INTEGRATION OF FAMILY MIGRANTS July 2013 HIRANTHI JAYAWEERA Centre on Migration, Policy and Society (COMPAS) University of Oxford Analysis of Existing Quantitative Data on Family Migration: United Kingdom
Transcript
THE IMPACT OF RESTRICTIONS AND ENTITLEMENTS ON THE INTEGRATION OF FAMILY MIGRANTS
July 2013
HIRANTHI JAYAWEERA Centre on Migration, Policy and Society (COMPAS)
University of Oxford
Analysis of ExistingQuantitative Data on Family Migration: United Kingdom
ii
Analysis of Existing Quantitative Data on Family Migration:
research/user-guide-immig-statistics?view=Binary 4 Administrative data also refers to visa issuances so may not be an accurate estimate of actual arrivals, thus
leading to higher numbers than in the IPS survey of arrivals. http://www.homeoffice.gov.uk/publications/science-
female migrants, like male migrants, are most likely to go to London, and the South East
within England. In the South East of England, and to a lesser extent, Yorkshire and the
Humber, women outnumber men. These patterns possibly relate to the greater extent of
family migrant dispersal to areas such as Bradford in Yorkshire, and London (Jayaweera &
Choudhury 2008).
Figure 6: Sex distribution in areas of destination of migrants, GB counties and English regions, 2010
Source: Long-Term International Migration, estimates from International Passenger Survey:
annual data, 2010, Table 3.07 (ONS)9
3.3.4 In-country switching
UKBA management data also shows that there is an extent of ‘switching’ within the UK,
from other visa categories to a family settlement route. In 2010, there were 16,800 migrants
switching in this way, most from study (6,900) and work (5,000) routes, mostly through
9 With thanks to Carlos Vargas-Silva, Compas, for extracting the data on which the chart is based.
-
100
200
300
400
500
600
Tho
usa
nd
s
Areas of destination
Sex distribution in areas of destination of migrants, GB countries and English regions, 2010
Females
Males
12
marriage. A very small number were also switching from general or family visit visas.10 There
was also a significant number of children (2,600 under age 18) among those with no
previous immigration history recorded; this number includes children born in the UK, for
instance to temporary migrants (Home Office 2011).
3.4 Settlement in the UK
This section deals with patterns of grants of settlement – i.e. indefinite leave to remain in
the UK without being subject to immigration restrictions - to family migrants who have
gained entry to the UK or extensions to previously granted entry. Understanding settlement
patterns of family migrants overall is not always straight-forward, as generally dependants of
other migrant categories, such as workers or students, are grouped with the ‘main’
applicants rather than considered as part of family migrant settlement, the latter often
referring to family members of British citizens or permanent residents (Blinder 2012c).
10 This pathway to switching is no longer allowed in accordance with the recent changes to family migration
rules.
13
Figure 7: Settlements by basis of grant, 1997-2011
Figure 7 shows time trends in settlement patterns of different migrant categories over the
last decade and a half. There is considerable fluctuation over time including for family
migrants, partially reflecting government policy changes on settlement and changes in time
taken to process applications, but numbers of family members (of British citizens or
permanent residents) granted settlement in the past few years have been decreasing, for
example, from 58,822 in the year ending June 2011 to 47,401 in the year ending June 2012
(Home Office 2011). Family members constituted 32% of all settlement grants in 2011. But if
combined with dependants of other migrant categories this percentage rises to 61% (Blinder
2012c). Analysis of administrative data from UKBA databases shows that among family route
migrants granted visas in 2004, 55% had achieved settlement after five years, by 2009. This
percentage is higher than the 29% arriving on a work route leading to settlement (mainly
high skilled workers) who achieved settlement after five years or the 3% arriving as students
who achieved settlement after five years. A backward view of ‘migrant journeys’ also shows
the importance of the family route towards gaining settlement: 34% of migrants granted
14
settlement in 2009 did so directly through the family route compared with 31% directly
through a work (leading to citizenship) route (Achato et al 2010).
Among family route and dependant migrants gaining settlement, partners (including civil or
unmarried partners) form the biggest component, followed by children. In 2011, 59% were
partners (and twice as many female as male partners), 35% were children, 2% were parents
or grandparents, and 4% were other relatives. Among partners gaining settlement at least
87% were partners of British citizens (Blinder 2012c).
15
Table 1: High volume nationalities in the family route with end-of-year immigration status
End of 2009 immigration status
Migrants in 2004
cohort
%
dependants
% with
expired
LTR*
% with valid
LTR
% with
settlement
Pakistani 9,650 8 16 3 81
Indian 6,730 13 21 9 70
Australian 5,840 2 74 16 10
American 5,580 4 69 1 30
South
African 3,380 10 41 28 31
New
Zealander 2,850 2 70 19 11
Bangladeshi 2,230 13 12 2 86
*LTR=Leave to remain
Source: Achato et al 2011. Table S2.
From the analyses of migrant journeys, Table 1 shows how the main family route migrant
nationalities entering the UK in 2004 fared in terms of settlement after five years, in 2009.
As shown above, although 55% of all family route migrants arriving in the 2004 had gained
settlement by 2009, migrants originating in different countries demonstrated different
patterns. The majority of South Asians - Bangladeshis (86%), Pakistanis (81%) and Indians
(70%) - had achieved settlement, whereas only 30% of Americans and one in ten of
Australians had done so (Achato et al 2011). The historical colonial relationship between
the UK and countries of the Indian subcontinent that is associated with the existence of
settled South Asian populations, including second generation British citizens, and the
continuation of ‘homeland’ marriages, account for these settlement patterns among South
16
Asian nationalities (Charsley et al 2011). Charsley et al also show that there is a greater
gender balance in South Asian marriage migration than among marriage partners generally as
shown above, with a sizeable proportion of husbands and male fiancés within the category.
Among both US and Australian family migrants there may be a combination of partners
joining settled former work permit holders or marrying British citizens. Lessening popularity
of the UK for settlement may account for smaller proportions achieving settlement as
shown in Table 1 (Charsley et al 2011).
17
4. INTEGRATION OUTCOMES OF FAMILY MIGRANTS IN
THE UK
The second part of this report presents the results of secondary analysis of the UK Labour
Force Survey (LFS), January to March quarter of 2010 (see Section 2.2). In accordance with
data availability in the survey, some key indicators of labour market incorporation are
discussed, together with housing options, as an indicator of access to public services.
4.1 Sample characteristics
There were 9,845 people who responded to the question on the main reason for coming to
the UK. Of these around 42% came for family reasons – family formation and family
reunification. The percentage of those coming to get married or form a civil partnership
(5.9%) was around a third of the percentage of those coming to the UK as a spouse or
dependent of a UK citizen (17.6%) or of those coming as a spouse or dependent of
someone coming to the UK (18.9%). To avoid presenting results for relatively small
numbers, all analyses presented in this paper combine the above three categories into a
composite category called ‘family migrants’. The majority of people who came to the UK
for other than family reasons (i.e. employment, study, seeking asylum, other reasons not
stated) came for employment, and formed a quarter of the sample responding to the
question about the main reason for coming to the UK. People coming to the UK for all
other than family reasons have also been combined into one category named ‘other
migrants’ for the purposes of analysis, and presentation in this paper.
Tables 2 and 3 set out some basic characteristics of family migrants in comparison with
other migrants. It can be seen in Table 2 that family migrants are a longer resident
population than other migrants. Among people responding to the question on reason for
migration 30% among family migrants and 34% among other migrants are third country (i.e.
non-EEA) nationals. Family migrants in general are also more likely than other migrants to
be UK nationals: a little over half compared to a third of other migrants. A little over three
fifths of family migrants are female compared to a little over two fifths among other
18
migrants. Nearly a fifth are children, and overall a smaller percentage is aged between 18
and 44 (45.8%) compared to other migrants (61.6%).
Table 3 shows that South Asian nationals (Indian, Pakistani, Bangladeshi) are strongly
represented among family migrants, whereas there is more diversity among other migrants.
While not presented in the tables, there are interesting nationality differences with regard
to children among family migrants: in the top three family migrant nationalities, there are
more children among those with US nationality - around 27% compared to around 20%
among Indians and 12% among Pakistanis. It is important to bear in mind all these specific
characteristics of family migrants in understanding their integration experiences.
Table 2: Characteristics of family migrants and other migrants, January - March 2010, percentages*
Family migrants
(n= 2,449,872)+
Other migrants
(n= 3,648,926)+
Time period of arrival
Before 2000 59.0 47.2
2000 onwards 41.0 52.8
Nationality 1
Third country (non-
EEA) national
29.9 34.2
EEA national# 70.1 65.9
Nationality 2
UK national 53.8 33.6
Non-UK national 46.2 66.4
Sex
Male 37.7 55.6
Female 62.3 44.4
Age groups
Under 18 18.4 4.2
18-24 8.0 10.8
25-44 37.8 50.8
45-59 21.7 17.5
60 and over 14.1 16.7
19
*Population weights have been applied.
+ Population estimate before any missing values in particular variables have been taken out.
# Includes UK nationals
Table 3: Top five non-EU nationalities among family migrants and other migrants, January – March 2010, percentages*
Family migrants (n= 2,449,872)+ Other migrants (n= 3,648,926)+
Nationalities % Nationalities %
India 4.6 India 4.1
Pakistan 3.2 United States 2.0
United States 2.4 South Africa 1.9
Bangladesh 1.3 China 1.8
South Africa 1.0 Nigeria 1.3
*Population weights have been applied.
+ Population estimate before any missing values have been taken out.
Table 4 sets out the characteristics of third country (non-EEA) national family migrants
and other migrants. Percentages of recent migrants are similar in both groups, and form a
majority, around three quarters. There are more women among family migrants compared
to other migrants, and it is overall a younger population with around a third under age 25
compared to a fifth of other migrants.
20
Table 4: Characteristics of TCN family migrants and other TCN migrants, January – March 2010,
percentages*
Family migrants (n=
730,724)+
Other migrants (n=
1,244,669)+
Time period of arrival
Before 2000 25.6 25.5
2000 onwards 74.4 74.6
Sex
Male 34.8 58.7
Female 65.2 41.3
Age groups
Under 18 24.4 5.0
18-24 8.7 14.9
25-44 45.3 60.6
45-59 14.4 11.5
60 and over 7.3 7.9
*Population weights have been applied.
+ Population estimate before any missing values in particular variables have been taken out.
4.2 Indicators of integration
4.2.1 Comparing TCN family migrants with other TCN migrants
Table 5 shows some labour market characteristics of TCNs migrating for family reasons
compared to those migrating for other reasons such as to work, to study, to seek asylum
and as visitors.
21
Table 5: Key indicators of labour market incorporation for TCN family migrants and other TCN
migrants, January – March 2010, percentages*
Family migrants
(n=730,724)+
Other migrants
(n=1,244,669)+
Economic activity1
In employment 48.9 59.8
ILO unemployed 7.2 6.4
Inactive 44.0 33.8
Employment status2
Employee 90.1 89.7
Self-employed 9.8 9.9
Government Scheme 0.0 0.2
Unpaid family worker 0.2 0.2
Highest qualification
Higher 23.6 38.7
Secondary 18.7 14.3
Other 40.5 35.5
None 17.2 11.5
Occupational level3
Managerial/professional 31.3 52.6
Intermediate 17.5 12.9
Lower 23.2 16.0
Elementary 28.0 18.4
*Population weights have been applied. Percentages may not add up to 100 because of
rounding.
+ Population estimate before any missing values in particular variables have been taken out.
1 Subset 16 and over.
2 Among those in employment.
22
3 ‘Managerial/Professional’ combines Managers and senior officials, Professional, and
Associate professional and technical occupations; ‘Intermediate’ combines Administrative
and Secretarial and Skilled trades occupations; ‘Lower’ combines Personal service and Sales
and customer service occupations; ‘Elementary’ combines Process, plant and machine
operatives and Elementary occupations.
As Table 5 shows in terms of incorporation into the labour market as an indicator of
integration, TCN migrants coming to the UK for family reasons are not considerably
different from those coming to the UK for other reasons once demographic differences
such as sex and age are taken into account (see Table 4). Family migrants are less likely to
be in employment overall and more likely to be inactive than other migrants, but
unemployment levels are only slightly higher. However, among the UK population as a
whole unemployment rates are lower (5%) than among both categories, but especially family
migrants. For those in employment, the characteristics (around 90% employees and nearly
10% self-employed) are almost identical, and also relatively similar to the population as a
whole (86.6% employees, 13% self-employed, not shown in the table). However a lower
percentage of family migrants have tertiary qualifications and a higher percentage have no
qualifications than other migrants. These patterns clearly impact on occupational levels, with
a lower percentage of family migrants in higher occupational levels and a higher percentage
in elementary jobs.
Other indicators of labour market incorporation also suggest some similarities between
TCN family migrants and other TCN migrants, although the different ways the different
categories are connected to the labour market need to be taken into account in interpreting
patterns. Among family migrants who are employees, the most common way their current
job was obtained was through ‘replying to an advertisement’ (25.4%), closely followed by
through ‘hearing from someone’ who was already employed in the workplace (24.6%). The
top two methods of obtaining their current job among other migrants who are employees
were the same: replying to an advertisement (25.8%) and word of mouth (25.4%). However,
a larger percentage of other migrants (22.5%) said they had obtained their job through a
‘direct application’ compared to 16.4% of family migrants. But twice the proportion of family
migrants than other migrants (9.4% vs 4.5%) said they had obtained their job through a job
centre. Among survey respondents looking for work, the main method used by both family
23
and other migrants was stated as ‘studying situations vacant in newspapers/journals’ (45.8%
and 38.7% respectively) followed by ‘visiting a job centre’ (23% and 17.6% respectively).
These mainstream methods were favoured over using existing networks of kin and friends,
particularly by family migrants (2.5% compared to 9.4% of other migrants ).
4.2.2 Labour market integration outcomes of TCN family migrants according to key
characteristics (compared to other TCN migrants)
4.2.2.1 Time period of arrival
In keeping with Work Package 2 ‘new arrivals’ are defined as migrants who have entered the
country from 2000 onwards. Table 6 shows selected labour market indicators of family
migrants and of other migrants who arrived before 2000 in comparison with those who
arrived from 2000 onwards. Among family migrants the more recent arrivals are less likely
to be employed and more than twice as likely to be unemployed than earlier arrivals; but
inactivity levels are similar. While over nine tenths of recent family migrant arrivals in
employment are employees, they are far less likely to be self-employed than earlier arrivals,
and no one is in a government employment scheme. These characteristics suggest that more
recent arrived family migrants are overall less well-integrated into the labour market than
are earlier arrived family migrants, suggesting that for family migrants length of residence has
impact on labour market integration.
Table 6 also shows that occupational levels of family migrants are affected by length of
residence. Those who migrated before 2000 are occupationally better placed than more
recent migrants, particularly with a higher percentage in professional and managerial jobs
although percentages in elementary jobs are similar. The observed differences may partly be
related to a higher percentage of better qualified people among earlier migrants as well as
the important issue of recognition of qualifications. Nearly half of recent arrivals have ‘other’
qualifications, possibly gained outside the UK, compared to around a quarter among earlier
arrivals. We will consider the relationship between educational qualifications and
occupational levels in more detail later in this paper.
There are important differences by time period of arrival between family migrants and
migrants who came to the UK for other reasons as well. Recent arrivals among other
migrants overall appear better integrated in the labour market than recently arrived family
migrants. They have the highest percentage of being in employment, and are less likely to be
24
unemployed or be inactive than recent family migrants. Qualifications and occupational
levels are highest among longer resident other migrants.
Table 6: Key indicators of labour market incorporation for TCN family migrants and other TCN migrants by length of residence, January – March 2010, percentages*
Family migrants
(n=730,724)+
Other migrants
(n=1,244,669)+
Arrival
before 2000
Arrival 2000
onwards
Arrival
before
2000
Arrival
2000
onwards
Economic activity1
In employment 52.8 47.3 57.4 60.6
ILO unemployed 3.8 8.7 4.4 7.2
Inactive 43.4 44.0 38.2 32.2
Employment status2
Employee 81.9 93.7 83.3 91.9
Self-employed 17.6 6.3 16.1 7.8
Government Scheme 0.0 0.0 0.3 0.1
Unpaid family worker 0.5 0.0 0.2 0.2
Highest qualification
Higher 26.2 22.3 37.9 39.1
Secondary 27.5 15.1 18.0 13.3
Other 24.7 47.6 31.0 36.9
None 21.7 15.0 13.1 10.8
Occupational level3
Managerial/professional 39.8 26.8 56.8 51.2
Intermediate 13.8 19.6 14.5 12.3
Lower 19.2 25.3 10.1 18.0
Elementary 27.2 28.3 18.6 18.5
25
*Population weights have been applied. Percentages may not add up to 100 because of
rounding.
+ Population estimate before any missing values in particular variables have been taken out.
1 Subset 16 and over.
2 Among those in employment.
3 ‘Managerial/Professional’ combines Managers and senior officials, Professional, and
Associate professional and technical occupations; ‘Intermediate’ combines Administrative
and Secretarial and Skilled trades occupations; ‘Lower’ combines Personal service and Sales
and customer service occupations; ‘Elementary’ combines Process, plant and machine
operatives and Elementary occupations.
If methods of finding employment are considered among family migrants by time period of
arrival, the top method for obtaining their current job among earlier arrivals (before 2000)
was through a private employment agency (37.2%) followed by replying to an advertisement
(24.5%). For more recent arrivals (2000 onwards) the most common methods were hearing
from friends (26.2%) and replying to an advertisement (25.7%) while only a small percentage
were successful through a private employment agency (5.8%).
However, 11.9% of recent TCN family migrants used the job centre compared to none
among those who came to the UK before 2000, and the former were more likely than the
latter to have found their job through a direct application (18.5% vs 8.5%). These findings
suggest that longer established family migrants may be relying on personal networks and
greater knowledge of the labour market to find work compared to the more formal,
institutional methods used by recent migrants. Among other migrants too, the top two
methods used for finding their current job (advertisement and word of mouth) cut across
length of residence. However, more recent arrivals were more than twice likely than earlier
arrivals to have applied directly; this is commensurate with their predominantly ‘non-family’
reasons for coming to the UK.
Among family migrants looking for work, the largest proportion in both groups (47.8% of
recent arrivals and 37.7% of earlier arrivals) looked at situations advertised as vacant in
newspapers or journals, and visiting a job centre was favoured more by recent than longer-
established respondents (24.2% compared to 18.1%). The most common method of looking
for work among other migrants too was studying advertisements, irrespective of length of
26
residence (nearly two fifths in both categories) and there were no great differences in
relation to other methods.
4.2.2.2 Sex
If we look at labour market indicators by sex (Table 7) we can see that women among
family migrants are less likely to be employed, and more than twice as likely to be inactive,
than men. For those who are in employment, similar percentages are employees or self-
employed. Surprisingly very few women say that they are unpaid family workers. Table 7
also shows that women are almost as likely as men to have higher qualifications, but are
more likely to also have ’other’ qualifications or no qualifications. Commensurate with
qualifications women are no less likely than men to be in higher level occupations.
Interestingly while women are more than twice as likely as men to be in ‘lower’ occupations
(which probably partly reflects the service occupations in this category – see footnote to
Table 7), they are far less likely to be in ‘elementary’ occupations, that is, those at the
bottom end of the occupational structure, perhaps because some of these jobs are male-
dominated. To an extent these patterns are the result of the distribution of men and
women, whether migrants or not, in a gendered labour market.
If we compare with other migrants, women other migrants are more likely to be employed
and less likely to be inactive than women family migrants. This is probably because many
women migrating for non-family reasons come for employment – and this is also borne out
in the greater extent of higher qualifications among women other migrants - although the
balance between employees and self-employed is largely similar in both groups. Overall
among other migrants as among family migrants a similar gendered occupational distribution
can be seen, with more women than men in service occupations, while, as among family
migrants, women and men other migrants have similar percentages in
professional/managerial occupations.
27
Table 7: Key indicators of labour market incorporation for TCN family migrants and other TCN migrants by sex, January – March 2010, percentages*
Family migrants
(n=730,724)+
Other migrants
(n=1,244,669)+
Men
Women
Men Women
Economic activity1
In employment 68.0 40.7 64.5 53.0
ILO unemployed 9.0 6.4 7.0 5.6
Inactive 23.0 52.9 28.5 41.4
Employment status2
Employee 90.1 90.0 88.6 91.4
Self-employed 9.9 9.7 11.1 8.0
Government Scheme 0.0 0.0 0.2 0.2
Unpaid family worker 0.0 0.3 0.2 0.3
Highest qualification
Higher 24.9 23.0 38.3 39.3
Secondary 24.2 16.3 12.9 16.4
Other 37.8 41.7 37.7 32.4
None 13.2 18.9 11.1 12.0
Occupational level3
Managerial/professional 30.7 31.7 53.2 51.6
Intermediate 18.2 16.9 15.3 8.7
Lower 13.7 30.1 9.8 26.9
Elementary 37.3 21.3 21.7 12.7
*Population weights have been applied. Percentages may not add up to 100 because of
rounding.
28
+ Population estimate before any missing values in particular variables have been taken out.
1 Subset 16 and over.
2 Among those in employment.
3 ‘Managerial/Professional’ combines Managers and senior officials, Professional, and
Associate professional and technical occupations; ‘Intermediate’ combines Administrative
and Secretarial and Skilled trades occupations; ‘Lower’ combines Personal service and Sales
and customer service occupations; ‘Elementary’ combines Process, plant and machine
operatives and Elementary occupations.
4.2.2.3 Nationality
Table 8 gives indicators of labour market incorporation for family migrants in the top three
non-EU nationalities. These patterns are interesting to consider because they represent
quite widely divergent countries – e.g. in terms of wealth – from which family migrants
originate. The results show very interesting, divergent patterns too. If we look at labour
market participation, family migrants with US nationality are the most likely to be in
employment, with just over a fifth self-employed, and much less likely to be unemployed
compared to Indians, and particularly Pakistanis. Nearly three fifths of Pakistani family
migrants are inactive. Those Pakistanis in employment are also three times more likely to be
self-employed as are Indians. Overall US nationals are better qualified, and with a smaller
proportion with ‘other’ qualifications, than either Indians or Pakistanis. Nearly a third of
Pakistanis have no qualifications. These differences in educational levels appear to translate
to occupational levels, with US nationals far more likely than especially Pakistanis, but even
compared to Indians, to be at higher levels of the occupational structure. Over 60% of
Pakistanis are to be found at the bottom of labour market and occupational structure.
29
Table 4: Key indicators of labour market incorporation for family migrants in the top three non-EU nationalities, January – March 2010, percentages*
India (n=
112,365)+
%
Pakistan
(n=78,656)+
%
United
States
(n=58,732)+
%
Economic activity1
In employment 54.4 33.4 69.5
ILO unemployed 7.3 8.2 2.4
Inactive 38.3 58.4 28.1
Employment status2
Employee 92.8 73.7 78.0
Self-employed 7.2 24.2 22.0
Unpaid family worker 0 2.1 0
Highest qualification
Higher 32.8 10.7 42.2
Secondary 5.4 12.9 14.9
Other 47.5 44.6 37.1
None 14.3 31.7 5.9
Occupational level3
Managerial/professional 28.9 11.6 55.2
Intermediate 18.7 12.5 22.8
Lower 18.0 13.9 5.5
Elementary 34.4 62.0 16.5
*Population weights have been applied. Percentages may not add up to 100 because of
rounding.
+Population estimate before any missing values in particular variables have been taken out.
1 Subset 16 and over.
2 Among those in employment.
30
3 ‘Managerial/Professional’ combines Managers and senior officials, Professional, and
Associate professional and technical occupations; ‘Intermediate’ combines Administrative
and Secretarial and Skilled trades occupations; ‘Lower’ combines Personal service and Sales
and customer service occupations; ‘Elementary’ combines Process, plant and machine
operatives and Elementary occupations.
Table 5: Occupational levels1 of TCN family migrants with tertiary qualifications, January – March 2010, percentages*
Managerial or
Professional
Intermediate Lower Elementary
Family migrants
55.0 16.2 17.6 11.3
Other migrants 74.0
8.2 11.2 6.7
Recently arrived2
family migrants
48.3 18.2 22.0 11.5
Recently arrived
women family
migrants
50.3 24.5 23.8 1.5
Recently arrived
Indian national
family migrants
42.7 34.0 18.2 5.1
Recently arrived
Pakistani national
family migrants
0.0 27.7 25.6 46.7
Recently arrived
US national
family migrants
78.0 6.8 7.3 7.9
31
*Population weights have been applied. Percentages may not add up to 100 because of
rounding.
1 ‘Managerial/Professional’ combines Managers and senior officials, Professional, and
Associate professional and technical occupations; ‘Intermediate’ combines Administrative
and Secretarial and Skilled trades occupations; ‘Lower’ combines Personal service and Sales
and customer service occupations; ‘Elementary’ combines Process, plant and machine
operatives and Elementary occupations.
2 Arrived 2000 onwards.
Table 9 explores the relation between educational and occupational levels for family
migrants and other migrants, and among family migrants according to different
characteristics, to provide a deeper understanding of patterns uncovered so far. It shows
that there is a considerable difference between family migrants and other migrants (55% of
the former compared to 74% of the latter in high level jobs). There are also large differences
in the occupational destinations of different categories of family migrants with similar high
qualification levels. While over half of family migrants as a whole with tertiary level
qualifications are in managerial or professional occupational levels, this proportion drops to
48% for recent migrants. However, recently arrived women with higher qualifications among
family migrants do not appear to fare less well, and indeed a very small proportion end up in
elementary occupations. But as suggested in the results presented in Table 8 there are
differences according to nationality. While 78% of recently arrived US national family
migrants with tertiary qualifications are in higher level occupations, only just over two fifths
of similarly qualified Indian nationals are in these types of occupations. Significantly there are
no Pakistanis with higher qualifications in higher level jobs despite there being around a
tenth with such qualifications as shown in Table 8. Among these highly qualified South Asian
family migrants 46.7% Pakistanis are also to be found in elementary occupations, compared
to 5.1% of Indians. A slightly higher percentage of highly qualified US nationals are in
elementary occupations . Overall these results suggest that some family migrants – those
who are recent arrivals, those who are nationals of some global south countries – have less
equitable labour market integration outcomes than do some others.
32
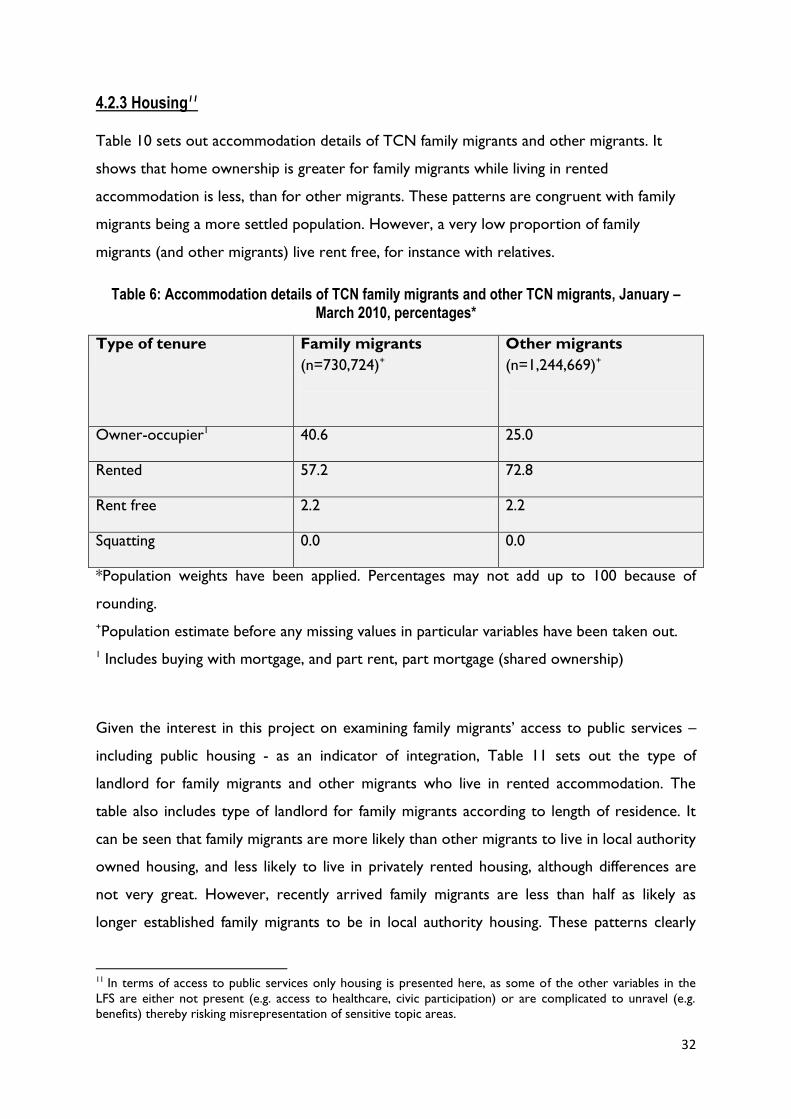
4.2.3 Housing11
Table 10 sets out accommodation details of TCN family migrants and other migrants. It
shows that home ownership is greater for family migrants while living in rented
accommodation is less, than for other migrants. These patterns are congruent with family
migrants being a more settled population. However, a very low proportion of family
migrants (and other migrants) live rent free, for instance with relatives.
Table 6: Accommodation details of TCN family migrants and other TCN migrants, January – March 2010, percentages*
Type of tenure Family migrants
(n=730,724)+
Other migrants
(n=1,244,669)+
Owner-occupier1 40.6 25.0
Rented 57.2 72.8
Rent free 2.2 2.2
Squatting 0.0 0.0
*Population weights have been applied. Percentages may not add up to 100 because of
rounding.
+Population estimate before any missing values in particular variables have been taken out.
1 Includes buying with mortgage, and part rent, part mortgage (shared ownership)
Given the interest in this project on examining family migrants’ access to public services –
including public housing - as an indicator of integration, Table 11 sets out the type of
landlord for family migrants and other migrants who live in rented accommodation. The
table also includes type of landlord for family migrants according to length of residence. It
can be seen that family migrants are more likely than other migrants to live in local authority
owned housing, and less likely to live in privately rented housing, although differences are
not very great. However, recently arrived family migrants are less than half as likely as
longer established family migrants to be in local authority housing. These patterns clearly
11 In terms of access to public services only housing is presented here, as some of the other variables in the
LFS are either not present (e.g. access to healthcare, civic participation) or are complicated to unravel (e.g.
benefits) thereby risking misrepresentation of sensitive topic areas.
33
reflect entitlement patterns, with many longer established migrants having rights to public
housing that recent migrants do not possess. It is also interesting that over a quarter of
longer established family migrants live in housing association homes. It can also be seen in
Table 11 that more recent arrivals tend largely to live in private rented accommodation.
There are very small proportions in any category that live in other rented options such as
employer owned housing or that owned by relatives or friends. If we consider these
patterns in relation to renting options of the UK population as a whole in the survey (30.2%
in local authority housing, 22.7% in housing association owned housing and 40.8% in private
rented housing) it appears that family migrants as a category are less likely to live in public
housing (18.3%) than the whole population but longer resident family migrants are a little
more likely (36.8%) to do so.
34
Table 7: Type of rented accommodation for those renting: TCN family migrants and other TCN migrants, and family migrants by length of residence and nationality, January – March 2010,
percentages*
Type of
renting
Family
migrants
(n=730,724)+
Other
migrants
(n=1,244,669)+
Family
migrants
– arrived
before
2000
Family
migrants
– arrived
2000
onwards
Local
authority
18.3 14.3 36.8 15.2
Housing
association
11.9 10.2 28.9 9.3
Employer of
family
member
(organisation)
3.3 2.1 0.8 3.5
Another
organisation
2.0 3.8 0.9 2.2
Relative or
friend
1.8 1.3 4.4 1.4
Employer of
family
member
(individual)
0.7 0.7 0.8 0.7
Private
landlord
62.0 67.8 27.5 67.7
*Population weights have been applied. Percentages may not add up to 100 because of
rounding.
+Population estimate before any missing values in particular variables have been taken out.
35
5. SUMMARY AND CONCLUSION
There has been an overall downward trend in non-EEA family migrant in-flows over the past
decade which reflects increasing restrictions on entry of this category, whether on the
family route or as dependants of limited stay migrant categories. Family migration makes up
a smaller share of overall migration now than it did in the 1990s. The majority of family
migrants are spouses/partners, largely women, but there has been an increase in the
migration of children. There is a preponderance of South Asian nationalities among both
family route migrants and dependants of other migrants. Key geographical areas of residence
for family migrants appear to urban areas in London and the South East, and Yorkshire.
Family route migrants are more likely to achieve settlement compared to dependants of
limited stay migrants, and those of South Asian nationalities are more likely to gain
settlement than United States or Australian nationals.
The analysis of labour market integration outcomes suggest that family migrants are not
considerably less well integrated than migrants coming to the UK for other reasons once
demographic differences such as sex and age are taken into account. However, there are
differences in labour market outcomes among family migrants by length of residence and
nationality. Those who migrated before 2000 are occupationally better placed than more
recent migrants, with a higher proportion in professional or managerial jobs and a lower
proportion in lower and elementary jobs. These differences may partly be related to a
higher proportion of better qualified people among earlier migrants as well as the important
issue of recognition of qualifications: over two fifths of recent arrivals have ‘other’
qualifications, in part at least presumably gained outside the UK, compared to a less than a
quarter among earlier arrivals. These characteristics suggest that more recently arrived
family migrants are overall less well-integrated into the labour market than are earlier
arrived family migrants, suggesting that for family migrants length of residence has impact on
labour market integration.
Patterns of labour market incorporation by nationality of family migrants are also interesting
to consider because they represent quite widely divergent countries in terms of wealth. It
can be seen that family migrants with US nationality do considerably better in the labour
market than the other top nationalities - Indians and Pakistanis – for instance with higher
36
employment levels and lower unemployment, higher qualifications (particularly relative to
Pakistanis) and higher occupational levels. However, an analysis of occupational destinations
of different family migrant nationalities with similar qualification levels (that is, all with
tertiary qualifications) shows that those of US nationality are still better placed than similarly
qualified South Asian nationalities, and particularly starkly than Pakistani family migrants.
Analysis of patterns of housing shows that family migrants are more likely than other
migrants to live in public housing and that longer established family migrants are more likely
than more recent arrivals and non-UK nationals to be in public housing. These patterns
clearly reflect differences in housing rights as part of entitlement to public funds based on
rights to permanent residence (Jayaweera & Oliver 2013).
The mapping of entitlements and restrictions in conditions of stay of family migrants
(Jayaweera & Oliver 2013) has revealed that formal restrictions in accessing the labour
market for family migrants whether on a settlement path or with only temporary leave to
remain in the UK, are fewer than in some other domains. Given the evidence in this report
of less equitable integration outcomes for family migrants according to length of residence,
and importantly nationality, a key question is what factors best explain such inequalities in
integration outcomes. The qualitative evidence presented as part of the project will address
this issue.
37
6. REFERENCES
ACHATO, L, EATON, M. & JONES, C. 2011. The Migrant Journey: second report. Research
report 57. The Home Office.
ACHATO, L, EATON, M. & JONES, C. 2010. The Migrant Journey: first report. Research
report 43. The Home Office.
BLINDER, S. 2012a. Immigration by category: Workers, students, family members, asylum
applicants. Migration Observatory Briefing. University of Oxford
BLINDER, S. 2012b. Non-European migration to the UK: Family and dependents. Migration
Observatory Briefing. University of Oxford
BLINDER, S. 2012c. Settlement in the UK. Migration Observatory Briefing. University of
Oxford
CHARSLEY, K., VAN HEAR, N., BENSON, M. AND STORER-CHURCH, B. 2011. Marriage
related migration to the UK. Home Office Occasional Paper 96. The Home Office.
HOME OFFICE 2012. Immigration Statistics April-June 2012 2nd edition: Family.