Page 1
1
Analysis of Factors Influencing Consumer Preferences for Green Cosmetic and Food Products: A study in and around Kolkata
(West Bengal, India)
By
Sudipta Majumdar
Under the guidance of
Dr. Sumanta Basu Co-supervisor Asst. Professor Indian institute of Management, Calcutta, India
Dr. Sukanta Chandra Swain Supervisor Asst. Dean & Professor ICFAI University Jharkhand, Ranchi, India
Submitted
In Partial Fulfillment of the Requirement of the Degree of Doctor of
Philosophy
TO
ICFAI UNIVERSITY JHARKHAND
RANCHI
October, 2015
Page 2
2
Declaration of Authorship
I declare that this thesis entitled “Analysis of Factors Influencing Consumer Preferences
for Green Cosmetic and Food Products: A study in and around Kolkata(West
Bengal,India)” submitted by me in fulfillment of the requirements for the award of the
degree of Doctor of Philosophy of the ICFAI University Jharkhand, Ranchi is my own
work. It contains no material previously published or written by another person nor
material which has been accepted for the award of any other degree or diploma of the
university or other institute of higher learning, except where due acknowledgment has been
made in the text.
(Sudipta Majumdar)
Date:
Place:
Page 3
3
Acknowledgments
At first, I would like to thank Dr. Sukanta Chandra Swain, my Ph.D. supervisor and Dr.
Sumanta Basu, my Ph.D. co-supervisor. Both of them have been inspiring, challenging and
supportive in equal measure, and I consider myself very privileged to have worked under
their guidance and support.
I am indebted to the Research Board of the ICFAI University Jharkhand headed by
honorable Vice-Chancellor of the University that contributed in enabling a quality
research by way of its suggestions in the various half-yearly progress reviews and would
like to specifically thank our respected Vice Chancellor Sir (Prof. O R S Rao) for his
constant support and encouragement.
I would like to thank Dr. B M Singh, Dr. K. K. Nag and Dr. Hari Haran for their constant
support. I would also like to thank all the staff-members of ICFAI University, Jharkhand,
my colleagues and my fellow research scholars for their help all throughout the journey of
my Ph.D.
I am particularly grateful to all my relatives, specially my parents, brothers and wife. I
would not have been able to do this without their constant encouragement and support.
Date: (Sudipta Majumdar)
Place:
Page 4
4
Thesis Completion Certificate
This is to certify that the thesis on “Analysis of Factors Influencing Consumer Preferences
for Green Cosmetic and Food Products: A study in and around Kolkata(West
Bengal,India)” by Mr. Sudipta Majumdar, in Partial fulfillment of the requirements for
the award of the Degree of Doctor of Philosophy is an original work carried out by him
under our joint guidance. It is certified that the work has not been submitted anywhere else
for the award of any other diploma or degree of this or any other University.
(Dr. Sumanta Basu) (Dr. Sukanta Chandra Swain)
Co-Supervisor Supervisor
Page 5
5
Table of Contents
Declaration of Authorship................................................................................................................................. 2
Acknowledgments ................................................................................................................................................. 3
Thesis Completion Certificate ......................................................................................................................... 4
List of Tables .......................................................................................................................................................... 8
List of Figures ..................................................................................................................................................... 11
1. Executive Summary ................................................................................................................................. 12
2. Introduction ................................................................................................................................................ 14
2.1 Overview ........................................................................................................................ 14
2.2 Green Marketing ............................................................................................................ 17
2.3 Green Consumer Behavior ............................................................................................. 20
2.4 Green Consumer Conservation Behavior ....................................................................... 22
2.5 Green Consumer Attitude.............................................................................................. 23
2.6 Attitude and Behavior Linkage ...................................................................................... 25
2.7 Relevance of the Topic ................................................................................................... 26
2.8 Summary ........................................................................................................................ 27
3: Background and Contributions from Existing Literature ...................................................... 28
3.1 Attitude and Behaviour .................................................................................................. 28
3.2 Environmental Attitude .................................................................................................. 34
3.3 Conservation Behavior ................................................................................................... 41
3.4 Corporate Initiatives ....................................................................................................... 52
3.5 Green Consumer Segmentation ...................................................................................... 63
3.6 Demographic Variables .................................................................................................. 74
3.7 Psychographic Variables ................................................................................................ 75
3.8 External variables ........................................................................................................... 79
3.9Variables used in Green Products and Green Food Products (from Existing Literature) 81
3.10 The Problem Statement .................................................................................................. 90
3.11 Summary ........................................................................................................................... 90
Page 6
6
4. Objectives and Hypotheses ................................................................................................................... 92
4.1 Research Objectives ....................................................................................................... 92
4.2 Research Hypotheses...................................................................................................... 92
4.3 Summary ........................................................................................................................ 95
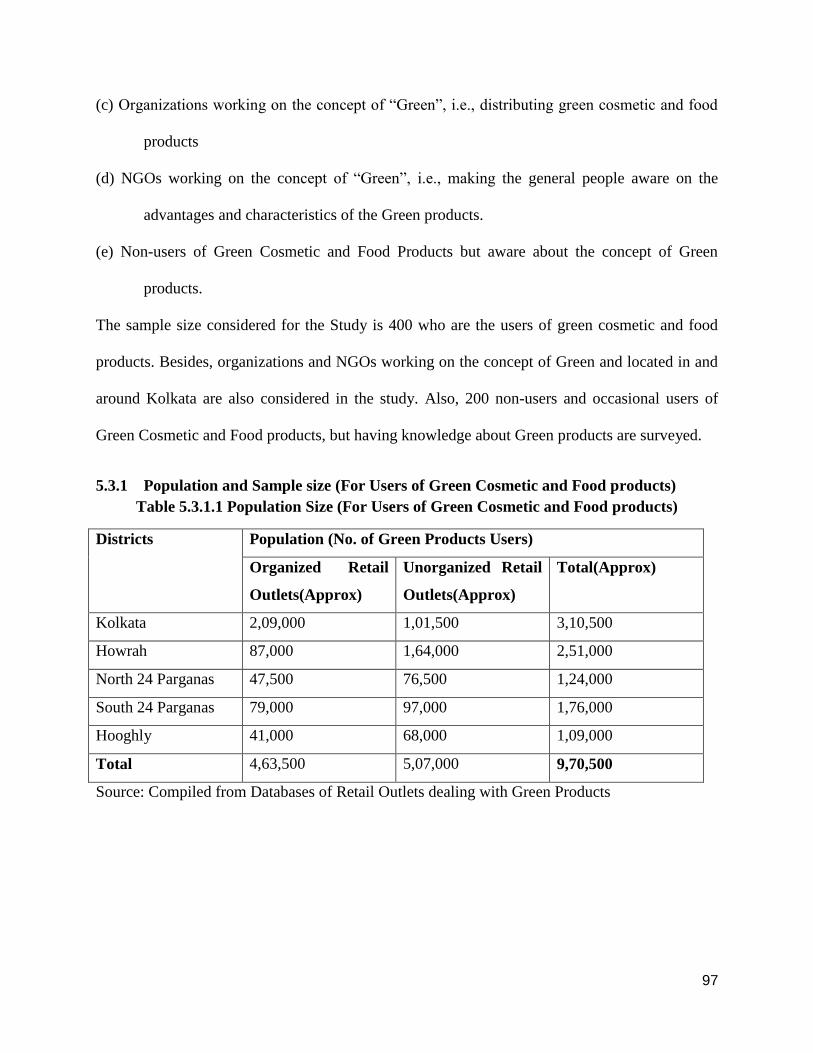
5. Research Methodology ............................................................................................................................ 96
5.1 Overview ........................................................................................................................ 96
5.2 Research Design ............................................................................................................. 96
5.3 Sources of Data .............................................................................................................. 96
5.4 Research Instrument ..................................................................................................... 100
5.5 Reliability Analysis ...................................................................................................... 108
5.6 Details about Data Collection ...................................................................................... 113
5.7 Stores selling Green Cosmetic and Food Products ...................................................... 114
5.8 Brands of the various Green Cosmetic and Food products .......................................... 114
5.9 Analysis of Results ....................................................................................................... 115
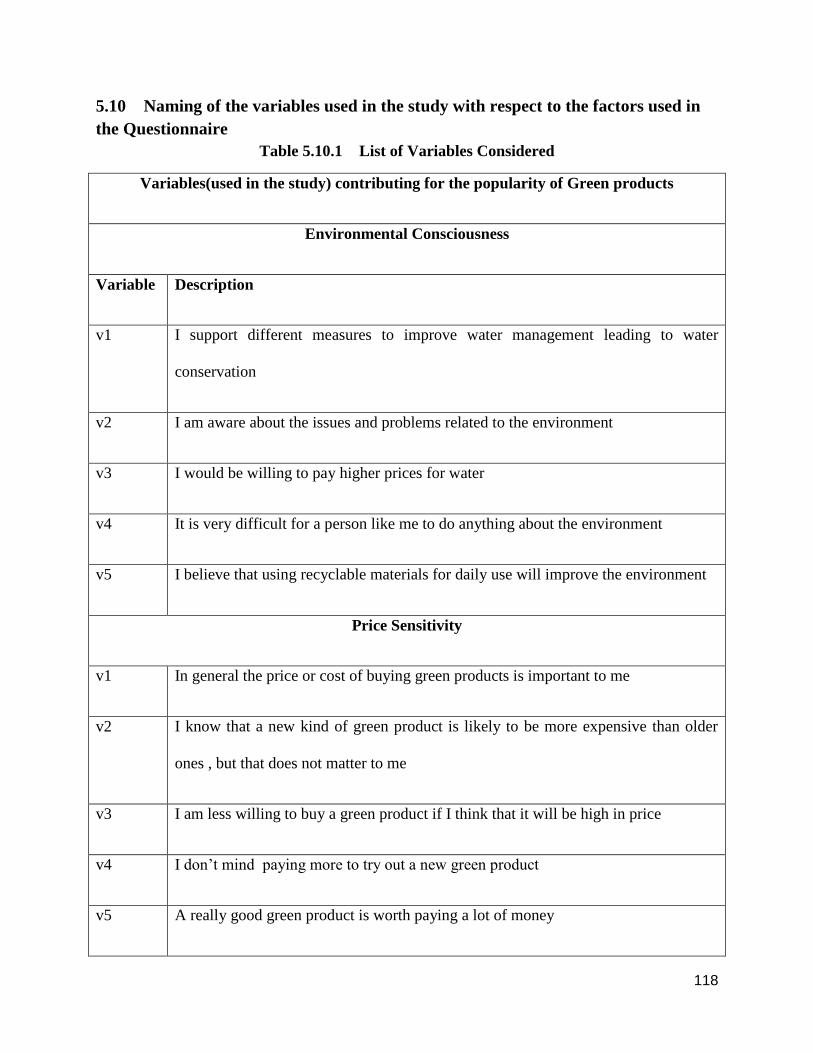
5.10 Naming of the variables used in the study with respect to the factors used in the
Questionnaire .......................................................................................................................... 118
5.11 Summary ...................................................................................................................... 121
6. Data Analysis and Findings ................................................................................................................ 122
6.1 Results of the Factor Analysis for Identification of the Factors .................................. 122
6.2 Prioritization of the Factors using Standardized Regression Coefficients – Green
Cosmetic Products .......................................................................................................... 130
6.3 Prioritization of the Factors using Standardized Regression Coefficients – Green Food
Products ................................................................................................................................... 138
6.4 Respondents Demographic Profile ............................................................................... 148
6.5 Impact of Demographic Profile on Preference for Green Cosmetic Products (ANOVA) 151
6.6 Impact of Demographic Profile on Preference for Green Food Products (ANOVA) .. 158
6.7 Respondents’ General Behaviour regarding buying Green Products .......................... 165
6.8 Impact of Psychographic variables on Preference for Green Cosmetic Products
(ANOVA) ................................................................................................................................ 171
6.9 Impact of Psychographic variables on Preference for Green Food Products (ANOVA)179
6.10 Impact of different independent variables on the preference for Green Cosmetic Products
(ANOVA) ................................................................................................................................ 187
Page 7
7
6.11 Impact of different independent variables on the preference for Green Food Products
(ANOVA) ................................................................................................................................ 196
6.12 Comparison of the Findings between Green Cosmetic and Food Products ................. 206
6.13 Impact of Psychographic Variables on Preference for Green Cosmetic Products
(ANOVA) for the Non-Users of Green Cosmetic Products .................................................... 208
6.14 Impact of Psychographic variables on Preference for Green Food Products (ANOVA)
for the Non-Users of Green Food Products ............................................................................. 216
6.15 Impact of different independent variables on the preference for Green Cosmetic
Products (ANOVA) for the Non-Users of Green Cosmetic Products ..................................... 223
6.16 Impact of different independent variables on the preference for Green Food Products
(ANOVA) for the Non-Users of Green Food Products........................................................... 231
6.17 Impact of Demographic Profile on Preference for Green Cosmetic Products (ANOVA)
for the Non-users of Green Cosmetic products ....................................................................... 240
6.18 Impact of Demographic Profile on Preference for Green Food Products (ANOVA) for
the Non-users........................................................................................................................... 246
6.19 Reasons for not buying Green Cosmetic or Food products ......................................... 253
6.20 Summary ...................................................................................................................... 257
7. Conclusion ................................................................................................................................................. 258
7.1 Overview ...................................................................................................................... 258
7.2 Summary of Research Findings ................................................................................... 258
7.3 Managerial Implications ............................................................................................... 266
7.4 Limitations of the Research.......................................................................................... 267
7.5 Scope of Future Research ............................................................................................. 268
7.6 Summary ...................................................................................................................... 269
8. References .................................................................................................................................................. 270
9. Appendices ................................................................................................................................................... 281
Page 8
8
List of Tables
Table 3.9.1.1 Identified Independent Variables ............................................................................ 81
Table 3.9.2.1 Identified Individual Variables ............................................................................... 82
Table 3.9.3.1 Identified External Variables .................................................................................. 85
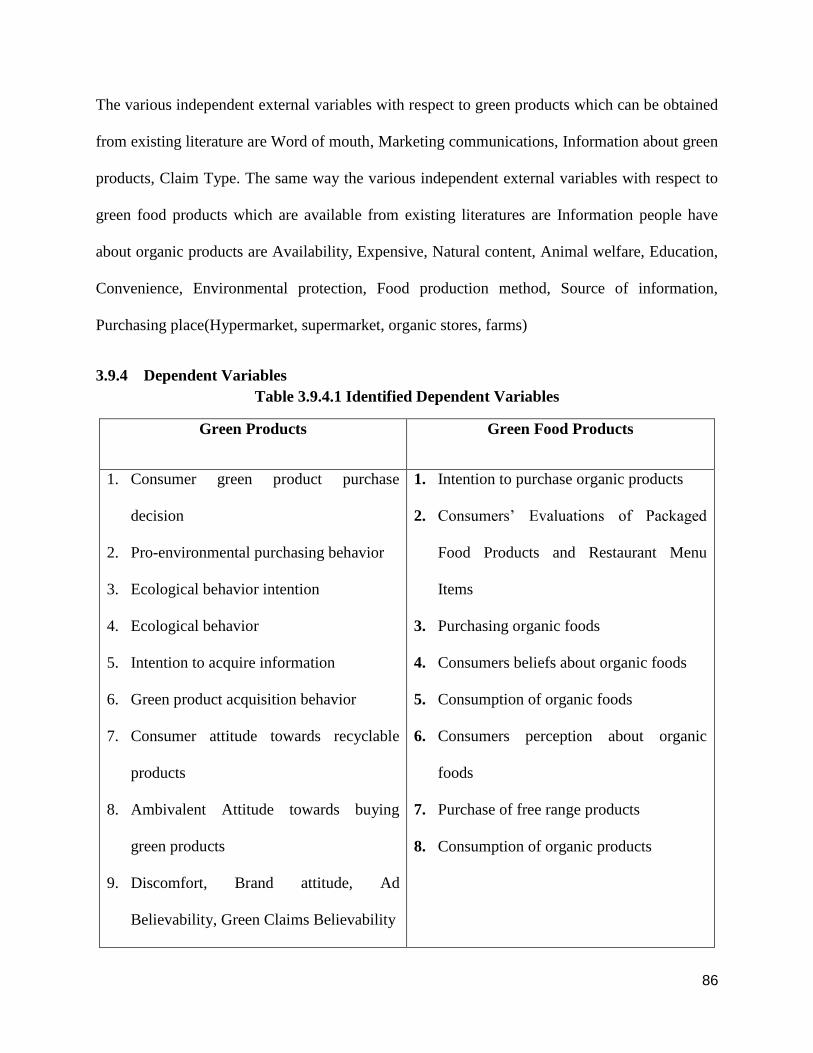
Table 3.9.4.1 Identified Dependent Variables .............................................................................. 86
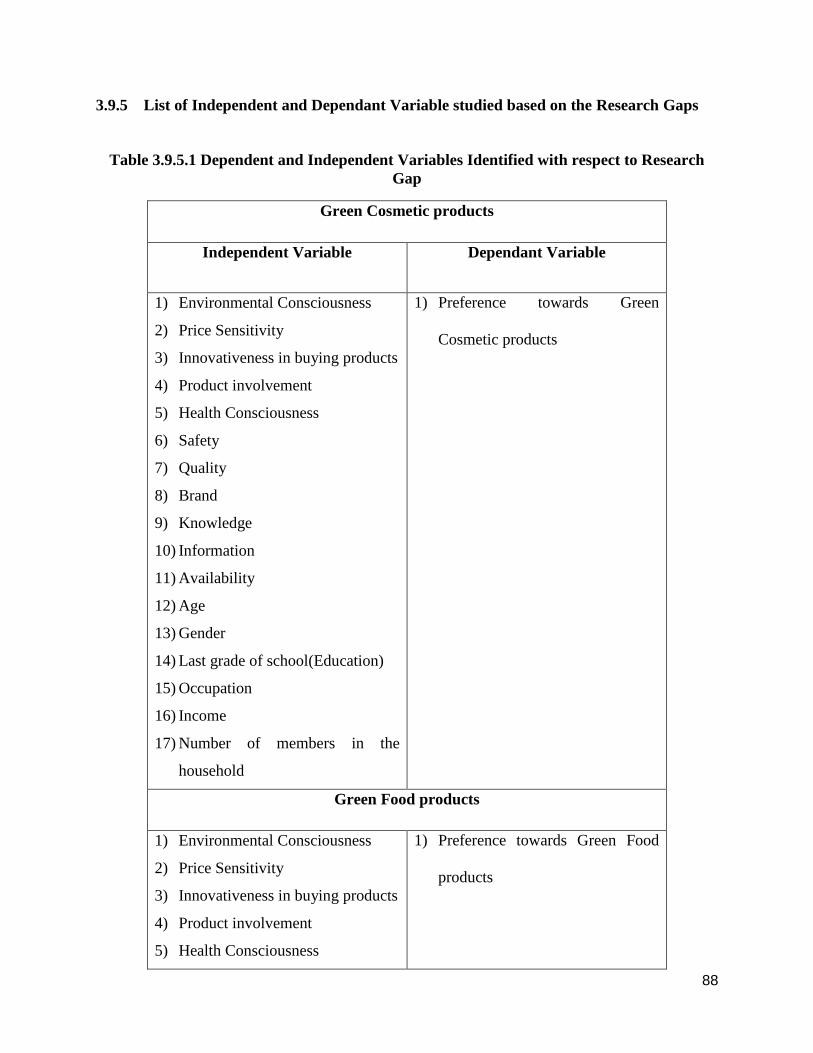
Table 3.9.5.1 Dependent and Independent Variables Identified with respect to Research Gap ... 88
Table 5.3.1.1 Population Size (For Users of Green Cosmetic and Food products) ...................... 97
Table 5.3.2.1 Sample Units as collected from the different districts surveyed (Users of Green
Cosmetic and Food products) ....................................................................................................... 99
Table 5.3.3.1 Sample Units as collected from the different districts surveyed (Non Users of
Green Cosmetic and Food products, but aware about the concept of “Green”) ........................... 99
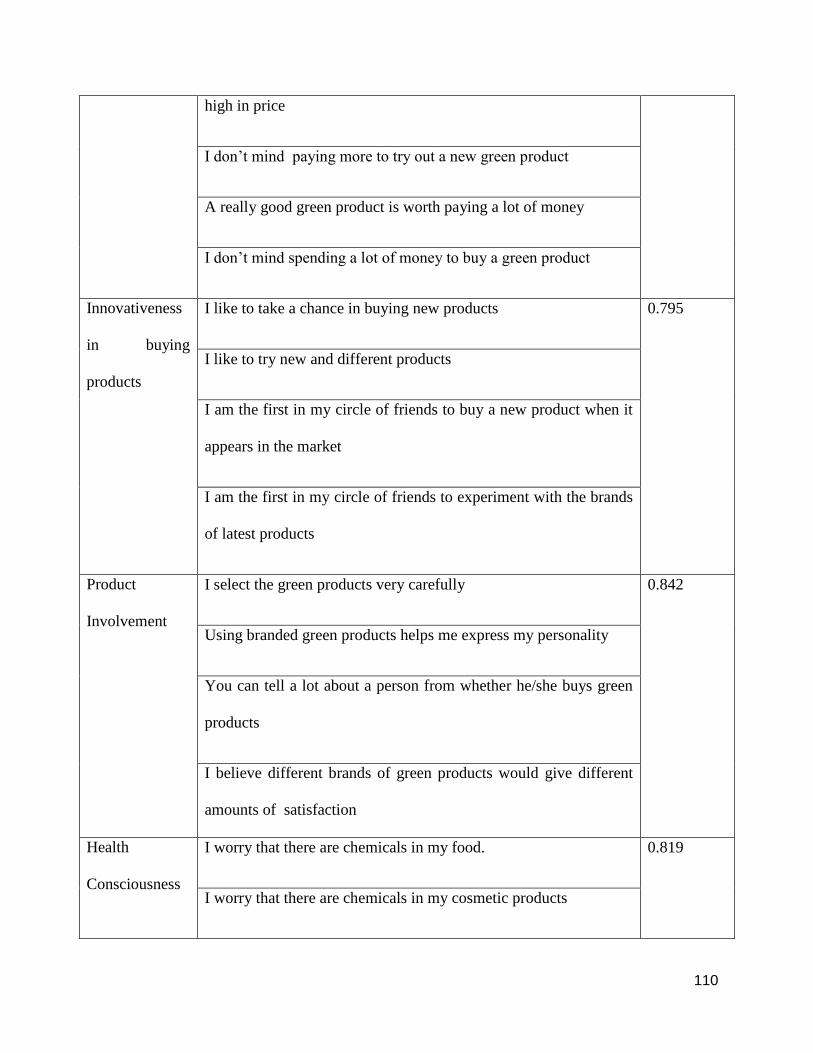
Table 5.5.1 Cornbach’s Alpha Score for the different constructs of the factors used in the
Questionnaire .............................................................................................................................. 109
Table 5.10.1 List of Variables Considered ................................................................................ 118
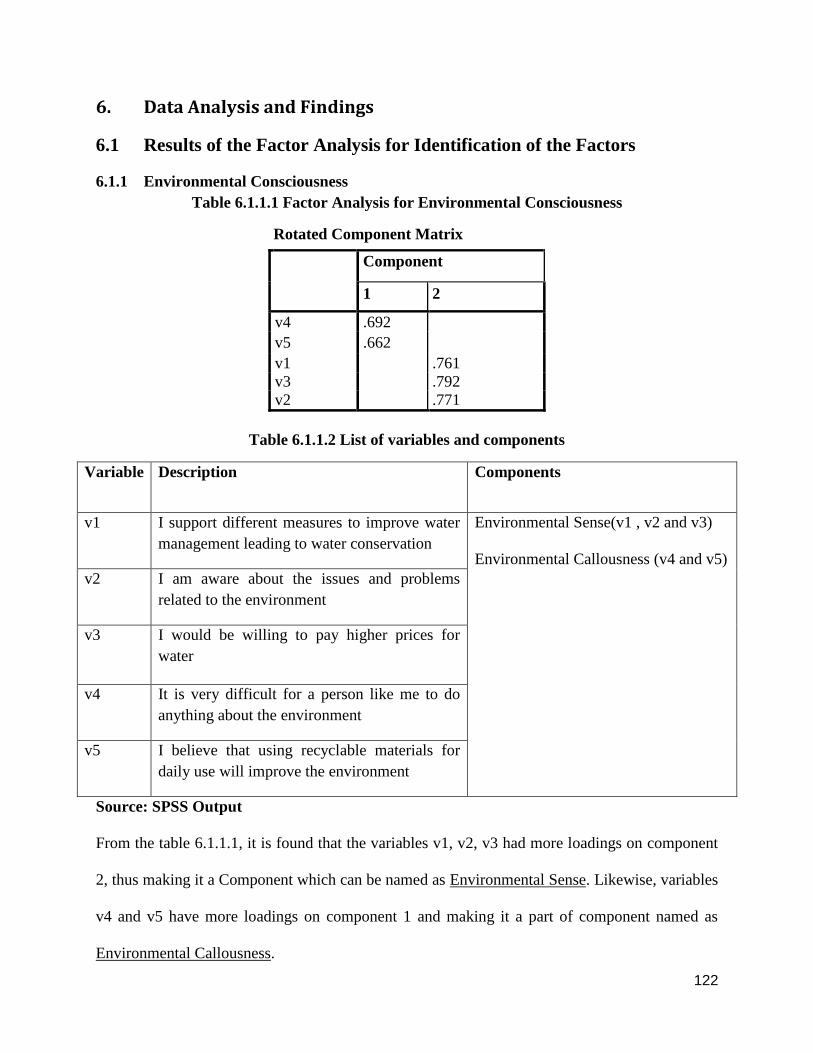
Table 6.1.1.1 Factor Analysis for Environmental Consciousness .............................................. 122
Table 6.1.1.2 List of variables and components ......................................................................... 122
Table 6.1.2.1 Factor Analysis for Price Sensitivity .................................................................... 123
Table 6.1.2.2 List of variables and components ......................................................................... 123
Table 6.1.3.1 Factor Analysis for Innovativeness....................................................................... 124
Table 6.1.3.2 List of variables and components ......................................................................... 124
Table 6.1.4.1 Factor Analysis for Involvement .......................................................................... 125
Table 6.1.4.2 List of variables and components ......................................................................... 125
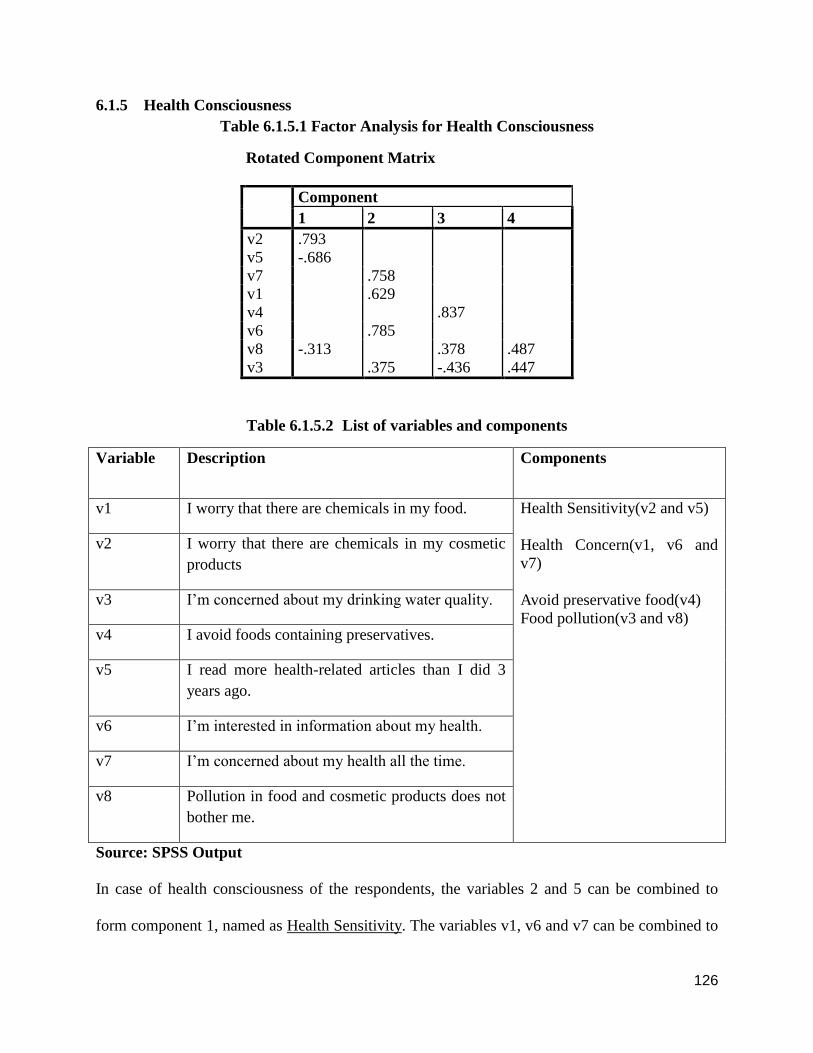
Table 6.1.5.1 Factor Analysis for Health Consciousness ........................................................... 126
Table 6.1.5.2 List of variables and components ......................................................................... 126
Table 6.1.6.1 Factor Analysis for Characteristics of Green Cosmetic Products......................... 127
Table 6.1.6.2 List of variables and components ......................................................................... 127
Table 6.1.7.1 Factor Analysis for Characteristics of Green Food Products ............................... 128
Table 6.1.7.2 List of variables and components ......................................................................... 129
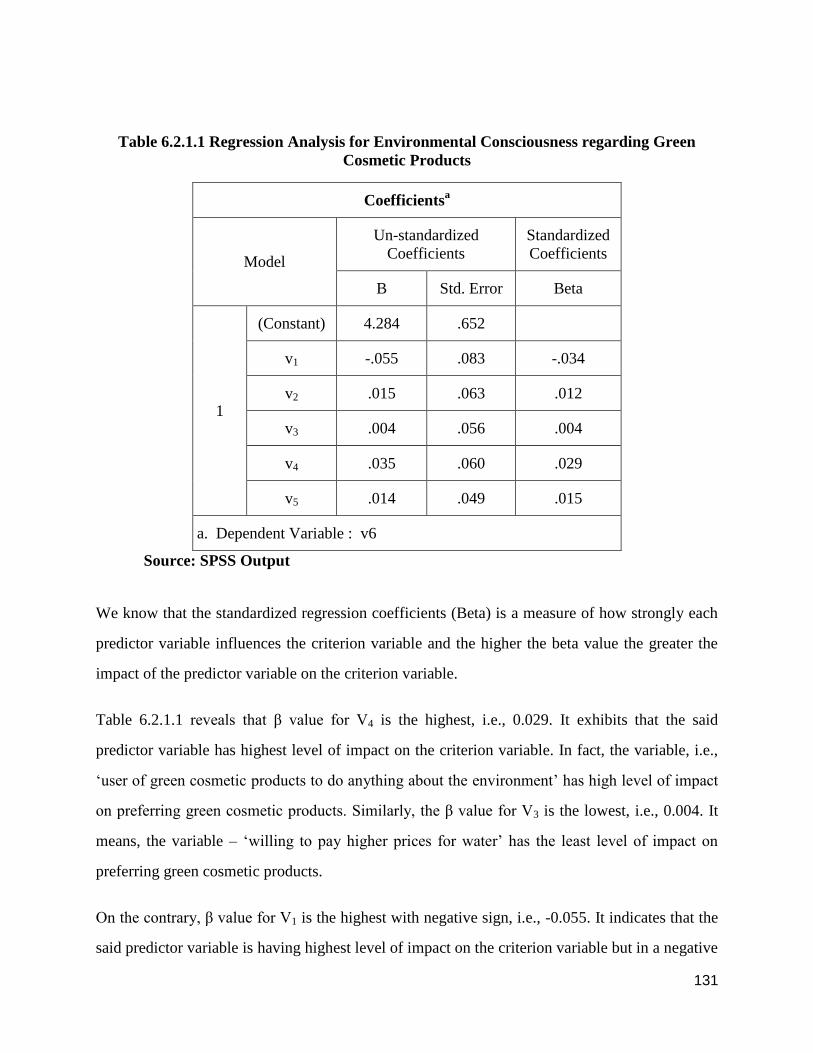
Table 6.2.1.1 Regression Analysis for Environmental Consciousness regarding Green Cosmetic
Products....................................................................................................................................... 131
Table 6.2.2.1 Regression Analysis for Price Sensitivity regarding Green Cosmetic Products .. 132
Table 6.2.3.1 Regression Analysis for Innovativeness in buying products regarding Green
Cosmetic Products ...................................................................................................................... 134
Table 6.2.4.1 Regression Analysis for Product Involvement regarding Green Cosmetic Products
..................................................................................................................................................... 136
Table 6.2.5.1 Regression Analysis for Health Consciousness regarding Green Cosmetic Products
..................................................................................................................................................... 137
Table 6.3.1.1 Environmental Consciousness for Green Food Products ..................................... 139
Page 9
9
Table 6.3.2.1 Price Sensitivity for Green Food Products .......................................................... 141
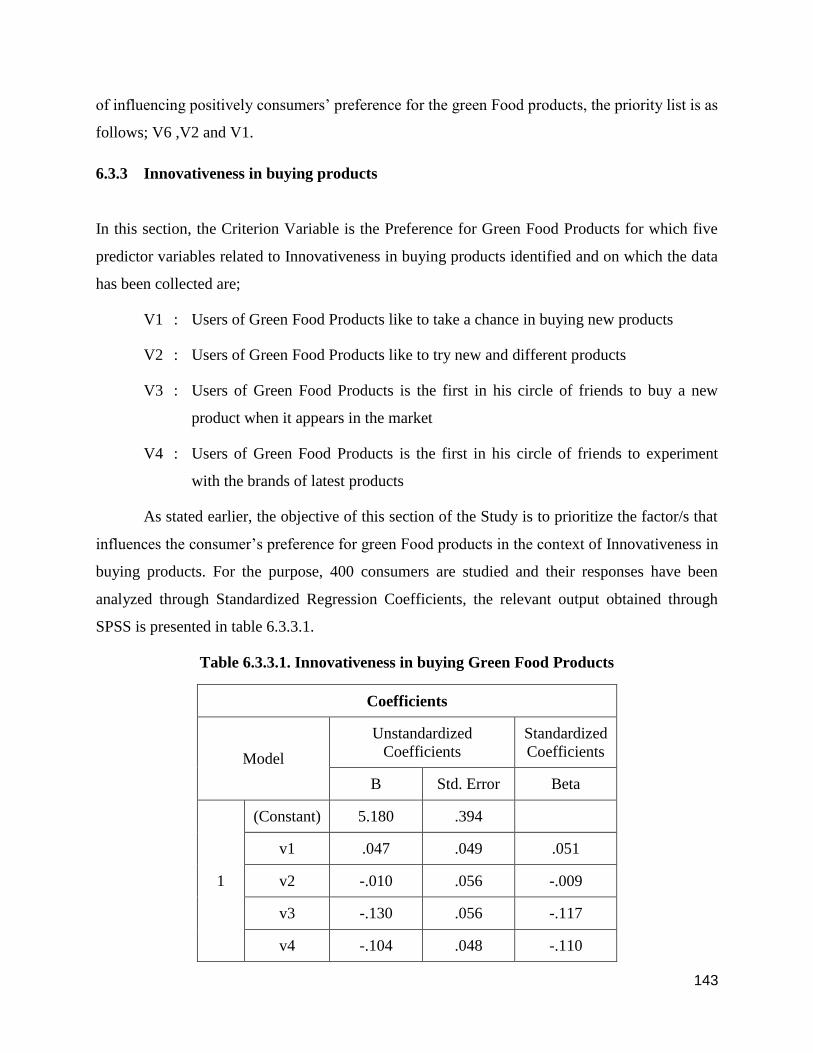
Table 6.3.3.1. Innovativeness in buying Green Food Products .................................................. 143
Table 6.3.4.1. Product Involvement on Green Food Products .................................................... 145
Table 6.3.5.1 Health Consciousness for Green Food Products.................................................. 147
Table 6.4.1 (Demographic Profile of Consumers) ...................................................................... 149
Table 6.5.1.1 ANOVA Output for Age-Group ........................................................................... 151
Table 6.5.2.1 ANOVA Output for Gender ................................................................................. 152
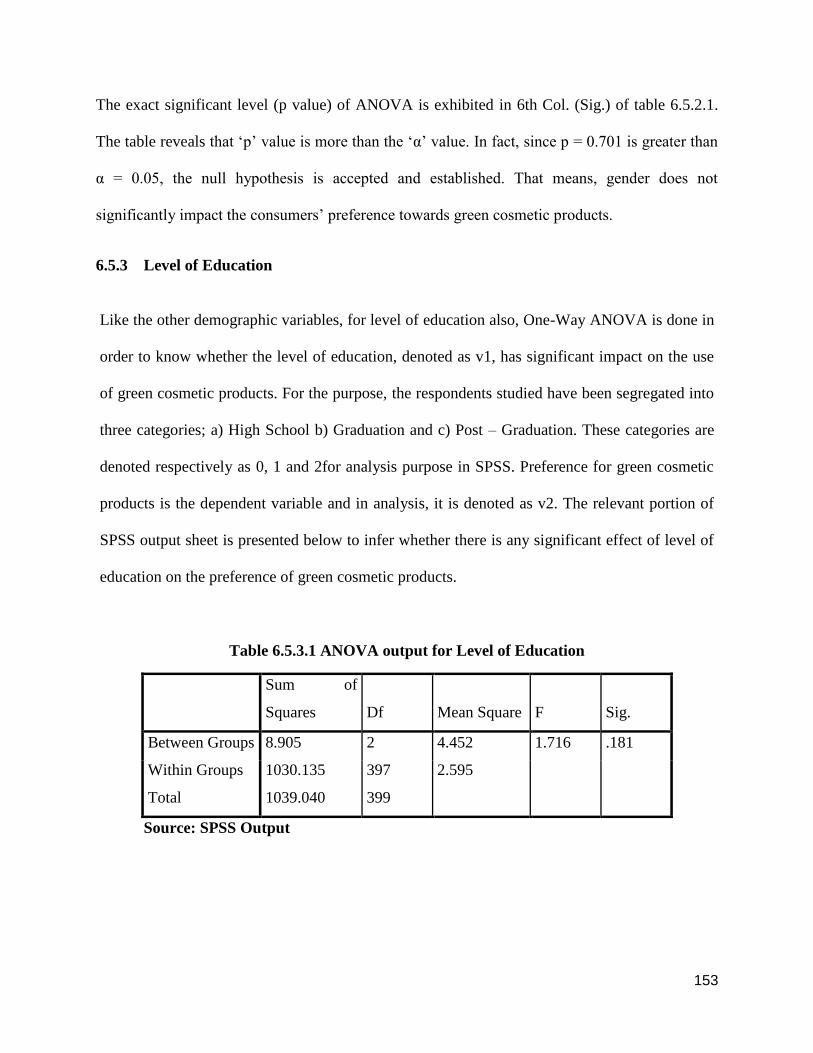
Table 6.5.3.1 ANOVA output for Level of Education ............................................................... 153
Table 6.5.4.1 ANOVA Output for Occupation ........................................................................... 154
Table 6.5.5.1 ANOVA Output on Income Level of the Consumers ........................................... 156
Table 6.5.6.1 ANOVA Output on Income Level of the Consumers ........................................... 157
Table 6.6.1.1 ANOVA Output for Age-Group ........................................................................... 158
Table 6.6.2.1 ANOVA Output for Gender ................................................................................. 159
Table 6.6.3.1 ANOVA Output for Education ............................................................................. 161
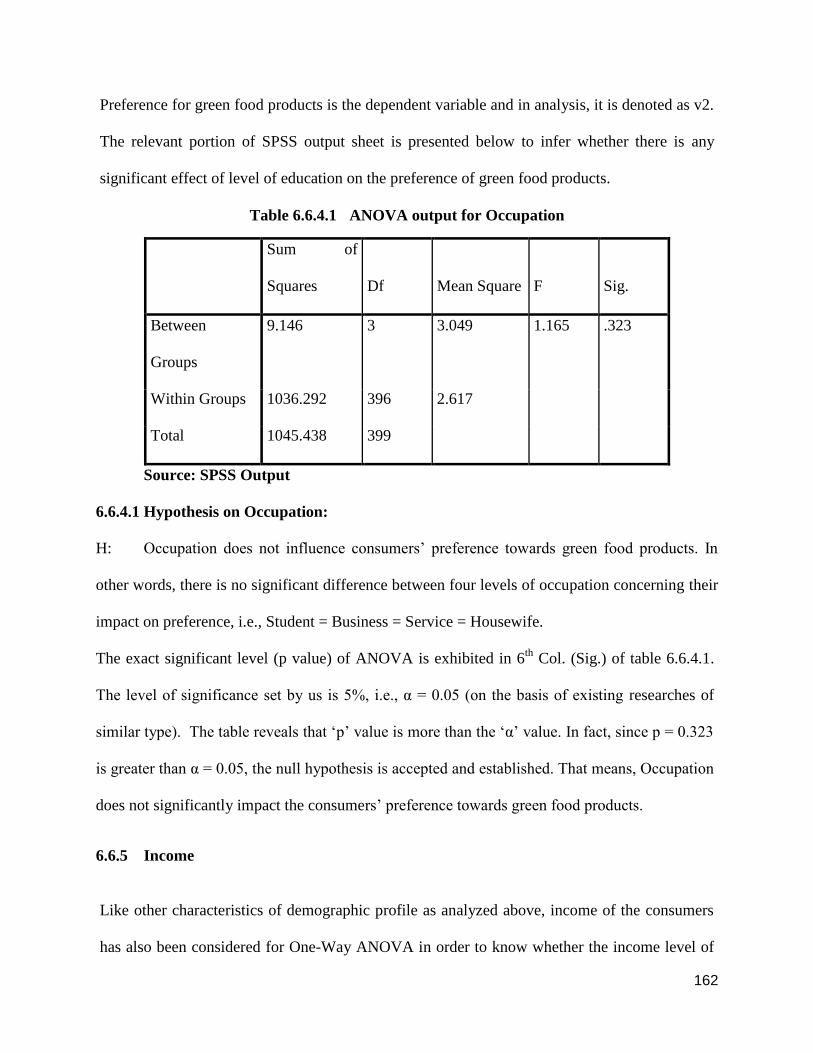
Table 6.6.4.1 ANOVA output for Occupation ............................................................................ 162
Table 6.6.5.1 ANOVA output for Income Level ........................................................................ 163
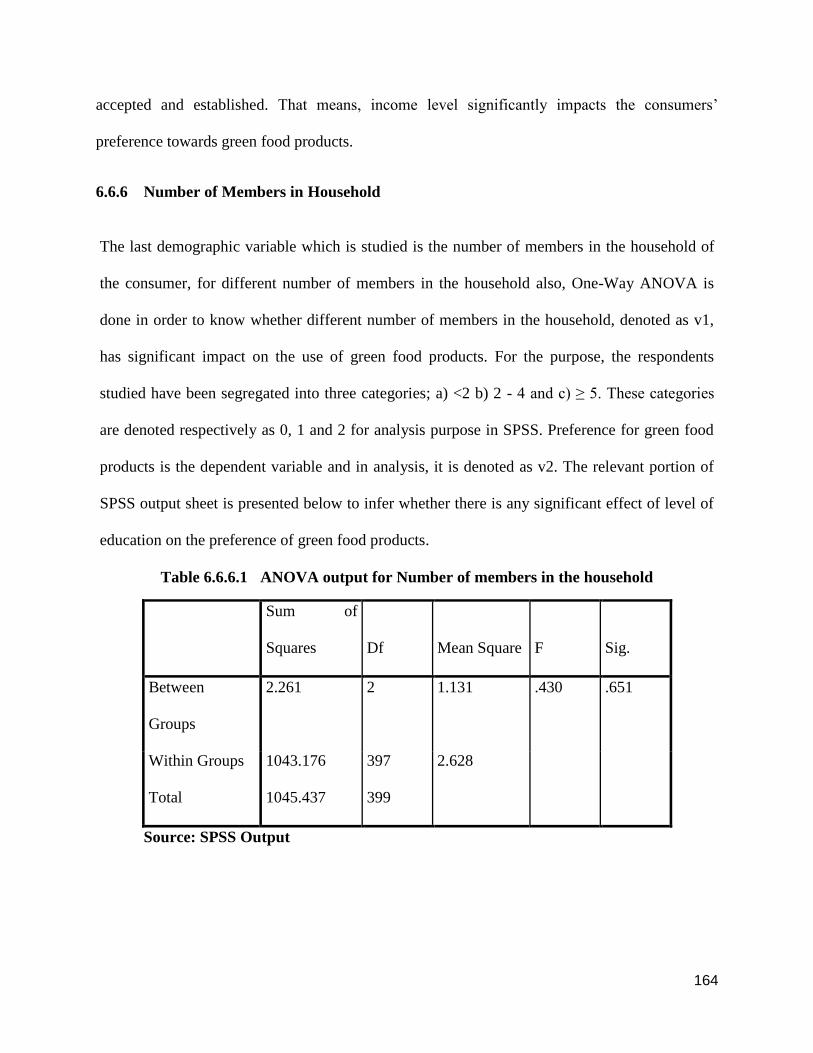
Table 6.6.6.1 ANOVA output for Number of members in the household .................................. 164
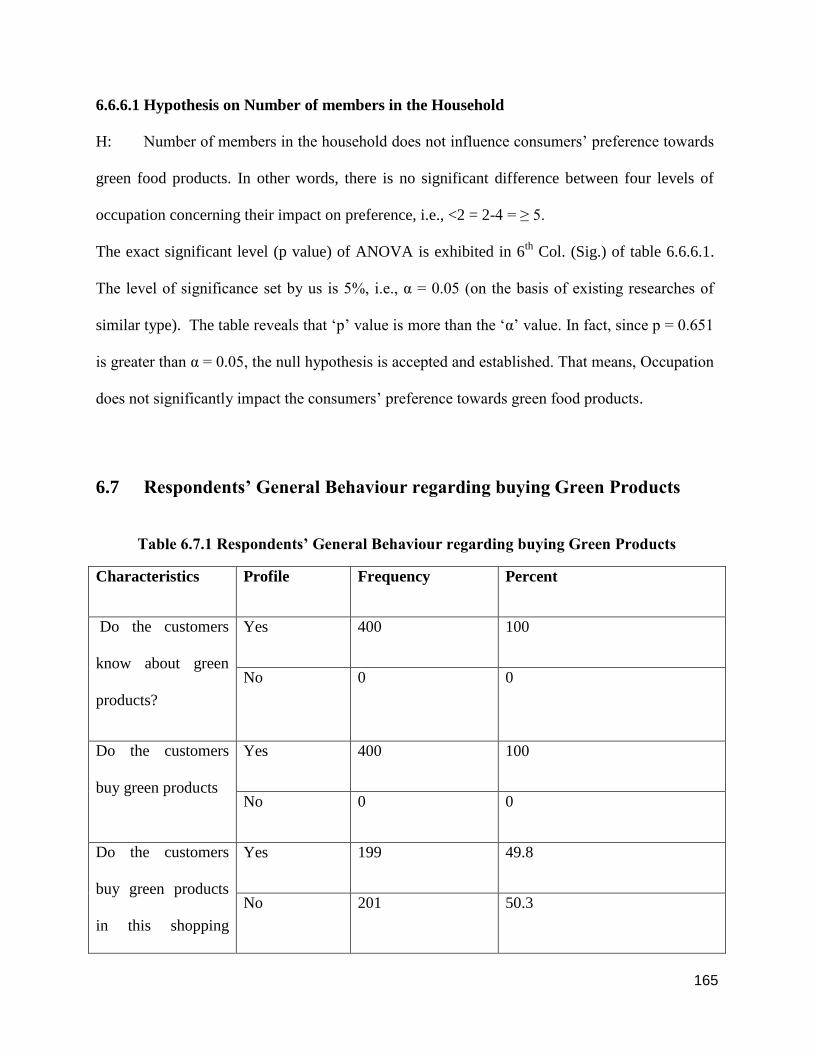
Table 6.7.1 Respondents’ General Behaviour regarding buying Green Products ...................... 165
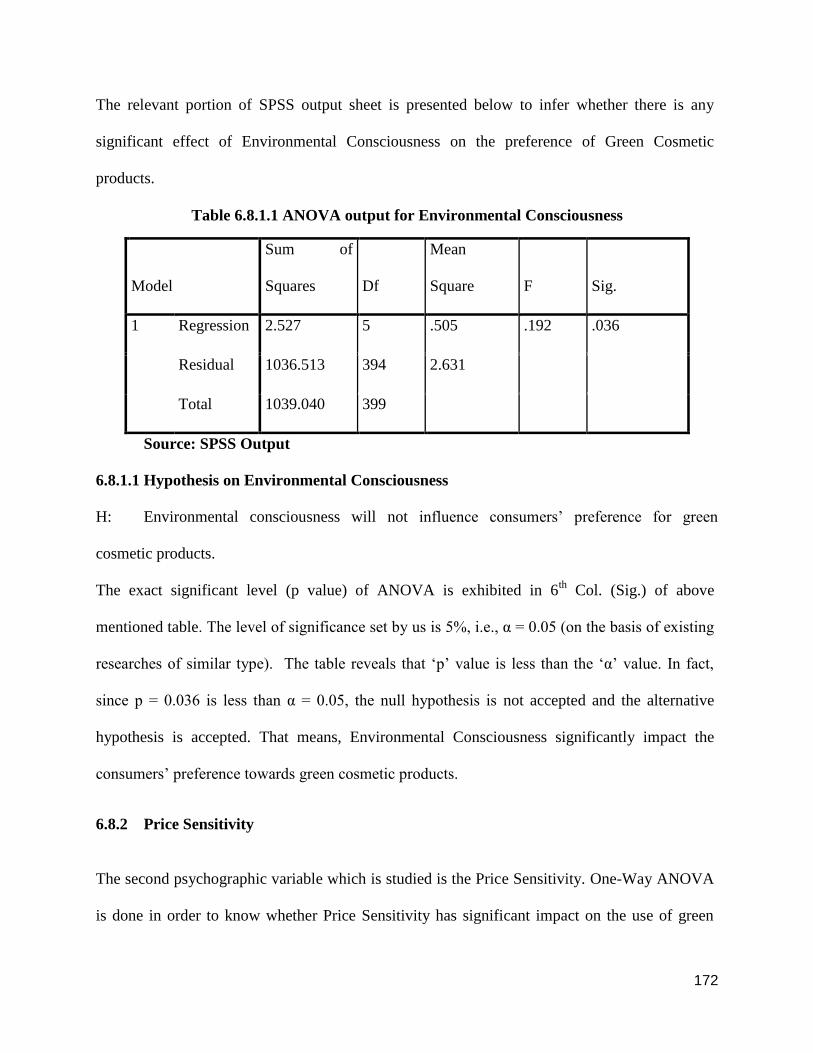
Table 6.8.1.1 ANOVA output for Environmental Consciousness .............................................. 172
Table 6.8.2.1 ANOVA output for Environmental Consciousness .............................................. 173
Table 6.8.3.1 ANOVA output for Innovativeness in buying products ....................................... 175
Table 6.8.4.1 ANOVA output for Product Involvement ............................................................ 177
Table 6.8.5.1 ANOVA output for Health Consciousness in buying products ............................ 178
Table 6.9.1.1 ANOVA output for Environmental Consciousness .............................................. 180
Table 6.9.2.1 ANOVA Output for Price Sensitivity ................................................................... 182
Table 6.9.3.1 ANOVA Output for Innovativeness in buying products ...................................... 183
Table 6.9.4.1 ANOVA output for Product Involvement in buying products ............................. 185
Table 6.9.5.1 ANOVA output for Health Consciousness ........................................................... 186
Table 6.10.1.1 ANOVA for Safety of Green Cosmetic Products ............................................... 187
Table 6.10.2.1 ANOVA output for Quality of Green Cosmetic Products .................................. 189
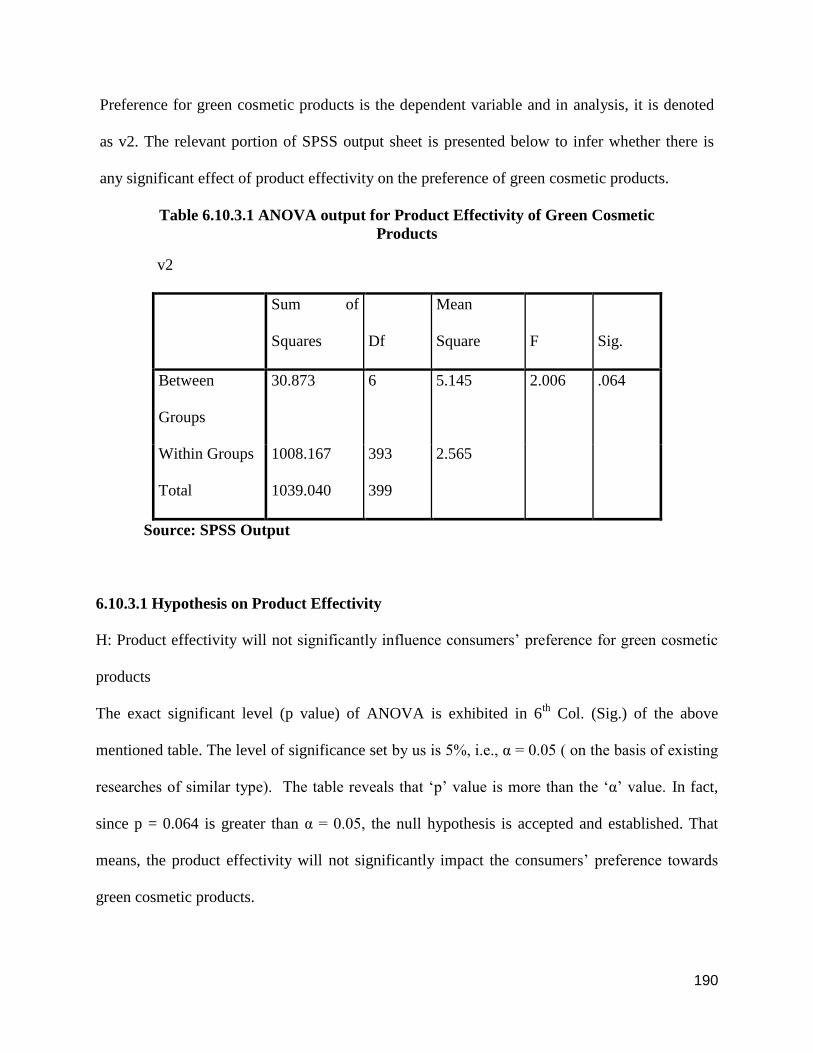
Table 6.10.3.1 ANOVA output for Product Effectivity of Green Cosmetic Products ............... 190
Table 6.10.5.1 ANOVA output for Product Knowledge of Green Cosmetic Products .............. 192
Table 6.10.6.1 ANOVA for Information about the Green Food Products ................................. 194
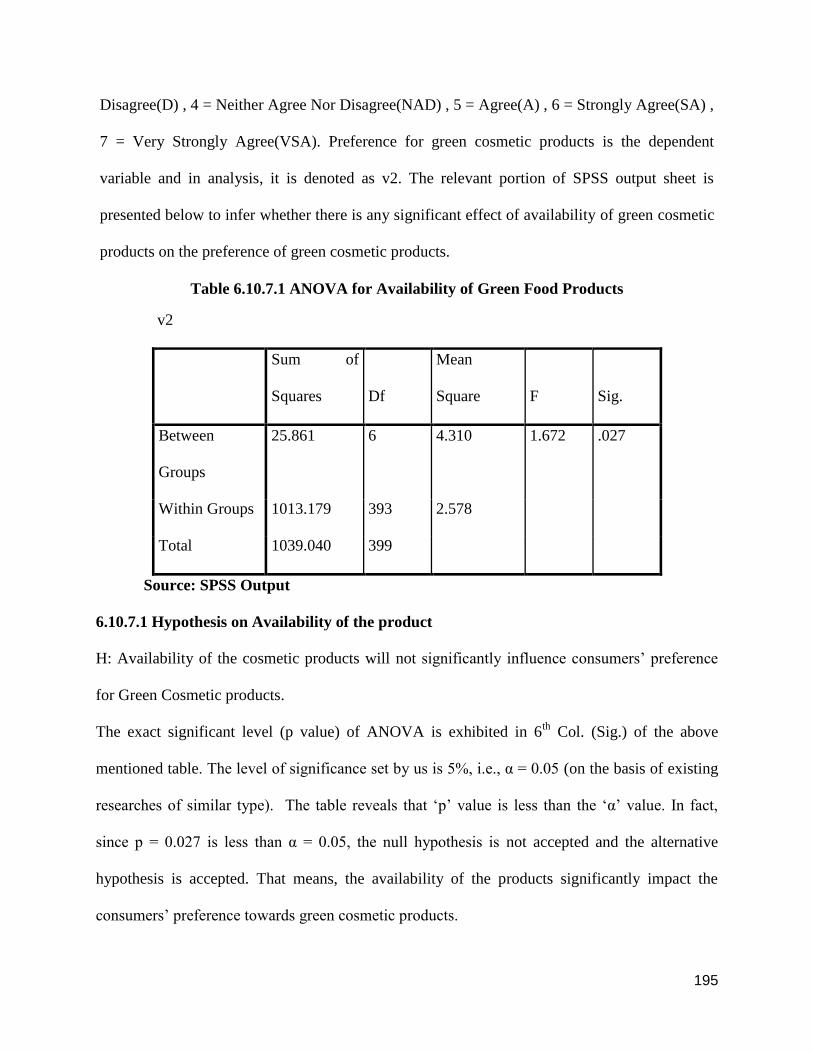
Table 6.10.7.1 ANOVA for Availability of Green Food Products ............................................. 195
Table 6.11.1.1 ANOVA for Safety of Green Food Products ...................................................... 196
Table 6.11.2.1 ANOVA for Nutritional Value of Green Food Products .................................... 197
Table 6.11.3.1 ANOVA for Taste of Green Food Products ....................................................... 198
Table 6.11.4.1 ANOVA for Product Knowledge of Green Food Products ................................ 200
Table 6.11.5.1 ANOVA for Information about Green Food products ........................................ 201
Table 6.11.6.1 ANOVA for Brand of Green Food Products ...................................................... 202
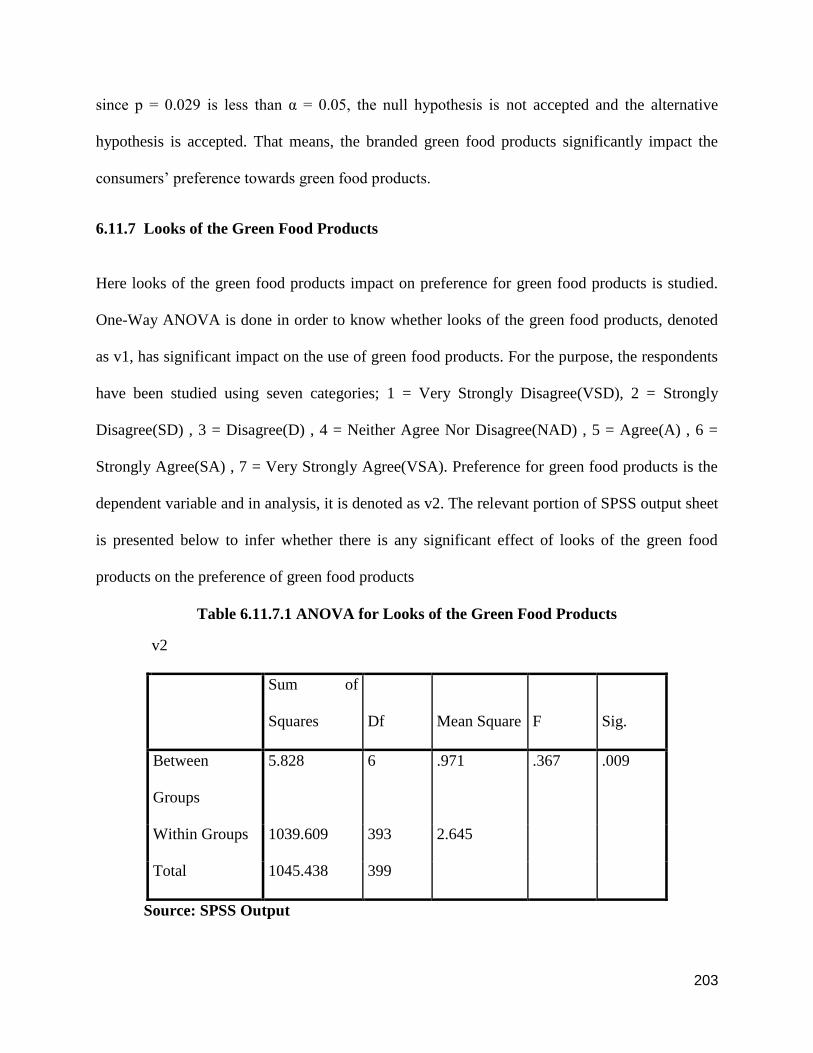
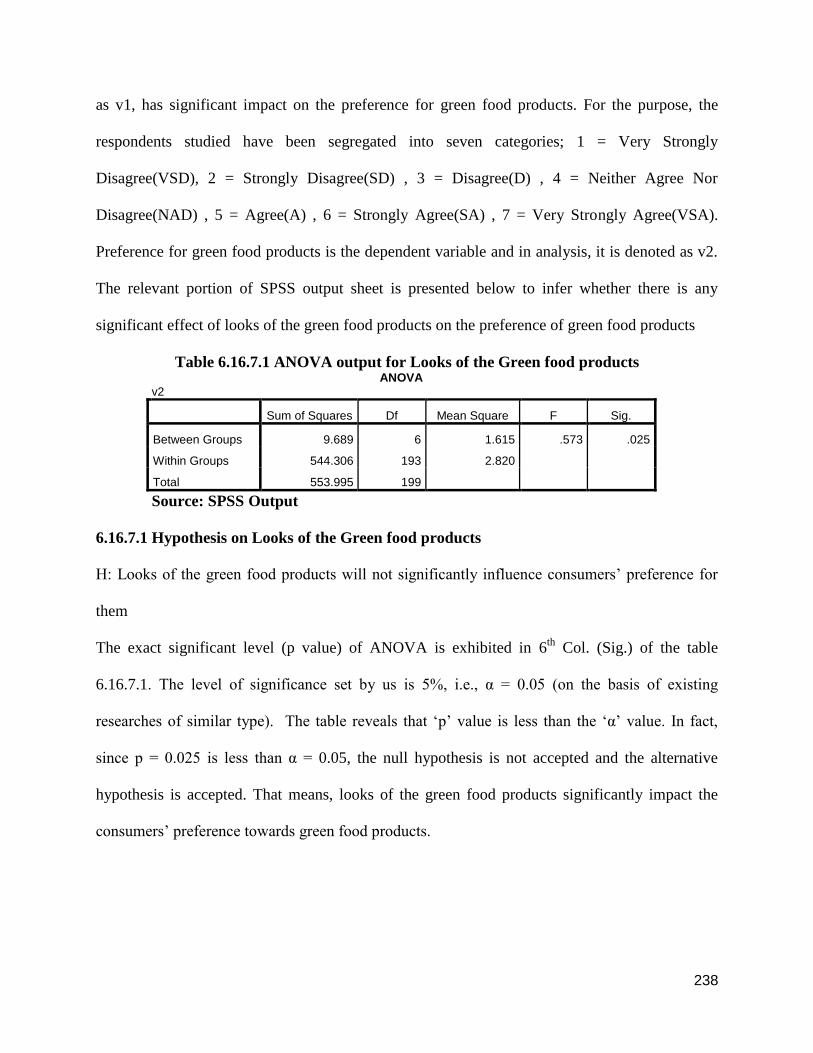
Table 6.11.7.1 ANOVA for Looks of the Green Food Products ................................................ 203
Page 10
10
Table 6.11.8.1 ANOVA for Availability of Green Food Products ............................................. 205
Table 6.12.1 Comparison of Findings between Green Cosmetic and Food Products ................ 206
Table 6.13.1.1 ANOVA output for Environmental Consciousness in buying products ............ 209
Table 6.13.2.1 ANOVA output for Price Sensitivity in buying green cosmetic products .......... 211
Table 6.13.3.1 ANOVA output for Innovativeness in buying products ..................................... 212
Table 6.13.4.1 ANOVA output for Innovativeness in buying products ..................................... 214
Table 6.13.5.1 ANOVA output for Health Consciousness in buying products .......................... 215
Table 6.14.1.1 ANOVA output for Price Sensitivity .................................................................. 217
Table 6.14.2.1 ANOVA output for Price Sensitivity .................................................................. 218
Table 6.14.3.1 ANOVA output for Innovativeness in buying products ..................................... 220
Table 6.14.4.1 ANOVA output for Product Involvement .......................................................... 221
Table 6.14.5.1 ANOVA output for Health Consciousness ......................................................... 223
Table 6.15.1.1 ANOVA output for Safety .................................................................................. 224
Table 6.15.2.1 ANOVA output for Quality ................................................................................ 225
Table 6.15.3.1 ANOVA output for Product Effectivity.............................................................. 226
Table 6.15.4.1 ANOVA output for Brand .................................................................................. 227
Table 6.15.5.1 ANOVA output for Product Knowledge ............................................................ 228
Table 6.15.6.1 ANOVA output for Product Information............................................................ 229
Table 6.15.7.1 ANOVA output for Product Information............................................................ 230
Table 6.16.1.1 ANOVA output for Safety .................................................................................. 231
Table 6.16.2.1 ANOVA output for Nutritional Value ................................................................ 232
Table 6.16.3.1 ANOVA output for Taste ................................................................................... 233
Table 6.16.4.1 ANOVA output for Product Knowledge ............................................................ 235
Table 6.16.5.1 ANOVA output for Information about the product ............................................ 236
Table 6.16.6.1 ANOVA output for Brand .................................................................................. 237
Table 6.16.7.1 ANOVA output for Looks .................................................................................. 238
Table 6.16.8.1 ANOVA for Availability of Green Food Products ............................................. 239
Table 6.17.1.1 ANOVA Output for Age-Group ......................................................................... 240
Table 6.17.2.1 ANOVA Output for Gender ............................................................................... 241
Table 6.17.3.1 ANOVA output for Level of Education ............................................................. 242
Table 6.17.4.1 ANOVA Output for Occupation ......................................................................... 243
Table 6.17.5.1 ANOVA Output on Income Level of the Consumers......................................... 244
Table 6.17.6.1 ANOVA Output on Number of members in the household ............................... 245
Table 6.18.1.1 ANOVA Output for Age-Group ......................................................................... 247
Table 6.18.2.1 ANOVA Output for Gender ............................................................................... 248
Table 6.18.3.1 ANOVA Output for Education ........................................................................... 249
Table 6.18.4.1 ANOVA output for Occupation .......................................................................... 250
Table 6.18.5.1 ANOVA output for Income Level ...................................................................... 251
Table 6.18.6.1 ANOVA output for Number of members in the household ................................ 252
Page 11
11
List of Figures
Figure 6.7.1: Respondents’ knowledge about green products .................................................... 167
Figure 6.7.2: Respondents’ buying pattern for green products ................................................... 167
Figure 6.7.3: Respondents' buying pattern for green products in this shopping trip .................. 168
Figure 6.7.4: Respondents’ buying pattern for green cosmetic products in this shopping trip .. 168
Figure 6.7.5: Respondents’ buying pattern for green food products in this shopping trip ......... 169
Figure 6.7.6: Respondents’ frequency for buying green products .............................................. 170
Page 12
12
1. Executive Summary
Since the concept of environmental consciousness has become a necessity to save the mankind,
promoting consumption of green products is the need of hour, owing to the fact that green
products are environment friendly or sustainable products and are organic in nature. It is evident
that the feeling for the health of environment and consumers is being resulted in the emergence
of the usage of green products at the cost of traditional or conventional products. However, the
magnitude of usage of green products is much behind the ideal one to safeguard the consumers
and environment at large. Thus stretching the incidence and depth of usage of green products is a
must. In order to achieve the pious objective, it is necessary to know the factors which insist the
users to go for the green products so that the same can be ventilated to the masses for extending
the consumer base for the green products.
On this backdrop, this study has been undertaken to collect responses from the green product
users, specifically in cosmetic and food category in and around Kolkata to find out the significant
factors, through factor analysis, which contribute for the popularity of the Green products. The
study also tries to find out the impact of different psychographic variables with respect to
popularity of green products. After identifying the factors, prioritization of the factors on the
basis of the magnitude of their influences on consumers’ preferences was undertaken with
respect to both Cosmetic and Food products.
The study also tries to establish whether there is any significant impact of demographic profile of
the consumers on their preference towards green cosmetic and food products. Demographic
profiles considered in this study are; age-group, gender, education, occupation, income and
number of members in the household. In fact, the objective is to map demographic profile of
Page 13
13
consumers (on the above mentioned facets) with their preference by way of applying one-way
ANOVA for the data obtained. The findings so obtained will certainly lend a hand to contrive for
stretching the incidence and depth of usage of green cosmetic and food products focusing on
influential facets of demographic profile of the consumers.
The findings so obtained will definitely help in augmenting the usage of green products and
hence contribute to safeguard the health of consumers and environment at large.
Keywords: Green Cosmetic products, Green Food products, Factors, Psychographic variables,
Demographic variables, Kolkata.
Page 14
14
2. Introduction
2.1 Overview
From the last decade onwards people became more concerned about their health as a result of
which they are using more of green products. Green products can be stated as having less of an
impact on the environment and are less damaging to human health than conventional products,
and hence are also called as sustainable or environment friendly products. Green products are
produced from recycled components,(i.e., the decomposition of residues of food and food
products instead of chemical fertilizers) are manufactured in a more energy-conservative way, or
are supplied to the market with more environmental friendly way. So, people are becoming more
aware about the concept of environment and health consciousness. This reduces the usage of
conventional products. Conventional products are those manufactured in the conventional way.
They are not being produced keeping environmental considerations in mind. In today’s
competitive scenario green products are competing with the conventional or regular products
(products produced by conventional methods).But, this usage pattern is not applicable to all parts
of the society. Knowledge and awareness about the green products play a very vital role in
enabling the customers to use them. But, this awareness and knowledge do not exist holistically
throughout all the spheres of the society, thus restricting the usage of the green products. From
the last decade onwards, we have started using the green products and it will take time before it
penetrates to all parts of the society. In comparison to the conventional products, green products
are generally biodegradable, non-toxic in nature and more environment friendly. In their book
“The Green Consumer”, John Elkington, Julia Hailes, and John Makower discussed several
characteristics that a product must have to be regarded as a "green" product. They contended that
a green product should not endanger the health of people or animals, damage the environment at
Page 15
15
any stage of its life, including manufacture, use, and disposal, consume a disproportionate
amount of energy and other resources during manufacture, use, or disposal, cause unnecessary
waste, either as a result of excessive packaging or a short useful life, involve the unnecessary use
of or cruelty to animals and use materials derived from threatened species or environments.
The concept of green products is becoming more popular with the aspect of cosmetic and food
items. Since people are becoming more health conscious, they are giving more importance to the
consumable and daily usable products. People started using more green products to minimize
their health risk. But, here also like normal green products knowledge and awareness is not there
in all parts of the society. So, these are more being used by the more knowledgeable parts of the
society. Also, organizations and government are not fully capable of promoting the concept of
“Green”. But the best part is the concept has started and it is penetrating to the society at a very
fast pace. If all the factors which contribute to the popularity of green cosmetic and food items,
such as price of the product, its quality, customer’s perception about the products, awareness
about them, are being handled carefully by the government and the organizations, then green
cosmetic and food items will become more popular in the society.
The concept of green products, specifically green cosmetic and food items can be popular only if
organizations understand the concept of green marketing. But to define green marketing is not an
easy task. While green marketing came into prominence in the late 1980s and early 1990s, it was
first discussed much earlier. The American Marketing Association (AMA) held the first
workshop on "Ecological Marketing" in 1975. The proceedings of this workshop resulted in one
of the first books on green marketing entitled "Ecological Marketing".
"Green or Environmental Marketing consists of all activities designed to generate and facilitate
any exchanges intended to satisfy human needs or wants, such that the satisfaction of these needs
Page 16
16
and wants occur, with minimal detrimental impact on the natural environment."(Chinnici et. Al.
, 2002)
According to Pride and Ferrell (1993) Green marketing, also alternatively known as
environmental marketing and sustainable marketing, referring to an organization’s efforts at
designing, promoting, pricing and distributing products that will not harm the environment.
Polonsky (1994) defines green marketing as the activities designed to generate and facilitate any
exchanges occurred to satisfy human needs or wants, such that the satisfaction of these needs and
wants occurs, with minimal negative impact on the natural environment(Chang , 2011).
Green marketing is a business practice that takes into account customer concerns about the
natural environment. Green marketing campaigns highlight the different environmental
protection characteristics for a company's products and services. The green marketing strategies
include reduced waste in packaging (Elkington and Makower 1988; Wasik 1996), increased
energy efficiency of the product in use Metcalf (2008) and Sue Wing (2008), reduced use of
chemicals in farming, or decreased release of toxic emissions and other pollutants in production
(Sumathi & Hung, 2006). Organizations have responded to the growing customer demand for
environment-friendly products in several ways, thus adopting the various components of green
marketing. These include: 1) promoting the environmental characteristics of products; 2)
introducing new products for the consumers concerned with energy efficiency, waste reduction,
sustainability, and climate control, and 3) redesigning existing products to satisfy these same
consumers.
Page 17
17
2.2 Green Marketing
Environmentally responsible or "green" marketing refers to the satisfaction of consumer needs,
wants, and desires in conjunction with the preservation and conservation of the natural
environment. Considered an oxymoron by many environmentalists (because it still promotes
consumption), green marketing manipulates the four elements of the marketing mix (product,
price, promotion and distribution) to sell products and services offering superior environmental
benefits in the form of reduced waste, increased energy efficiency, and/or decreased release of
toxic emissions.
The evolution of green marketing can be divided in three phases:
1. The first phase was termed "Ecological" green marketing. During this period all marketing
activities were concerned to solve environment problems and provide remedies for such
problems.
2. The second phase was "Environmental" green marketing and the focus shifted to clean
technology that involved designing of innovative new products, which takes care of pollution
and waste issues.
3. The third phase was "Sustainable" green marketing. It came into prominence in the late 1990s
and early 2000.
Defining green marketing is not a simple task because several meanings intersect and contradict
each other. An example of this is the existence of varying social, environmental and retail
definitions attached to this term. Other similar terms used are Environmental Marketing and
Ecological Marketing. According to the American Marketing Association, “green marketing is
Page 18
18
the marketing of products that are presumed to be environmentally safe”. Thus, green marketing
incorporates a broad range of activities, including product modification, changes in the
production process, packaging changes, as well as modifying promotional strategies including
advertising.
Polonsky in an edited book of K. Suresh defines green marketing as, "All activities designed to
generate and facilitate any exchange intended to satisfy human needs or wants such that
satisfying of these needs and wants occur with minimal detrimental input on the natural
environment." Green marketing involves developing and promoting products and services that
satisfy consumers’ want and need for Quality, Performance, Affordable Pricing and Convenience
without having a detrimental input on the environment.
To understand green marketing one needs to know the four Ps of green marketing.
2.2.1 Green Products
There is no widespread agreement on what exactly makes a product green. Some general
guidelines include that a green product:
does not present a health hazard to people or animals
is relatively efficient in its use of resources during manufacture, use and disposal
does not incorporate materials derived from endangered species or threatened
environments
does not contribute to excessive waste in its use or packaging and
does not rely on unnecessary use of or cruelty to animals.
Page 19
19
Other favorable attributes from the green point of view are the incorporation of recycled
materials into the product and the product’s own recyclability.
2.2.2 Green Pricing
A central concern of many environmentalists is that product prices do not reflect total
environmental costs. A number of companies have undertaken audits of their production
processes to identify hidden environmental costs and to provide better information for pricing
decisions. Emissions charges, carbon taxes, and increased fines are possible methods
governments might use to implement better environmental costing. European firms have been
particularly proactive in this area, developing a method of environmental auditing (the eco
balance) bridging the gap between standard accounting practice, in which data are expressed
solely in conventional monetary terms, and qualitative environmental impact reports.
2.2.3 Green Promotion
Perhaps no area of green marketing has received as much attention as promotion. In fact, green
advertising popularity grew so rapidly during the late 1980s that the U.S. Federal Trade
Commission (FTC) issued guidelines to help reduce consumer confusion and prevent the false or
misleading use of terms such as "recyclable," "degradable," and "environment friendly" in
environmental advertising.
The FTC offers four general guidelines for environmental claims:
1. Qualifications and disclosures should be sufficiently clear and prominent to prevent deception.
2. Environmental claims should make clear whether they apply to the product, the package, or a
component of either. Claims need to be qualified with regard to minor, incidental components of
the product or package.
Page 20
20
3. Environmental claims should not overstate the environmental attribute or benefit. Marketers
should avoid implying a significant environmental benefit where the benefit is, in fact,
negligible.
4. A claim comparing the environmental attributes of one product with those of another should
make the basis for comparison sufficiently clear and should be substantiated.
The FTC's Environmental Marketing Guidelines provide additional guidance for a number of
specific claims including "Degradable/ Biodegradable" "Compostable," "Recyclable," "Recycled
Content," "Refillable," and "Ozone Safe/Ozone Friendly." They strongly recommend avoidance
of overly general claims such as environment friendly.
2.2.4 Greener Distribution
Logistics and transportation costs are coming under greater scrutiny due to rising fuel prices,
congested highways, and global-warming concerns. Package redesign for lighter weight and/or
greater recyclability reduces waste while simultaneously reducing costs. In some countries,
marketers must also consider two-way flows, as governments pass legislation requiring
manufacturers to take back products at the end of their useful life ("reverse logistics").
2.3 Green Consumer Behavior
2.3.1 Green Consumer
A green consumer is one who is very concerned about the environment and, therefore, only
purchases products that are environment-friendly or eco-friendly. Products with little or no
packaging, products made from natural ingredients and products that are made without causing
pollution are all examples of eco-friendly products. The green consumer would be the type to
Page 21
21
drive a hybrid vehicle, buy products made from recycled materials. Green consumers can be
defined as one:-
“Who is mindful of environment related issues and obligations, and is supportive of
environmental causes to the extent of switching allegiance from one product or supplier to
another even if it entails higher cost.”
Marketing to the Green Consumer often make purchase decisions based on information about the
product rather than a catchy advertising campaign. According to Jacquelyn Ottman of J. Ottman
Consulting, green consumers seek out the following when making purchase decisions:
Green consumers want to know how raw materials are procured and where they come
from, how food is grown, and what their potential impact is on the environment once
they land in the trash bin.
Green consumers patronize manufacturers and retailers they trust and boycott the
wares of suspected polluters.
Green consumers often do not have the same consumptive spending patterns as the
mass consumer.
2.3.2 Green Consumerism
Green Consumerism is based on public awareness of publicizing environmental issues. Green
marketers hope to capitalize on this by developing strategies that allow consumers to integrate
green products into their lifestyles. Many such efforts by green marketers have met with
considerable success. The "organic" industry, for example, specializes in the sale of organically,
based foods, health and nutritional products, and other green lifestyle items.
Page 22
22
2.3.3 Green Consumer Purchasing Behavior
Consumer behavior involves the psychological processes that consumers go through in
recognizing needs, finding ways to solve these needs, collect and interpret information, make
plans, and implement these plans (eg. By engaging in comparison shopping of actually
purchasing a product), making purchase decisions (eg. whether or not to purchase a product and,
if so, which brand and where) and post purchase behavior. In simple words, consumer behavior
can be defined as, “Study of how people or organization behave when obtaining, using, and
disposing of products and services”.
Green Consumer behavior involves the use and disposal of products as well as the study of how
they are purchased. This means understanding the consumer’s behavior as a process in
purchasing goods and services. Product use is often of great interest to the marketer, because this
may influence how a product is best positioned or how we can encourage increased green
consumption.
In India even the post purchase behavior such as, product disposal is great area of interest in
green consumer behavior study, for example second hand market for car is quite big, hence
Maruti entered in this segment by introducing True Value.
2.4 Green Consumer Conservation Behavior
Limiting use of scarce natural resources for the purpose of environmental conservation can be
called as green consumer conservation behavior. When are consumers likely to conserve and
how can consumers be motivated to act in more environment friendly ways are two big questions
Page 23
23
in front of marketers. Consumers are most likely to conserve when they accept personal
responsibility for the environmental problem. For example, consumer who perceive that there is
an energy shortage because of consumption by all consumers (including themselves) are more
likely to accept personal responsibility and so do something about it. However, consumers often
do not feel accountable for many environmental problems and are not motivated to act. Thus for
conservation programs to succeed, messages must make the problem personally relevant. For
example, to get consumers to conserve energy by turning down the thermo star, messages could
focus on how much energy and money consumers will save each year and over a longer period
of time. Consumers are also most likely to conserve when there are no barriers in doing so.
2.5 Green Consumer Attitude
An attitude is a way one thinks, feels, and acts favorably or unfavorably based on learning
towards some aspect of market stimuli such as retail store, product, and brand.
Consumer attitudes are a composite of a consumer’s (1) beliefs about, (2) feelings about, (3) and
behavioral intentions toward some “object”—within the context of marketing, usually a brand,
product category, or retail store. Thus Attitudes are:
Predispositions towards action
About or towards people and things
Evaluating people, objects and ideas
Made up of emotional reaction (affective), thoughts and beliefs (cognitive), and actions
(behavioral) components.
Page 24
24
Strength of attitude increases with accessibility and knowledge about the topic in question.
Attitudes are often learned from other people and are often a defining characteristic of groups. It
can also be genetic. A strong attitude is very resistant to change.
The main characteristics of attitudes are:
Attitudes are learned from personal experience, information provided by personal sources, and
company sources, in particular exposure to mass media. Attitude is concerned with the
evaluation of all the objects that are stored in the memory. Persons do not formulate attitudes for
the objects that are not in the memory. Based on the learning in memory customer makes his
purchase decisions. Marketer’s job is to make customers learn about their product. For example,
Pepsi came out with a promotion scheme at the launch of Lehar Pepsi. It gave an advertisement
in the news paper, inviting readers to try it simply by tearing the advertisement and getting a free
Pepsi in exchange of it. The promotion generated excellent word of mouth publicity for the
brand. In the process consumers read the advertisement and learned about the new product.
1. Attitudes are predisposed. When customer learns then he formulates his attitude inclined as
either positive or negative, which directs the customer actions. Thus, attitudes have a
motivational quality; that is, they might propel a customer towards a particular behavior or repel
the customer away from a particular behavior.
2. Attitudes are directed towards an object, here object that is stored in the memory of the
individual. Customers can have attitude towards a tangible such as air-conditioning product, or
intangible as Voltas AC brand, is called an attitude object. Objects in which marketers are
interested to know the attitude of the customers are brand, company product, advertisement,
price etc. In other words an attitude is about evaluating people, objects and issues. For eg. Coca-
Cola knew that most of the Indians have positive attitude towards cricket (object). Also color red
Page 25
25
is associated with youth, energy and passion (positive attitude); Coca-Cola got associated with
the cricket fever in India. It said “The word which hits TV Screens was an attempt to show how
much both cricket and red objects are linked to the Coca-Cola. This is forming an attitude toward
the product with the help of favorable factors.
3. Attitudes are consistent, thus customer show consistency in behavior. Attitude once formed is
long lasting because it tends to endure over time. But attitudes can change as they are not
permanent. Hence marketers’ job is to maintain the positive attitude and change the negative
attitude, if any, towards their product.
2.6 Attitude and Behavior Linkage
There is a linear linkage between behavior and attitude. Research has discovered that there are
several conditions that lead to a strong link between attitudes and behavior.
Attitude Specificity: Some researchers believe that an attitude is only related to behavior
if they are both on the same level of specificity in time, objects, scope and circumstances.
For example, if attitude is ‘I really like green food products, there is a greater chance that
one would buy green or organic vegetables and other green food products. This statement
has reference to types of food products. Market researcher should measure an attitude
grounded in the reality of time place and ability to act upon them. Therefore asking ones
attitude toward food products would not be as useful in predicting whether someone
would buy green or non-green products unless their specific attitude about buying food
products is known.
Attitude Strength: Some attitudes are extremely important, there is high degree of
attitudes like enthusiastic or horrible, and they correspond to behavior. While other
attitudes are less central or amenable to change that may not lead to behavior.
Page 26
26
Additionally, the more “vested interest” a person has in the issue, the more likely
attitudes and behaviors will be correspondent. Thus if a person has heart problem he is
likely to have a negative attitude towards cholesterol oriented food and would avoid
eating it.
Direct Experience: As discussed before, attitudes are often formed from consumers’
direct experience. As compare to any other method attitudes held with greater confidence,
are more specific, more easily recalled, more resistant to change, and more likely to
influence or subsequent behavior. Those attitudes formed in this way are often more
consistent with behavior.
2.7 Relevance of the Topic
Green Marketing and Green Products are gaining popularity as we are progressing. People are
becoming health conscious which leads to popularity of green items. But, with respect to India,
not much of systematic research happened. So, with respect to existing literature from across the
world, there are many factors which can affect the green products popularity. So, the research
tries to identify the factors for green products’ popularity specifically in Indian context. Also, by
understanding these facts the organizations’ can improve their strategy for making the green
products more sellable and acceptable to the prospective consumers.
As we can see from the above discussion, green products are slowly gaining popularity due to
green marketing. Also, as people are becoming more conscious about health and environment,
they started behaving in a more conscious way. Still there are many barriers, such as price of the
green products, their availability etc. In our study we are considering two categories of green
products, such as green cosmetic and food products. Green products will be considered as
Page 27
27
equivalent to organic products, specifically for the food category. These products will be
produced by using organic fertilizers, without using any pesticides, insecticides, any inorganic
fertilizers or toxic elements. So, these products will be healthier in nature and safe to use.
In this context, it is important to examine various psychographic and demographic factors which
influence the usage of green products, specifically in cosmetic and food category in Kolkata and
around Kolkata in West Bengal, India. The various psychographic variables, such as
Environmental Consciousness, Health Consciousness, Price Sensitivity, Product Involvement
and Innovation in buying products are selected from a thorough literature review. The
demographic variables are also studied from a detailed literature review. The consumers’
perception about each psychographic variable is being understood using specific items. The
study aims to provide a snapshot of consumers’ belief about Green Cosmetic and Food Products
about various Psychographic and Demographic variables in and around Kolkata, West Bengal
(India).
2.8 Summary
In this chapter, the aims of this project/study are being discussed, which is to analyze the factors
influencing preferences for green products, specifically, cosmetic and food products in and
around Kolkata, West Bengal, India. An introduction to the theoretical background of this thesis,
including the contributions that it makes to research is also provided. This chapter ends with a
discussion about the relevance of the research topic.
Page 28
28
3: Background and Contributions from Existing Literature
3.1 Attitude and Behaviour
Consumers all around the world are turning “green.” In the US, outrage over the 1989 Exxon oil
spill shifted the environmental movement from the radical fringe and placed environmental
concerns into the mainstream. During the past decade in Western Europe, Green party members
have moved into positions of power within local and national governments, and even the
European Parliament in Strasbourg examines green consumption in the context of an increasing
focus on sustainable lifestyles said Ottman (1992) one of the rigorous writers on the topic. The
author argued that green buying must be seen in the context of wider debates surrounding the
development of sustainable ways of living that incorporate other environmental actions in a
holistic conceptualization of sustainable lifestyles. This framework is operationalized in a study
of environmental action in and around the home, in which 1600 households in Devon were asked
questions concerning their everyday environmental actions. These results were manipulated so as
to investigate how the different behaviors related to each other and also whether different groups
of individuals could be identified, conforming to different lifestyles.
As the concern for the environment has become a universal phenomenon, surely the profile of
the ecologically conscious consumer has evolved along with this fundamental shift in public
attitude said Roberts (1996). He looked at the demographic and attitudinal correlates of
ecologically conscious consumer behavior (ECCB). From the responses of 582 adult consumers
to a nationwide survey (n = 1,302), a profile of the ecologically conscious consumer was
developed. The findings suggest that ecologically conscious consumers of the 1990s differ from
Page 29
29
their predecessors. Demographics explained only 6% of the variation in the sample's ECCB. The
consumers' belief that they, as individuals, can help solve environmental problems (perceived
consumer effectiveness) was found to be the best predictor of ECCB.
Environmental concern can be driven by biospheric, egoistic or altruistic motives. Few studies,
however, have compared these three environmental motive concerns across cultural groups.
Duckitt and Linda (2006) investigated differences between European New Zealanders and Asian
New Zealanders in environmental motive concerns and their implications for pro environmental
behaviors. The results demonstrated that the tripartite model of environmental concerns provided
good fit in both samples. They also indicated that Asian New Zealanders were significantly
higher than European New Zealanders on egoistic concern, whereas European New Zealanders
were significantly higher on biospheric concern. For European New Zealanders, biospheric
concern predicted pro environmental behavior positively, whereas egoistic concern predicted it
negatively. For Asian New Zealanders, in contrast, both biospheric and altruistic concerns
predicted pro environmental behavior positively.
Willits (1994) conducted a statewide survey of Pennsylvanians in 1990 and provided data on
residents' opinions about ideas contained in the new environmental paradigm (NEP) and
behaviors that are environmentally protective. Although Pennsylvanians expressed support for
the NEP, they were not likely to engage in activities that contribute to environmental protection.
Correlation analysis revealed that although support for the NEP was predictive of environmental
behavior, the linkages were not strong. Social characteristics were more predictive of
environmentally oriented behaviors than supportive of the NEP.
Page 30
30
Research on consumers’ attitudes toward the environment is being conducted mostly in the
context of developed countries. There is a need to investigate this topic in less affluent societies,
said Sarigollu and Bodur (2005). Their study investigated the relationship between Turkish
(affluent society) consumers’ attitudes and their behavior towards the environment. A multistage
area sampling procedure was used to select 1,000 residences in Istanbul at which at-home
personal interviews were conducted using standard surveys. A consumer cluster analysis based
on behaviors toward the environment was conducted, and three distinct segments were
identified:
1. Active concerned,
2. Passive concerned and
3. Unconcerned.
For each cluster, attitudinal, demographic, socioeconomic and leisure activity profiles were
identified. Attitudes toward specific behaviors were found to be the best predictors of behavior,
followed by general attitudes, education, and locus of control. Policy implications were provided
for each cluster.
Times of India, Nielsen Company and Oxford University Institute of Climate Change conducted
a study in October 2011, which revealed that while Indians were “very concerned” about climate
change; globally, concern on the topic has declined. The study which measures consumer
attitudes towards the environment and climate change, surveyed 27,548 online consumers in 54
countries globally out of which 37 % consumers said they were very concerned about climate
change. This is lower than consumer concerns over climate change in 2009 (41%). According to
the survey, concern for climate change in India has increased by 1% in the last two years, with
Page 31
31
54% Indian consumer expressing deep concern about climate change. In India, a majority of
consumers believe that the main responsibility for solving climate change should lie with the
government, 37% Indians said that governments should restrict companies’ emissions of carbon
dioxide and other pollutants.
Gilg, Barr and Ford (2010) examined green consumption in the context of an increasing focus on
sustainable lifestyles. The authors argued that green buying must be seen in the context of wider
debates surrounding the development of sustainable ways of living that incorporate other
environmental actions in a holistic conceptualization of sustainable lifestyles. The results
suggested that conventional forms of green consumption can indeed be related to other forms of
environmental action and that at least four different types of environmentalist can be identified.
The literature examining the behavior of environmentally conscious consumers has focused
mainly on the examination of non-product specific environmental knowledge and attitudes or
environmental knowledge and attitudes in relation to single product lines, argued Bridget and
Antonis, who employed the constructs of product-line-specific environmental knowledge and
attitudes, that is knowledge of and attitudes towards the green products and their impact on the
environment. Presenting the results of an exploratory study examining the relationship between
product-line-specific environmental knowledge and attitudes for multiple green product lines,
testing hypotheses generated from the literature, utilizing a questionnaire measuring self-reports
of environmental knowledge and attitudes. No direct relationship was found between product-
line-specific environmental knowledge and attitudes, and that consumers do not simply believe
that a green product was good for the environment without also knowing how the product
impacts on the environment.
Page 32
32
Arcury (1990) found that environmental knowledge is consistently and positively related to
environmental attitudes, although the relationship was not especially strong. With the correlation
of knowledge and attitudes, the low level of environmental knowledge has disturbing
implications for environmental policy. For the research purpose, increased knowledge about the
environment was assumed to change environmental attitudes, and both environmental knowledge
and attitudes were assumed to influence environmental policy. As a very little research has
focused on public environmental knowledge or the relationship between knowledge and
environmental attitudes, the researcher used telephone survey data from 680 Kentucky residents
to address this gap in the literature. Specifically, the analysis examined how environmental
knowledge and attitudes were related to socio-demographic factors (gender, age, education,
income and residence). As in similar research, the respondents to the survey also did not score
well on the measures of environmental knowledge.
It was expected that adolescents who demonstrate more pro environmental attitudes were more
likely to demonstrate pro environmental behaviors. Meinhold and Malkus (2005) hypothesized
that perceived self-efficacy would have a moderating effect on the environmental attitude-
behavior relationship. In that the relationship between pro environmental attitudes and behaviors
would be stronger among adolescents with high levels of self-efficacy. Their study examined the
relationships among adolescent environmental behaviors and self-efficacy, knowledge, and
attitudes. Participants were 848 students from three academically achieving high schools on the
West coast. Hierarchical regression analyses were used for all subsequent analyses. Results
indicated that pro environmental attitudes significantly predicted pro environmental behaviors
and that environmental knowledge was a significant moderator for the relationship between
environmental attitudes and environmental behaviors. This was especially true for males.
Page 33
33
Literature suggest that environmental attitudes of Americans were more pro-ecological, were
more internally consistent, and were more likely to be related to environmental behavior and
knowledge and other attitudinal and personality variables. To check the views of previous
writers, Arbuthnot and Lingg (1975) matched samples of French (n=56) and American (n=112)
adults. They conducted surveys assessing environmental behavior (recycling), knowledge and
attitudes as well as more general attitudes and personality traits. While minimal differences were
observed in recycling, the relationships of this behavior with other variables indicated differing
conceptions between cultures. It was suggested that knowledge may act as a mediating variable
between attitudes and behavior.
Chang (2001) examined the influence of various cultural and psychological factors on the green
purchase behavior of Chinese consumers. To this end, a conceptual model has been proposed
subjected to empirical verification with the use of a survey. The survey results obtained in two
major Chinese cities provide reasonable support for the validity of the proposed model.
Specifically, the findings from the structural-equation modeling confirmed the influence of the
subjects' man–nature orientation, degree of collectivism, ecological affect, and marginally,
ecological knowledge, on their attitudes toward green purchases. Their attitudes toward green
purchases, in turn, were also seen to affect their green purchase behavior via the mediator of
green purchase intention. Although the findings of the study provided a better understanding of
the process and significant antecedents of green purchasing, they also highlighted two areas for
more thorough investigation. These were the exact role of ecological knowledge in Chinese
consumers' green purchasing process and the underlying factors that account for their low level
of green purchase. This study also discussed how the findings of the study can help the Chinese
government and green marketers to fine-tune their environmental programs.
Page 34
34
3.2 Environmental Attitude
Environmental Attitudes (EA) is a crucial construct in environmental psychology. This can be
stated as psychological tendency expressed by evaluating the natural environment with some
degree of favor or disfavor. There are hundreds of EA measures available based on different
conceptual and theoretical frameworks, and most researchers prefer to generate new measures
rather than organize those already available. Milfont and Duckitt’s (2010) research provided a
cumulative and theoretical approach to the measurement of EA, in which the multidimensional
and hierarchical nature of EA was considered. Reported findings from three studies on the
development of a psychometrically sound multidimensional inventory to assess EA, cross-
culturally and the Environmental Attitudes Inventory (EAI) shows that the EAI has twelve
specific scales that capture the main facets measured by previous research. The twelve factors
were established through confirmatory factor analyses, and the EAI scales are shown to be
unidimensional scales with high internal consistency, homogeneity and high test-retest
reliability, and also to be largely free from social desirability.
According to Balderjahn (1988) Demographic, socioeconomic, cultural, personality, and
attitudinal variables were specified to predict five different patterns of ecologically responsible
consumption. He analyzed a casual model of ecologically concerned consumers by the LISREL
(linear structural relations, is a statistical software package used in structural equation modeling)
approach. The results suggested that each behavioral pattern has its own cluster of predictors,
although the ecologically concerned consumer belongs to the upper social classes. The results
presented can provide a foundation for market segmentation strategies and for educational
programs of policy makers.
Page 35
35
Kaiser, and Wilson (2000), further develop the General Ecological Behavior (GEB) scale in
order to apply it cross-culturally. The scale was proposed to be relatively open, neither bound to
a particular set of ecological behaviors nor to a particular questionnaire response format.
Questionnaire data from 686 California students were compared with the original Swiss
calibration data. Reliability, internal consistency, and discriminate validity recalled that the GEB
could be applied to the California students as well as to the Swiss sample, which consisted of
older adults. Because the GEB measure makes use of behavior difficulties–caused by situational
influences-the then proposed approach also guided the search for political actions that could
promote changes in more ecologically behaving societies.
Antil (1983) said that accurate measures of attitude are critical if a researcher hopes to obtain
high correlations between attitude and behavior. His research suggested the use of response
certainty as a valuable method to increase attitude-behavior correlations and assist the researcher
in interpreting results from attitude measurement. Empirical evidence and theoretical support for
the use of response certainty was also provided.
Kilbourne and Pickett (2007) examine the relationship between materialism, environmental
beliefs, environmental concern, and environmental behaviors. The study used a random
telephone survey of 337 US adults. Using a causal modeling approach, the study demonstrated
that materialism has a negative effect on environmental beliefs, and these beliefs positively affect
environmental concern and environmentally responsible behaviors. The article then provided
implications of the results for consumer and environmental policy.
Page 36
36
Michal, Tarrant and Cordell (1997) indexed five different environmental attitude scales on an 11-
item self-reported general environmental behavior index derived from a confirmatory factor
analysis. Correlations between each of the 5 attitude scales and the behavioral index were
computed and a Fisher's Z-transformation was used to test for the effect of six respondent
characteristics (gender, residence, education, income, age, and political orientation) on the
attitude-behavior correlations. Although all of the five scales were significantly correlated with
the behavioral index (p < .001), correlations for some attitude scales were highly affected by
respondent characteristics. Of the 5 scales examined, the Environmental Concern (EC), New
Environmental Paradigm (NEP), and Awareness of Consequences (AC) scales were associated
most strongly with behavior, but the EC and NEP also were significantly affected by respondent
characteristics. Implications for future studies and use of the scales were discussed.
Stern (2000) developed a conceptual framework for advancing theories of environmentally
significant individual behavior and reported on the attempts of the author's research group and
others to develop such a theory. He discussed definitions of environmentally significant
behavior; classifies the behaviors and their causes; assesses theories of environmentalism,
focusing especially on value-belief-norm theory; evaluates the relationship between
environmental concern and behavior; and summarizes evidence on the factors that determine
environmentally significant behaviors and that can effectively alter them. The article concluded
by presenting some major propositions supported by available research and some principles for
guiding future research and informing the design of behavioral programs for environmental
protection.
Page 37
37
Given their definition of subjective norms, rational-choice theories must be located within the
realm of social conventionality. However, subjective norms can be grounded in moral as well as
conventional considerations. Not surprisingly, then, rational-choice theories insufficiently
explain behaviors that are at least partially moral, such as ecological behavior. Florian, Britta and
Bogner(2007) established and expands rational-choice model of environmental attitude that
extend into the moral domain by using feelings of personal obligation toward the environment
(i.e., feelings of responsibility) as an additional predictor of intentions to behave ecologically.
Findings from two studies were presented. In Study 1 a sample of Swiss adults (N = 436) was
used to test the proposed model. Study 2 replicated the findings of Study 1 with a sample of
California college students (N = 488). Assessments were carried out in a structural equation
modeling framework. Environmental knowledge, environmental values, and responsibility
feelings together explained 45% (50% in Study 2) of the variance of ecological behavior
intention which, in turn, predicted 76% (94%) of the explainable variance of general ecological
behavior. As the inclusion of responsibility feelings increased the proportion of explained
variance of ecological behavior intention by 5% (10%) above and beyond a more basic attitude
model, the moral extension of the proposed attitude model is largely supported.
Mainieri, Barnett, Valdero, Unipan and Oskamp (1997) investigated the variables that predict
“green buying” (i.e., buying products that are environmentally beneficial). Predictor variables
included awareness about environmental impacts of products, specific environmental beliefs of
consumers, several general environmental attitude scales, demographic variables, and several pro
environment behaviors other than buying behavior. A written questionnaire, mailed to randomly
selected residents of 8 middle-class communities in the Los Angeles area, was answered by 201
respondents. The results of hierarchical multiple regression analyses supported the hypotheses
Page 38
38
under study: Specific consumer beliefs predicted several green-buying variables as well as
general environmental attitudes, whereas general environmental attitudes predicted only one
aspect of green buying. Women were significantly higher than men on two aspects of green
buying and on the environmental attitude scales. Home ownership was positively related to
recycling behavior.
According to Young, Hwang, McDonald and Oates (2008) “attitude/ behavior gap” or
‘values/action gap’ is where 30% of consumers reported that they are very concerned about
environmental issues but they are struggling to translate this into purchases. For example, the
market share for ethical foods remained at 5 per cent of sales. The paper investigated the
purchasing process for green consumers in relation to consumer technology products in the UK.
Data was collected from 81 self declared green consumers through in depth interviews on recent
purchases of technology products. A green consumer purchasing model was developed and a
success criterion for closing the gap between green consumer’s values and their behavior was
established. The paper concluded that incentives and single issue labels (like the current energy
rating label) would help consumers concentrate their limited efforts. More fundamentally, “being
green” needs time and space in peoples’ lives that is not available in increasingly busy lifestyles.
Implications for policy and business were proposed.
As resource conservation is an imperative for sustainable development, it is crucial to achieve a
deeper understanding of the factors involved in people's decisions to recycle. This is even more
so because the level of environmental concern is usually higher than the level of ecological
behaviors. Castro, Garrido, Reis and Menezes (2009) have taken this fact that decision-making
regarding conservation behaviors happens in the context of an internal debate where
Page 39
39
contradictory ideas were weighed up and the possibility of ambivalence arises. The main aim of
the paper was therefore explored how contradiction and ambivalence impact upon the attitudes,
intentions and pro-ecological behaviors of the private sphere. The paper focused specifically on
the separation and deposition of metal cans, and compared the predictive capacity of beliefs,
attitudes and intentions for two groups of respondents – one with a high and another with a low
level of ambivalence, as assessed with a direct measure. The role of personal identity and the
influence of structural constraints were also explored. Results demonstrated a clear moderating
effect of experienced ambivalence, and showed, how beliefs, particularly negative ones, present
a higher predictive capacity of the attitude in the high-ambivalence group, and personal identity
play a relevant role in predicting behavior in both groups. They discussed the importance of
pursuing the study of ambivalence when analyzing decision-making in the conservation area.
Gonzalo and Asuncion’s (2005) work centered on the study of consumer recycling roles to
examine the socio-demographic and psychographic profile of the distribution of recycling tasks
and roles within the household. With this aim in mind, an empirical work was carried out, the
results of which suggested that recycling behavior is multidimensional and comprises the
undertaking of different roles with different socio-demographic and psychographic causal
characteristics. The practical implications of these results can be applied in the implementation
of segmentation policies that consider recycling behavior as the product on offer in a
discriminate fashion depending on the role to be promoted among the population.
Karns and Khera (1983) reported a longitudinal analysis of residential energy conservation by
residents in a medium size U.S. metropolitan community. Mail panel surveys were conducted
during winter months of 1979, 1980, and 1981. The results were presented in the form of a
multivariate causal model with cross-lagged correlations over time. Perceptual, attitudinal, and
Page 40
40
behavioral variables were found to be the major causal factors with certain other variables having
secondary effects. Demographic variables were not significant in explaining actual conservation.
The model presented was a rotational, parsimonious model which suggested several avenues for
public policy including indications of potentially effective conservation messages, audience
segmentation and time required for such interventionist strategies to show results.
Kent and Bottom (1991) characterized participants in three related, but different environmental
protection activities. The activities studied were donating items for reuse, recycling newspapers,
and walking when possible for reasons of conservation and environmental concern. The findings
indicated that demographic, media usage patterns, information sources, and knowledge provide
modest understanding of environmental protection activities. The empirical findings of the study
provided policymakers with insights into how environmental protection activities can best be
promoted.
Barr (2007) studied three waste management behaviors (waste reduction, reuse, and recycling)
with the use of a conceptual framework developed by him. It was posted that environmental
values, situational characteristics, and psychological factors all play a significant role in the
prediction of waste management behavior, within the context of a core intention-behavior
relationship. The framework was tested in a self-report questionnaire of 673 residents of UK. It
was found that the predictors of reduction, reuse, and recycling behavior differed significantly,
with reduction and reuse being predicted by underlying environmental values, knowledge, and
concern-based variables. Recycling behavior was, in contrast, characterized as highly normative
behavior. The use of the approach taken for investigating other environmental behaviors was
examined.
Page 41
41
3.3 Conservation Behavior
A sustainable planet is not possible without conserving behavior. The resource-costly life-styles
that are characteristic of the current scenario present a historic challenge. Never before have so
many behaviors needed to change in such a short time. More challenging is that they must stay
changed. For many reasons the techniques commonly used to promote conservation behavior are
more reliable at modulating short-term behavior than at achieving durable change. The perceived
urgency of environmental problems tends to make immediate behavior change the major focus.
But of equal importance is the stability of behavior once changed. Thus one goal of conservation
behavior research is to discover techniques that change individual behavior while minimizing or
eliminating the need for repeated intervention. Raymond (1993) categorized behavior change
techniques first by their informational or motivational nature and second by the source of the
change: derived from others or gained by direct personal involvement. Evaluated selected
techniques using five proposed dimensions suggested why durable behavior change has been so
hard to achieve.
To cut down the overuse of plastic shopping bags, the Indian government had implemented a
restriction policy. Under this policy, hypermarkets and many other stores are prohibited from
offering free plastic shopping bags. They can only sell them. Lam’s (2006) study was aimed at
using a set of psychological and situational variables to predict customer's bag-use behaviors,
which included bringing one's own bag and buying bags from the hypermarket. The predictors
were attitude toward the behavior, environmental concern, and personal norm; self-efficacy of
bringing bags; self-efficacy of not requesting bags; response efficacy; and situational variables.
Results showed that their model could predict both bag-bringing and bag-buying behaviors. Self-
Page 42
42
efficacy of bringing bags was the main variable that determined whether customers would bring
their bags to shopping, whereas situational variables determined whether customers would buy
bags. Oskamp, Harrington, Edwards, Sherwood, Okuda and Swanson (1991) investigated factors
encouraging or deterring recycling, telephone interviews were used to study recycling behavior,
attitudes, and knowledge of 221 randomly selected adults in a suburban city that had begun a
citywide curbside recycling program within the past year. Approximately 40% reported
participation in the curbside recycling program, and nearly 20% more claimed that their
household had been recycling in other ways. Most demographic variables did not predict
participation in the curbside recycling program, nor did general environmental attitudes and
behaviors, though simple conservation knowledge did. The main significant predictors of
curbside recycling were a few demographic variables, attitudes, and behavioral variables that
pertained specifically to recycling. As predicted, factor analyses showed that there was no
general factor underlying (a) various environmental attitudes and (b) various environmental
behaviors, all of which might seem on a priority basis to be related.
Kalafatis, Pollard, East and Tsogas (1999) examined the determinants that influence consumers’
intention to buy environmentally friendly products. The authors adopted the Ajzen’s Theory of
Planned Behavior (TPB) as the conceptual framework of the research and the appropriateness of
the theory was tested in two distinct market conditions (UK and Greece). Although the findings
offered considerable support for the robustness of the TPB in explaining intention in both
samples, there was some indication that the theory was more appropriate in well established
markets that are characterized by clearly formulated behavioral patterns (i.e. the model fitting
elements of the UK sample were superior to the corresponding ones obtained from the Greek
sample). The results were consistent with previous research on moral behavior. Chao and Lam
Page 43
43
(2011) used both self-reported behavior (SB) and other-reported behavior (OB) as measures of
responsible environmental behavior (REB) and examined their validities. The validation process
included (a) comparing the frequency of behavioral intention (BI), SB and OB; (b) comparing
the model fit of Ajzen’s Theory of Planned Behavior (TPB) with SB and OB as dependent
variables respectively; and (c) testing the effect of social desirability on BI, SB, and OB. Data
were collected through survey and observation. The observers were 65 students trained to
observe their 172 roommates. These roommates also reported their own REBs in the survey.
Results showed that frequency of BI and SB were significantly higher than those of OB, and the
TPB model predicting SB fitted much better than that predicting OB. These and other findings
suggested that researchers should be careful in interpreting results based solely on self-reported
REB.
The growing collective consensus among the public is to possess environmental attitudes, as the
majority consider themselves to be “environmentalists.” However, do the public’s environmental
attitudes or concern translate into environmentally responsible behaviors? The question answered
by Thapa (1999), whose study sought to verify among undergraduate students the level of
environmentalism—the relation of environmental attitudes and responsible behaviors. College
students were targeted because they are the future custodians, planners, policy makers, and
educators of the environment and its issues. Environmental attitudes were analyzed using the
revised New Ecological Paradigm (NEP) scale, and behaviors were measured with the
Environmentally Responsible Behavior Index. Overall, college students in the sample were
sympathetic toward the environment, and they supported the NEP ideology. However, except for
recycling, students were not very participative in various environmentally responsible behaviors.
Page 44
44
Additionally, consistent with previous studies, the attitude-behavior relations were weak or
modest at best.
Given the definition of subjective norms, rational-choice theories must be located within the
realm of social conventionality. However, subjective norms can be grounded in moral as well as
conventional considerations. Not surprisingly, then, rational-choice theories insufficiently
explain behaviors that are at least partially moral, such as ecological behavior. Florian, Ranney,
Hartig and Bowlerdf (1999) in their paper established an expanded rational-choice model of
environmental attitude that extends into the moral domain by using feelings of personal
obligation toward the environment (i e., feelings of responsibility) as an additional predictor of
intentions to behave ecologically. Findings from two studies were presented. In Study 1, a
sample of Swiss adults (N = 436) was used to test the proposed model. Study 2, replicates the
findings of Study 1 with a sample of California college students (N = 488). Assessments were
carried out in a structural equation modeling framework. Environmental knowledge,
environmental values, and responsibility feelings together explained 45% (50% in Study 2) of
the variance of ecological behavior intention which, in turn, predicted 76% (94% in study 2) of
the explainable variance of general ecological behavior. As the inclusion of responsibility
feelings increased the proportion of explained variance of ecological behavior intention by 5%
(10% in study 2) above and beyond a more basic attitude model, the moral extension of the
proposed attitude model was largely supported.
People frequently fail to see themselves as environmentally conscious consumers; one reason for
this is that they are often prone to dismiss their more common ecological behaviors (e.g., avoid
littering) as non-diagnostic for that particular self-image. The cueing of commonly performed
Page 45
45
ecological behaviors as environment friendly (what we call positive cueing) renders both cued
and non-cued common ecological behaviors more diagnostic for the inference of pro-
environmental attitudes (Study 1). As a result, positive cueing increases the likelihood that
people will see themselves as consumers who are concerned with the degree to which their
behavior is environmentally responsible (Study 2). The cueing of common ecological behaviors
leads participants to choose environment friendly products with greater frequency, and even to
use scrap paper more efficiently (Study 3). They also discussed the implications for effective
social marketing campaigns.
It is well documented that if environmental degradation is to be halted then pro-environmental
activities need to be put in place now. Bhate (2005) insisted that the participation of consumers
(C), marketers (M) and policy-makers (in this case, the local council (LC) is required for the
green lifestyle. An examination of the environmental portfolios of LCs and Ms indicated a
noticeable increase in behavioral activity which has led to an improvement in their
environmental provision. This included services ranging from recycling to provide information
on environmental issues. However, empirical evidence indicated that consumers may have either
inadequate or inappropriate knowledge about environmental issues which may have led to low
involvement levels and consequently limited behavior. It may therefore be necessary to
distinguish between cognitions that are affected under high or low involvement situations. The
involvement levels, however, might be mediated by the consumer behavior settings (CBS).
Using the Behavioral Perspective Model the study observes the impact of CBS and involvement
on environmental behavior. The results indicated that in the low involvement condition CBS has
a crucial role to play whereas in the high involvement situation its role might not be significant.
Page 46
46
Due to the omnipresent attitude–behavior gap, conservation psychologists have ceased to believe
that attitudes are traceable from people's behavioral records. In contrast to this conventional
wisdom and to the current state of the art in attitude measurement, Florina, Oerke and Bogner
(2007) developed a behavior-based attitude scale for adolescents, which were based on people's
recall of their past behavior. Using a cross-sectional survey of 928 students, findings suggested
that people's environmental attitude can be reliably derived from self-reported conservation
behaviors by employing Rasch-type models. Their new attitude measure substantially overlaps
with two previously established, conventional environmental attitude scales. Technically,
behavior-based environmental attitude represents as much an attitude measure as it does a
measure for people's goal-directed conservation behavior.
Research has demonstrated that environment friendly behavior is perceived as low status, which
can explain why such behavior is not more widespread. However, greater awareness of
environmental issues and the advent of a “green” movement may have seen a change in those
attitudes. As some conservation behaviors used in past research may have been conflated with
lower socioeconomic status, Kimerling (2001) in Study 1 identified financially neutral behaviors
so that SES would not be confused for status in general. Study 2 utilized two of those behaviors
to investigate whether engaging in conservation behavior is viewed as low status. Participants
rated a target who performed zero, one, or two conservation behaviors. Counter to earlier
research, it was found that neither number nor type of environmental behaviors performed
affected the perceived status of the target. These results suggested that attitudes toward
conservation behavior may be improving. Since the 1960s, environmental issues have gained
importance in business as well as public policy discourses. Recent polls reported that 87% of
U.S. adults are concerned about the condition of the natural environment , 80% believe that
Page 47
47
protecting the environment will require major changes in current life-styles Ottman (1992) and
75% consider themselves to be environmentalists Osterhus, (1997). Goswami (2001) India also
has witnessed rapid strides of development at sustained growth rates of more than 8% and has
seen a huge spurt in consumption. Consequently, it has been estimated that the increased
consumption may result in the country becoming one of the leading offenders relating to
environmental pollution.
Not surprisingly then, some scholars believe that consumers are willing to pay premiums for
green products because consumers often prioritize green attributes over traditional product
attributes such as price and quality: 50% of Americans claim to look for environmental labels
and to switch brands based on environment-friendliness according to Phillips(1999).
Eriksson(2001) also assumes that consumers are willing to pay a premium for a good that has a
low impact on the environment and examine if a little dose of such idealistic behavior can have a
large impact on the environment, and thereby (partially) replace the environmental regulation
that would otherwise be necessary to internalize externalities. The analysis was carried out in a
model with product differentiation, where consumers differ in their preferences for product
quality. Consumers’ willingness to pay the environmental premium might be uniformly or non-
uniformly distributed. However, it appeared that green consumerism will only be modestly
influential in both cases, despite the fact that product differentiation leads to relaxed competition
and increased profits, and thereby creates leverage.
Concerns related to the environment are evident in the increasingly ecologically conscious
marketplace. Using various statistical analyses, Laroche, Bergeron, Guido (2001) investigated
the demographic, psychological and behavioral profiles of consumers who were willing to pay
Page 48
48
more for environmentally friendly products. They found that this segment of consumers were
more likely to be females, married and with at least one child living at home. They reported that
today’s ecological problems are severe, that corporations do not act responsibly toward the
environment and that behaving in an ecologically favorable fashion is important and not
inconvenient. They place a high importance on security and warm relationships with others, and
they often consider ecological issues when making a purchase. According to a leading news
paper Times of India (2011) it is an encouraging sign for the future market for environment-
friendly products that 28% Indians felt that there should be major government-led initiatives for
research into scientific and technological solutions like low-emission cars and renewable energy.
Nearly three out of every 10 Indians said that there should be a change to use of more energy
efficient bulbs, fixtures and electrical appliances to combat climate change. More than a quarter
of Indian consumers believe in recycling consumer waste and saving electricity to address issues
of climate change and global warming. Indians also believe that the government should invest in
improved public transport systems (23%) and that there should be government incentives (tax
breaks or subsidies 22%) to promote non-polluting behavior.
Gerard and Edmund (1998) said as consumers' environmental concerns have risen over the past
decade, many companies have responded with “green” products, processes and public relations.
Superficial and even spurious firm responses have resulted in claims that marketers have
cynically segmented and exploited green markets in an opportunistic way. However, whether the
hesitation of marketing managers or overall corporate policy is behind such claims has not been
investigated. Their paper explored the issue by assessing the personal attitudes, opinions and
behavior of senior marketing executives across a range of firms. The results suggest that the
majority of marketers, in their personal lives, do in fact display attitudinal and consumption
Page 49
49
patterns consistent with environmental concerns. Hence, when the finger of green-market
exploitation is pointed, it should perhaps be in the direction of wider corporate objectives and not
at beleaguered marketers.
However, the caveat is that such claims and attitudes may not always translate into actual
behaviors. So far there is little consensus about the identity and nature of green consumers,
except that there have been something of a disappointment to the marketers who have pursued
them. These difficulties perhaps reflect the folly of trying to understand green consumption and
green marketing by viewing it as simply a variation on conventional marketing, said Ken(2001).
The green consumer has been the central character in the development of green marketing, as
businesses attempt to understand and respond to external pressures to improve their
environmental performance. Marketing practitioners and academics are attempting to identify
and understand green consumers and their needs, and to develop market offerings that meet these
needs. The article proposed some different ways of looking at green consumption and green
marketing, which have the potential to prevent the hunt for the green consumer from
deteriorating into a wild goose chase.
To establish the implications of environmental advertising on purchase behavior Hartmann and
Ibanez (2008) studied the impact of environmental advertising on consumer purchase behavior as
virtual nature experiences turn out to wield the most significant influences, regardless of the
consumer's degree of environmental attitudes. The study suggested that consumer exposure to
nature's media representation in green product advertising may lead to emotional experiences
during product consumption that are analogue to those experienced in “real” nature. These
“virtual nature experiences” may constitute emotional consumption benefits in consumer's
Page 50
50
perception. Two further kinds of emotional consumption experiences related to environmental
products were identified: the feeling of well-being from acting in an altruistic way (“warm
glow”), and self-expressive benefits. The influences of the proposed consumption experiences on
the consumer's attitude toward the product were analyzed in the scope of a survey of consumer
perceptions of three competing energy brands, one of them positioned as a green energy brand.
Results revealed mostly positive influences on product attitude, with the particular pattern of
effects being significantly moderated by the environmental attitudes of the respondents.
Among leather, chemicals and others, the textiles industry in India is traditionally one of the
worst offenders of pollution, with its small units following outdated technology processes. One
opportunity to reduce the environmental impact of clothing industry in India is to concentrate
textile production within environmentally certified or eco-labeled clothing. In the absence of any
reach in the area, Goswami (2008) investigated whether the urban Indian population would be
interested in clothing with eco-labels. The results suggested the existence of a segment of
consumers who are positively motivated towards eco-labeled garments. This segment profile was
described in terms of demographic and psychographic variables.
To overcome the problem of environmental degradation various governments have started Eco-
labeling schemes. Eco-labeling is an important tool to overcome market failure due to
information asymmetries for environmental products. While previous research has discussed the
importance of labeling, Sammer and Wustenhagen (2006) provided empirical data on the
influence of eco-labels on consumer behavior for household appliances. It reports on the results
of a survey involving a total of 151 choice-based conjoint interviews conducted in Switzerland in
spring 2004. Choice-based conjoint analysis (also known as discrete choice) has been applied to
Page 51
51
reveal the relative importance of various products attributes for consumers. The EU energy label
was used for the product category chosen in the survey, washing machines, and they also
investigated the relative importance of eco-label compared with other product features (such as
brand name) in consumers' purchasing decisions. They drew conclusions for sustainable
marketing policy.
From a logical point of view, labels are conceived as claims put forward by sellers to inform
buyers about certain characteristics of their products. In the case of sustainability, labels might
identify relevant ‘ideals’ to approach and significant ‘ills’ to escape. Boer (1995) in his paper
examined the role of labeling and certification schemes in the pursuit of policies to make
production and consumption processes more sustainable. Toulmin's argumentation theory was
used to show how claims can be substantiated and challenged. Based on literature on the
behavior of the main stakeholders, the author discussed what labeling meant for producers,
consumers, policymakers and other groups in the society. In the conclusion, attention was drawn
to the way in which societal pressure might interact with market forces to shape the information
on environment for products and services. As a result, the role of sustainability labels might
become more differentiated, varying from direct shopping aids to background quality assurances.
Previous research has suggested that consumers are becoming increasingly concerned by the
effects of conventional agricultural food production practices on human health and
environmental wellbeing. Forbes, Cohen, Cullena, Wratten and Fountain’s (2009) study sought
to understand whether environmentally sustainable practices in the vineyard would equate to
advantage in the wine marketplace. Structured questionnaires were used to ascertain the views of
wine consumers in Christchurch, New Zealand. The findings of the study indicated that
consumers have a strong demand for wine which is produced using “green” production practices.
Page 52
52
Consumers believe that the quality of sustainable wine will be equal to or better than
conventionally produced wine, and they are prepared to pay a higher price for this wine.
The theoretical exposition of the trade-environment linkage (in the form of Environment Kuznets
Curve) has been extensive. While one set of studies show that with the increase in per capita
income environmental degradation would decline, the other set of studies has shown that no such
trend exists for developing countries, said Keren and Gupta (2003). Though environmental laws
are in place, firms display a very low level of compliance in developing countries. The article
brought out the low level of compliance.
One reason behind the green behavior could be the social pressures to be ‘green’ explained
Ritchie and McDougall (1985). Consequently, notwithstanding the claims about the concern for
the natural environment, mass consumer markets for green products in most categories are yet to
be developed.
3.4 Corporate Initiatives
Kulkarni Prasad in the newspaper daily Times of India (2014) said that every year suburban
areas around Kolkata witnesses at least 65 days during which ozone levels are dangerously high.
These are the effects from the pollution by the various jute mils and other cotton industries along
Ganges. The situation is worse in the heart of the city, which is urban in nature”. According to
scientists of Indian Institute of Tropical Meteorology (IITM) Ozone is the main ingredient of
urban ppbv (particle per billion by volume) which is much above permissible limits.
Concern about the environment and its effects on industrial progress is on an increasing trend
according to Roome and Hinnells (1993). Some environmentalists have suggested that
environmental pressures and pollution are advancing at such a fast pace that many industries will
Page 53
53
be obsolete in the recent future. As corporates are more concerned about the environmental
degradation, the authors suggested that it is high time for the corporates to understand that only
environmental friendly industries can only survive in the long run. The corporates are developing
a conceptual framework to analyze the process of managing product development while
considering the environmental aspects of the products. Existing researches consider the
implications of such a conceptual framework against the empirical evidence emerging about
product development in the industries.
Recently, a huge number of corporates declared themselves committed for sustainability and
integrated environmental issues in their corporate strategies (Bloom and Scott Morton, 1991;
Porter and Van der Line, 1995; Shrivastava, 1995; Walley and Whitehead, 1994). Several recent
developments justifies such concern for environmental issues, such as the negative
environmental impacts of the organizations’ operations and products; the growing interest of
public opinion, environmentalists and governmental institutions for the quality and sustainability
of the eco-system and the benefits derived from the adoption of environmentally conscious
programs.
According to Decicco and Thomas (1999) proper information about the environmental impacts
of a product is essential for implementing environmental protection. Such information can
influence consumers' choices and, by affecting product and corporate images in the marketplace,
might also influence technology development and product planning.
Some Indian corporate leaders have begun to take matter seriously said Kumar (2008). Telecom
companies like Bharti Airtel saves 96 trees a year by providing e-billing, uses video-
Page 54
54
conferencing to avoid travel, and has created energy efficient green shelters at around 7000 sites.
Companies like ONGC, ITC Nestle, Essar Oil, Tata Steel, Wipro, JSW Steel, ICICI, are also
taking initiatives for environmental sustainability. It is encouraging to locate that several high
pollution created sector firms (electricity generation, electrical equipment and construction) have
taken the initiative to collect emissions data and allotting senior management staff for
environmental sustainable, specifically climate control committee . But all these actions need to
be long term. According to Times of India Kolkata (2013), one of the worst offenders to
environment is pollution created by vehicles in the city. To combat the problem Mahindra and
Mahindra launched the Bio-diesel tractor of the price at par with regular tractor. The tractor runs
on 5% of biodiesel added to the regular diesel, it was also mentioned that minor changes in the
fuel injection system, can convert a normal tractor into the bio-diesel tractor. Mahindra and
Mahindra also plan to supply 200 liters of this fuel for free to initial customers to make it
popular. Also, governments are strengthening their actions by providing stringent rules and
regulations with respect to the running of automobiles in the urban and semi-urban areas.
In automobiles, almost all segments of the society are taking green initiatives. For example, two
wheeler, three-wheeler and passenger car buyers have greener alternatives available now in the
form of electric vehicles. These vehicles do not run on petrol or diesel instead run on electric
batteries (TOI). As a result, there are no problems of emission or pollution problems. Mass
transportation systems are also being served in an environment friendly way through
Compressed Natural Gas (CNG) run buses and auto services. Two other sectors covered are
hospitality and renewable energy. Four Indian hotels are certified by ECOTEL for their green
operations, while Tata BP Solar market products run on solar energy for domestic use.
Page 55
55
Not only the large enterprises, India’s rapid growth in small and medium enterprises had its
negative impact on the environment which is becoming a major concern to the Indian economy.
According to D'Souza, (2002), the government concerning about economic development and
raising the standard of living of its people, has actively supported the development of the small
enterprise sector. Due to their labor intensity and importance in generating employment
opportunities for the less well-off members of Indian society, they have been encouraged and
given assistance by the Indian government. However, small enterprises are considered to be the
worst polluters and, as the research findings indicated, government and authorities gave the least
attention to environmental issues as part of their operations. It is not affordable for these
enterprises to go for environmental friendly way of production. Although the existing
environmental legislation is similar to that in other countries, i.e. they all serve the same purpose
of protecting the environment. Negligence in implementing the environmental policies results in
pollution.
Albino, Balice and Dangelico (2009) said to respond effectively and efficiently to the
environmental sustainability challenge, an important role can be played by enterprises, through
appropriate strategies and operations, such as green processes and product development. In the
paper, they investigated whether the development of green products was supported by the
environmental strategic approaches adopted by sustainability-driven companies, and whether
there was economic sector or geographical area specificities. For this purpose, first authors
developed taxonomy of environmental strategies and defined measurable proxies for both the
environmental strategic approaches identified and the green product development. They studied a
sample represented by the enterprises included in the Dow Jones Sustainability World Index
(DJSWI). The methodology used was based on the content analysis of companies' websites and
Page 56
56
relevant documents, such as environmental and sustainability reports. The main result was that
the levels of adoption of different environmental strategic approaches were higher for green
product developers than for green product non-developers. Moreover, the most implemented
strategic approaches for green product developers vary depending on the economic sector, while
a more homogeneous behavior was found from the geographical perspective.
According to Times of India, 25th Nov, 2009 scientists have successfully bio-engineered
polymers, completely bypassing fossil fuel based chemicals. The team from KAIST Unichem,
led by Sang Yup Lee, professor, focused on polylactic acid (PLA) a bio-based polymer; the key
for producing plastics through renewable resources.
Coddington (1993) tracked back issues of environmental marketing to issues of environmental
management—i.e., the issues of overall corporate environmental commitment and responsibility.
It is absolutely essential that a commitment to corporate environmental improvement be in place
before an environmental marketing program is launched. Additionally, marketers should play a
central role in the greening of the corporation. The marketer brings at least two important skills
or strengths to the environmental improvement process-strengths of perspective and strengths of
skill set.
Giovanni and Manzini (2007) said, it is now widely acknowledged that environmental issues will
increasingly affect the performance of firms in western countries, both in the short and in the
long run. Environmental issues can act on revenues and on costs. They can influence revenues
when a firm follows a ‘green strategy’, i.e. it enhances the characteristics of environmental
compatibility of its products or it promotes a credible image of a ‘green company’ that employs
Page 57
57
only clean technologies. They can influence costs as, on the one hand, more limiting
environmental standards can result in higher manufacturing and non manufacturing costs and, on
the other hand, programs focused on improving environmental performances can result in less
spoils and wastes, hence in lower costs. Hence, environmental performance should be a
structured part of the management control system of an industrial firm. Unfortunately, it is not
completely clear how accounting information can be structured in order to obtain this result.
The paper was aimed at developing a set of information that can be used for a managerial control
focused on the environmental performance of an industrial firm and was organized in three main
sections. Section I described the conceptual requirements of the management control system
based on accounting information for monitoring the environmental performance of an industrial
firm (completeness, long term orientation, external orientation, measurability and cost).
Section II analyzed different classes of Environmental Performance Indicators (EPI) used in
practice. Both accounting measures (prevention costs and investments; operating environmental
costs; contingent environmental liabilities) and non financial measures (physical indicators;
compliance) are considered. Section III suggests an integrated approach to the design of the
management control system focused on environmental issues, where different classes of
indicators are used jointly. More specifically, two integrated systems, one mostly based on
physical measures and aimed at external communication, the other focused on accounting
measures and supporting managerial decision making, are suggested.
European Union (EU) policy makers implemented a Directive that will make producers
responsible for waste electrical and electronic equipment at end-of-life (known as the “WEEE”
Page 58
58
Directive) said Mayers, France and Cowell (2005) in February 2003. Under this new legislation,
producers were required to organize and finance the take-back, treatment, and recycling of
WEEE and achieve mass-based recycling and recovery targets. This legislation was part of a
growing trend of extended producer responsibility for waste, which has the potential to shift the
world's economies toward more circular patterns of resource use and recycling. The study used
life-cycle assessment and costing to investigate the possible environmental effects of the WEEE
Directive, based on an example of printer recycling in the United Kingdom.
For a total of four waste management scenarios and nine environmental impact categories
investigated in the study, results varied, with no scenario emerging as best or worst overall
compared to land filling. The level of environmental impact depended on the type of material
and waste management processes involved. Additionally, under the broad mass-based targets of
the WEEE directive, the pattern of relationships between recycling rates, environmental impacts,
treatment and recycling costs may lead to unplanned and unwanted results. Contrary to original
EU assumptions, the use of mass-based targets may not ensure that producers adapt the design of
their products as intended under producer responsibility.
It was concluded that the EU should revise the scope of consideration of the WEEE Directive to
ensure its life-cycle impacts are addressed. In particular, specific environmental objectives and
operating standards for treatment and recycling processes should be investigated as an alternative
to mass-based recycling and recovery targets. In recent years, the idea of ‘green’ or ‘political’
consumers expressing their political beliefs in everyday life has been widely embraced. Eager to
satisfy the needs of this new market segment, firms have allocated substantial resources to
environmental management, social accountability, corporate citizenship, occupational health and
Page 59
59
safety etc. said Pedersen and Neergaard1 (2006). During the 1990s, the industrialized world also
witnessed a growing number of environmental labels, expected to guide the political consumers
in their shopping decisions. Evaluations of these environmental labeling (eco-labeling) programs
indicate that some labels and product groups receive a great deal of attention while others remain
in obscurity. To understand these differences, the paper discussed some of the factors that
determine the market impact of environmental labeling. It was concluded that the concept of the
‘green’ consumer is over-simplified and failed to capture the actual complexity of consumer
values, attitudes and behavior. The results were based on existing literature and empirical
findings.
According to Economic Times, the government has asked corporate to communicate with their
shareholders electronically in order to cut down on the use of paper.
The move is a part of the latest green initiative by the ministry but could also help companies cut
costs by eliminating the need of paper for paper communication. Caroline (2005) attempted to
bridge business ethics to corporate social responsibility, and included the social and
environmental dimensions as well. The objective of the paper was to suggest a conceptual
methodology with which ethics of corporate environmental management tools can be considered.
The method included two stages that are required for a shift away from the current dominant
unsustainable paradigm and toward a more sustainable paradigm. The first stage was metaphoric
and normative. The second stage was a practical stage, which in turn, was analytic, descriptive
and positive. The method was applied to common industrial metabolism tools of ecological
footprints (EF), environmental life cycle assessment (LCA) and industrial ecology (IE). The
Page 60
60
application showed that all three tools can be used in business ethics, in particular, when the first
stage of the method was applied to their use.
The economic times group on its 50th anniversary has initiated the green awards which is given
to the corporate which has taken a green drive. As a part of its green drive global group
enterprises has started green tip of the day, a daily column in economic times, to make people
aware of small energy saving tips which can save a huge energy for the economy as a whole.
Not only corporates but NGOs are no way behind. “Save mother earth”- an NGO (TOI, 2010)
has announced the Green ambassador award, 2020. This award was presented to MLC Vandana
Chavan and additional commissioner of police Subhashchandra Dange for their green work.
It was believed that the hypothesized relationships were moderated and mediated by other
stimulus, so managers were advised not to negate corporate social responsibility, but rather to
invest wisely in environmental activities and its communication.
Countered with various changes in the competitive scenario, executives adopted a wide set of
strategic options which differ in the complexity of the adopted environmental programmes (from
compliance to existing regulation to the anticipation of future evolution of market expectations).
Most initiatives have a great impact on the company’s economics, the corporate management
system and the overall structure of the industrial system. Indeed, the improvement of
environmental performance often requires executives to commit significant financial resources in
new cleaner technologies (Financial implications) and to redesign business processes and the
corporate organization (managerial and organizational implications).
Page 61
61
Lubna (2007) in Economic Times has written that Eco-friendly measures seem attractive on
paper, but they do entail a higher cost, at least initially. No wonder then that 46% of companies
surveyed have declared they will only invest in low-carbon equipment if the running cost is the
same or lower than those of conventional equipments. A mere 40% have invested in low-carbon
equipments and only 38% have a company policy to do so.
It is because of the same reason that in approx two decades of its existence, only 12 companies
have secured Eco-Mark license from the Bureau of Indian Standards (BIS), the scheme’s
implementing agency. It can be called as catastrophe only that till date only seventeen licenses
have been issued under product categories of paper, wood substitutes and finished leather
products.
Livesey (1999) in his article “McDonald's and the Environmental Defense Fund: A Case Study
of a Green Alliance”, discussed both academic and practitioner-oriented, views alliances
between business and ecology groups as exemplifying a paradigm shift from command and
control to a new kind of environmental practice, market environmentalism, and privileges the
latter. This privileging occurs despite the claim made by the Environmental Defense Fund's
(EDF) leader Fred Krupp, one of the early proponents of market environmentalism, that, the new
form of supplements. The case study, examined the public discourse of one such alliance
between McDonald's and EDF. Rather than indicating a paradigm shift, the analysis showed that
both partners drew not only from the emerging discourse of market environmentalism, but also
from the older, and purportedly displaced, paradigm of command and control. This symbolic
ambivalence was emblematic of a larger discursive struggle, namely, the contemporaneous
socio-political conflict over how the ecological crisis was to be defined and what should
Page 62
62
constitute legitimate practice-by business, government and environmentalists-in its name. In
author’s view, the McDonald's-EDF partnership was at once constrained by the discursive
struggle over the environment and a constitutive element in the struggle itself.
Some scholars claim that green policies/products are profitable: green policies can reduce costs;
green firms can shape future regulations and reap first-mover advantages. Extending Maslow’s
(1943) theory, Hertzberg (1966) developed a theory of work motivation that focused on two
work-related factors: those that motivated employees (motivators) and those that prevented
dissatisfaction among them (hygiene). As discussed by Prakash (2000), a key challenge for
marketers is to understand whether consumers view firm/product greening as motivating factors
(their presence induces consumers to purchase given product; preference for a product is an
increasing function of the greening level) or hygiene factors (their absence may bother
consumers but, after a low threshold of greening, the preference for a product is not an increasing
function of the greening level). If consumers favor firms with green policies (for example, the
one with ISO 14001 certification) notable exceptions exist. For example, the looming trade war
between the US and the EU is partly due to the resistance of the European consumers to purchase
cheaper but genetically altered food items from the US.
Prakash (1997) opines that consumers preferred green products (the one with a higher percentage
of recycled inputs), green policies/products are motivating factors. Managers, therefore, have
economic justification to ensure that their firms/products are greener than their competitors’.
However, consumers do not care much about who is greener, but they do penalize firms that
violate environmental laws or emit high levels of toxins, greenness is a hygiene variable – 33%
of adults claimed to have avoided buying products, at least occasionally, from companies with
Page 63
63
poor environmental records (Ottman, 1996). If so, then the managerial task is to obey
environmental laws, to stay out of trouble with the regulators and to avoid bad press by
undertaking minimal beyond-compliance initiatives. Greening firms/products often creates
societal benefits (especially, over products’ life cycles) but imposes private costs on firms. If
firms do not/cannot pass on such costs to consumers, they hurt their shareholders. However,
most consumers are perhaps not ready to bear increased direct costs (as opposed to indirect costs
imposed by environmental regulations or more stringent product standards) either for societal
well being or due to their skepticism about firms’ environmental claims (Davis, 1993).
Consequently, many mass marketers continue to focus on the conventional product attributes
such as price, quality and product features (Hansen, 1997; Phillips, 1999).
3.5 Green Consumer Segmentation
Marketers have become increasingly aware in recent years of the impact that the company’s
activities can have on natural resources and environment in the general. Though much of the
attention accorded to this predicament of environmental degradation is focused upon business
practices, many feel that a measure of responsibility lies with the consumers as well and
therefore, a need to identify green consumer segments arise. A review of past literature indicates
that efforts to identify the ecologically conscious consumer have been made. This can be found
in the marketing literature far back as the early 1970s. There has been a plethora of research done
in this area using a variety of segmentation variables, attempting to profile environmentally
conscious members of the population in general. However there have been relatively few
attempts to classify consumers specifically according to levels of green purchasing behavior.
Roper (1993) cited by K Suresh has tracked these segments of consumers since 1990. As of
1996, the five segments are:
Page 64
64
True-Blues - This 10% of the US population holds strong environmental beliefs and lives
them. The most ardent of environmentalists, they believe they can personally make a
difference in curing environmental ills. Politically and socially active, they dedicate time and
energy to environmentally safe practices themselves and attempt to influence others to do the
same. True-Blues are six times more apt to contribute money to environmental groups and
over four times more likely to shun products made by companies that are not
environmentally responsible. Among the most educated of the five groups these people are
likely to be white females living in the Midwest or South. Almost one-third of them hold
executive or professional jobs.
Green Backs- Representing just 5% of the US population are so named because of their
willingness to pay extra for environmentally preferable products. They make up that small
group of consumers who say they will pay up to 22 percent more for green. They worry
about the environment and support environmentalism. They feel too busy to change their
lifestyles. Although Greenbacks are generally not politically active, they are happy and eager
to express their beliefs with their wallets; green purchasing within this group is very high.
Like the True-Blues, they are more likely than the average American to purchase any number
of green products and packages made from recycled material or that can be refilled.
Moreover, at 22% they are twice as likely as the average American to avoid buying products
from companies they perceive as environmentally irresponsible. Green backs are likely to be
married white males living in the Midwest (35%) and West (24%). They are well educated
young (median age 37) and are more likely than any other groups to hold white-collar jobs.
Sprouts- One third of the US population is classified as Sprouts. They are willing to engage
in environmental activities from time to time but only when it requires little effort. Thus,
recycling, which is curbside in many communities (as given in the study), is their main green
Page 65
65
activity. They read labels for greenness- although less often than the True Blues and
Greenbacks. Their greenness ends at the supermarket checkout; even through Sprouts and
Greenbacks have similar median incomes. Sprouts generally won’t choose a green product if
it is more expensive than others on the shelf. When they do, they are only willing to pay up
to 4 percent extra. More than half (56%) are female and they have the highest median age
(43) among the five groups. Sprouts are distributed evenly across the country. They are well
educated, and just under two-third of them are married. They comprise the swing group that
can go either way on any environmental issue. With more education, they are often the
source of new Green backs and True Blues.
Grousers- Fifteen percent of the US populations are Grousers. These people do not believe
that individuals play any significant part in protecting the environment. Instead, they feel that
the responsibility belongs to the government and large corporations. Often confused and
uninformed about environmental problems, 45 percent of Grousers recycle bottles and cans
regularly but grudgingly; they do so to comply with local laws rather than to contribute to a
better environment. They are far more likely than any other group including the Basic
Browns, to use excuses to rationalize their lax environment behavior. True to their name,
Grousers complain that they are too busy, that it is hard to get involved, that green products
cost too much and don’t work as well, and finally that everything they do will be
inconsequential in the whole scheme of things. Their overall attitude is that it is someone
else’s problem, so why bother. Demographically; Grousers are similar to the national
average, although with a somewhat higher proportion of African-American members.
Basic Browns- Representing 37 percent of the population, Basic Browns are not tuned in or
turned on the environment. They are simply not convinced that environmental problems are
all that serious. Basic Browns do not make excuses for their inactivity, they just don’t care.
Page 66
66
The difference of this group makes them less than half as likely as the average American to
recycle and only 1 percent boycott products for environmental reasons as proposed to the 11
percent national average. Three percent buy recycled goods compared to 18 percent
nationally. The largest of the five groups, Basic Browns have the lowest median income, the
lowest level of education, and live disproportionately in the South, for the basic browns;
there are just too many other things to worry about.
Roper Organization has been conducting a Green Gauge survey since 1990. But now there are as
many as six different segmentation studies, depending on how one behaves. That includes only
the studies available for sale by market research firms and does not include the segmentation
studies done privately by companies like Wal-Mart, Procter & Gamble, Clorox, and other
consumer product makers. These and other companies have been assessing and tracking green-
shopping attitudes and habits for their internal use.
The Natural Marketing Institute, surveyor of all things LOHAS, the market space that includes
organic foods, health and wellness, alternative medicine, green energy, green living, and other
goods and services divides the market into five categories. Approximately 25 variables were
used to conduct the statistical analysis. Techniques such as exploratory factor analysis,
confirmatory factor analysis, migration analysis, and K-means segmentation were utilized to
ensure the optimal solution. The following five groups were made.
Lohas: 19% (44 million) who are dedicated to personal and planetary health. Not only do
they make environmental friendly purchases, they also take action, they buy green products,
support advocacy programs and are active stewards of the environment. Very progressive on
environment and society, they look for ways to do more; not too concerned about price.
Page 67
67
Naturalites: 14% (33 million) focused on natural/organic consumer packaged goods with a
strong health focus when it comes to foods/beverages. They are not politically committed to
the environmental movement nor are they driven to eco-friendly durable goods. Primarily
concerned about personal health and wellness, and use many natural products; would like to
do more to protect the environment.
Drifters: 21% (49 million). This segment has good intentions, but when it comes to
behavior, other factors influence their decision more than the environment. Somewhat price
sensitive (and trendy), they were full of reasons why they do not make environmentally
friendly choices.
Conventionals: 29% (67 million). This, very practical segment does not have green attitudes
but do have some “municipal" environmental behaviors such as recycling, energy
conservation, and other more mainstream behaviors. Practical, like to see the results of what
they do; interested in green products that make sense (save money) in the long run.
Unconcerned: 17% (40 million) the environment and society are not priorities to this
segment. They are not concerned and show no environmentally-responsible behavior. Have
other priorities, not really sure what green products are available, and probably wouldn't be
interested anyway; they buy products strictly on price, value, quality, and convenience.
The Hartman Group, a Seattle-based market-research firm that's been tracking consumer
attitudes, mostly related to food and organics, since the 1980s. Hartman recently released The
Hartman Report on Sustainability: Understanding the Consumer Perspective, which looks at
"how consumers feel about a world struggling to live in balance today for the benefit of
future generations." It pierces the consumer landscape this way.
Radical Engagement- These people do not band together and employ radical means to
overcome major problems (36%).
Page 68
68
Sustained Optimism- They rely on rational intelligence and science, to overcome major
problems and secure a hopeful future (27%).
Divine Faith- Reluctant, leave things in God's hands, everything will turn out good
automatically (20%).
Cynical Pessimism- Don’t even believe that an individual can make any difference by their
acts (9%).
Pragmatic Acceptance- They don't worry about the major problems facing the world
because they are not individual’s concerns but the job of government (8%).
Landor Associates, perhaps the most prolific - and most confusing - surveyors of green market
research, revealed a study showing that 58% of the U.S. population considered themselves Not
Green Interested (they do not care about environmentally friendly practices, including recycling,
corporate social responsibility, or natural and/or organic ingredients); 25% were Green Interested
(concerned about the environment, but not active in its defense); and the remaining 17% were
Green Motivated (feel it's very important for a company to be green and base purchase decisions
on whether or not a brand reflects "green behavior" in its packaging, ingredients, and corporate
actions).
The measures used so far can be neatly classified into two broad categories: socio-demographic
such as age, sex, education, social class and personality measures, such as locus of control. Since
socio demographic can be measured and applied with ease, these have been widely used
variables for profiling purposes. However revealed in the study “there is very little value in the
use of socio-demographic characteristics for profiling environmentally conscious consumers.
“They felt that the limited utility of socio-demographics could be explained by the fact that
“environmental concern is no longer a marginal issue. Indeed “environmental concern is no
Page 69
69
longer a marginal issue, indeed “environmental concern is becoming the socially accepted norm.
Thus, it perhaps should not be expected that light levels of green purchasing behavior would be
reflected in certain socio demographic sectors of consumer base.
On the other hand, personality variables have been found to have somewhat higher linkages to
individual environmental consciousness. While this holds good for general environmental
measures, the results were somewhat inconsistent for specific pro-environmental behavior such
as green purchasing decisions. Furthermore, personality variables have been shown to “explain
only a small part of the total variability of the behavioral measures used”. Moreover, it was also
found that personality variables “do not easily lead to segmentation strategy” due to inherently
complex processes involved in their measurement and interpretation. Given the failures of the
above two classes of variables. Bodo Schlegemilch, Bohlen and Adamantrios Diamantopoulos
used a new segmentation approach through the analysis of the linkages between pro-
environmental purchasing behavior and measures of environmental consciousness” The rationale
for this approach was based to the premise that consumers traditionally expressed their
environmental consciousness through the products they buy” (Schlegelmilch 1996). A Nielsen
study further revealed that four out of five consumers were expressing their opinions about the
environment through their purchasing behavior. It was therefore concluded that it is likely that
consumers who exhibit high levels of environmental consciousness would make more green
purchasing decisions than those exhibiting low levels. Thus it was envisaged that measures of
environmental consciousness would be more closely related to purchasing habits than either
socio-demographics or personality variables. Hence it was proposed to use the new segmentation
approach on analysis of the linkages between pro-environmental purchasing behavior and
measures of environmental consciousness. They also believed that as each specific behavioral
Page 70
70
pattern has its own cluster of predictors, the results from this research would help marketers and
manufacturers to be better equipped to target the ecologically conscious consumers and policy
makers to be better able to encourage consumers who are willing to voluntarily choose an
environment friendly product.
According to Thompson, Anderson, Hansen, Kahle (2010), Firms engage in environmental
marketing in order to appeal to environmentally conscious consumers. Within the context of the
forest product industry, the research used data from two studies to empirically test whether a
relationship exists between demographic/psychographic characteristics and reported
environmentally conscious intentions. In both studies, the results indicated that the
environmental marketing of certified/ecolabeled forest products appeal to a segment of
environmentally conscious consumers. This appeal occurs for both a value-added product
(furniture) and a non-value-added product (plywood). Thus, there is a support for the argument
that environmental marketing to environmentally conscious consumers can result in ‘green
segmentation’. Key findings from the study suggested that those consumers reporting the
strongest preferences for environmentally certified forest products were more willing to pay a
premium for certified products, more likely to display environmentally conscious behavior and
more likely to perceive that green consumer purchases effectively benefit the environment.
These characteristics were most common among females and those familiar with the concept of
environmental certification.
Polonsky, Bailey, Baker et al (1998) discussed the increased usage of questionable
environmental marketing claims, which has become an issue of concern for academics, policy
makers and consumers. Much of the research till date has focused on the accuracy of
environmental claims in advertisements, with the information on product packaging being
Page 71
71
largely ignored. This study used a content analysis to examine the environmental information on
packaging. More specifically it examined the packaging of the population of dishwashing liquid
bottles available in grocery stores in a large city in Australia. Evaluation criteria are developed to
classify the various types of information and the degree to which the information was
"misleading". Seven different informational categories and four accuracy categories were
developed. These criteria were developed based on the existing environmental advertising
literature and environmental marketing regulations in the U.S. and Australia. It was found that a
majority of the packaging information can be classified as being not accurate.
According to D'Souza (2004) "The growing global public concern for safety and preservation of
the environment has given rise to the perception that consumer purchases may be somewhat
influenced by environmental labels”. The author suggested that accuracy in label information is
relevant so as to allow consumers to make an informed choice. The author also proposed that
consumers can be grouped using a matrix of four different environmental positions. The results
of these grouping were more likely to provide an effective profile of a green consumer, enabling
marketers to segment and target these groups based on a clear understanding of consumer
behavior.
Since the mid-1970s a number of studies have investigated that nature of frequency of corporate
social responsibility disclosures, their patterns and trends, and their general relationships to
corporate size and profitability, Scott, Ferreri and Parker (1987) sought to extend their
knowledge of the relationship between a number of corporate characteristics and specific type of
social responsibility disclosures, based on an extensive sample of U.S. corporate annual reports.
Corporate size and industry category were found to correlate with certain types of disclosures,
Page 72
72
while the existence of a corporate social responsibility committee appeared to correlate with one
particular type of disclosure.
Davis (2001) said, the corporations have scrambled to bring to market, products positioned and
advertised as addressing the needs of the environmentally-conscious consumer. The vast
majority of claims presented in support of these products were best described, however, as
confused, misleading or outright illegal. Ethical considerations have not yet been integrated into
environmental marketing, and as a result, long-term harm on both the individual and societal
level may result. A framework for reversing this trend is presented. It identified the sequence of
actions necessary for the development and communication of ethical environmental marketing
claims. The sequence was based upon two aspects of ethical theory: moral style and normative
behavior. Specific implications for marketers'' actions at each stage in the sequence of
framework development were also discussed.
Lyon and Maxwell (2011) have presented (what is to their knowledge) the first economic model
of “greenwash,” in which a firm strategically discloses environmental information and an activist
may audit and penalize the firm for disclosing positive but not negative aspects of its
environmental performance. They modeled this phenomenon using tools from the literature on
financial disclosure. In their model, an activist can audit corporate environmental reports, and
penalize firms caught engaging in green wash, that is presenting good environmental news while
hiding bad news. Their model was relatively simple, yet produced some interesting positive
implications. They showed that when faced with activist pressure, the types of firms most likely
to engage in partial disclosure are those with an intermediate probability of producing positive
environmental and social outcomes. For such firms, disclosing a success can produce a
Page 73
73
significant improvement in public perception, and withholding information about a failure can
prevent a significant negative public perception; thus, they were willing to risk public backlash
by disclosing only partially. Their results rationalized conflicting results in the empirical
literature because they showed that there existed a non monotonic relationship between a firm's
expected environmental performance and its environmental disclosures. The reason was that high
performers are more likely to have purely positive records to disclose, but if they end up with a
mixed record, they are more likely to adopt a strategy of withholding information. In addition,
they found that activist auditing of corporate disclosure behavior is more likely to induce a firm
to become more open and transparent if the firm is likely to have socially or environmentally
damaging impacts, and if the firm is relatively well informed about its environmental or social
impacts. This description fits quite well with the broad types of firms typically singled out for
scrutiny and outrage by activists.
The model also has interesting normative implications. If the activist's goal is to increase firm
disclosures, then it needs to be very careful in targeting suspected green washers. There is a real
possibility that the threat of public backlash for green wash will cause firms to “clam up” rather
than become more open and transparent. In particular, such a response is likely from firms with a
high probability of successful projects, yet who are not fully informed about the environmental
impacts of their actions. For firms such as this, activist pressures designed to increase disclosure
may backfire and produce exactly the opposite of the intended results. On the other hand, firms
with a low probability of environmental success can be pressured into making more
environmental disclosures, and thus make better targets for anti-green wash campaigns.
The likelihood that a firm responds to the threat of activist auditing by opting for nondisclosure
is reduced if the firm has adopted an EMS, and the complementarily between EMSs and activist
Page 74
74
auditing of green wash points to a benefit from public policies that mandate the adoption of
EMSs. Indeed, their analysis pointed to a new rationale for encouraging firms to adopt EMSs. An
EMS brings the market closer to a state of common knowledge, thereby increasing market
efficiency. With an EMS in place, the manager is better informed about his firm's environmental
impact, and the market knows that the manager is better informed. As a result the manager is
unable to hide behind the veil of ignorance when he fails to fully disclose the impacts of his
firm's actions, and is thereby pressured to fully disclose.
In the proposed research, we intend to examine the impact of individual attributes of customers
towards marketing of green products. In the Indian context, green products are still consumed by
a very small subset of customers and the consumption is largely dependent on individual
attributes, i.e. demographic and psychographic characteristics (Harper and Makatouni, 2002;
Ahmed and Juhdi, 2010). Impact of these characteristics is more evident for green food product
segment (Davies et al, 1985; Lea and Worsley, 2005). In the following section, we summarize
the findings by published literature on these issues followed by some interesting research gaps to
explore.
3.6 Demographic Variables
The demographic variables are related to the basic characteristics of a person such as age,
gender, income etc. which affect the consumer buying behavior. With respect to green products,
the various demographic variables which affect customer’s attitude towards them are age,
gender, household income, education, social class, etc. The age of the customers affected
significantly the purchasing of organic food products(Davies et al, 1985). Similar observations
were reported in some other papers (e.g. Lea and Worsley, 2005) where impact of age on
Page 75
75
customer’s belief about the organic products was established. Middle-aged persons have a
strong positive belief about the effects of organic items which they consider as an alternative of
conventional food products(Lea and Worsley, 2005). Household income also positively
influences consumption and purchasing of organic foods and cosmetics as reported in several
papers( Davies et al, 1995; Lea and Worsley 2005; Chinnici et al, 2002). Also it was examined
that the composition of a family infer that households with children and specifically women
members of those families prefer buying more green peoducts than that of the household without
children(Davies et al, 1985). The higher formal educational level also positively influences the
purchasing behavior for organic products (Lockie et al, 2002; Ahmed and Juhdi, 2010). This is
because more education makes the consumers more aware about the environment which will
ultimately influence their purchasing behavior.
We have found from the above discussion that, green product consumption is being studied
based upon some basic demographic variables. Since income of the consumer plays a pivotal
role in green food product consumption, it can be further studied along with the effects of
occupation. This aspect was examined on the consumers buying behavior but not on green food
products(Cline et al , 2006). Also, no study has been made regarding the impact of cultural
aspects (Razzaque, 1995) on green food product consumption. So, the study can be made in
finding out the relationship between consumption of green products and occupation of the
customers.
3.7 Psychographic Variables
From the existing literature, psychographics is being defined as the study of personality, values,
attitudes, interests, and lifestyles (Senise, 2007). This mainly focuses on interests, activities and
Page 76
76
opinions (IAO) of the customers. Hence psychographic variables can be interpreted as
combinations of demographic and psychological variables which impact customer’s attitude in
an overall manner.
It was observed that there is a general perception about organic products catering mainly for
higher social classes (Harper and Makatouni, 2002). It is further stated in the same paper that
people from those classes have an affordability as well as consciousness regarding organic
products, thus resulting in green cosmetic and food product consumption. Few authors have also
discussed about people’s tendency towards safe and healthy organic products intake influencing
positively the customers’ intention to purchase them(Ahmed and Juhdi, 2010). Also, (Davies et
al, 1995; Lea and Worsley 2005) in their paper referred that green consumers prefer buying
organic products for their health concern. So, health is an important factor driving the customers
for green food product consumption. Contradictory results are also published in a paper by
Pickett-Baker and Ozaki (Pickett-Baker and Ozaki, 2008), where authors fail to conclude any
positive correlation between positive environmental beliefs and propensity of the customers to go
for buying more green products.
Environmental knowledge and attitude play a significant role in customers’ tendency for green
product purchasing as reported in several papers. Many authors stated that environmental
consciousness generates more interest of the customers towards organic products (Schlegelmilch
et al, 1996). Kaiser et al (1999) in their paper reported that environmental values and
environmental knowledge are important factors which affect ecological behavior intention
ultimately helping in building customer’s attitude towards organic products. Also Ahmed and
Juhdi (2010) referred that customers are positively inclined towards environment friendly
Page 77
77
farming because of their environmental consciousness and it leads to positive customer intention
to buy organic products. Lockie et al , (2002), said that the consumers’ familiarity with the green
products, generate more interest to consume them. This is common to conventional consumer’s
behavior. They also stated that the mood of the consumers, i.e., to keep him relax is positively
correlated with organic product consumption. The customers believe that consuming organic
products make customers stress-free.
Apart from health consciousness and environmental belief, several other psychographic variables
are also tested in literature like customers belief towards information authenticity, political
motivation, skepticism etc. Kozup et al (2003) said that more proper information from credible
sources increase the consumption of organic products because of customers’ environmental
belief and authenticity of the information provided. Similar observation was reported by
Schlegelmilch et al (1996), by inferring that more knowledge, i.e., detail factual information
about the organic products improve the chance of customers’ buying them. Also, it was said that
the customers’ previous experience of using some environmental brands i.e., the brands which
produce the products in environment- friendly way have an impact on their chances of selecting
those brands only for repeated usage (Pickett-Baker and Ozaki, 2008). In another paper, it is
being stated that recycling activities positively influences pro-environmental purchasing
behavior for those customers who can dedicate more time and effort (Schlegelmilch et al, 1996).
Some papers also stated that politically motivated activities act positively only for those
customers who are environmentally conscious. In the paper by Chang (Chang , 2011), it is being
discussed that perceived higher price, lower quality and skepticism negatively and perceived
emotional benefits acting positively will create more ambivalence attitudes of the customers
towards buying green products.
Page 78
78
From the above discussion we conclude that the relationship between environmental
consciousness, beliefs and knowledge and green product usage had been studied, but not for
green food products. So, we intend to investigate more the role of the above mentioned factors in
creating customers attitude towards green food products. Also the effect of information level
about the cosmetic and food items in forming green cosmetic and food product consumer
behavior is also an interesting research area. No study had taken place to find out the impact of
lifestyle, religiosity, social responsibility, risk taking characteristics (Razzaque, 1995) of the
customers towards organic product consumption, although these variables are applied in other
fields. So, this study can be further extended to find out the effect of the above mentioned
variables on building customers behavior towards organic product consumption.
In addition to demographic and psychographic variables, different product specific variables
affect the customers’ attitude towards green products. The various variables discussed in the
literature are environmental brands, brand name, product type (Green vs. non-green),preferences
for green attributes for the products, green technology, energy savings .Whereas, with respect to
green food products, Heart healthy claim on food products, nutritional information about the
food products, nutritional content of the alternative products, price, product types (fresh fruit,
fresh vegetables, meat, milk and dairy products, cereals and cereal products) were discussed in
the literature.
In the paper by Pickett-Baker and Ozaki (2008), the author stated that environmental brands, i.e.,
the brands which produce the products in environmental-friendly manner will positively
influence customers’ green product purchase decision. In his paper, Mobley et al (1995) reported
that only branded green products create positive impression in the minds of the customers. Lin
Page 79
79
and Chang, (2012) had said that green or non-green products affect the environmental conscious
customers’ usage amount for the products. Olson (2012) stated that using green technology
consumers use more products with energy efficiency. He also stated that energy savings
characteristics of the products positively influences customers attitude towards green products.
Kozup et al (2003) stated in their paper that heart healthy claim, nutritional information on the
food products partially affects consumer’s evaluation of the packaged food products. Also,
nutritional content of the alternative food items negatively influences consumer’s evaluation of
packaged food items. In other papers the authors discussed about the negative effect of price
towards organic food consumption. So, price is a significant barrier for customer’s attitude
formation towards green food products consumption (Lockie et al, 2002).
From the above discussion, we find out that only environmental branded products impact
customers’ attitude. But the work can be extended by studying the role of environmental brands
on green food product consumption and how unbranded green products impact customers’
attitude towards green food products. Also from the exploratory survey we found out that if the
organizations reduce the price of green food products, its popularity can increase. So, an
interesting research area can be finding the role of price in green cosmetic and food product
consumption.
3.8 External variables
In addition to the demographic, psychographics and product specific variables, there are various
external, i.e., environmental variables which leads to specific customer behavior. From the
reviewed literature it was found that customer’s attitude towards green food products is being
Page 80
80
affected by information people have about organic products, food products taste, availability,
expensive, food value , natural content, animal welfare, convenience, environmental protection,
food production method, source of information, purchasing place(hypermarket, supermarket,
organic stores, farms), purchasing difficulties(difficult to find, high prices, poor range of choice),
word of mouth, marketing communications, information about green products, claim type.
Ahmed and Juhdi (2010) had discussed that information people have about organic food
products negatively influences customer’s purchase intention towards the products. But in
another paper, the authors had reported that more information people have about the products,
the more customers will be interested to consume them(Chinnici et al , 2002). Again, Lin and
Chang (2012) stated that only the positive information about the products influences positively
user’s perception of the effectivity of the green products. Also, Pickett-Baker and Ozaki(2008)
also stated that effective marketing communications , i.e., communicating all the desired
information about the product influences positively consumers’ green product purchase decision.
He had also reported that word of mouth communication is the most effective tool to convince
the customers about the positive aspects of green products. Chang (2011) had stated that the
claims organizations make about the products have a positive impact towards ad believability
only if they are from authorized sources. Lea and Worsley (2005) had reported that organic food
products tastes better than conventional products and availability and expense customers have to
bear for these acts as barriers towards creating consumers belief about organic food items.
Harper and Makatouni (2002) have concluded that more environmentally friendly food
production method generates positive customers’ perception about the products. Again more
food value creates more positive belief about the products. More natural content for the organic
food items , concern for animal welfare and environmental protection creates more customers’
Page 81
81
interest towards these products(Lockie et al , 2002). And the customers buying more organic
food items from hypermarket, organic stores and farms where they are more motivated towards
buying them by the overall environment.
From the above discussion, we can see that different papers have reported varied roles of
information in creating customers attitude towards green products. So, this inconsistent
relationship can be tested with respect to green food items. Also, the study can be further
extended to find out the most effective way the organizations can use to convince the customers.
Some papers and from the exploratory study, we can find out that taste sometimes positively and
sometimes negatively influences green food product consumption.
3.9 Variables used in Green Products and Green Food Products (from
Existing Literature)
Following are the variables used in Green Products (except Food) and Green Food Products, as
existing Management literature envisaged.
3.9.1 Independent Product Specific Variable Classification:
Table 3.9.1.1 Identified Independent Variables
Green Products Green Food Products
1. Environmental brands
2. Brand name
3. Product type (Green vs. non-green)
4. Preferences for green attributes for the
products
1. Heart healthy claim on food products
2. Nutritional information about the food
products
3. Nutritional content of the alternative
products
Page 82
82
5. Green technology
6. Non-green attributes
7. Energy savings
4. Price
5. Product types(fresh fruit, fresh
vegetables, meat, milk and dairy
products, cereals and cereal products)
Source: Compiled from Existing Literature
The various independent product specific variables with respect to green products which can be
obtained from existing literature are Environmental brands , Brand name , Product type (Green
vs. non-green) , Preferences for green attributes for the products , Green technology , Non-green
attributes , Energy savings .
The same way the different independent product specific variables with respect to green food
products which can be obtained from existing literature are Heart healthy claim on food
products, Nutritional information about the food products , Nutritional content of the alternative
products, Price, Product types(fresh fruit, fresh vegetables, meat, milk and dairy products, cereals
and cereal products)
3.9.2 Individual Variables
Table 3.9.2.1 Identified Individual Variables
Green Products Green Food Products
1. Environmental beliefs
2. General environmental behavior
3. Experience of using the brands
4. Self-perception of knowledge
5. Environmental consciousness
1. People’s belief about organic products
to be safe
2. People’s belief about organic products
to be healthy
3. People’s belief about organic product
Page 83
83
6. Recycling behavior
7. Politically-motivated behavior
8. Environmental values
9. Ecological behavior intention
10. Ideologically heterogeneous group
11. General attitude towards the environment
12. Environmental concern
13. Situation specific beliefs
14. Perceived higher price
15. Perceived lower quality
16. Perceived green product utility
17. Perceived consumer effectiveness
18. Skepticism towards green marketing
19. Perceived emotional benefits
20. Attitude Ambivalence Toward Buying
Green Products
21. Environmental consciousness
farming to be environment friendly
4. People’s perception about the worth of
buying organic products
5. Health consciousness
6. Taste
7. Sex of the consumers
8. Age of the consumers
9. Household with or without children
10. Household income
11. Self-transcendence personal
values(equality, spirituality, forgiving)
12. Environmental protection
13. Weight control
14. Political values
15. Familiarity
16. Mood
17. Religion
18. Education
19. Social class
20. Ethics
21. Mistrust
22. Number of senior citizens
23. Qualification
Page 84
84
24. Purchasing difficulties(difficult to find,
high prices, poor range of choice)
25. Percentage of food expenditure devoted
to organic products
26. Perception of organic prices
27. Willingness to pay for organic products
28. Credibility of the source of information
Source: Compiled from Existing Literature
The various independent individual variables with respect to green products which can be
obtained from existing literature are Environmental beliefs, General environmental behavior,
Experience of using the brands, Self-perception of knowledge, Environmental consciousness,
Recycling behavior, Politically-motivated behavior, Environmental values, Ecological behavior
intention, Ideologically heterogeneous group, General attitude towards the environment,
Environmental concern, Situation specific beliefs, Perceived higher price, Perceived lower
quality, Perceived green product utility, Perceived consumer effectiveness, Skepticism towards
green marketing, Perceived emotional benefits, Attitude Ambivalence towards buying Green
Products, Environmental Consciousness
The same way different independent individual variables with respect to green food products
which can be obtained from existing literature are People’s belief about organic products to be
safe, People’s belief about organic products to be healthy, People’s belief about organic product
farming to be environment friendly, People’s perception about the worth of buying organic
products, Health Consciousness, Taste, Sex of the consumers, Age of the consumers, Household
Page 85
85
with or without children, Household income, Self-transcendence personal values(equality,
spirituality, forgiving), Environmental protection, Weight control, Political values, Familiarity,
Mood, Religion, Education, Social class, Ethics, Mistrust, Number of senior citizens,
Qualification, Purchasing difficulties(difficult to find, high prices, poor range of choice),
Percentage of food expenditure devoted to organic products, Perception of organic prices,
Willingness to pay for organic products, Credibility of the source of information.
3.9.3 External Variables
Table 3.9.3.1 Identified External Variables
Green Products Green Food Products
1. Word of mouth
2. Marketing communications
3. Information about green products
4. Claim Type
1. Information people have about organic
products
2. Availability
3. Expensive
4. Natural content
5. Animal welfare
6. Education
7. Convenience
8. Environmental protection
9. Food production method
10. Source of information
11. Purchasing place(Hypermarket,
supermarket, organic stores, farms)
Source: Compiled from Existing Literature
Page 86
86
The various independent external variables with respect to green products which can be obtained
from existing literature are Word of mouth, Marketing communications, Information about green
products, Claim Type. The same way the various independent external variables with respect to
green food products which are available from existing literatures are Information people have
about organic products are Availability, Expensive, Natural content, Animal welfare, Education,
Convenience, Environmental protection, Food production method, Source of information,
Purchasing place(Hypermarket, supermarket, organic stores, farms)
3.9.4 Dependent Variables
Table 3.9.4.1 Identified Dependent Variables
Green Products Green Food Products
1. Consumer green product purchase
decision
2. Pro-environmental purchasing behavior
3. Ecological behavior intention
4. Ecological behavior
5. Intention to acquire information
6. Green product acquisition behavior
7. Consumer attitude towards recyclable
products
8. Ambivalent Attitude towards buying
green products
9. Discomfort, Brand attitude, Ad
Believability, Green Claims Believability
1. Intention to purchase organic products
2. Consumers’ Evaluations of Packaged
Food Products and Restaurant Menu
Items
3. Purchasing organic foods
4. Consumers beliefs about organic foods
5. Consumption of organic foods
6. Consumers perception about organic
foods
7. Purchase of free range products
8. Consumption of organic products
Page 87
87
10. Usage amount
11. Perception of green products
effectiveness
12. Choosing green products
Source: Compiled from Existing Literature
The various dependent variables with respect to green products which can be obtained from
existing literature are Consumer green product purchase decision, Pro-environmental purchasing
behavior, Ecological behavior intention, Ecological behavior, Intention to acquire information,
Green product acquisition behavior, Consumer attitude towards recyclable products, Ambivalent
Attitude towards buying green products, Discomfort, Brand attitude, Ad Believability, Green
Claims Believability, Usage amount, Perception of green products effectiveness, Choosing green
products
The same way the dependent variables for green food products from existing literatures are
Intention to purchase organic products, Consumers’ Evaluations of Packaged Food Products and
Restaurant Menu Items, Purchasing organic foods, Consumers beliefs about organic foods,
Consumption of organic foods, Consumers perception about organic foods, Purchase of free
range products, Consumption of organic products.
Page 88
88
3.9.5 List of Independent and Dependant Variable studied based on the Research Gaps
Table 3.9.5.1 Dependent and Independent Variables Identified with respect to Research
Gap
Green Cosmetic products
Independent Variable Dependant Variable
1) Environmental Consciousness
2) Price Sensitivity
3) Innovativeness in buying products
4) Product involvement
5) Health Consciousness
6) Safety
7) Quality
8) Brand
9) Knowledge
10) Information
11) Availability
12) Age
13) Gender
14) Last grade of school(Education)
15) Occupation
16) Income
17) Number of members in the
household
1) Preference towards Green
Cosmetic products
Green Food products
1) Environmental Consciousness
2) Price Sensitivity
3) Innovativeness in buying products
4) Product involvement
5) Health Consciousness
1) Preference towards Green Food
products
Page 89
89
6) Safety
7) Nutritional value
8) Taste
9) Knowledge
10) Information
11) Brand
12) Looks
13) Availability
14) Age
15) Gender
16) Last grade of school(Education)
17) Occupation
18) Income
19) Number of members in the
household
Source: Compiled from Existing Literature
So based upon the research gaps as obtained from the existing literatures and the above tables the
independent variables which are studied in the research project for green cosmetic products are
Environmental Consciousness, Price Sensitivity, Innovativeness in buying products, Product
involvement, Health Consciousness, Safety, Quality, Brand, Knowledge, Information,
Availability, Age, Gender, Last grade of school, Occupation, Income, Number of members in the
household.
The same way the independent variables which are studied in the research project for green food
products are Environmental Consciousness, Price Sensitivity, Innovativeness in buying products,
Product involvement, Health Consciousness, Safety, Nutritional value, Taste, Knowledge,
Information, Brand, Looks, Availability , Age, Gender, Last grade of school, Occupation,
Income, Number of members in the household
Page 90
90
The dependent variable which is studied for both green cosmetic and food products for the
research project is Preference for Green Cosmetic or Food products.
3.10 The Problem Statement
Since the concept of environmental consciousness has become a necessity to save the mankind,
promoting consumption of green products is the need of the hour, owing to the fact that green
products are environment friendly or sustainable products and are organic in nature. Considering
the feeling for the health of environment and consumers, the usage of green products is emerging
at the cost of conventional products. However, the magnitude of usage of green products is much
behind the ideal one to safeguard the consumers and environment at large. Thus stretching the
incidence and depth of usage of green products is a must. In order to achieve the pious objective,
it is necessary to know the factors which insisted the users to go for the green products and
prioritize the factors so identified so that the same can be ventilated to the masses for extending
the consumer base for the green products.
For the purpose, while existing literature reveals the research findings in either a foreign set-up
or in Indian set-up with a few dimensions of the problem, Cities like Kolkata is deprived of such
published findings. Moreover, few dimensions such as; product effectivity (for cosmetic) and
Looks of the Product (for food) which apparently play a vital role have not been under the
purview of any existing literature studied.
3.11 Summary
This chapter has provided an overview of the various researches being conducted in the area of
green products, green marketing and associated areas. Through the literature survey, we have
Page 91
91
been able to understand the historical development which has taken place and the direction in
which future research is being steered. This chapter also develops on these background and
future direction of research to develop our conceptual framework which will guide the rest of our
research. This chapter also identifies the various independent and dependant variables already
studied with respect to the various categories of the green products leading to the concept of
Research Gap and the Problem Statement.
Page 92
92
4. Objectives and Hypotheses
4.1 Research Objectives
Research Objectives have evolved from research problem statements, research gaps and have
been developed for this research, after an in-depth study of the domain and review of literature,
detailed in chapter 3. In finalization of the research objectives, due consideration has been taken
to critically examine factors of consumer behaviour and the concept of “Green”, while ensuring
practicality of these objectives. The research objectives have been developed accordingly are as
follows:
4.1.1 To identify the factors influencing preference for Green cosmetic and food products in and
around Kolkata, West Bengal, India.
4.1.2 To study and analyze the demographic factors influencing preferences for Green cosmetic
and food products in and around Kolkata, West Bengal, India.
4.1.3 To study and analyze the psychographic factors influencing preferences for Green cosmetic
and food products in and around Kolkata, West Bengal, India.
4.1.4 To study and analyze the product-specific factors influencing preferences for Green
cosmetic and food products in and around Kolkata, West Bengal, India
4.2 Research Hypotheses
In order to achieve the above mentioned objectives, a set of 37 hypotheses have been formulated,
which will be tested and conclusions will be drawn on the basis of the test results. The
hypotheses are mentioned below:
Page 93
93
4.2.1 For Green Cosmetic Products
H1: Environmental Consciousness will not influence preference for Green Cosmetic Products.
H2: Price Sensitivity will not influence preference for Green Cosmetic Products.
H3: Innovativeness in Buying Products will not influence preference for Green Cosmetic
products
H4: Product Involvement will not influence preference for Green Cosmetic Products.
H5: Health Consciousness will not influence preference for Green Cosmetic Products.
H6: Safety perspective will not influence preference for Green Cosmetic products.
H7: Quality of the Green Cosmetic product will not influence preference for it.
H8: Product Effectivity will not influence preference for Green Cosmetic Products.
H9: Product Knowledge will not influence preference for Green Cosmetic Products.
H10: Information about the Product will not influence preference for Green Cosmetic Products.
H11: Brand of the Green Cosmetic Product will not influence preference for it.
H12: Availability of the Product will not influence preference for Green Cosmetic Products.
H13: Age-group will not influence preference for Green Cosmetic Products
H14: Income will not influence preference for Green Cosmetic Products.
H15: Gender will not influence preference for Green Cosmetic Products.
H16: Education (Last grade of School Completed) will not influence preference for Green
Cosmetic Products.
H17: Occupation will not influence preference for Green Cosmetic Products.
H18: Number of Members in the Household will not influence preference for Green Cosmetic
Products.
Page 94
94
4.2.2 For Green Food Products
H1: Environmental Consciousness will not influence preference for Green Food Products.
H2: Price Sensitivity will not influence preference for Green Food Products.
H3: Innovativeness in Buying Products will not influence preference for Green Food Products
H4: Product Involvement will not influence preference for Green Food Products.
H5: Health Consciousness will not influence preference for Green Food Products.
H6: Safety Perspective will not influence preference for Green Food Products.
H7: Product Knowledge will not influence preference for Green Food Products.
H8: Information about the Product will not influence preference for Green Food Products.
H9: Brand of the Green Food product will not influence preference for it.
H10: Availability of the Product will not influence preference for Green Food Products.
H11: Taste of the Green Food Products will not influence preference for it.
H12: Nutritional Value of the Green Food Products will not influence preference for it.
H13: Looks of the Green Food Products will not influence preference for it.
H14: Age-Group will not influence preference for Green Food Products.
H15: Income will not influence preference for Green Food Products.
H16: Gender will not influence preference for Green Food Products.
H17: Education (Last Grade of School Completed) will not influence preference for Green Food
Products.
H18: Occupation will not influence preference for Green Food Products
H19: Number of Members in the Household will not influence preference for Green Food
Products.
Page 95
95
4.3 Summary
This chapter gives a brief idea about the research objectives sets based upon the research gaps
and the problem statement identified in the last chapter. Also, the hypotheses formulated for the
research project were detailed out in this chapter.
Page 96
96
5. Research Methodology
5.1 Overview
Research Methodology adopted for this research is described in the following sub sections: the
research design, the sources of data, sampling design which contains sampling techniques used
and data collection instruments developed. Also, the different analytical tools which are being
used for analysis of the collected data to derive at the conclusions are also being explained.
5.2 Research Design
The purpose of this study is to analyze the factors influencing preferences for green cosmetic and
food products. Therefore, descriptive research design was being used as it is deemed to be the
most appropriate. Various authors recommend the use of descriptive design (Orodho, 2004;
Dane, 2000) to produce information that is of interest to marketers. Jackson (1994) contends that
all research is partly descriptive in nature, in so far as the descriptive aspect defines and
describes the research’s who, what, when, where, why, and how, which are some of the
questions raised in the study.
5.3 Sources of Data
Population refers to the entire group of people, events or things of interest that the researcher
wishes to investigate and wants to make inferences based on sample statistics (Sekaran &
Bougie, 2010).
The target population for the study is five sets of people as follows:
(a) Users of Green Cosmetic Products in and around Kolkata.
(b) Users of Green Food Products in and around Kolkata.
Page 97
97
(c) Organizations working on the concept of “Green”, i.e., distributing green cosmetic and food
products
(d) NGOs working on the concept of “Green”, i.e., making the general people aware on the
advantages and characteristics of the Green products.
(e) Non-users of Green Cosmetic and Food Products but aware about the concept of Green
products.
The sample size considered for the Study is 400 who are the users of green cosmetic and food
products. Besides, organizations and NGOs working on the concept of Green and located in and
around Kolkata are also considered in the study. Also, 200 non-users and occasional users of
Green Cosmetic and Food products, but having knowledge about Green products are surveyed.
5.3.1 Population and Sample size (For Users of Green Cosmetic and Food products)
Table 5.3.1.1 Population Size (For Users of Green Cosmetic and Food products)
Districts Population (No. of Green Products Users)
Organized Retail
Outlets(Approx)
Unorganized Retail
Outlets(Approx)
Total(Approx)
Kolkata 2,09,000 1,01,500 3,10,500
Howrah 87,000 1,64,000 2,51,000
North 24 Parganas 47,500 76,500 1,24,000
South 24 Parganas 79,000 97,000 1,76,000
Hooghly 41,000 68,000 1,09,000
Total 4,63,500 5,07,000 9,70,500
Source: Compiled from Databases of Retail Outlets dealing with Green Products
Page 98
98
These are being specified for the purpose of this study as follows:
Precision rate: 5% and Confidence level: 95%, which are considered adequate for the study.
The formula for determining the sample size (Kothari, 2004) is:
n = z2 .p .q . N
e2 . ( N – 1 ) + z2 .p . q
where,
n = sample size
N = population size
z = standard variate at given confidence level. The value of z for confidence level of 95% is 1.96
e = precision or acceptable error. The value of ‘e’ is taken as .05 for this study.
p = sample proportion and q = p -1
The most conservative sample size can be obtained by maximising ‘n’, and the sample will result
in the desired precision. This is achieved if we take the value of p = 0.5. Sample size, considering
p = 0.5 and the other values given above, is thus determined as follows:
Determined Sample Size (95% confidence level): 366 (Rounded as 400).
The table 5.3.6 explains the details about the calculation of the sample size, determined for a
normal distribution at 95% confidence level by using the above mentioned formula. The
approximate population size is mentioned both for organized and un-organized retail outlets
selling green cosmetic and food products for the five districts, such as Kolkata, North 24
Parganas, South 24 Parganas, Howrah and Hooghly. Using these population size, the sample size
is calculated which is 366, and it is rounded off to 400 .This sample size is surveyed both by
physical surveys and online surveys. The sample size collected from physical survey is 275 and
Page 99
99
from online survey is 125. The details about the data collection is mentioned in the sub-section
5.6. The table 5.3.7 shows the distribution of samples among the five districts surveyed in and
around Kolkata. Likewise the table 5.3.8 shows the distribution of the samples as collected from
the non-users of Green Cosmetic and Food products, but they know about the Green products.
The sampling technique which was used for collecting the samples from the population is
Judgemental sampling technique.
5.3.2 Sample Units as collected from the different districts surveyed (Users of Green
Cosmetic and Food products)
Table 5.3.2.1 Sample Units as collected from the different districts surveyed (Users of
Green Cosmetic and Food products)
Districts covered Sample Units Considered
Kolkata 123
Howrah 92
North 24 Parganas 58
South 24 Parganas 79
Hooghly 48
Total 400
5.3.3 Sample Units as collected from the different districts surveyed (Non Users of Green
Cosmetic and Food products, but aware about the concept of “Green”)
Table 5.3.3.1 Sample Units as collected from the different districts surveyed (Non Users of
Green Cosmetic and Food products, but aware about the concept of “Green”)
Districts covered Sample Units Considered
Kolkata 78
Howrah 48
North 24 Parganas 23
Page 100
100
South 24 Parganas 33
Hooghly 18
Total 200
5.4 Research Instrument
The research instrument used to collect primary data was a structured questionnaire prepared by
the researcher and personally administered to respondents for proper responses. Questionnaire
was the main research instrument, along with face to face interviews with the respondents, to
clarify the questions and capture additional insights. Questionnaire was used as it is economical,
structured and appropriate to capture primary data to test the hypotheses formed and to answer
the research questions.
The other mode of data capture used was an online questionnaire generated using Google docs.
and was sent to the respondents through e-mail.
Data on customer footfalls and the most suitable places to collect the data identified in the
preceding section has been selected by interaction with the experienced and knowledgeable
persons from the various organizations and NGOs survey who are working on the concept of
“Green”.
Unstructured interview was conducted for the other two sets of population, i.e., organizations
and NGOs working on the concept of “Green”.
5.4.1 Pilot Survey Questionnaire
The survey instrument used was a structured questionnaire prepared by the researcher. The
questionnaire consisted of nine sub-parts.
Page 101
101
The first part of the questionnaire gives a brief introduction of the project and also defines the
meaning of “Green Product”. The other questions used in this section are the following
Knowledge about green product – in two classes, namely Yes and No
Whether the respondents buy green products – in two classes, namely Yes and No.
Amount spent for buying green products (monthly) – open –ended question
Whether the respondents bought green products in this shopping trip – in two classes,
namely Yes and No.
Types of green products, the respondents normally buy for two categories, i.e., cosmetic
and food with two classes each for the two categories, namely yes and no.
Green product which the respondent have bought in this shopping trio – two classes,
namely Yes and No.
The different green products he bought in this shopping trip – open-ended question
Reasons for buying the above mentioned green products – open-ended question
Spend for buying green products in this shopping trip – open-ended question
Frequently of buying green products – four classes, namely Less than once a month ,
once a month , once a fortnight and more than once a fortnight
The second part of the questionnaire collects the respondents’ views on the various factors of
Environmental Consciousness designed based upon existing literature from Sanchez, 2010. The
various factors are measured on a seven point Likert scale with the following details (1 = Very
Strongly Disagree(VSD), 2 = Strongly Disagree(SD) , 3 = Disagree(D) , 4 = Neither Agree Nor
Disagree(NAD) , 5 = Agree(A) , 6 = Strongly Agree(SA) , 7 = Very Strongly Agree(VSA))
The various factors selected for measuring Environmental Consciousness are –
I support different measures to improve water management leading to water conservation
Page 102
102
I am aware about the issues and problems related to the environment
I would be willing to pay higher prices for water
It is very difficult for a person like me to do anything about the environment
I believe that using recyclable materials for daily use will improve the environment
The third part of the questionnaire collects the respondents’ views on the various factors of Price
Sensitivity designed based upon existing literature from Goldsmith, 1991. The various factors are
measured on a seven point Likert scale with the following details (1 = Very Strongly
Disagree(VSD), 2 = Strongly Disagree(SD) , 3 = Disagree(D) , 4 = Neither Agree Nor
Disagree(NAD) , 5 = Agree(A) , 6 = Strongly Agree(SA) , 7 = Very Strongly Agree(VSA))
The various factors selected for measuring Price Sensitivity are –
In general the price or cost of buying green products is important to me
I know that a new kind of green product is likely to be more expensive than older ones ,
but that does not matter to me
I am less willing to buy a green product if I think that it will be high in price
I don’t mind paying more to try out a new green product
A really good green product is worth paying a lot of money
I don’t mind spending a lot of money to buy a green product
The fourth part of the questionnaire collects the respondents’ views on the various factors on
Innovativeness in buying products designed based upon existing literature from Grewal, 2000.
The various factors are measured on a seven point Likert scale with the following details (1 =
Very Strongly Disagree(VSD), 2 = Strongly Disagree(SD) , 3 = Disagree(D) , 4 = Neither Agree
Nor Disagree(NAD) , 5 = Agree(A) , 6 = Strongly Agree(SA) , 7 = Very Strongly Agree(VSA))
The various factors selected for measuring Innovativeness in buying products are –
Page 103
103
I like to take a chance in buying new products
I like to try new and different products
I am the first in my circle of friends to buy a new product when it appears in the market
I am the first in my circle of friends to experiment with the brands of latest products
The fifth part of the questionnaire collects the respondents’ views on the various factors on
Product involvement designed based upon existing literature from Grewal, 2000. The various
factors are measured on a seven point Likert scale with the following details (1 = Very Strongly
Disagree(VSD), 2 = Strongly Disagree(SD) , 3 = Disagree(D) , 4 = Neither Agree Nor
Disagree(NAD) , 5 = Agree(A) , 6 = Strongly Agree(SA) , 7 = Very Strongly Agree(VSA))
The various factors selected for measuring Product Involvement are –
I select the green products very carefully
Using branded green products helps me express my personality
You can tell a lot about a person from whether he/she buys green products
I believe different brands of green products would give different amounts of satisfaction
The sixth part of the questionnaire collects the respondents’ views on the various factors on
Health Consciousness designed based upon existing literature from Grewal, 2000. The various
factors are measured on a seven point Likert scale with the following details (1 = Very Strongly
Disagree(VSD), 2 = Strongly Disagree(SD) , 3 = Disagree(D) , 4 = Neither Agree Nor
Disagree(NAD) , 5 = Agree(A) , 6 = Strongly Agree(SA) , 7 = Very Strongly Agree(VSA))
The various factors selected for measuring Health Consciousness are –
I worry that there are chemicals in my food
I worry that there are chemicals in my cosmetic products
I’m concerned about my drinking water quality.
Page 104
104
I avoid foods containing preservatives.
I read more health-related articles than I did 3 years ago
I’m interested in information about my health.
I’m concerned about my health all the time.
Pollution in food and cosmetic products does not bother me.
The seventh part of the questionnaire collects the respondents’ views on the various general
characteristics about green cosmetic products designed based upon existing literatures from
Ahmad,2010 ;Chang2011;Davies,1995;Bamberg,2006 and Lea2005. The various factors are
measured on a seven point Likert scale with the following details (1 = Very Strongly
Disagree(VSD), 2 = Strongly Disagree(SD) , 3 = Disagree(D) , 4 = Neither Agree Nor
Disagree(NAD) , 5 = Agree(A) , 6 = Strongly Agree(SA) , 7 = Very Strongly Agree(VSA))
The various factors selected for measuring general characteristics about green cosmetic products
Green cosmetic products are safer to use than non-green cosmetic products
Green cosmetic products are of better quality than non-green cosmetic products
Green cosmetic products are more effective than non-green cosmetic products
Branded green cosmetic products are better than non-branded green cosmetic products
Less knowledge about green cosmetic products prevent people from buying them
Less information about green cosmetic products prevent people from buying them
Less availability about green cosmetic products prevent people from buying them
Green cosmetic products are expensive than non-green cosmetic products
Also, the last question asked in this part is users’ experience of using green cosmetic products?
The responses are being measured on a seven point Likert scale where, 1=Not at all satisfied and
7 = Extremely Satisfied.
Page 105
105
The eighth part of the questionnaire collects the respondents’ views on the various general
characteristics about green food products designed based upon existing literatures from Ahmad,
2010; Kozup, 2003; Davies, 1995; Bamberg, 2006; Lin, 2012; Chang, 2011 and Lea, 2005. The
various factors are measured on a seven point Likert scale with the following details (1 = Very
Strongly Disagree(VSD), 2 = Strongly Disagree(SD) , 3 = Disagree(D) , 4 = Neither Agree Nor
Disagree(NAD) , 5 = Agree(A) , 6 = Strongly Agree(SA) , 7 = Very Strongly Agree(VSA))
The various factors selected for measuring general characteristics about green food products –
Green food products are safer than non- green food products
Green food products are healthier than non-green food products
Green food products have more nutritional value than non-green food products
Green food products are tastier than non-green food products
Less knowledge about green food products prevent people from buying them
Less information about green food products prevent people from buying them
Branded green products are better than non-branded green food products
Green food products do not look good in appearance
Less availability about green food products prevent people from buying them
Green food products are expensive
Also, the last question asked in this part is users’ experience of using green food products.
The responses are being measured on a seven point Likert scale where, 1=Not at all satisfied and
7 = Extremely Satisfied.
The ninth part consists of all the general demographic features of the respondents and their
identity as follows-
Age – grouped into four classes, 18 – 25, 26 – 35, 36 – 50, > 50
Page 106
106
Gender – in two classes namely, male and female.
Educational qualification – in three classes namely, high school, graduation and post
graduation
Occupation – in four classes namely, student, service, self-employed professional and
self-employed business,
Monthly income of the family – in five classes namely, <25,000, 25,000– 49,999, 50,000
– 74,999, 75,000 – 99,999, >=1, 00,000
Number of members in the household – in three classes namely, < 2, 2 – 4, >= 5
Name of the respondent along with his contact no. and location was sought only to personalize
identification of respondents and was not put to any further analysis. The contact no. was used as
an optional field as many respondents want to avoid their contact details. The survey got 68%
(approx) respondents’ contact details.
The questionnaire is given in Appendix I.
5.4.2 Final Survey Questionnaire for Respondents
Based on the experience gathered during pilot survey and on analysis of data obtained from the
pilot study, the questionnaire was improved in order to collect data during the final survey with
maximum factual accuracy.
The changes made in the questionnaire are summarized below:
5.4.2.1 The overall length of the questionnaire was reduced by removing some questions to make
the length optimal. It was observed during the pilot survey that many respondents, who initially
expressed willingness to respond, withdrew the moment they saw the questionnaire, giving
excuses. Many respondents displayed signs of fatigue, disinterest at some point time while
responding to a lengthy questionnaire, Further as respondents were intercepted in the
marketplace while they were involved in shopping and not in the comfort of their homes, they
Page 107
107
wanted to get over with the task hurriedly. Such an adverse perceived situation is not expected to
fetch correct, unbiased responses from sample elements. Hence the total numbers of questions
were reduced to make the questionnaire appear as less bothersome to respondents. Certain
dimensions of constructs were eliminated as they were overlapping with dimensions of other
constructs and care was taken to ensure that validity of the construct was not sacrificed in the
process.
5.4.2.2 Certain wordings were changed as a many respondents did not understand them. The
questionnaire was thus modified to ensure usage of simple words, which are more commonly
used and better understood.
5.4.2.3 The formats of questions to ascertain experience regarding usage of the green cosmetic
and food products were changed from a five point Likert scale to a seven point Likert scale to
match with the format of other items in the questionnaire. This was done as some respondents
were unsure as to how their response needs to be marked in the questionnaire. This ensured that
any suck ambiguity was removed from the final questionnaire.
5.4.2.4 The constructs were reduced in all the different psychographic variables and the general
characteristics of the green cosmetic and food products. For Environmental Consciousness,
Price Sensitivity, Innovativeness in buying products, Product Involvement and Health
consciousness, some constructs were deleted to make the questionnaire more acceptable to the
respondents for answering. Also for the general characteristics about the green cosmetic and
food products, some specific items were deleted as their responses were already collected from
the initial part of psychographic variables to make the questionnaire short in size.
The questionnaire is given in Appendix II.
5.4.3 Final set of questions used for survey interview conducted for the “Organizations working
on the concept of “Green”, i.e., distributing green cosmetic and food products”
Page 108
108
Q1. Briefly describe the profile of your organization?
Q2. What is the marketing channel you normally use for selling the products?
Q3. Do you face any challenges while selling the green products? If yes , briefly state about the
challenges.
Q4. How are you seeing the future growth prospect of the green products market in Kolkata?
Q5. Is there any difference between Kolkata and its suburbs with respect to the popularity of the
green products?
5.4.4 Final survey interview conducted for the NGOs working on the concept of “Green”, i.e.,
awaring and informing the general people on the advantages and characteristics of the
Green products.
Q1. What is the current state of market of green products in Kolkata?
Q2. How the consumers are responding to the concept of green products?
Q3. How are you helping to promote the concept of “green”?
Q4. How the consumers of Kolkata and also its suburbs are responding with respect to the green
products?
Q5. Are you facing any challenges? If yes, briefly state about the challenges.
5.5 Reliability Analysis
The factors that emerged in the questionnaire for collection of responses were tested for internal
reliability using Cronbach’s alpha which indicates the average inter-item correlation within each
of the factors. Those factors resulting in a Cronbach’s alpha of 0.7 or greater are generally
considered to be reliable and therefore useful for further analysis as part of a specific variable.
The Cronbach’s alpha results are shown in the below mentioned table. Since all the scores are
Page 109
109
above the basic requirement of 0.7, the factors and their constructs were reliable to go for further
analysis.
Table 5.5.1 Cornbach’s Alpha Score for the different constructs of the factors used in the
Questionnaire
Factors Constructs Cronbach’s
Alpha
score
Environmental
Consciousness
I support different measures to improve water management
leading to water conservation
0.864
I am aware about the issues and problems related to the
environment
I would be willing to pay higher prices for water
It is very difficult for a person like me to do anything about the
environment
I believe that using recyclable materials for daily use will improve
the environment
Price
Sensitivity
In general the price or cost of buying green products is important
to me
0.776
I know that a new kind of green product is likely to be more
expensive than older ones , but that does not matter to me
I am less willing to buy a green product if I think that it will be
Page 110
110
high in price
I don’t mind paying more to try out a new green product
A really good green product is worth paying a lot of money
I don’t mind spending a lot of money to buy a green product
Innovativeness
in buying
products
I like to take a chance in buying new products 0.795
I like to try new and different products
I am the first in my circle of friends to buy a new product when it
appears in the market
I am the first in my circle of friends to experiment with the brands
of latest products
Product
Involvement
I select the green products very carefully 0.842
Using branded green products helps me express my personality
You can tell a lot about a person from whether he/she buys green
products
I believe different brands of green products would give different
amounts of satisfaction
Health
Consciousness
I worry that there are chemicals in my food. 0.819
I worry that there are chemicals in my cosmetic products
Page 111
111
I’m concerned about my drinking water quality.
I avoid foods containing preservatives.
I read more health-related articles than I did 3 years ago.
I’m interested in information about my health.
I’m concerned about my health all the time.
Pollution in food and cosmetic products does not bother me.
General
characteristics
about Green
Cosmetic
products
Green cosmetic products are safer to use than non-green cosmetic
products
0.768
Green cosmetic products are of better quality than non-green
cosmetic products
Green cosmetic products are more effective than non-green
cosmetic products
Branded green cosmetic products are better than non-branded
green cosmetic products
Less knowledge about green cosmetic products prevent people
from buying them
Less information about green cosmetic products prevent people
from buying them
Less availability about green cosmetic products prevent people
Page 112
112
from buying them
Green cosmetic products are expensive than non-green cosmetic
products
General
characteristics
about Green
Food products
Green food products are safer than non- green food products 0.794
Green food products are healthier than non-green food products
Green food products have more nutritional value than non-green
food products
Green food products are tastier than non-green food products
Less knowledge about green food products prevent people from
buying them
Less information about green food products prevent people from
buying them
Branded green products are better than non-branded green food
products
Green food products do not look good in appearance
Less availability about green food products prevent people from
buying them
Green food products are expensive
Source: SPSS Output
Page 113
113
5.6 Details about Data Collection
The data with the help of the above described questionnaires had been collected using both
online and offline questionnaires.
5.6.1 Offline Procedure
The hard copies of the questionnaires were distributed in the following areas for data collection:-
Spencer's Hyper, Axis Mall , Rajarhat , Kolkata
Spencer's Hyper , Mani Square , EM Bypass , Kolkata
Spencer's Hyper , South City Mall , Anwar Shah Road , Kolkata
Spencer’s Hyper , Rashbehari , Gariahat , Kolkata
Spencer’s Hyper , Quest mall , Park circus , Kolkata
Rainbow , Sarat Bose Road , Kolkata( Shops selling green products only)
Living free , Gariahat Road , Kolkata( Shops selling green products only)
Down to Earth , Alipore , Kolkata( Shops selling green products only)
Areas covered by Aakansha Farms ( Bongaon , Basirhat , Naihati , Shyamnagar , Sodepur
, Hooglly , Tribeni , Bansberia etc.)
Areas covered by Aromatic Herbals Ltd. (Diamond Harbour, Sonarpur, Baruipur ,
Mallikpur , Shyamnagar etc.)
Customers of Sabuj Sathi ( North Kolkata)(NGO working on the concept of green)
Customers of Indrakala ( South Kolkata , Bongaon , Madhyamgram ) )(NGO working on
the concept of green)
Page 114
114
5.6.2 Online Procedure
The final survey questionnaire was formulated online using Google Docs to be distributed to the
existing consumers of the green products. All the existing consumers’ database was being
collected from the Organizations and NGOs working on the concept of “Green” and some social
and professional networking websites. Also some non-users and occasional users of the green
products are surveyed.
5.7 Stores selling Green Cosmetic and Food Products
• Spencers Hyper
• Arome chain of retail stores
• Rainbow
• Living Free
• Down to Earth
• Aakansha Farms
• Aromatic Herbals
• Local Vegetable and Fruit sellers(Un-organized)
5.8 Brands of the various Green Cosmetic and Food products
• 24 Mantra
• Organic India
• Biotique
• Pristine
• Nourish Organic
Page 115
115
• La Flora
• Lass Cosmetics
• Dear Earth
• Naturally Yours
• Organic Tattva
• Vision Fresh
• Abali
• Chamong
• Grenera
• Biobloom
• Fuschia
• Aaroyagam
• Ancient Living
• AXL
• Bio-bloom
5.9 Analysis of Results
The data was first presented in tabular form representing the different responses’ given by the
respondents. Then analysis was done in five stages as follows:
5.9.1 Stage I
The basic characteristics with respect to the nature of using green cosmetic and food products are
being analyzed using descriptive statistics and graphical tools.
Page 116
116
5.9.2 Stage II
The five psychographic variables which were mentioned in the questionnaire consist of internal
constructs. So, all together 27 constructs were grouped into factors using the Exploratory Factor
Analysis (This is conducted to uncover the underlying structure of a relatively large set of
variables and grouping them together)
5.9.3 Stage III
Also, the constructs with respect to the five psychographic variables (Environmental
Consciousness, Price Sensitivity, and Innovativeness in buying products, Product involvement
and Health Consciousness) are being prioritized using Multiple Regression, to uncover the
underlying structure of a relatively large set of variables.
5.9.4 Stage IV
All the five psychographic variables (Environmental Consciousness, Price Sensitivity,
Innovativeness in buying products, Product involvement and Health Consciousness) and the
other characteristics with respect to the green cosmetic and food products are being tested with
respect to the dependent variable, i.e., consumers’ preference for the green cosmetic and food
products. This is to find out how the various characteristics factors influence consumers’
preference for the green cosmetic and food products. The above analysis was done using one-
way ANOVA (Analysis of Variance) since the scales used in the questionnaire are rating scales.
Page 117
117
5.9.5 Stage V
Demographic profile of the respondents was tabulated in a self explanatory manner. Percentage
analyses were performed to find out exact number of people giving response in similar manner.
Demographic categories of age, income level, gender, educational qualification, occupation and
number of members in the household were then analyzed using one way ANOVA (Analysis of
Variance – the technique where the influence of one factor on another factor is checked). The
researcher employed ANOVA for inspecting whether the responses of sample depend on
demographic variables or not for the dependent variable, i.e., consumers’ preference for the
green cosmetic and food products to find out how the various demographic factors influence
consumers’ preference for the green cosmetic and food products.
5.9.6 Stage VII
In order to outline why the non-users don’t prefer the green cosmetic and food products, a
sample size of 200 non-users have also been considered in this study. This section explains the
perceptional impact of different psychographic and independent variables on the preference for
green cosmetic and food products with respect to the non-users of the products. Although the
respondents considered for this section are non-users of green cosmetic products, they are aware
of and have knowledge about green cosmetic and food products. This section reveals the
responses captured on the basis “Had the respondents been the users of green cosmetic products,
what would have been their responses” and in line with the questionnaire administered on the
users of green cosmetic products. By doing so, it helps substantiating the findings from the users.
All the above analysis was done using IBM SPSS (Version 19).
Page 118
118
5.10 Naming of the variables used in the study with respect to the factors used in
the Questionnaire
Table 5.10.1 List of Variables Considered
Variables(used in the study) contributing for the popularity of Green products
Environmental Consciousness
Variable Description
v1 I support different measures to improve water management leading to water
conservation
v2 I am aware about the issues and problems related to the environment
v3 I would be willing to pay higher prices for water
v4 It is very difficult for a person like me to do anything about the environment
v5 I believe that using recyclable materials for daily use will improve the environment
Price Sensitivity
v1 In general the price or cost of buying green products is important to me
v2 I know that a new kind of green product is likely to be more expensive than older
ones , but that does not matter to me
v3 I am less willing to buy a green product if I think that it will be high in price
v4 I don’t mind paying more to try out a new green product
v5 A really good green product is worth paying a lot of money
Page 119
119
v6 I don’t mind spending a lot of money to buy a green product
Innovativeness in buying Products
v1 I like to take a chance in buying new products
v2 I like to try new and different products
v3 I am the first in my circle of friends to buy a new product when it appears in the
market
v4 I am the first in my circle of friends to experiment with the brands of latest products
Product Involvement
v1 I select the green products very carefully
v2 Using branded green products helps me express my personality
v3 You can tell a lot about a person from whether he/she buys green products
v4 I believe different brands of green products would give different amounts of
satisfaction
Health Consciousness
v1 I worry that there are chemicals in my food.
v2 I worry that there are chemicals in my cosmetic products
v3 I’m concerned about my drinking water quality.
v4 I avoid foods containing preservatives.
Page 120
120
v5 I read more health-related articles than I did 3 years ago.
v6 I’m interested in information about my health.
v7 I’m concerned about my health all the time.
v8 Pollution in food and cosmetic products does not bother me.
General characteristics about Green Cosmetic Products
v1 Green cosmetic products are safer to use than non-green cosmetic products
v2 Green cosmetic products are of better quality than non-green cosmetic products
v3 Green cosmetic products are more effective than non-green cosmetic products
v4 Branded green cosmetic products are better than non-branded green cosmetic
products
v5 Less knowledge about green cosmetic products prevent people from buying them
v6 Less information about green cosmetic products prevent people from buying them
v7 Less availability about green cosmetic products prevent people from buying them
v8 Green cosmetic products are expensive than non-green cosmetic products
General characteristics about Green Food Products
v1 Green food products are safer than non- green food products
v2 Green food products are healthier than non-green food products
Page 121
121
v3 Green food products have more nutritional value than non-green food products
v4 Green food products are tastier than non-green food products
v5 Less knowledge about green food products prevent people from buying them
v6 Less information about green food products prevent people from buying them
v7 Branded green products are better than non-branded green food products
v8 Green food products do not look good in appearance
v9 Less availability about green food products prevent people from buying them
v10 Green food products are expensive
Source: Compiled from Literature Reviewed
5.11 Summary
This chapter provided a detailed explanation of the research design and the methods employed to
enable collection and analysis of data capable of answering the research questions. An overview
of the mixed methods approach was provided, along with detailed explanations of each of the
phases within the study. Pilot study was conducted initially before finalizing with the research
design and also questionnaire design. The quantitative phase is also explained, identifying the
survey questionnaire development and analysis process. Integral to the discussion was
consideration of the ethical elements of the study as well as issues of reliability and validity.
Page 122
122
6. Data Analysis and Findings
6.1 Results of the Factor Analysis for Identification of the Factors
6.1.1 Environmental Consciousness
Table 6.1.1.1 Factor Analysis for Environmental Consciousness
Rotated Component Matrix
Component
1 2
v4 .692
v5 .662
v1 .761
v3 .792
v2 .771
Table 6.1.1.2 List of variables and components
Variable Description Components
v1 I support different measures to improve water
management leading to water conservation
Environmental Sense(v1 , v2 and v3)
Environmental Callousness (v4 and v5)
v2 I am aware about the issues and problems
related to the environment
v3 I would be willing to pay higher prices for
water
v4 It is very difficult for a person like me to do
anything about the environment
v5 I believe that using recyclable materials for
daily use will improve the environment
Source: SPSS Output
From the table 6.1.1.1, it is found that the variables v1, v2, v3 had more loadings on component
2, thus making it a Component which can be named as Environmental Sense. Likewise, variables
v4 and v5 have more loadings on component 1 and making it a part of component named as
Environmental Callousness.
Page 123
123
6.1.2 Price Sensitivity
Table 6.1.2.1 Factor Analysis for Price Sensitivity
Rotated Component Matrix
Component
1 2 3
v4 .855
v6 .823
v2 .704
v1 .650
v5 .812
v3 .440 .667
Table 6.1.2.2 List of variables and components
Variable Description Components
v1 In general the price or cost of buying green
products is important to me
Higher Price(v4 and v6)
Price Sensitivity(v1 and v2)
Price Barrier(v3 and v5)
v2 I know that a new kind of green product is
likely to be more expensive than older ones ,
but that does not matter to me
v3 I am less willing to buy a green product if I
think that it will be high in price
v4 I don’t mind paying more to try out a new
green product
v5 A really good green product is worth paying a
lot of money
v6 I don’t mind spending a lot of money to buy a
green product
Source: SPSS output
From the table 6.1.2.1, it can be stated that the variables v4 and v5 can be combined to be a part
of component 1, named as Higher Price. The variables v1 and v2 can be combined to be part of
Page 124
124
component 2 named as Price Sensitivity. Likewise the variables v3 and v5 can be combined to
form component 3 named as Price Barrier.
6.1.3 Innovativeness
Table 6.1.3.1 Factor Analysis for Innovativeness
Rotated Component Matrix
Component
1 2
v1 .868
v2 .803
v3 .399 .386
v4 .935
Table 6.1.3.2 List of variables and components
Variable Description Components
v1 I like to take a chance in buying new products New Product Initiative(v1 , v2
and v3)
Experimental Attitude(v4) v2 I like to try new and different products
v3 I am the first in my circle of friends to buy a new
product when it appears in the market
v4 I am the first in my circle of friends to experiment
with the brands of latest products
Source: SPSS Output
For the case of Innovativeness, it is evident from Table 6.1.3.1 that the variables v1, v2 and v3
can be combined to form a component 1 named as New Product Initiative. The variable 4 alone
will be forming component 2 named as Experimental Attitude.
Page 125
125
6.1.4 Involvement
Table 6.1.4.1 Factor Analysis for Involvement
Rotated Component Matrix
Component
1 2
v1 .868
v4 .803
v2 .399 .435
v3 .935
Table 6.1.4.2 List of variables and components
Variable Description Components
v1 I select the green products very carefully Satisfaction from Branded
Green products (v1 and v4)
Branded green products reveal
personality(v2 and v3)
v2 Using branded green products helps me express
my personality
v3 You can tell a lot about a person from whether
he/she buys green products
v4 I believe different brands of green products
would give different amounts of satisfaction
Source: SPSS Output
From the table 6.1.4.1, it is inferred that the variables v1 and v4 can be combined to form a part
of Component 1 , named as Satisfaction from Branded Green products . Likewise, the variables
v2 and v3 are combined to form component 2, named as Branded green products reveal
personality.
Page 126
126
6.1.5 Health Consciousness
Table 6.1.5.1 Factor Analysis for Health Consciousness
Rotated Component Matrix
Component
1 2 3 4
v2 .793
v5 -.686
v7 .758
v1 .629
v4 .837
v6 .785
v8 -.313 .378 .487
v3 .375 -.436 .447
Table 6.1.5.2 List of variables and components
Variable Description Components
v1 I worry that there are chemicals in my food. Health Sensitivity(v2 and v5)
Health Concern(v1, v6 and
v7)
Avoid preservative food(v4)
Food pollution(v3 and v8)
v2 I worry that there are chemicals in my cosmetic
products
v3 I’m concerned about my drinking water quality.
v4 I avoid foods containing preservatives.
v5 I read more health-related articles than I did 3
years ago.
v6 I’m interested in information about my health.
v7 I’m concerned about my health all the time.
v8 Pollution in food and cosmetic products does not
bother me.
Source: SPSS Output
In case of health consciousness of the respondents, the variables 2 and 5 can be combined to
form component 1, named as Health Sensitivity. The variables v1, v6 and v7 can be combined to
Page 127
127
form component 2 named as Health Concern. Likewise the variable v4 alone will form
component 3 named as Avoid Preservative Food. Lastly, the variables v3 and v8 are combined to
form a part of component 4 named as Food Pollution.
6.1.6 Characteristics of Green Cosmetic Products
Table 6.1.6.1 Factor Analysis for Characteristics of Green Cosmetic Products
Rotated Component Matrix
Component
1 2 3 4
v6 .890
v5 .859
v4 .757
v3 .683
v1 .745 -.337
v2 .612 .437
v7 .434
v8 -.432
Table 6.1.6.2 List of variables and components
Variable Description Components
v1 Green cosmetic products are safer to use than
non-green cosmetic products
Green Product Knowledge(v5
and v6)
Branded Green Cosmetic
Products(v4 and v3)
Reliability of Green Cosmetic
Product (v7 , v1 and v2)
Green Products expensive(v8)
v2 Green cosmetic products are of better quality
than non-green cosmetic products
v3 Green cosmetic products are more effective than
non-green cosmetic products
v4 Branded green cosmetic products are better than
non-branded green cosmetic products
v5 Less knowledge about green cosmetic products
prevent people from buying them
v6 Less information about green cosmetic products
prevent people from buying them
Page 128
128
v7 Less availability about green cosmetic products
prevent people from buying them
v8 Green cosmetic products are expensive than non-
green cosmetic products
Source: SPSS Output
As exhibited in table 6.1.6.1, in case of the Green Cosmetic products, the variables v5 and v6 can
be combined to form component 1 which is named as Green Product Knowledge. The variables
v3 and v4 are combined to form component 2, which is named as Branded Green Cosmetic
Products. The third component 3, component 3 is formed by combining the variables v1, v2 and
v7 and named as Reliability of Green Cosmetic Product. The remaining variable v8 forms the 4th
component, named as Green Products Expensive.
6.1.7 Characteristics of Green Food Products
Table 6.1.7.1 Factor Analysis for Characteristics of Green Food Products
Rotated Component Matrixa
Component
1 2 3 4 5
v3 .712
v4 .696
v2 .696
v5 -.575 .309
v6 .749
v9 .306 .320 .527
v1 -.770
v10 .699
v7 -.764
v8 .727
Page 129
129
Table 6.1.7.2 List of variables and components
Variable Description Components
v1 Green food products are safer than non- green
food products
Green Food Products
Nutritional Taste(v3 and v4)
Green Food Products are
Healthier(v2)
Lack of information and
availability of green Food
Products(v5 , v6 and v9)
Green Food Products are safe
and expensive(v1 and v10)
Branded Green Food Products’
Look and quality(v7 and v8)
v2 Green food products are healthier than non-green
food products
v3 Green food products have more nutritional value
than non-green food products
v4 Green food products are tastier than non-green
food products
v5 Less knowledge about green food products
prevent people from buying them
v6 Less information about green food products
prevent people from buying them
v7 Branded green products are better than non-
branded green food products
v8 Green food products do not look good in
appearance
v9 Less availability about green food products
prevent people from buying them
v10 Green food products are expensive
Source: SPSS Output
Table 6.1.7.1 reveals that in case of the Green Food products, the variables v3 and v4 are
combined to form component 1, named as Green Food Products Nutritional Taste. The variable
v2 forms component 2, which is named as Green Food Products are Healthier. The variables v5,
v6 and v9 are combined to form component 3 which is named as Lack of information and
availability of green Food Products. Likewise the variables v1 and v10 are combined to form
component 4 named as Green Food Products are safe and expensive. Lastly the variables v7 and
Page 130
130
v8 are combined to form component 5, which is named as Branded Green Food Products’ Look
and quality.
The Kaiser-Meyer-Olkin Measure of Sampling Adequacy test result obtained was greater than
0.50 indicating that the sample is reasonably adequate and the data supports application of factor
analysis.
6.2 Prioritization of the Factors using Standardized Regression Coefficients – Green Cosmetic Products
6.2.1 Environmental Consciousness
In this Section of the present Study, the Criterion Variable is the Preference for Green Cosmetic
Products for which five predictor variables related to Environmental Consciousness in buying
Green Cosmetic Products identified and on which the data has been collected are;
V1 : Users of Green Cosmetic Products supports different measures to improve water
management leading to water conservation
V2 : Users of Green Cosmetic Products is aware about the issues and problems related
to the environment
V3 : Users of Green Cosmetic Products would be willing to pay higher prices for water
V4 : It is very difficult for the User of Green Cosmetic Products to do anything about
the environment
V5 : Users of Green Cosmetic Products believes that using recyclable materials for
daily use will improve the environment
As stated earlier, the objective of this Section of the Study is to prioritize the factor/s that
influences the consumer’s preference for green cosmetic products in the context of
Environmental Consciousness in buying Green Cosmetic Products. For the purpose, standardized
regression coefficients (Beta values) have been considered.
Page 131
131
Table 6.2.1.1 Regression Analysis for Environmental Consciousness regarding Green
Cosmetic Products
Coefficientsa
Model
Un-standardized
Coefficients
Standardized
Coefficients
B Std. Error Beta
1
(Constant) 4.284 .652
v1 -.055 .083 -.034
v2 .015 .063 .012
v3 .004 .056 .004
v4 .035 .060 .029
v5 .014 .049 .015
a. Dependent Variable : v6
Source: SPSS Output
We know that the standardized regression coefficients (Beta) is a measure of how strongly each
predictor variable influences the criterion variable and the higher the beta value the greater the
impact of the predictor variable on the criterion variable.
Table 6.2.1.1 reveals that β value for V4 is the highest, i.e., 0.029. It exhibits that the said
predictor variable has highest level of impact on the criterion variable. In fact, the variable, i.e.,
‘user of green cosmetic products to do anything about the environment’ has high level of impact
on preferring green cosmetic products. Similarly, the β value for V3 is the lowest, i.e., 0.004. It
means, the variable – ‘willing to pay higher prices for water’ has the least level of impact on
preferring green cosmetic products.
On the contrary, β value for V1 is the highest with negative sign, i.e., -0.055. It indicates that the
said predictor variable is having highest level of impact on the criterion variable but in a negative
Page 132
132
direction. It means, users’ support for different measures to improve water management leading
to water conservation has high level of impact on not preferring green cosmetic products, which
seems to be bit unusual. In fact, it may be inferred that this variable is not apt for ascertaining
consumers’ preference for green cosmetic products. Thus, out of the five variables identified, on
the basis of degree of influencing positively consumers’ preference for the green cosmetic
products, the priority list is as follows; V4, , V5 , V2 and V3.
6.2.2 Price Sensitivity
In this section of the present study, the Criterion Variable is the Preference for Green Cosmetic
Products for which six predictor variables identified and on which the data has been collected
are;
V1 : The price of buying Green Cosmetic Products is important to users of Green
Cosmetic Products
V2 : Users of Green Cosmetic Products know that a new kind of green cosmetic
product is likely to be more expensive than older ones, but that does not matter to
them
V3 : Users of Green Cosmetic Products are less willing to buy a green product if they
think that it will be high in price
V4 : Users of Green Cosmetic Products don’t mind paying more to try out a new green
cosmetic product
V5 : Users of Green Cosmetic Products think that really good Green Cosmetic product
is worth paying a lot of money
V6 : Users of Green Cosmetic Products don’t mind spending a lot of money to buy a
Green Cosmetic product
The objective of this section of the study is to prioritize the factor/s that influences the
consumers’ preference for green cosmetic products in the context of Price Sensitivity.
Page 133
133
Table 6.2.2.1 Regression Analysis for Price Sensitivity regarding Green Cosmetic Products
Coefficientsa
Model
Un-standardized
Coefficients
Standardized
Coefficients
B Std. Error Beta
1
(Constant) 4.612 .556
v1 -.032 .055 -.029
v2 .029 .055 .027
v3 -.093 .052 -.092
v4 -.100 .051 -.101
v5 .063 .057 .055
v6 .066 .054 .062
a. Dependent Variable: v7
Source: SPSS Output
Table 6.2.2.1 reveals that β value for V6 is the highest, i.e., .062. It exhibits that the said predictor
variable has highest level of impact on the criterion variable. In fact, the said variable, i.e., ‘Users
of Green Cosmetic Products don’t mind spending a lot of money to buy a Green Cosmetic
product’ has high level of impact on preferring green cosmetic products. Similarly, the β value
for V2 is the lowest, i.e., 0.027. It means, the variable – ‘Users of Green Cosmetic Products know
that a new kind of green cosmetic product is likely to be more expensive than older ones, but that
does not matter to them’.
On the contrary, β value for V3 is the highest with negative sign, i.e., -0.092. It indicates
that the said predictor variable is having highest level of impact on the criterion variable but in a
negative direction. It means, Users of Green Cosmetic Products are less willing to buy a green
product if they think that it will be high in price has high level of impact on not preferring green
cosmetic products. In fact, it may be inferred that this variable is not apt for ascertaining
consumers’ preference for green cosmetic products. Thus, out of the six variables identified, on
Page 134
134
the basis of degree of influencing positively consumers’ preference for the green cosmetic
products, the priority list is as follows; V6 ,V5 and V2.
6.2.3 Innovativeness in buying products
In this section, the Criterion Variable is the Preference for Green Cosmetic Products for which
five predictor variables related to Consumer’s Innovativeness in buying Green Cosmetic
Products identified and on which the data has been collected are;
V1 : Users of Green Cosmetic Products like to take a chance in buying new products
V2 : Users of Green Cosmetic Products like to try new and different products
V3 : Users of Green Cosmetic Products is the first in his circle of friends to buy a new
product when it appears in the market
V4 : Users of Green Cosmetic Products is the first in his circle of friends to experiment
with the brands of latest products
As stated earlier, the objective of this Section of the Study is to prioritize the factor/s that
influences the consumer’s preference for green cosmetic products in the context of Consumer’s
Innovativeness in buying Green Cosmetic Products.
Table 6.2.3.1 Regression Analysis for Innovativeness in buying products regarding Green
Cosmetic Products
Coefficientsa
Model
Unstandardized
Coefficients
Standardized
Coefficients
B Std. Error Beta
1
(Constant) 4.553 .397
v1 .033 .049 .036
v2 .026 .056 .025
v3 -.077 .056 -.069
Page 135
135
v4 -.038 .048 -.040
a. Dependent Variable : v5
Source: SPSS Output
Table 6.2.3.1reveals that β value for V1 is the highest, i.e., 0.036. It exhibits that the said
predictor variable has highest level of impact on the criterion variable. In fact, the variable, i.e.,
‘Users of Green Cosmetic Products like to take a chance in buying new products’ has high level
of impact on preferring green cosmetic products. Similarly, the β value for V2 is the lowest, i.e.,
0.025. It means, the variable – ‘Users of Green Cosmetic Products like to try new and different
products’ has the least level of impact on preferring green cosmetic products.
On the contrary, the β value for V3 is the highest with negative sign, i.e., -0.069. It indicates that
the said predictor variable is having highest level of impact on the criterion variable but in a
negative direction. It means, ‘Users of Green Cosmetic Products is the first in his circle of
friends to buy a new product when it appears in the market’ has high level of impact on not
preferring green cosmetic products, which seems to be bit unusual. In fact, it may be inferred that
this variable is not apt for ascertaining consumers’ preference for green cosmetic products. Thus,
out of the two variables identified, on the basis of degree of influencing positively consumers’
preference for the green cosmetic products, the priority list is as follows; V1, and V2 .
6.2.4 Product Involvement
Here also, the Criterion Variable is the Preference for Green Cosmetic Products for which five
predictor variables related to Consumers Involvement in Buying Green Cosmetic Products are
identified and on which the data has been collected are;
V1 : Users of Green Cosmetic Products select the green products very carefully
V2 : Using branded green products help Users of Green Cosmetic Products express
their personality
V3 : One can tell a lot about a person from whether they buy Green Cosmetic Products
V4 : Users of Green Cosmetic Products believe different brands of green products
would give different amounts of satisfaction
Page 136
136
Table 6.2.4.1 Regression Analysis for Product Involvement regarding Green Cosmetic
Products
Coefficientsa
Model
Unstandardized
Coefficients
Standardized
Coefficients
B Std. Error Beta
1
(Constant) 4.196 .403
v1 .052 .051 .051
v2 -.022 .046 -.024
v3 .015 .048 .016
v4 -.018 .052 -.018
a. Dependent Variable : v5
Source: SPSS Output
As stated earlier, the objective of this Section of the Study is to prioritize the factor/s that
influences the consumer’s preference for green cosmetic products in the context of Consumers
Involvement in Buying Green Cosmetic Products.
Table 6.2.4.1reveals that β value for V1 is the highest, i.e., 0.051. It exhibits that the said
predictor variable has highest level of impact on the criterion variable. In fact, the variable, i.e.,
‘Users of Green Cosmetic Products select the green products very carefully’ has high level of
impact on preferring green cosmetic products. Similarly, the β value for V3 is the lowest, i.e.,
0.016. It means, the variable – ‘One can tell a lot about a person from whether they buy Green
Cosmetic Products’ has the least level of impact on preferring green cosmetic products.
On the contrary, the β value for V2 is the highest with negative sign, i.e., -0.024. It
indicates that the said predictor variable is having highest level of impact on the criterion
variable but in a negative direction. It means, ‘Using branded green products help Users of Green
Cosmetic Products express their personality’ has high level of impact on not preferring green
cosmetic products, which seems to be bit unusual. In fact, it may be inferred that this variable is
Page 137
137
not apt for ascertaining consumers’ preference for green cosmetic products. Thus, out of the two
variables identified, on the basis of degree of influencing positively consumers’ preference for
the green cosmetic products, the priority list is as follows; V1 and V3.
6.2.5 Health Consciousness
Here the Criterion Variable is the Preference for Green Cosmetic Products for which eight
predictor variables related to Health Consciousness in buying Green Cosmetic Products are
identified and on which the data has been collected are;
V1 : Users of Green Cosmetic Products worry that there are chemicals in their food
products
V2 : Users of Green Cosmetic Products worry that there are chemicals in their
cosmetic products
V3 : Users of Green Cosmetic Products are concerned about their drinking water
quality
V4 : Users of Green Cosmetic Products avoid food containing preservatives
V5 : Users of Green Cosmetic Products read more health-related articles than I did 3
years ago
V6 : Users of Green Cosmetic Products are interested in information about their health
V7 : Users of Green Cosmetic Products are concerned about their health all the time
V8 : Pollution in Cosmetic products does not bother users of Green Cosmetic Products
Table 6.2.5.1 Regression Analysis for Health Consciousness regarding Green Cosmetic
Products
Coefficientsa
Model
Unstandardized
Coefficients
Standardized
Coefficients
B Std. Error Beta
Page 138
138
1
(Constant) 4.431 .540
v1 -.104 .055 -.098
v2 -.054 .055 -.051
v3 .138 .048 .147
v4 .023 .048 .024
v5 -.013 .047 -.014
v6 .020 .046 .021
v7 .020 .046 .022
v8 -.058 .051 -.057
a. Dependent Variable: v9
Source: SPSS Output
As stated earlier, the objective of this Section is to prioritize the factor/s that influences the
consumer’s preference for green cosmetic products in the context of Health Consciousness in
buying Green Cosmetic Products.
We know that the standardised regression coefficients (Beta) is a measure of how
strongly each predictor variable influences the criterion variable and the higher the beta value the
greater the impact of the predictor variable on the criterion variable.
Table 6.2.5.1 reveals that β value for V3 is the highest, i.e., 0.147. It exhibits that the said
predictor variable has highest level of impact on the criterion variable. In fact, the variable, i.e.,
‘Users of Green Cosmetic Products are concerned about their drinking water quality’ has high
level of impact on preferring green cosmetic products. Similarly, the β value for V6 is the lowest,
i.e., 0.021. It means, the variable – ‘Users of Green Cosmetic Products are interested in
information about their health’.
On the contrary, β value for V1 is the highest with negative sign, i.e., -0.098. It indicates
that the said predictor variable is having highest level of impact on the criterion variable but in a
negative direction. It means, ‘Users of Green Cosmetic Products worry that there are chemicals
Page 139
139
in their food products’ has high level of impact on not preferring green cosmetic products. In
fact, it may be inferred that this variable is not apt for ascertaining consumers’ preference for
green cosmetic products. Thus, out of the four variables identified, on the basis of degree of
influencing positively consumers’ preference for the green cosmetic products, the priority list is
as follows; V3, V4, V7 and V6.
6.3 Prioritization of the Factors using Standardized Regression Coefficients
– Green Food Products
6.3.1 Environmental Consciousness
In this section of the present Study, the Criterion Variable is the Preference for Green Food
Products for which five predictor variables related to Environmental Consciousness identified
and on which the data has been collected are;
V1 : Users of Green Food Products supports different measures to improve water
management leading to water conservation
V2 : Users of Green Food Products is aware about the issues and problems related to
the environment
V3 : Users of Green Food Products would be willing to pay higher prices for water
V4 : It is very difficult for the Users of Green Food Products to do anything about the
environment
V5 : User of Green Food Products believes that using recyclable materials for daily use
will improve the environment
As stated earlier, the objective of this Section of the Study is to prioritize the factor/s that
influences the consumer’s preference for green Food products in the context of environmental
consciousness. For the purpose, 400 consumers are studied and their responses have been
analyzed on the basis of Beta values, the relevant output obtained through SPSS is presented in
table 6.3.1.1.
Page 140
140
Table 6.3.1.1. Environmental Consciousness for Green Food Products
Coefficients
Model
Unstandardized
Coefficients
Standardized
Coefficients
B Std. Error Beta
1
(Constant) 3.914 .652
v1 -.046 .083 -.028
v2 .048 .063 .039
v3 .050 .056 .046
v4 .048 .060 .040
v5 -.007 .049 -.008
a. Dependent Variable: v6
Source: SPSS Output
We know that the standardized regression coefficients (Beta) is a measure of how strongly each
predictor variable influences the criterion variable and the higher the beta value the greater the
impact of the predictor variable on the criterion variable.
Table 6.3.1.1. reveals that β value for V3 is the highest, i.e., 0.046. It exhibits that the
said predictor variable has highest level of impact on the criterion variable. In fact, the variable,
i.e., ‘Users of Green Food Products would be willing to pay higher prices for water’ has high
level of impact on preferring Green Food products. Similarly, the β value for V2 is the lowest,
i.e., 0.039. It means, the variable – ‘Users of Green Food Products is aware about the issues and
problems related to the environment.’
On the contrary, β value for V1 is the highest with negative sign, i.e., -0.028. It indicates
that the said predictor variable is having highest level of impact on the criterion variable but in a
negative direction. It means, Users of Green Food Products supports different measures to
improve water management leading to water conservation has high level of impact on not
Page 141
141
preferring green Food products, which seems to be bit unusual. In fact, it may be inferred that
this variable is not apt for ascertaining consumers’ preference for green Food products. Thus, out
of the three variables identified, on the basis of degree of influencing positively consumers’
preference for the green Food products, the priority list is as follows; V3 , V4 and v2.
6.3.2 Price Sensitivity
In this section of the present study, the Criterion Variable is the Preference for Green Food
Products for which six predictor variables identified and on which the data has been collected
are;
V1 : The price of buying Green Food Products is important to users of Green Food
Products
V2 : Users of Green Food Products know that a new kind of Green Food product is
likely to be more expensive than older ones, but that does not matter to them
V3 : Users of Green Food Products are less willing to buy a green product if they think
that it will be high in price
V4 : Users of Green Food Products don’t mind paying more to try out a new green
Food product
V5 : Users of Green Food Products think that really good Green Food product is worth
paying a lot of money
V6 : Users of Green Food Products don’t mind spending a lot of money to buy a Green
Food product
The objective of this Section of the Study is to prioritize the factor/s that influences the
consumers’ preference for green Food products in the context of Price Sensitivity.
Page 142
142
Table 6.3.2.1. Price Sensitivity for Green Food Products
Coefficients
Model
Unstandardized
Coefficients
Standardized
Coefficients
B Std. Error Beta
1
(Constant) 4.585 .558
v1 .007 .055 .006
v2 .010 .055 .009
v3 -.122 .052 -.121
v4 -.035 .051 -.035
v5 -.030 .057 -.026
v6 .112 .055 .104
a. Dependent Variable: v7
Source: SPSS Output
Table 6.3.2.1. The Model reveals that β value for V6 is the highest, i.e., 0.104. It exhibits that
the said predictor variable has highest level of impact on the criterion variable. In fact, the said
variable, i.e., ‘Users of Green Food Products don’t mind spending a lot of money to buy a Green
Food product’ has high level of impact on preferring green Food products. Similarly, the β value
for V1 is the lowest, i.e., 0.006. It means , the variable – ‘The price of buying Green Food
Products is important to users of Green Food Products’ has less impact on preferring green Food
products.
On the contrary, β value for V3 is the highest with negative sign, i.e., -0.121. It indicates
that the said predictor variable is having highest level of impact on the criterion variable but in a
negative direction. It means Users of Green Food Products are less willing to buy a green
product if they think that it will be high in price’ has high level of impact on not preferring green
Food products. In fact, it may be inferred that this variable is not apt for ascertaining consumers’
preference for green Food products. Thus, out of the variables identified, on the basis of degree
Page 143
143
of influencing positively consumers’ preference for the green Food products, the priority list is as
follows; V6 ,V2 and V1.
6.3.3 Innovativeness in buying products
In this section, the Criterion Variable is the Preference for Green Food Products for which five
predictor variables related to Innovativeness in buying products identified and on which the data
has been collected are;
V1 : Users of Green Food Products like to take a chance in buying new products
V2 : Users of Green Food Products like to try new and different products
V3 : Users of Green Food Products is the first in his circle of friends to buy a new
product when it appears in the market
V4 : Users of Green Food Products is the first in his circle of friends to experiment
with the brands of latest products
As stated earlier, the objective of this section of the Study is to prioritize the factor/s that
influences the consumer’s preference for green Food products in the context of Innovativeness in
buying products. For the purpose, 400 consumers are studied and their responses have been
analyzed through Standardized Regression Coefficients, the relevant output obtained through
SPSS is presented in table 6.3.3.1.
Table 6.3.3.1. Innovativeness in buying Green Food Products
Coefficients
Model
Unstandardized
Coefficients
Standardized
Coefficients
B Std. Error Beta
1
(Constant) 5.180 .394
v1 .047 .049 .051
v2 -.010 .056 -.009
v3 -.130 .056 -.117
v4 -.104 .048 -.110
Page 144
144
Coefficients
Model
Unstandardized
Coefficients
Standardized
Coefficients
B Std. Error Beta
1
(Constant) 5.180 .394
v1 .047 .049 .051
v2 -.010 .056 -.009
v3 -.130 .056 -.117
v4 -.104 .048 -.110
a. Dependent Variable: v5
Source: SPSS Output
Table 6.3.3.1. reveals that β value for V1 is the highest, i.e., 0.051. It exhibits that the said
predictor variable has highest level of impact on the criterion variable. In fact, the variable, i.e.,
‘Users of Green Food Products like to take a chance in buying new products’ has high level of
impact on preferring Green Food products.
On the contrary, the β value for V3 is the highest with negative sign, i.e., -0.117. It
indicates that the said predictor variable is having highest level of impact on the criterion
variable but in a negative direction. It means, ‘Users of Green Food Products is the first in his
circle of friends to buy a new product when it appears in the market’ has high level of impact on
not preferring green Food products, which seems to be bit unusual. In fact, it may be inferred that
this variable is not apt for ascertaining consumers’ preference for Green Food products. Thus, the
variable ‘Users of Green Food Products like to take a chance in buying new products’ influence
consumers’ preference for the green Food products positively.
Page 145
145
6.3.4 Product Involvement
In this Section, the Criterion Variable is the Preference for Green Food Products for which five
predictor variables related to Consumers Involvement in Buying Green Food Products are
identified and on which the data has been collected are;
V1 : Users of Green Food Products select the green products very carefully
V2 : Using branded green products help Users of Green Food Products express their
personality
V3 : One can tell a lot about a person from whether they buy Green Food Products
V4 : Users of Green Food Products believe different brands of green products would
give different amounts of satisfaction
As stated earlier, the objective of this section of the study is to prioritize the factor/s that
influences the consumer’s preference for Green Food products in the context of Consumers
Involvement in Buying Green Food Products. For the purpose, 400 consumers are studied and
their responses have been analyzed through Standardized Regression Coefficients, the relevant
output obtained through SPSS is presented in table 6.3.4.1.
Table 6.3.4.1. Product Involvement on Green Food Products
Coefficients
Model
Unstandardized
Coefficients
Standardized
Coefficients
B Std. Error Beta
1
(Constant) 4.209 .403
v1 .093 .051 .091
v2 -.035 .046 -.039
v3 .011 .048 .011
v4 -.046 .052 -.045
a. Dependent Variable : v5
Source: SPSS Output
Page 146
146
Table 6.3.4.1. reveals that β value for V1 is the highest, i.e., 0.091. It exhibits that the said
predictor variable has highest level of impact on the criterion variable. In fact, the variable, i.e.,
‘Users of Green Food Products select the green products very carefully’ has high level of impact
on preferring green Food products. Similarly, the β value for V3 is the lowest, i.e., 0.011. It
means, the variable – ‘One can tell a lot about a person from whether they buy Green Food
Products’ has the least level of impact on preferring Green Food products.
On the contrary, the β value for V4 is the highest with negative sign, i.e., -0.045. It
indicates that the said predictor variable is having highest level of impact on the criterion
variable but in a negative direction. It means, ‘Using branded green products help Users of Green
Food Products express their personality’ has high level of impact on not preferring green Food
products. In fact, it may be inferred that this variable is not apt for ascertaining consumers’
preference for green Food products. Thus, out of the two variables identified, on the basis of
degree of influencing positively consumers’ preference for the green Food products, the priority
list is as follows; V1 and V3.
6.3.5 Health Consciousness
Here also, the Criterion Variable is the Preference for Green Food Products for which five
predictor variables related to Health Consciousness in buying Green Food Products are
identified and on which the data has been collected are;
V1 : Users of Green Food Products worry that there are chemicals in their food
products
V2 : Users of Green Food Products worry that there are chemicals in their Food
products
V3 : Users of Green Food Products are concerned about their drinking water quality
V4 : Users of Green Food Products avoid food containing preservatives
V5 : Users of Green Food Products read more health-related articles than I did 3 years
ago
Page 147
147
V6 : Users of Green Food Products are interested in information about their health
V7 : Users of Green Food Products are concerned about their health all the time
V8 : Pollution in Food products does not bother users of Green Food Products
As stated earlier, the objective of this section of the study is to prioritize the factor/s that
influence the consumer’s preference for Green Food products in the context of Health
Consciousness in buying Green Food Products. For the purpose, 400 consumers are studied and
their responses have been analyzed through Standardized Regression Coefficients, the relevant
output obtained through SPSS is presented in table 6.3.5.1.
Table 6.3.5.1. Health Consciousness for Green Food Products
Coefficients
Model
Unstandardized
Coefficients
Standardized
Coefficients
B Std. Error Beta
1
(Constant) 4.328 .546
v1 -.020 .056 -.019
v2 .048 .055 .044
v3 .098 .048 .105
v4 -.052 .049 -.055
v5 -.020 .047 -.021
v6 -.042 .047 -.045
v7 -.043 .046 -.047
v8 .044 .052 .042
a. Dependent Variable: v9
Source: SPSS Output
Page 148
148
We know that the standardized regression coefficients (Beta) is a measure of how strongly each
predictor variable influences the criterion variable and the higher the beta value the greater the
impact of the predictor variable on the criterion variable.
Table 6.3.5.1. reveals that β value for V3 is the highest, i.e., 0.105. It exhibits that the said
predictor variable has highest level of impact on the criterion variable. In fact, the variable, i.e.,
‘Users of Green Food Products are concerned about their drinking water quality’ has high level
of impact on preferring Green Food products. Similarly, the β value for V8 is the least, i.e.,
0.042. It means, the variable – ‘Pollution in Food products does not bother users of Green Food
Products’ has less impact on preferring Green Food products.
On the contrary, the β value for V4 is the highest with negative sign, i.e., -0.055. It
indicates that the said predictor variable is having highest level of impact on the criterion
variable but in a negative direction. It means, ‘Users of Green Food Products avoid food
containing preservatives’ has high level of impact on not preferring Green Food products. In fact,
it may be inferred that this variable is not apt for ascertaining consumers’ preference for Green
Food products. Thus, out of the three variables identified, on the basis of degree of influencing
positively consumers’ preference for the Green Food products, the priority list is as follows; V3,
V2 and V8.
6.4 Respondents Demographic Profile
This section presents an analysis of the demographic characteristics, as exhibited in the below
mentioned table, of the samples as well as their relationship with consumer’s behavior about
green cosmetic products. In order to visualize a better understanding of the basic profile of the
sample surveyed and to obtain a description of distribution of responses, percentage to each
variable were taken into consideration.
Page 149
149
Table 6.4.1 (Demographic Profile of Consumers)
Characteristics Profile Frequency Percent
Age group 18 – 25 30 7.5
26 – 35 126 31.5
36– 50 136 34
>50 103 25.8
Gender Male 215 53.8
Female 185 46.3
Last grade of
school
completed
High School 96 24
Graduation 167 41.8
Post-Graduation 137 34.3
Occupation Student 51 12.8
Business 123 30.8
Service 125 31.3
Housewife 101 25.3
Income <25,000 39 9.8
25,000– 49,999 75 18.8
Page 150
150
50,000 –
74,999
113 28.3
75,000 – 99,999 135 33.8
>=1,00,000 38 9.3
Number of
members in the
household
< 2 106 26.5
2 – 4 163 40.8
>= 5 130 32.5
Source: Primary Data
The majority (65.5%) of the sample was falling in the age group of 26 - 50 years. Only 7.5% of
the samples are young and 25.8 % of the sample was above 50 years of age. So, most of the
respondents surveyed as a part of the samples are adult. Regarding the gender of the respondents,
53.8% of the respondents were male, whereas 46.3 % of the respondents are female. For the
study only educated people were considered. The findings revealed that 24% had completed
high-school, 41.8% had completed graduation and 34.3% had completed post-graduation. About
the occupation, 12.8 were students, about 62% were professionals, out of which 30.8% were into
business and 31.3 % were into service. Only, 25.3% respondents were housewife. Majority of the
respondents had monthly income between 50,000 and 99,999.Only 9.8 % respondents were
earning below 25,000 and 18.8% respondents earning between 25,000 to 49,999. Whereas, 9.3%
of the respondents earn above 1, 00,000. Majority of the respondents (40.8%) were having a
household between 2 to 4 members. 32.5% of the respondents were having a household of
greater than or equal to 5 members.
Page 151
151
6.5 Impact of Demographic Profile on Preference for Green Cosmetic
Products (ANOVA)
6.5.1 Age-Group
One-Way ANOVA is applied in order to know whether the age-group, denoted as v1, has
significant impact on the use of green cosmetic products. For the purpose, the respondents
studied have been segregated into four categories; a) 18yrs – 25 yrs. B) 26 yrs – 35 yrs, c) 36 yrs
– 50 yrs and d) > 50 yrs and these age-groups are denoted respectively as 0, 1, 2 and 3 for
analysis purpose in SPSS. Preference for green cosmetic products is the dependent variable and
in analysis, it is denoted as v2. The relevant portion of SPSS output sheet is presented below to
infer whether there is any significant effect of age-group on the preference of green cosmetic
products.
Table 6.5.1.1 ANOVA Output for Age-Group
Sum of Squares Df Mean Square F Sig.
Between Groups 2.942 3 .981 .375 .771
Within Groups 1036.098 396 2.616
Total 1039.040 399
Source: SPSS Output
6.5.1.1 Hypothesis on Age-Group:
H: Age-group does not influence consumers’ preference towards green cosmetic products. In
other words, there is no significant difference among different age-groups concerning their
impact on preference, i.e., 18-25 = 26-35 = 36-50 = >50.
The exact significant level (p value) of ANOVA is exhibited in 6th Col. (Sig.) of table 6.5.1.1.
The level of significance set by us is 5%, i.e., α = 0.05 (on the basis of existing researches of
Page 152
152
similar type). The table reveals that ‘p’ value is more than the ‘α’ value. In fact, since p = 0.771
is greater than α = 0.05, the null hypothesis is accepted and established. That means, the age-
group does not significantly impact the consumers’ preference towards green cosmetic products.
6.5.2 Gender
Like age-group, for gender also, One-Way ANOVA is done in order to know whether the
gender, denoted as v1, has significant impact on the use of green cosmetic products. For the
purpose, the respondents studied have been segregated into two categories; a) Female B) Male
and these categories are denoted respectively as 0 and 1 for analysis purpose in SPSS. Preference
for green cosmetic products is the dependent variable and in analysis, it is denoted as v2. The
relevant portion of SPSS output sheet is presented below to infer whether there is any significant
effect of gender on the preference of green cosmetic products.
Table 6.5.2.1 ANOVA Output for Gender
Sum of
Squares Df Mean Square F Sig.
Between Groups .387 1 .387 .148 .701
Within Groups 1038.653 398 2.610
Total 1039.040 399
Source: SPSS Output
6.5.2.1 Hypothesis on Gender
H: Gender does not influence consumers’ preference towards green cosmetic products. In
other words, there is no significant difference between two genders concerning their impact on
preference, i.e., Male = Female.
Page 153
153
The exact significant level (p value) of ANOVA is exhibited in 6th Col. (Sig.) of table 6.5.2.1.
The table reveals that ‘p’ value is more than the ‘α’ value. In fact, since p = 0.701 is greater than
α = 0.05, the null hypothesis is accepted and established. That means, gender does not
significantly impact the consumers’ preference towards green cosmetic products.
6.5.3 Level of Education
Like the other demographic variables, for level of education also, One-Way ANOVA is done in
order to know whether the level of education, denoted as v1, has significant impact on the use
of green cosmetic products. For the purpose, the respondents studied have been segregated into
three categories; a) High School b) Graduation and c) Post – Graduation. These categories are
denoted respectively as 0, 1 and 2for analysis purpose in SPSS. Preference for green cosmetic
products is the dependent variable and in analysis, it is denoted as v2. The relevant portion of
SPSS output sheet is presented below to infer whether there is any significant effect of level of
education on the preference of green cosmetic products.
Table 6.5.3.1 ANOVA output for Level of Education
Sum of
Squares Df Mean Square F Sig.
Between Groups 8.905 2 4.452 1.716 .181
Within Groups 1030.135 397 2.595
Total 1039.040 399
Source: SPSS Output
Page 154
154
6.5.3.1 Hypothesis on Level of Education:
H: Level of Education does not influence consumers’ preference towards green cosmetic
products. In other words, there is no significant difference between three levels of education
concerning their impact on preference, i.e., High School = Graduation = Post - Graduation.
The exact significant level (p value) of ANOVA is exhibited in 6th
Col. (Sig.) of table 6.5.3.1.
The table reveals that ‘p’ value is more than the ‘α’ value. In fact, since p = 0.181 is greater than
α = 0.05, the null hypothesis is accepted and established. That means, level of education does not
significantly impact the consumers’ preference towards green cosmetic products.
6.5.4 Occupation
Like the other demographic variables, for different types of occupation also, One-Way ANOVA
is done in order to know whether the different types of occupation , denoted as v1, has
significant impact on the use of green cosmetic products. For the purpose, the respondents
studied have been segregated into four categories; a) Student b) Business c) Service and d)
Housewife. These categories are denoted respectively as 0, 1, 2 and 3 for analysis purpose in
SPSS. Preference for green cosmetic products is the dependent variable and in analysis, it is
denoted as v2. The relevant portion of SPSS output sheet is presented below to infer whether
there is any significant effect of level of education on the preference of green cosmetic products.
Table 6.5.4.1 ANOVA Output for Occupation
Sum of Squares df Mean Square F Sig.
Between Groups 2.972 3 .991 .379 .768
Within Groups 1030.216 394 2.615
Total 1033.188 397
Source: SPSS Output
Page 155
155
6.5.4.1 Hypothesis on Occupation:
H: Occupation does not influence consumers’ preference towards green cosmetic products.
In other words, there is no significant difference between four levels of occupation concerning
their impact on preference, i.e., Student = Business = Service = Housewife.
The exact significant level (p value) of ANOVA is exhibited in 6th Col. (Sig.) of table 6.5.4.1.
The table reveals that ‘p’ value is more than the ‘α’ value. In fact, since p = 0.768 is greater than
α = 0.05, the null hypothesis is accepted and established. That means Occupation does not
significantly impact the consumers’ preference towards green cosmetic products.
6.5.5 Income
Like other characteristics of demographic profile as analyzed above, income of the consumers
has also been considered for One-Way ANOVA in order to know whether the income level of
the consumers, denoted as v1, has significant impact on the use of green cosmetic products. For
the purpose, the respondents studied have been segregated into five categories on the basis of
monthly income in Rupees; a) <25,000 b) 25001-49999 c) 50000-74999 d) 75000-99999 and e)
≥100000 and these categories are denoted respectively as 0, 1, 2, 3 and 4 for analysis purpose in
SPSS. Preference for green cosmetic products is the dependent variable and in analysis, it is
denoted as v2. The relevant portion of SPSS output sheet is presented below to infer whether
there is any significant effect of income level of the consumers on the preference of green
cosmetic products.
Page 156
156
Table 6.5.5.1 ANOVA Output on Income Level of the Consumers
Sum of Squares df Mean Square F Sig.
Between Groups 13.133 4 3.283 1.264 .041
Within Groups 1025.907 395 2.597
Total 1039.040 399
Source: SPSS Output
6.5.5.1 Hypothesis on Income Level
H: Income level does not influence consumers’ preference towards green cosmetic products.
In other words, there is no significant difference between five income levels concerning their
impact on preference, i.e., <25,000 = 25001-49999 = 50000-74999 = 75000-99999 = ≥100000.
The exact significant level (p value) of ANOVA is exhibited in 6th Col. (Sig.) of table 6.5.5.1.
The table reveals that ‘p’ value is less than the ‘α’ value. In fact, since p = 0.041 is less than α =
0.05, the null hypothesis is not accepted and the alternative hypothesis is accepted and
established. That means, income level significantly impacts the consumers’ preference towards
green cosmetic products.
6.5.6 Number of Members in Household
The last demographic variable which is studied in this paper is the number of members in the
household of the consumer, for different number of members in the household also, One-Way
ANOVA is done in order to know whether different number of members in the household,
denoted as v1, has significant impact on the use of green cosmetic products. For the purpose, the
respondents studied have been segregated into three categories; a) <2 b) 2 - 4 and c) ≥ 5. These
Page 157
157
categories are denoted respectively as 0, 1 and 2 for analysis purpose in SPSS. Preference for
green cosmetic products is the dependent variable and in analysis, it is denoted as v2. The
relevant portion of SPSS output sheet is presented below to infer whether there is any significant
effect of level of education on the preference of green cosmetic products.
Table 6.5.6.1 ANOVA Output on Income Level of the Consumers
Sum of
Squares Df Mean Square F Sig.
Between Groups 5.040 2 2.520 .968 .381
Within Groups 1034.000 397 2.605
Total 1039.040 399
Source: SPSS Output
6.5.6.1 Hypothesis on Occupation:
H: Number of members in the household does not influence consumers’ preference towards
green cosmetic products. In other words, there is no significant difference between four levels of
occupation concerning their impact on preference, i.e., <2 = 2-4 = ≥ 5.
The exact significant level (p value) of ANOVA is exhibited in 6th Col. (Sig.) of table 6.5.6.1.
The table reveals that ‘p’ value is more than the ‘α’ value. In fact, since p = 0.381 is greater than
α = 0.05, the null hypothesis is accepted and established. That means, Occupation does not
significantly impact the consumers’ preference towards green cosmetic products.
Page 158
158
6.6 Impact of Demographic Profile on Preference for Green Food Products
(ANOVA)
6.6.1 Age Group
One-Way ANOVA is done in order to know whether the age-group, denoted as v1, has
significant impact on the use of green food products. For the purpose, the respondents studied
have been segregated into four categories; a) 18yrs – 25 yrs. b) 26 yrs – 35 yrs, c) 36 yrs – 50
yrs and d) > 50 yrs and these age-groups are denoted respectively as 0, 1, 2 and 3 for analysis
purpose in SPSS. Preference for green food products is the dependent variable and in analysis,
it is denoted as v2. The relevant portion of SPSS output sheet is presented below to infer
whether there is any significant effect of age-group on the preference of green food products.
Table 6.6.1.1 ANOVA Output for Age-Group
Sum of
Squares Df Mean Square F Sig.
Between
Groups
4.247 3 1.416 .538 .656
Within Groups 1041.190 396 2.629
Total 1045.437 399
Source: SPSS Output
6.6.1.1 Hypothesis on Age-Group:
H: Age-group does not influence consumers’ preference towards green food products. In
other words, there is no significant difference among different age-groups concerning their
impact on preference, i.e., 18-25 = 26-35 = 36-50 = >50.
Page 159
159
The exact significant level (p value) of ANOVA is exhibited in 6th
Col. (Sig.) of table 6.6.1.1.
The level of significance set by us is 5%, i.e., α = 0.05 (on the basis of existing researches of
similar type). The table reveals that ‘p’ value is more than the ‘α’ value. In fact, since p = 0.656
is greater than α = 0.05, the null hypothesis is accepted and established. That means, the age-
group does not significantly impact the consumers’ preference towards green food products.
6.6.2 Gender
Like age-group, for gender also, One-Way ANOVA is done in order to know whether the
gender, denoted as v1, has significant impact on the use of green food products. For the
purpose, the respondents studied have been segregated into two categories; a) Female B) Male
and these categories are denoted respectively as 0 and 1 for analysis purpose in SPSS.
Preference for green food products is the dependent variable and in analysis, it is denoted as v2.
The relevant portion of SPSS output sheet is presented below to infer whether there is any
significant effect of gender on the preference of green food products.
Table 6.6.2.1 ANOVA Output for Gender
Sum of
Squares Df
Mean
Square F Sig.
Between
Groups
.119 1 .119 .045 .832
Within Groups 1045.319 398 2.626
Total 1045.438 399
Source: SPSS Output
Page 160
160
6.6.2.1 Hypothesis on Gender
H: Gender does not influence consumers’ preference towards green food products. In other
words, there is no significant difference between two genders concerning their impact on
preference, i.e., Male = Female.
The exact significant level (p value) of ANOVA is exhibited in 6th
Col. (Sig.) of table 6.6.2.1.
The level of significance set by us is 5%, i.e., α = 0.05 (on the basis of existing researches of
similar type). The table reveals that ‘p’ value is more than the ‘α’ value. In fact, since p = 0.832
is greater than α = 0.05, the null hypothesis is accepted and established. That means, gender does
not significantly impact the consumers’ preference towards green food products.
6.6.3 Level of Education
Like the other demographic variables, for level of education also, One-Way ANOVA is done in
order to know whether the level of education, denoted as v1, has significant impact on the use
of green food products. For the purpose, the respondents studied have been segregated into
three categories; a) High School b) Graduation and c) Post – Graduation. These categories are
denoted respectively as 0, 1 and 2 for analysis purpose in SPSS. Preference for green food
products is the dependent variable and in analysis, it is denoted as v2. The relevant portion of
SPSS output sheet is presented below to infer whether there is any significant effect of level of
education on the preference of green food products.
Page 161
161
Table 6.6.3.1 ANOVA Output for Education
Sum of
Squares Df Mean Square F Sig.
Between
Groups
.904 2 .452 .171 .843
Within Groups 1043.652 395 2.642
Total 1044.555 397
Source: SPSS Output
6.6.3.1 Hypothesis on Education
H: Level of Education does not influence consumers’ preference towards green food
products. In other words, there is no significant difference between three levels of education
concerning their impact on preference, i.e., High School = Graduation = Post - Graduation.
The exact significant level (p value) of ANOVA is exhibited in 6th
Col. (Sig.) of table 6.6.3.1.
The level of significance set by us is 5%, i.e., α = 0.05 (on the basis of existing researches of
similar type). The table reveals that ‘p’ value is more than the ‘α’ value. In fact, since p = 0.843
is greater than α = 0.05, the null hypothesis is accepted and established. That means, level of
education does not significantly impact the consumers’ preference towards green food products.
6.6.4 Occupation
Like the other demographic variables, for different types of occupation also, One-Way ANOVA
is done in order to know whether the different types of occupation , denoted as v1, has
significant impact on the use of green food products. For the purpose, the respondents studied
have been segregated into four categories; a) Student b) Business c) Service and d) Housewife.
These categories are denoted respectively as 0, 1, 2 and 3 for analysis purpose in SPSS.
Page 162
162
Preference for green food products is the dependent variable and in analysis, it is denoted as v2.
The relevant portion of SPSS output sheet is presented below to infer whether there is any
significant effect of level of education on the preference of green food products.
Table 6.6.4.1 ANOVA output for Occupation
Sum of
Squares Df Mean Square F Sig.
Between
Groups
9.146 3 3.049 1.165 .323
Within Groups 1036.292 396 2.617
Total 1045.438 399
Source: SPSS Output
6.6.4.1 Hypothesis on Occupation:
H: Occupation does not influence consumers’ preference towards green food products. In
other words, there is no significant difference between four levels of occupation concerning their
impact on preference, i.e., Student = Business = Service = Housewife.
The exact significant level (p value) of ANOVA is exhibited in 6th
Col. (Sig.) of table 6.6.4.1.
The level of significance set by us is 5%, i.e., α = 0.05 (on the basis of existing researches of
similar type). The table reveals that ‘p’ value is more than the ‘α’ value. In fact, since p = 0.323
is greater than α = 0.05, the null hypothesis is accepted and established. That means, Occupation
does not significantly impact the consumers’ preference towards green food products.
6.6.5 Income
Like other characteristics of demographic profile as analyzed above, income of the consumers
has also been considered for One-Way ANOVA in order to know whether the income level of
Page 163
163
the consumers, denoted as v1, has significant impact on the use of green food products. For the
purpose, the respondents studied have been segregated into five categories on the basis of
monthly income in Rupees; a) <25,000 b) 25001-49999 c) 50000-74999 d) 75000-99999 and e)
≥100000 and these categories are denoted respectively as 0, 1, 2, 3 and 4 for analysis purpose in
SPSS. Preference for green food products is the dependent variable and in analysis, it is denoted
as v2. The relevant portion of SPSS output sheet is presented below to infer whether there is
any significant effect of income level of the consumers on the preference of green food
products.
Table 6.6.5.1 ANOVA output for Income Level
Sum of
Squares Df Mean Square F Sig.
Between
Groups
4.791 4 1.198 .455 .039
Within Groups 1040.646 395 2.635
Total 1045.438 399
Source: SPSS Output
6.6.5.1 Hypothesis on Income Level
H: Income level does not influence consumers’ preference towards green food products. In
other words, there is no significant difference between five income levels concerning their
impact on preference, i.e., <25,000 = 25001-49999 = 50000-74999 = 75000-99999 = ≥100000.
The exact significant level (p value) of ANOVA is exhibited in 6th
Col. (Sig.) of table 6.6.5.1 is
.039. The level of significance set by us is 5%, i.e., α = 0.05 (on the basis of existing researches
of similar type). The table reveals that ‘p’ value is less than the ‘α’ value. In fact, since p = 0.039
is less than α = 0.05, the null hypothesis is not accepted and the alternative hypothesis is
Page 164
164
accepted and established. That means, income level significantly impacts the consumers’
preference towards green food products.
6.6.6 Number of Members in Household
The last demographic variable which is studied is the number of members in the household of
the consumer, for different number of members in the household also, One-Way ANOVA is
done in order to know whether different number of members in the household, denoted as v1,
has significant impact on the use of green food products. For the purpose, the respondents
studied have been segregated into three categories; a) <2 b) 2 - 4 and c) ≥ 5. These categories
are denoted respectively as 0, 1 and 2 for analysis purpose in SPSS. Preference for green food
products is the dependent variable and in analysis, it is denoted as v2. The relevant portion of
SPSS output sheet is presented below to infer whether there is any significant effect of level of
education on the preference of green food products.
Table 6.6.6.1 ANOVA output for Number of members in the household
Sum of
Squares Df Mean Square F Sig.
Between
Groups
2.261 2 1.131 .430 .651
Within Groups 1043.176 397 2.628
Total 1045.437 399
Source: SPSS Output
Page 165
165
6.6.6.1 Hypothesis on Number of members in the Household
H: Number of members in the household does not influence consumers’ preference towards
green food products. In other words, there is no significant difference between four levels of
occupation concerning their impact on preference, i.e., <2 = 2-4 = ≥ 5.
The exact significant level (p value) of ANOVA is exhibited in 6th
Col. (Sig.) of table 6.6.6.1.
The level of significance set by us is 5%, i.e., α = 0.05 (on the basis of existing researches of
similar type). The table reveals that ‘p’ value is more than the ‘α’ value. In fact, since p = 0.651
is greater than α = 0.05, the null hypothesis is accepted and established. That means, Occupation
does not significantly impact the consumers’ preference towards green food products.
6.7 Respondents’ General Behaviour regarding buying Green Products
Table 6.7.1 Respondents’ General Behaviour regarding buying Green Products
Characteristics Profile Frequency Percent
Do the customers
know about green
products?
Yes 400 100
No 0 0
Do the customers
buy green products
Yes 400 100
No 0 0
Do the customers
buy green products
in this shopping
Yes 199 49.8
No 201 50.3
Page 166
166
trip?
What all
green
products
did you
buy in
this
shopping
trip?
Green
Cosmetic
Products
Yes 97 24.3
No 303 75.8
Green
Food
Products
Yes 126 31.5
No 274 68.5
How frequently do
you buy green
products?
Less than once
a month
119 29.8
Once a month 131 32.8
Once a
fortnight
79 19.8
More than
once a
fortnight
71 17.8
Source: Primary Data
Page 167
167
6.7.1 Respondents’ knowledge about green products
Figure 6.7.1: Respondents’ knowledge about green products
From the above figure, it can be stated that all the respondents’ surveyed know about the either
green cosmetic or green food products. So, their responses will be relevant to the research.
6.7.2 Respondents’ buying pattern for Green Products
Figure 6.7.2: Respondents’ buying pattern for green products
All the respondents surveyed buy green products. Some of them buy frequently and others buy as
and when needed. Since all the respondents have experience of using either green cosmetic or
food products, the responses from them will be relevant with respect to the objectives of the
research.
100%
0
Do the customers know about green products
Yes
No
100%
Do the customers buy green products
Yes
No
Page 168
168
6.7.3 Respondents’ buying pattern for Green Products in this Shopping Trip
Figure 6.7.3: Respondents' buying pattern for green products in this shopping trip
From the above chart, it can be stated that 50.3%, i.e., 201 respondents bought either green
cosmetic or food products in the shopping trip where they had been surveyed. On the other hand,
49.8% respondents, i.e., 199 respondents have not bought neither green cosmetic nor food
products in the shopping trip where they had been surveyed. Among the respondents who have
bought green cosmetic or food products, the specific number of respondents for the green
cosmetic and food products are explained in the corresponding charts.
6.7.4 Respondents’ buying pattern for Green Cosmetic Products in this Shopping Trip
Figure 6.7.4: Respondents’ buying pattern for green cosmetic products in this shopping
trip
49.8% 50.3%
Do the customers buy green products in this shopping trip
Yes
No
24.3%
75.8%
Bought Green Cosmetic Products in this Shopping Trip
Yes
No
Page 169
169
From the above chart, it can be stated that 24.3 % respondents’, i.e., 97 respondents bought green
cosmetic products in the shopping trip when they had been surveyed. On the other hand, 75.8%,
i.e., 303 respondents’ have not bought green cosmetic products in the shopping trips when they
had been surveyed. So, it can be stated that the respondents’ who had bought green cosmetic
products, their responses will be related to their point of purchase.
6.7.5 Respondents’ buying pattern for Green Food Products in this Shopping Trip
Figure 6.7.5: Respondents’ buying pattern for green food products in this shopping
trip
From the above chart, it can be stated that 31.5 % respondents’, i.e., 126 respondents bought
green food products in the shopping trip when they had been surveyed. On the other hand, 68.5%
, i.e., 274 respondents’ have not bought green food products in the shopping trips when they had
been surveyed. So, it can be stated that the respondents’ who had bought green food products,
their responses will be related to their point of purchase.
31.5%
68.5%
Bought Green Food Products in this Shopping Trip
Yes
No
Page 170
170
6.7.6 Respondents Frequency for buying Green products
Figure 6.7.6: Respondents’ frequency for buying green products
From the above chart about the frequency of purchase of either green cosmetic or food products,
29.8% respondents’ , i.e., 119 respondents used to buy green products less than once a month.
32.8%, i.e., 131 respondents buy green products once in a month. 19.8%, i.e., only 79
respondents buy green products once a fortnight and 17.8% , i.e.,71 respondents buy green
products more than once a fortnight. This means that last group, i.e., 71 respondents is regular
buyers of either green cosmetic or food products.
29.8%
32.8%
19.8%
17.8%
Frequency of buying green products
Less than once a month
Once a month
Page 171
171
6.8 Impact of Psychographic variables on Preference for Green Cosmetic
Products (ANOVA)
6.8.1 Environmental Consciousness
The first psychographic variable which is studied is the Environmental Consciousness. One-
Way ANOVA is done in order to know whether Environmental Consciousness has significant
impact on the use of Green Cosmetic products.
The five predictor variables related to Environmental Consciousness identified and on which the
data has been collected are;
V1: Users of Green Cosmetic Products supports different measures to improve water
management leading to water conservation
V2: Users of Green Cosmetic Products is aware about the issues and problems related to the
environment
V3: Users of Green Cosmetic Products would be willing to pay higher prices for water
V4: It is very difficult for the Users of Green Cosmetic Products to do anything about the
environment
V5: Users of Green Cosmetic Products believes that using recyclable materials for daily use will
improve the environment
Preference for green cosmetic products is the dependent variable and in analysis, it is denoted as
V6. For the purpose, the responses were collected using seven categories; 1 = Very Strongly
Disagree(VSD), 2 = Strongly Disagree(SD) , 3 = Disagree(D) , 4 = Neither Agree Nor
Disagree(NAD) , 5 = Agree(A) , 6 = Strongly Agree(SA) , 7 = Very Strongly Agree(VSA).
Page 172
172
The relevant portion of SPSS output sheet is presented below to infer whether there is any
significant effect of Environmental Consciousness on the preference of Green Cosmetic
products.
Table 6.8.1.1 ANOVA output for Environmental Consciousness
Model
Sum of
Squares Df
Mean
Square F Sig.
1 Regression 2.527 5 .505 .192 .036
Residual 1036.513 394 2.631
Total 1039.040 399
Source: SPSS Output
6.8.1.1 Hypothesis on Environmental Consciousness
H: Environmental consciousness will not influence consumers’ preference for green
cosmetic products.
The exact significant level (p value) of ANOVA is exhibited in 6th
Col. (Sig.) of above
mentioned table. The level of significance set by us is 5%, i.e., α = 0.05 (on the basis of existing
researches of similar type). The table reveals that ‘p’ value is less than the ‘α’ value. In fact,
since p = 0.036 is less than α = 0.05, the null hypothesis is not accepted and the alternative
hypothesis is accepted. That means, Environmental Consciousness significantly impact the
consumers’ preference towards green cosmetic products.
6.8.2 Price Sensitivity
The second psychographic variable which is studied is the Price Sensitivity. One-Way ANOVA
is done in order to know whether Price Sensitivity has significant impact on the use of green
Page 173
173
cosmetic products. The six predictor variables identified and on which the data has been
collected are;
V1: The price of buying Green Cosmetic Products is important to users of Green Cosmetic
Products
V2: Users of Green Cosmetic Products know that a new kind of green cosmetic product is likely
to be more expensive than older ones, but that does not matter to them
V3: Users of Green Cosmetic Products are less willing to buy a green product if they think that it
will be high in price
V4: Users of Green Cosmetic Products don’t mind paying more to try out a new green cosmetic
product
V5: Users of Green Cosmetic Products think that really good Green Cosmetic product is worth
paying a lot of money
V6: Users of Green Cosmetic Products don’t mind spending a lot of money to buy a Green
Cosmetic product
Preference for green cosmetic products is the dependent variable and in analysis, it is denoted as
V7. For the purpose, the responses were collected using seven categories; 1 = Very Strongly
Disagree(VSD), 2 = Strongly Disagree(SD) , 3 = Disagree(D) , 4 = Neither Agree Nor
Disagree(NAD) , 5 = Agree(A) , 6 = Strongly Agree(SA) , 7 = Very Strongly Agree(VSA). The
relevant portion of SPSS output sheet is presented below to infer whether there is any significant
effect of Price Sensitivity on the preference of green cosmetic products.
Table 6.8.2.1 ANOVA output for Price Sensitivity
Model
Sum of
Squares Df Mean Square F Sig.
Page 174
174
1 Regression 25.470 6 4.245 1.646 .013a
Residual 1013.570 393 2.579
Total 1039.040 399
a. Predictors: (Constant), v6, v5, v3, v1, v4, v2
b. Dependent Variable: v7
Source: SPSS Output
6.8.2.1Hypothesis on Price Sensitivity:
H: Price Sensitivity will not influence consumers’ preference for green cosmetic products.
The exact significant level (p value) of ANOVA is exhibited in 6th
Col. (Sig.) of the above
mentioned table. The level of significance set by us is 5%, i.e., α = 0.05 (on the basis of existing
researches of similar type). The table reveals that ‘p’ value is less than the ‘α’ value. In fact,
since p =0.013 is less than α = 0.05, the null hypothesis is not accepted and alternative
hypothesis is accepted. That means, Price Sensitivity significantly impact the consumers’
preference towards green cosmetic products.
6.8.3 Innovativeness in buying products
The third psychographic variable which is studied is Innovativeness in buying products. One-
Way ANOVA is done in order to know whether Innovativeness in buying products has
significant impact on the use of green cosmetic products.
The four predictor variables related to Innovativeness in buying Green Cosmetic Products
identified and on which the data has been collected are;
V1: Users of Green Cosmetic Products like to take a chance in buying new products
V2: Users of Green Cosmetic Products like to try new and different products
Page 175
175
V3: Users of Green Cosmetic Products is the first in his circle of friends to buy a new product
when it appears in the market
V4: Users of Green Cosmetic Products is the first in his circle of friends to experiment with the
brands of latest products
Preference for green cosmetic products is the dependent variable and in analysis, it is denoted as
V7. For the purpose, the responses were collected using seven categories; 1 = Very Strongly
Disagree(VSD), 2 = Strongly Disagree(SD) , 3 = Disagree(D) , 4 = Neither Agree Nor
Disagree(NAD) , 5 = Agree(A) , 6 = Strongly Agree(SA) , 7 = Very Strongly Agree(VSA). The
relevant portion of SPSS output sheet is presented below to infer whether there is any significant
effect of Innovativeness in buying products on the preference of Green Cosmetic products.
Table 6.8.3.1 ANOVA output for Innovativeness in buying products
Model
Sum of
Squares Df Mean Square F Sig.
1 Regression 8.831 4 2.208 .846 .046a
Residual 1030.209 395 2.608
Total 1039.040 399
a. Predictors: (Constant), v4, v3, v1, v2
b. Dependent Variable: v5
Source: SPSS Output
6.8.3.1 Hypothesis on Innovativeness in buying products
H: Innovativeness in buying products will not influence consumers’ preference for green
cosmetic products
The exact significant level (p value) of ANOVA is exhibited in 6th
Col. (Sig.) of the above
mentioned table. The level of significance set by us is 5%, i.e., α = 0.05 (on the basis of existing
Page 176
176
researches of similar type). The table reveals that ‘p’ value is less than the ‘α’ value. In fact,
since p = 0.046 is less than α = 0.05, the null hypothesis is not accepted and the alternative
hypothesis is accepted. That means, Innovativeness in buying products significantly impact the
consumers’ preference towards green cosmetic products.
6.8.4 Product Involvement
The fourth psychographic variable which is studied is Product Involvement. One-Way ANOVA
is done in order to know whether Product Involvement has significant impact on the use of
green cosmetic products.
The five predictor variables related to Product Involvement in Buying Green Cosmetic Products
are identified and on which the data has been collected are;
V1: Users of Green Cosmetic Products select the green products very carefully
V2: Using branded green products help Users of Green Cosmetic Products express their
personality
V3: One can tell a lot about a person from whether they buy Green Cosmetic Products
V4: Users of Green Cosmetic Products believe different brands of green products would give
different amounts of satisfaction
Preference for green cosmetic products is the dependent variable and in analysis, it is denoted as
V7.
For the purpose, the respondents studied have been segregated into seven categories; 1 = Very
Strongly Disagree(VSD), 2 = Strongly Disagree(SD) , 3 = Disagree(D) , 4 = Neither Agree Nor
Disagree(NAD) , 5 = Agree(A) , 6 = Strongly Agree(SA) , 7 = Very Strongly Agree(VSA). The
relevant portion of SPSS output sheet is presented below to infer whether there is any
significant effect of Product Involvement on the preference of green cosmetic products.
Page 177
177
Table 6.8.4.1 ANOVA output for Product Involvement
Model
Sum of
Squares Df Mean Square F Sig.
1 Regression 3.567 4 .892 .340 .851a
Residual 1035.473 395 2.621
Total 1039.040 399
a. Predictors: (Constant), v4, v3, v1, v2
b. Dependent Variable: v5
Source: SPSS Output
6.8.4.1 Hypothesis on Product Involvement
H: Product involvement will not influence consumers’ preference for green cosmetic products.
The exact significant level (p value) of ANOVA is exhibited in 6th
Col. (Sig.) of the above
mentioned table. The level of significance set by us is 5%, i.e., α = 0.05 (on the basis of existing
researches of similar type). The table reveals that ‘p’ value is less than the ‘α’ value. In fact,
since p = 0.851 is greater than α = 0.05, the null hypothesis is accepted. That means, Product
involvement will not significantly impact the consumers’ preference towards green cosmetic
products.
6.8.5 Health Consciousness
The fifth psychographic variable which is studied is Health Consciousness. One-Way ANOVA
is done in order to know whether Health Consciousness has significant impact on the use of
green cosmetic products.
The eight predictor variables related to Health Consciousness in buying Green Cosmetic
Products are identified and on which the data has been collected are;
Page 178
178
V1: Users of Green Cosmetic Products worry that there are chemicals in their Cosmetic products
V2: Users of Green Cosmetic Products worry that there are chemicals in their cosmetic products
V3: Users of Green Cosmetic Products are concerned about their drinking water quality
V4: Users of Green Cosmetic Products avoid food containing preservatives
V5: Users of Green Cosmetic Products read more health-related articles than I did 3 years ago
V6: Users of Green Cosmetic Products are interested in information about their health
V7: Users of Green Cosmetic Products are concerned about their health all the time
V8: Pollution in Cosmetic products does not bother users of Green Cosmetic Products
Preference for green cosmetic products is the dependent variable and in analysis, it is denoted as
V9.For the purpose, the respondents studied have been segregated into seven categories; 1 =
Very Strongly Disagree(VSD), 2 = Strongly Disagree(SD) , 3 = Disagree(D) , 4 = Neither Agree
Nor Disagree(NAD) , 5 = Agree(A) , 6 = Strongly Agree(SA) , 7 = Very Strongly Agree(VSA).
The relevant portion of SPSS output sheet is presented below to infer whether there is any
significant effect of Health Consciousness on the preference of green cosmetic products.
Table 6.8.5.1 ANOVA output for Health Consciousness in buying products
Model
Sum of
Squares Df Mean Square F Sig.
1 Regression 37.403 8 4.675 1.825 .015a
Residual 1001.637 391 2.562
Total 1039.040 399
Source : SPSS Output
6.8.5.1 Hypothesis on Health Consciousness
H: Health consciousness will not influence consumers’ preference for green cosmetic products.
Page 179
179
The exact significant level (p value) of ANOVA is exhibited in 6th
Col. (Sig.) of the above
mentioned table. The level of significance set by us is 5%, i.e., α = 0.05 (on the basis of existing
researches of similar type). The table reveals that ‘p’ value is less than the ‘α’ value. In fact,
since p = 0.015 is less than α = 0.05, the null hypothesis is not accepted and the alternative
hypothesis is accepted. That means, Health Consciousness will significantly impact the
consumers’ preference towards green cosmetic products.
6.9 Impact of Psychographic variables on Preference for Green Food Products
(ANOVA)
6.9.1 Environmental Consciousness
The first psychographic variable which is studied is the Environmental Consciousness. One-
Way ANOVA is done in order to know whether Environmental Consciousness has significant
impact on the use of Green Food products.
The five predictor variables related to Environmental Consciousness identified and on which the
data has been collected are;
V1: Users of Green Food Products supports different measures to improve water management
leading to water conservation
V2: Users of Green Food Products is aware about the issues and problems related to the
environment
V3: Users of Green Food Products would be willing to pay higher prices for water
V4: It is very difficult for the Users of Green Food Products to do anything about the
environment
V5: Users of Green Food Products believes that using recyclable materials for daily use will
improve the environment
Page 180
180
Preference for green food products is the dependent variable and in analysis, it is denoted as V6.
For the purpose, the responses were collected using seven categories; 1 = Very Strongly
Disagree(VSD), 2 = Strongly Disagree(SD) , 3 = Disagree(D) , 4 = Neither Agree Nor
Disagree(NAD) , 5 = Agree(A) , 6 = Strongly Agree(SA) , 7 = Very Strongly Agree(VSA).
The relevant portion of SPSS output sheet is presented below to infer whether there is any
significant effect of Environmental Consciousness on the preference of Green Food products.
Table 6.9.1.1 ANOVA output for Environmental Consciousness
Model
Sum of
Squares Df Mean Square F Sig.
1 Regression 7.442 5 1.488 .565 .027a
Residual 1037.996 394 2.635
Total 1045.437 399
a. Predictors: (Constant), v5, v1, v4, v2, v3
b. Dependent Variable: v6
Source : SPSS Output
6.9.1.1 Hypothesis on Environmental Consciousness
H: Environmental consciousness will not influence consumers’ preference for green food
products.
The exact significant level (p value) of ANOVA is exhibited in 6th
Col. (Sig.) of the above
mentioned table. The level of significance set by us is 5%, i.e., α = 0.05 (on the basis of existing
researches of similar type). The table reveals that ‘p’ value is less than the ‘α’ value. In fact,
since p = 0.027 is less than α = 0.05, the null hypothesis is not accepted and the alternative
Page 181
181
hypothesis is accepted. That means, Environmental consciousness significantly impact the
consumers’ preference towards green food products.
6.9.2 Price Sensitivity
In this section of the present study, the Criterion Variable is the Preference for Green Food
Products for which six predictor variables identified and on which the data has been collected
are;
V1: The price of buying Green Food Products is important to users of Green Food Products
V2: Users of Green Food Products know that a new kind of green food product is likely to be
more expensive than older ones, but that does not matter to them
V3: Users of Green Food Products are less willing to buy a green product if they think that it will
be high in price
V4: Users of Green Food Products don’t mind paying more to try out a new green food product
V5: Users of Green Food Products think that really good Green Food product is worth paying a
lot of money
V6: Users of Green Food Products don’t mind spending a lot of money to buy a Green Food
product
Preference for green food products is the dependent variable and in analysis, it is denoted as V6.
For the purpose, the responses were collected using seven categories; 1 = Very Strongly
Disagree(VSD), 2 = Strongly Disagree(SD) , 3 = Disagree(D) , 4 = Neither Agree Nor
Disagree(NAD) , 5 = Agree(A) , 6 = Strongly Agree(SA) , 7 = Very Strongly Agree(VSA).
The relevant portion of SPSS output sheet is presented below to infer whether there is any
significant effect of Price Sensitivity on the preference of Green Food products.
Page 182
182
Table 6.9.2.1 ANOVA Output for Price Sensitivity
Model
Sum of
Squares Df Mean Square F Sig.
1 Regression 26.955 6 4.492 1.733 .019a
Residual 1018.483 393 2.592
Total 1045.437 399
a. Predictors: (Constant), v6, v5, v3, v1, v4, v2
b. Dependent Variable: v7
Source: SPSS Output
6.9.2.1 Hypothesis on Price Sensitivity
H: Price Sensitivity will not influence consumers’ preference for green food products.
The exact significant level (p value) of ANOVA is exhibited in 6th
Col. (Sig.) of the above
mentioned table. The level of significance set by us is 5%, i.e., α = 0.05 (on the basis of existing
researches of similar type). The table reveals that ‘p’ value is less than the ‘α’ value. In fact,
since p =0.019 is less than α = 0.05, the null hypothesis is not accepted and the alternative
hypothesis is accepted. That means, Price Sensitivity significantly impact the consumers’
preference towards green food products.
6.9.3 Innovativeness in buying products
The third psychographic variable which is studied is Innovativeness in buying products. One-
Way ANOVA is done in order to know whether Innovativeness in buying products has
significant impact on the use of green food products.
The four predictor variables related to Innovativeness in buying Green Food Products identified
and on which the data has been collected are;
Page 183
183
V1: Users of Green Food Products like to take a chance in buying new products
V2: Users of Green Food Products like to try new and different products
V3: Users of Green Food Products is the first in his circle of friends to buy a new product when
it appears in the market
V4: Users of Green Food Products is the first in his circle of friends to experiment with the
brands of latest products
Preference for green food products is the dependent variable and in analysis, it is denoted as V7.
For the purpose, the responses were collected using seven categories; 1 = Very Strongly
Disagree(VSD), 2 = Strongly Disagree(SD) , 3 = Disagree(D) , 4 = Neither Agree Nor
Disagree(NAD) , 5 = Agree(A) , 6 = Strongly Agree(SA) , 7 = Very Strongly Agree(VSA). The
relevant portion of SPSS output sheet is presented below to infer whether there is any significant
effect of Innovativeness in buying products on the preference of Green Food products.
Table 6.9.3.1. ANOVA Output for Innovativeness in buying products
Model
Sum of
Squares Df Mean Square F Sig.
1 Regression 31.503 4 7.876 3.068 .017a
Residual 1013.934 395 2.567
Total 1045.437 399
a. Predictors: (Constant), v4, v3, v1, v2
b. Dependent Variable: v5
Source: SPSS Output
6.9.3.1 Hypothesis on Innovativeness in buying products
H: Innovativeness in buying products will not influence consumers’ preference for green food
products
Page 184
184
The exact significant level (p value) of ANOVA is exhibited in 6th
Col. (Sig.) of table 4.10. The
level of significance set by us is 5%, i.e., α = 0.05 (on the basis of existing researches of similar
type). The table reveals that ‘p’ value is less than the ‘α’ value. In fact, since p = 0.017 is less
than α = 0.05, the null hypothesis is not accepted and the alternative hypothesis is accepted. That
means, Innovativeness in buying products significantly impact the consumers’ preference
towards green food products.
6.9.4 Involvement
The fourth psychographic variable which is studied is Product Involvement. One-Way ANOVA
is done in order to know whether Product Involvement has significant impact on the use of
green food products.
The five predictor variables related to Product Involvement in Buying Green Food Products are
identified and on which the data has been collected are;
V1: Users of Green Food Products select the green products very carefully
V2: Using branded green products help Users of Green Food Products express their personality
V3: One can tell a lot about a person from whether they buy Green Food Products
V4: Users of Green Food Products believe different brands of green products would give
different amounts of satisfaction
Preference for green food products is the dependent variable and in analysis, it is denoted as
V7.For the purpose, the respondents studied have been segregated into seven categories; 1 =
Very Strongly Disagree(VSD), 2 = Strongly Disagree(SD) , 3 = Disagree(D) , 4 = Neither Agree
Nor Disagree(NAD) , 5 = Agree(A) , 6 = Strongly Agree(SA) , 7 = Very Strongly Agree(VSA).
The relevant portion of SPSS output sheet is presented below to infer whether there is any
significant effect of Product Involvement on the preference of green food products.
Page 185
185
Table 6.9.4.1. ANOVA output for Product Involvement in buying products
Model
Sum of
Squares Df Mean Square F Sig.
1 Regression 11.209 4 2.802 1.070 .371a
Residual 1034.229 395 2.618
Total 1045.437 399
a. Predictors: (Constant), v4, v3, v1, v2
b. Dependent Variable: v5
Source: SPSS Output
6.9.4.1 Hypothesis on Product involvement
H: Product involvement will not influence consumers’ preference for green food products.
The exact significant level (p value) of ANOVA is exhibited in 6th
Col. (Sig.) of the above
mentioned table. The level of significance set by us is 5%, i.e., α = 0.05 (on the basis of existing
researches of similar type). The table reveals that ‘p’ value is less than the ‘α’ value. In fact,
since p = 0.371 is greater than α = 0.05, the null hypothesis is accepted and established. That
means, Innovativeness in buying products will not significantly impact the consumers’
preference towards green food products.
6.9.4 Health Consciousness
The fifth psychographic variable which is studied is Health Consciousness. One-Way ANOVA
is done in order to know whether Health Consciousness has significant impact on the use of
green food products.
The eight predictor variables related to Health Consciousness in buying Green Food Products are
identified and on which the data has been collected are;
V1: Users of Green Food Products worry that there are chemicals in their food products
Page 186
186
V2: Users of Green Food Products worry that there are chemicals in their food products
V3: Users of Green Food Products are concerned about their drinking water quality
V4: Users of Green Food Products avoid food containing preservatives
V5: Users of Green Food Products read more health-related articles than I did 3 years ago
V6: Users of Green Food Products are interested in information about their health
V7: Users of Green Food Products are concerned about their health all the time
V8: Pollution in Food products does not bother users of Green Food Products
Preference for green food products is the dependent variable and in analysis, it is denoted as
V9.For the purpose, the respondents studied have been segregated into seven categories; 1 =
Very Strongly Disagree(VSD), 2 = Strongly Disagree(SD) , 3 = Disagree(D) , 4 = Neither Agree
Nor Disagree(NAD) , 5 = Agree(A) , 6 = Strongly Agree(SA) , 7 = Very Strongly Agree(VSA).
The relevant portion of SPSS output sheet is presented below to infer whether there is any
significant effect of Health Consciousness on the preference of green food products.
Table 6.9.5.1. ANOVA output for Health Consciousness
Model
Sum of
Squares Df Mean Square F Sig.
1 Regression 20.813 8 2.602 .993 .041a
Residual 1024.625 391 2.621
Total 1045.437 399
a. Predictors: (Constant), v8, v5, v6, v1, v7, v4, v3, v2
b. Dependent Variable: v9
Source: SPSS Output
6.9.5.1 Hypothesis on Health Consciousness
H: Health Consciousness will not influence consumers’ preference for green food products.
Page 187
187
The exact significant level (p value) of ANOVA is exhibited in 6th
Col. (Sig.) of the above
mentioned table. The level of significance set by us is 5%, i.e., α = 0.05 (on the basis of existing
researches of similar type). The table reveals that ‘p’ value is less than the ‘α’ value. In fact,
since p = 0.041 is less than α = 0.05, the null hypothesis is not accepted and the alternative
hypothesis is accepted. That means, Health Consciousness will significantly impact the
consumers’ preference towards green food products.
6.10 Impact of different independent variables on the preference for Green
Cosmetic Products (ANOVA)
6.10.1 Safety
Here safety perspective of the consumers is studied. One-Way ANOVA is done in order to
know whether Safety perspective of the consumer, denoted as v1, has significant impact on the
use of green cosmetic products. For the purpose, the respondents have been studied using seven
categories; 1 = Very Strongly Disagree(VSD), 2 = Strongly Disagree(SD) , 3 = Disagree(D) , 4
= Neither Agree Nor Disagree(NAD) , 5 = Agree(A) , 6 = Strongly Agree(SA) , 7 = Very
Strongly Agree(VSA). Preference for green cosmetic products is the dependent variable and in
analysis, it is denoted as v2. The relevant portion of SPSS output sheet is presented below to
infer whether there is any significant effect of Safety perspective on the preference of green
cosmetic products.
Table 6.10.1.1 ANOVA for Safety of Green Cosmetic Products
v2
Sum of
Squares Df Mean Square F Sig.
Between
Groups
18.856 6 3.143 1.211 .023
Page 188
188
Within Groups 1020.184 393 2.596
Total 1039.040 399
Source: SPSS Output
6.10.1.1 Hypothesis on Safety
H: Safety will not influence consumers’ preference for green cosmetic products
The exact significant level (p value) of ANOVA is exhibited in 6th
Col. (Sig.) of the above
mentioned table. The level of significance set by us is 5%, i.e., α = 0.05 (on the basis of existing
researches of similar type). The table reveals that ‘p’ value is less than the ‘α’ value. In fact,
since p = 0.023 is less than α = 0.05, the null hypothesis is not accepted and the alternative
hypothesis is accepted. That means, the safety perspective of the consumers significantly impact
the consumers’ preference towards green cosmetic products.
6.10.2 Quality
Here quality perspective of the consumers is studied. One-Way ANOVA is done in order to
know whether quality perspective of the consumer, denoted as v1, has significant impact on the
use of green cosmetic products. For the purpose, the respondents have been studied using seven
categories; 1 = Very Strongly Disagree(VSD), 2 = Strongly Disagree(SD) , 3 = Disagree(D) , 4
= Neither Agree Nor Disagree(NAD) , 5 = Agree(A) , 6 = Strongly Agree(SA) , 7 = Very
Strongly Agree(VSA). Preference for green cosmetic products is the dependent variable and in
analysis, it is denoted as v2. The relevant portion of SPSS output sheet is presented below to
infer whether there is any significant effect of quality perspective on the preference of green
cosmetic products.
Page 189
189
Table 6.10.2.1 ANOVA output for Quality of Green Cosmetic Products
v2
Sum of
Squares Df Mean Square F Sig.
Between
Groups
22.822 6 3.804 1.471 .018
Within Groups 1016.218 393 2.586
Total 1039.040 399
Source: SPSS Output
6.10.2.1 Hypothesis on Quality
H: Quality will not influence consumers’ preference for green cosmetic products
The exact significant level (p value) of ANOVA is exhibited in 6th
Col. (Sig.) of the above
mentioned table. The level of significance set by us is 5%, i.e., α = 0.05 (on the basis of existing
researches of similar type). The table reveals that ‘p’ value is more than the ‘α’ value. In fact,
since p = 0.018 is less than α = 0.05, the null hypothesis is not accepted and the alternative
hypothesis is accepted. That means, the quality perspective of the consumers significantly impact
the consumers’ preference towards green cosmetic products.
6.10.3 Product Effectivity
Here product effectivity is studied. One-Way ANOVA is done in order to know whether
product effectivity, denoted as v1, has significant impact on the use of green cosmetic products.
For the purpose, the respondents have been studied using seven categories; 1 = Very Strongly
Disagree(VSD), 2 = Strongly Disagree(SD) , 3 = Disagree(D) , 4 = Neither Agree Nor
Disagree(NAD) , 5 = Agree(A) , 6 = Strongly Agree(SA) , 7 = Very Strongly Agree(VSA).
Page 190
190
Preference for green cosmetic products is the dependent variable and in analysis, it is denoted
as v2. The relevant portion of SPSS output sheet is presented below to infer whether there is
any significant effect of product effectivity on the preference of green cosmetic products.
Table 6.10.3.1 ANOVA output for Product Effectivity of Green Cosmetic
Products
v2
Sum of
Squares Df
Mean
Square F Sig.
Between
Groups
30.873 6 5.145 2.006 .064
Within Groups 1008.167 393 2.565
Total 1039.040 399
Source: SPSS Output
6.10.3.1 Hypothesis on Product Effectivity
H: Product effectivity will not significantly influence consumers’ preference for green cosmetic
products
The exact significant level (p value) of ANOVA is exhibited in 6th
Col. (Sig.) of the above
mentioned table. The level of significance set by us is 5%, i.e., α = 0.05 ( on the basis of existing
researches of similar type). The table reveals that ‘p’ value is more than the ‘α’ value. In fact,
since p = 0.064 is greater than α = 0.05, the null hypothesis is accepted and established. That
means, the product effectivity will not significantly impact the consumers’ preference towards
green cosmetic products.
Page 191
191
6.10.4 Brands
Here impact of brand on preference for green cosmetic products is studied. One-Way ANOVA
is done in order to know whether brand, denoted as v1, has significant impact on the use of
green cosmetic products. For the purpose, the respondents have been studied using seven
categories; 1 = Very Strongly Disagree(VSD), 2 = Strongly Disagree(SD) , 3 = Disagree(D) , 4
= Neither Agree Nor Disagree(NAD) , 5 = Agree(A) , 6 = Strongly Agree(SA) , 7 = Very
Strongly Agree(VSA). Preference for green cosmetic products is the dependent variable and in
analysis, it is denoted as v2. The relevant portion of SPSS output sheet is presented below to
infer whether there is any significant effect of brand on the preference of green cosmetic
products.
Table 6.10.4.1 ANOVA output for Brand of Green Cosmetic Products
v2
Sum of
Squares Df Mean Square F Sig.
Between
Groups
28.574 6 4.762 1.852 .008
Within Groups 1010.466 393 2.571
Total 1039.040 399
Source: SPSS Output
6.10.4.1 Hypothesis on Brand
H: Brand will not significantly influence consumers’ preference for green cosmetic products
The exact significant level (p value) of ANOVA is exhibited in 6th
Col. (Sig.) of the above
mentioned table. The level of significance set by us is 5%, i.e., α = 0.05 (on the basis of existing
Page 192
192
researches of similar type). The table reveals that ‘p’ value is more than the ‘α’ value. In fact,
since p = 0.008 is less than α = 0.05, the null hypothesis is not accepted and the alternative
hypothesis is accepted. That means, the branded green cosmetic products significantly impact the
consumers’ preference towards green cosmetic products.
6.10.5 Product Knowledge
Here product knowledge of green cosmetic products is studied. One-Way ANOVA is done in
order to know whether product knowledge, denoted as v1, has significant impact on the use of
green cosmetic products. For the purpose, the respondents have been studied using seven
categories; 1 = Very Strongly Disagree(VSD), 2 = Strongly Disagree(SD) , 3 = Disagree(D) , 4
= Neither Agree Nor Disagree(NAD) , 5 = Agree(A) , 6 = Strongly Agree(SA) , 7 = Very
Strongly Agree(VSA).Preference for green cosmetic products is the dependent variable and in
analysis, it is denoted as v2. The relevant portion of SPSS output sheet is presented below to
infer whether there is any significant effect of product knowledge on the preference of green
cosmetic products.
Table 6.10.5.1 ANOVA output for Product Knowledge of Green Cosmetic
Products
v2
Sum of
Squares Df Mean Square F Sig.
Between
Groups
51.489 6 8.581 3.415 .003
Within Groups 987.551 393 2.513
Total 1039.040 399
Page 193
193
Source: SPSS Output
6.10.5.1 Hypothesis on Product Knowledge
H: Product knowledge will not significantly influence consumers’ preference for green cosmetic
products
The exact significant level (p value) of ANOVA is exhibited in 6th
Col. (Sig.) of the above
mentioned table. The level of significance set by us is 5%, i.e., α = 0.05 ( on the basis of existing
researches of similar type). The table reveals that ‘p’ value is more than the ‘α’ value. In fact,
since p = 0.003 is less than α = 0.05, the null hypothesis is not accepted and the alternative
hypothesis is accepted. That means, the product knowledge significantly impact the consumers’
preference towards green cosmetic products.
6.10.6 Information about the product
Here information about green cosmetic products is studied. One-Way ANOVA is done in order
to know whether information about green cosmetic products, denoted as v1, has significant
impact on the use of green cosmetic products. For the purpose, the respondents have been
studied using seven categories; 1 = Very Strongly Disagree(VSD), 2 = Strongly Disagree(SD) ,
3 = Disagree(D) , 4 = Neither Agree Nor Disagree(NAD) , 5 = Agree(A) , 6 = Strongly
Agree(SA) , 7 = Very Strongly Agree(VSA). Preference for green cosmetic products is the
dependent variable and in analysis, it is denoted as v2. The relevant portion of SPSS output
sheet is presented below to infer whether there is any significant effect of information about
green cosmetic products on the preference of green cosmetic products.
Page 194
194
Table 6.10.6.1 ANOVA for Information about the Green Food Products
v2
Sum of
Squares Df Mean Square F Sig.
Between
Groups
52.971 6 8.828 3.519 .002
Within Groups 986.069 393 2.509
Total 1039.040 399
Source: SPSS Output
6.10.6.1 Hypothesis on Information about the product
H: Information about the product will not significantly influence consumers’ preference for
green cosmetic and food products
The exact significant level (p value) of ANOVA is exhibited in 6th
Col. (Sig.) of the above
mentioned table. The level of significance set by us is 5%, i.e., α = 0.05 (on the basis of existing
researches of similar type). The table reveals that ‘p’ value is more than the ‘α’ value. In fact,
since p = 0.002 is less than α = 0.05, the null hypothesis is not accepted and the alternative
hypothesis is accepted. That means, the information about the products significantly impact the
consumers’ preference towards green cosmetic products.
6.10.7 Availability
Here availability of green cosmetic products is studied. One-Way ANOVA is done in order to
know whether availability of green cosmetic products, denoted as v1, has significant impact on
the use of green cosmetic products. For the purpose, the respondents have been studied using
seven categories; 1 = Very Strongly Disagree(VSD), 2 = Strongly Disagree(SD) , 3 =
Page 195
195
Disagree(D) , 4 = Neither Agree Nor Disagree(NAD) , 5 = Agree(A) , 6 = Strongly Agree(SA) ,
7 = Very Strongly Agree(VSA). Preference for green cosmetic products is the dependent
variable and in analysis, it is denoted as v2. The relevant portion of SPSS output sheet is
presented below to infer whether there is any significant effect of availability of green cosmetic
products on the preference of green cosmetic products.
Table 6.10.7.1 ANOVA for Availability of Green Food Products
v2
Sum of
Squares Df
Mean
Square F Sig.
Between
Groups
25.861 6 4.310 1.672 .027
Within Groups 1013.179 393 2.578
Total 1039.040 399
Source: SPSS Output
6.10.7.1 Hypothesis on Availability of the product
H: Availability of the cosmetic products will not significantly influence consumers’ preference
for Green Cosmetic products.
The exact significant level (p value) of ANOVA is exhibited in 6th
Col. (Sig.) of the above
mentioned table. The level of significance set by us is 5%, i.e., α = 0.05 (on the basis of existing
researches of similar type). The table reveals that ‘p’ value is less than the ‘α’ value. In fact,
since p = 0.027 is less than α = 0.05, the null hypothesis is not accepted and the alternative
hypothesis is accepted. That means, the availability of the products significantly impact the
consumers’ preference towards green cosmetic products.
Page 196
196
6.11 Impact of different independent variables on the preference for Green
Food Products (ANOVA)
6.11.1 Safety
Here safety perspective of the consumers is studied. One-Way ANOVA is done in order to know
whether Safety perspective of the consumer, denoted as v1, has significant impact on the use of
green food products. For the purpose, the respondents have been studied using seven categories;
1 = Very Strongly Disagree(VSD), 2 = Strongly Disagree(SD) , 3 = Disagree(D) , 4 = Neither
Agree Nor Disagree(NAD) , 5 = Agree(A) , 6 = Strongly Agree(SA) , 7 = Very Strongly
Agree(VSA). Preference for green food products is the dependent variable and in analysis, it is
denoted as v2. The relevant portion of SPSS output sheet is presented below to infer whether
there is any significant effect of Safety perspective on the preference of green food products.
Table 6.11.1.1 ANOVA for Safety of Green Food Products
v2
Sum of
Squares Df Mean Square F Sig.
Between
Groups
23.563 6 3.927 1.510 .017
Within Groups 1021.874 393 2.600
Total 1045.438 399
Source: SPSS Output
6.11.1.1 Hypothesis on Safety
H: Safety will not influence consumers’ preference for green food products
The exact significant level (p value) of ANOVA is exhibited in 6th
Col. (Sig.) of the above
mentioned table. The level of significance set by us is 5%, i.e., α = 0.05 (on the basis of existing
researches of similar type). The table reveals that ‘p’ value is more than the ‘α’ value. In fact,
since p = 0.017 is less than α = 0.05, the null hypothesis is not accepted and the alternative
Page 197
197
hypothesis is accepted. That means, the safety perspective of the consumers significantly impact
the consumers’ preference towards green food products.
6.11.2 Nutritional Value
Here nutritional value of the consumers is studied. One-Way ANOVA is done in order to know
whether nutritional value of the consumer, denoted as v1, has significant impact on the use of
green food products. For the purpose, the respondents have been studied using seven categories;
1 = Very Strongly Disagree(VSD), 2 = Strongly Disagree(SD) , 3 = Disagree(D) , 4 = Neither
Agree Nor Disagree(NAD) , 5 = Agree(A) , 6 = Strongly Agree(SA) , 7 = Very Strongly
Agree(VSA). Preference for green food products is the dependent variable and in analysis, it is
denoted as v2. The relevant portion of SPSS output sheet is presented below to infer whether
there is any significant effect of nutritional value on the preference of green food products.
Table 6.11.2.1 ANOVA for Nutritional Value of Green Food Products
v2
Sum of
Squares Df Mean Square F Sig.
Between
Groups
16.314 6 2.719 1.038 .040
Within Groups 1029.123 393 2.619
Total 1045.438 399
Source: SPSS Output
6.11.2.1 Hypothesis on Nutritional Value
H: Nutritional value of the products will not significantly influence consumers’ preference for
green food products
Page 198
198
The exact significant level (p value) of ANOVA is exhibited in 6th
Col. (Sig.) of the above
mentioned table. The level of significance set by us is 5%, i.e., α = 0.05 (on the basis of existing
researches of similar type). The table reveals that ‘p’ value is less than the ‘α’ value. In fact,
since p = 0.040 is less than α = 0.05, the null hypothesis is not accepted and the alternative
hypothesis is accepted. That means, the nutritional value of the products significantly influence
the consumers’ preference towards green food products.
6.11.3 Taste
Here taste of the green food products is studied. One-Way ANOVA is done in order to know
whether taste of the green food products, denoted as v1, has significant impact on the use of
green food products. For the purpose, the respondents have been studied using seven categories;
1 = Very Strongly Disagree(VSD), 2 = Strongly Disagree(SD) , 3 = Disagree(D) , 4 = Neither
Agree Nor Disagree(NAD) , 5 = Agree(A) , 6 = Strongly Agree(SA) , 7 = Very Strongly
Agree(VSA). Preference for green food products is the dependent variable and in analysis, it is
denoted as v2. The relevant portion of SPSS output sheet is presented below to infer whether
there is any significant effect of taste of the green food products on the preference of green food
products.
Table 6.11.3.1 ANOVA for Taste of Green Food Products
v2
Sum of
Squares Df Mean Square F Sig.
Between
Groups
21.483 6 3.580 1.374 .002
Page 199
199
Within Groups 1023.955 393 2.605
Total 1045.438 399
Source: SPSS Output
6.11.3.1 Hypothesis on Taste
H: Taste of the products will not significantly influence consumers’ preference for green food
products
The exact significant level (p value) of ANOVA is exhibited in 6th
Col. (Sig.) of the above
mentioned table. The level of significance set by us is 5%, i.e., α = 0.05 (on the basis of existing
researches of similar type). The table reveals that ‘p’ value is more than the ‘α’ value. In fact,
since p = 0.002 is less than α = 0.05, the null hypothesis is not accepted and the alternative
hypothesis is accepted. That means, the taste of the products significantly influence the
consumers’ preference towards green food products.
6.11.4 Product Knowledge
Here product knowledge of green food products is studied. One-Way ANOVA is done in order
to know whether product knowledge, denoted as v1, has significant impact on the use of green
food products. For the purpose, the respondents have been studied using seven categories; 1 =
Very Strongly Disagree(VSD), 2 = Strongly Disagree(SD) , 3 = Disagree(D) , 4 = Neither
Agree Nor Disagree(NAD) , 5 = Agree(A) , 6 = Strongly Agree(SA) , 7 = Very Strongly
Agree(VSA). Preference for green food products is the dependent variable and in analysis, it is
denoted as v2. The relevant portion of SPSS output sheet is presented below to infer whether
there is any significant effect of product knowledge on the preference of green food products.
Page 200
200
Table 6.11.4.1 ANOVA for Product Knowledge of Green Food Products
v2
Sum of
Squares Df Mean Square F Sig.
Between
Groups
18.569 6 3.095 1.184 .015
Within Groups 1026.868 393 2.613
Total 1045.438 399
Source: SPSS Output
6.11.4.1 Hypothesis on Product Knowledge
H: Product knowledge will not significantly influence consumers’ preference for green food
products
The exact significant level (p value) of ANOVA is exhibited in 6th
Col. (Sig.) of table 4.2. The
level of significance set by us is 5%, i.e., α = 0.05 (on the basis of existing researches of similar
type). The table reveals that ‘p’ value is less than the ‘α’ value. In fact, since p = 0.015 is less
than α = 0.05, the null hypothesis is not accepted and the alternative hypothesis is accepted. That
means the product knowledge significantly impact the consumers’ preference towards green food
products.
6.11.5 Information about Green Food products
Here information about green food products is studied. One-Way ANOVA is done in order to
know whether information about green food products, denoted as v1, has significant impact on
the use of green food products. For the purpose, the respondents have been studied using seven
categories; 1 = Very Strongly Disagree(VSD), 2 = Strongly Disagree(SD) , 3 = Disagree(D) , 4
Page 201
201
= Neither Agree Nor Disagree(NAD) , 5 = Agree(A) , 6 = Strongly Agree(SA) , 7 = Very
Strongly Agree(VSA). Preference for green food products is the dependent variable and in
analysis, it is denoted as v2. The relevant portion of SPSS output sheet is presented below to
infer whether there is any significant effect of information about green food products on the
preference of green food products.
Table 6.11.5.1: ANOVA for Information about Green Food products
v2
Sum of
Squares Df Mean Square F Sig.
Between
Groups
5.577 6 .930 .351 .041
Within Groups 1039.860 393 2.646
Total 1045.438 399
Source: SPSS Output
6.11.5.1 Hypothesis on Information about the product
H: Information about the product will not significantly influence consumers’ preference for
green food products
The exact significant level (p value) of ANOVA is exhibited in 6th
Col. (Sig.) of the above
mentioned table. The level of significance set by us is 5%, i.e., α = 0.05 (on the basis of existing
researches of similar type). The table reveals that ‘p’ value is less than the ‘α’ value. In fact,
since p = 0.041 is less than α = 0.05, the null hypothesis is not accepted and the alternative
hypothesis is accepted. That means, the information about the products significantly impact the
consumers’ preference towards green food products.
Page 202
202
6.11.6 Brands
Here impact of brand on preference for green food products is studied. One-Way ANOVA is
done in order to know whether brand, denoted as v1, has significant impact on the use of green
food products. For the purpose, the respondents have been studied using seven categories; 1 =
Very Strongly Disagree(VSD), 2 = Strongly Disagree(SD) , 3 = Disagree(D) , 4 = Neither Agree
Nor Disagree(NAD) , 5 = Agree(A) , 6 = Strongly Agree(SA) , 7 = Very Strongly Agree(VSA).
Preference for green food products is the dependent variable and in analysis, it is denoted as v2.
The relevant portion of SPSS output sheet is presented below to infer whether there is any
significant effect of brand on the preference of green food products.
Table 6.11.6.1: ANOVA for Brand of Green Food Products
v2
Sum of
Squares Df Mean Square F Sig.
Between
Groups
36.634 6 6.106 2.379 .029
Within Groups 1008.804 393 2.567
Total 1045.438 399
Source: SPSS Output
6.11.6.1 Hypothesis on Brand
H: Brand will not significantly influence consumers’ preference for green food products
The exact significant level (p value) of ANOVA is exhibited in 6th
Col. (Sig.) of the above
mentioned table. The level of significance set by us is 5%, i.e., α = 0.05 (on the basis of existing
researches of similar type). The table reveals that ‘p’ value is less than the ‘α’ value. In fact,
Page 203
203
since p = 0.029 is less than α = 0.05, the null hypothesis is not accepted and the alternative
hypothesis is accepted. That means, the branded green food products significantly impact the
consumers’ preference towards green food products.
6.11.7 Looks of the Green Food Products
Here looks of the green food products impact on preference for green food products is studied.
One-Way ANOVA is done in order to know whether looks of the green food products, denoted
as v1, has significant impact on the use of green food products. For the purpose, the respondents
have been studied using seven categories; 1 = Very Strongly Disagree(VSD), 2 = Strongly
Disagree(SD) , 3 = Disagree(D) , 4 = Neither Agree Nor Disagree(NAD) , 5 = Agree(A) , 6 =
Strongly Agree(SA) , 7 = Very Strongly Agree(VSA). Preference for green food products is the
dependent variable and in analysis, it is denoted as v2. The relevant portion of SPSS output sheet
is presented below to infer whether there is any significant effect of looks of the green food
products on the preference of green food products
Table 6.11.7.1 ANOVA for Looks of the Green Food Products
v2
Sum of
Squares Df Mean Square F Sig.
Between
Groups
5.828 6 .971 .367 .009
Within Groups 1039.609 393 2.645
Total 1045.438 399
Source: SPSS Output
Page 204
204
6.11.7.1 Hypothesis on Looks
H: Looks of the green food products will not significantly influence consumers’ preference for
them
The exact significant level (p value) of ANOVA is exhibited in 6th
Col. (Sig.) of the above
mentioned table. The level of significance set by us is 5%, i.e., α = 0.05 (on the basis of existing
researches of similar type). The table reveals that ‘p’ value is less than the ‘α’ value. In fact,
since p = 0.009 is less than α = 0.05, the null hypothesis is not accepted and the alternative
hypothesis is accepted. That means, looks of the green food products significantly impact the
consumers’ preference towards green food products.
6.11.8 Availability
Here availability of green food products is studied. One-Way ANOVA is done in order to know
whether availability of green food products, denoted as v1, has significant impact on the use of
green food products. For the purpose, the respondents have been studied using seven categories;
1 = Very Strongly Disagree(VSD), 2 = Strongly Disagree(SD) , 3 = Disagree(D) , 4 = Neither
Agree Nor Disagree(NAD) , 5 = Agree(A) , 6 = Strongly Agree(SA) , 7 = Very Strongly
Agree(VSA). Preference for green food products is the dependent variable and in analysis, it is
denoted as v2. The relevant portion of SPSS output sheet is presented below to infer whether
there is any significant effect of availability of green food products on the preference of green
food products.
Page 205
205
Table 6.11.8.1: ANOVA for Availability of Green Food Products
v2
Sum of
Squares Df Mean Square F Sig.
Between
Groups
4.228 6 .705 .266 .012
Within Groups 1041.210 393 2.649
Total 1045.438 399
Source: SPSS Output
6.11.8.1 Hypothesis on Availability of the Product:
H: Availability of the food products will not significantly influence consumers’ preference for
green food products
The exact significant level (p value) of ANOVA is exhibited in 6th
Col. (Sig.) of the table
6.11.8.1. The level of significance set by us is 5%, i.e., α = 0.05 (on the basis of existing
researches of similar type). The table reveals that ‘p’ value is less than the ‘α’ value. In fact,
since p = 0.012 is less than α = 0.05, the null hypothesis is not accepted and the alternative
hypothesis is accepted. That means, the availability of the food products significantly impact the
consumers’ preference towards green food products.
Page 206
206
6.12 Comparison of the Findings between Green Cosmetic and Food
Products
Table 6.12.1: Comparison of Findings between Green Cosmetic and Food Products
Sl.
No.
Hypothesis Findings for Green
Cosmetic products
Findings for Green
Food products
1 Environmental consciousness will not influence
consumers’ preference for Green products.
Hypothesis not
accepted
Hypothesis not accepted
2 Price Sensitivity of the consumers will not
influence preference for Green products.
Hypothesis not
accepted
Hypothesis not accepted
3 Innovativeness in buying products will not
influence preference for Green products
Hypothesis not
accepted
Hypothesis not accepted
4 Product involvement will not influence
preference for Green products
Hypothesis accepted Hypothesis accepted
5 Health consciousness will not influence
preference for Green products
Hypothesis not
accepted
Hypothesis not accepted
6 Safety perspective will not influence their
preference for Green products
Hypothesis not
accepted
Hypothesis not accepted
7 Quality of the product will not influence
preference for it
Hypothesis not
accepted
N/A
8 Product Effectivity will not influence preference
for green products
Hypothesis accepted N/A
9 Product Knowledge will not influence preference
for Green products
Hypothesis not
accepted
Hypothesis not accepted
10 Information about the product will not influence
consumers’ preference for Green products
Hypothesis not
accepted
Hypothesis not accepted
11 Brand of the Green product will influence
preference for it
Hypothesis not
accepted
Hypothesis not accepted
12 Availability of the product will not influence
preference for Green products
Hypothesis not
accepted
Hypothesis not accepted
13 Age-Group will not influence preference for
Green Products
Hypothesis accepted Hypothesis accepted
14 Income will not influence preference for Green
Products
Hypothesis not
accepted
Hypothesis not accepted
15 Gender will not influence preference for Green
Products
Hypothesis accepted Hypothesis accepted
Page 207
207
16 Education(Last grade of school completed) will
not influence preference for Green Products
Hypothesis accepted Hypothesis accepted
17 Occupation will not influence preference for
Green Products
Hypothesis accepted Hypothesis accepted
18 Number of members in the household will not
influence preference for Green Cosmetic Products
Hypothesis accepted Hypothesis accepted
19 Taste of the Green Food products will not
influence preference for it
N/A Hypothesis not accepted
20 Nutritional value of the Green Food products will
influence consumers’ preference for it
N/A Hypothesis not accepted
21 Looks of the Green Food products will influence
consumers’ preference for it
N/A Hypothesis not accepted
Source: Existing Literature and Primary Data (Survey Findings)
From the table 6.12.1, it is found that the findings of green cosmetic products resemble with that
of green food products. This is because of the fact that the sets of respondents surveyed are same
for both the products and moreover, people motivated for green products value the importance of
green products more over the conventional products irrespective of product categories.
For Green Cosmetic Products, two additional attributes, Product effectivity and Quality, are
studied based on the existing literatures, which are not relevant for Green Food products. For this
two product type, product effectivity does not influence and product quality does influence
preference for Green cosmetic products.
Likewise, for Green Food Products, three additional attributes, Taste, Looks and Nutritional
Value, are studied on the basis of existing literature, which are not relevant for Green Cosmetic
Products. Here also, taste, Looks and nutritional value of the green food products influence
preference for it.
Page 208
208
6.13 Impact of Psychographic Variables on Preference for Green Cosmetic
Products (ANOVA) for the Non-Users of Green Cosmetic Products
This section explains the perceptional impact of different psychographic and independent
variables on the preference for green cosmetic and food products with respect to the non-users of
the products. Although the respondents considered for this section are non-users of green
cosmetic products, they are aware of and have knowledge about green cosmetic and food
products. This section reveals the responses captured on the basis “Had the respondents been the
users of green cosmetic products, what would have been their responses” and in line with the
questionnaire administered on the users of green cosmetic products. By doing so, it helps
substantiating the findings from the users.
6.13.1 Environmental Consciousness
The first psychographic variable which is studied is the Environmental Consciousness. One-
Way ANOVA is done in order to know the perception whether Environmental Consciousness
has significant impact on the preference for Green Cosmetic products.
The five predictor variables related to Environmental Consciousness identified and on which the
data has been collected are;
V1: Users of Green Cosmetic Products support different measures to improve water management
leading to water conservation
V2: Users of Green Cosmetic Products is aware about the issues and problems related to the
environment
V3: Users of Green Cosmetic Products would be willing to pay higher prices for water
V4: It is very difficult for the Users of Green Cosmetic Products to do anything about the
environment
Page 209
209
V5: User of Green Cosmetic Products believes that using recyclable materials for daily use will
improve the environment
Preference for green cosmetic products is the dependent variable and in analysis, it is denoted as
V6. For the purpose, the responses were collected using seven categories; 1 = Very Strongly
Disagree(VSD), 2 = Strongly Disagree(SD) , 3 = Disagree(D) , 4 = Neither Agree Nor
Disagree(NAD) , 5 = Agree(A) , 6 = Strongly Agree(SA) , 7 = Very Strongly Agree(VSA).
The relevant portion of SPSS output sheet is presented below to infer whether there is any
significant effect of Environmental Consciousness on the preference of Green Cosmetic
products.
Table 6.13.1.1 ANOVA output for Environmental Consciousness in buying products
ANOVAb
Model Sum of Squares df Mean Square F Sig.
1 Regression 17.926 5 3.585 1.272 .043a
Residual 546.954 194 2.819
Total 564.880 199
a. Predictors: (Constant), v5, v2, v1, v4, v3
b. Dependent Variable: v6
Source: SPSS Output
6.13.1.1 Hypothesis on Environmental Consciousness
H: Environmental Consciousness will not influence preference for green cosmetic products.
The exact significant level (p value) of ANOVA is exhibited in 6th
Col. (Sig.) of table 6.13.1.1.
The level of significance set by us is 5%, i.e., α = 0.05 (on the basis of existing researches of
similar type). The table reveals that ‘p’ value is less than the ‘α’ value. In fact, since p = 0.043
is less than α = 0.05, the null hypothesis is not accepted and the alternative hypothesis is
accepted. That means, Environmental Consciousness significantly impact the preference
towards Green Cosmetic products.
Page 210
210
6.13.2 Price Sensitivity
The second psychographic variable which is studied is the Price Sensitivity. One-Way ANOVA
is done in order to know whether Price Sensitivity has significant impact on the preference for
green cosmetic products. The six predictor variables identified and on which the data has been
collected are;
V1: The price of buying Green Cosmetic Products is important to users of Green Cosmetic
Products
V2: Users of Green Cosmetic Products know that a new kind of green cosmetic product is likely
to be more expensive than older ones, but that does not matter to them
V3: Users of Green Cosmetic Products are less willing to buy a green product if they think that it
will be high in price
V4: Users of Green Cosmetic Products don’t mind paying more to try out a new green cosmetic
product
V5: Users of Green Cosmetic Products think that really good Green Cosmetic product is worth
paying a lot of money
V6: Users of Green Cosmetic Products don’t mind spending a lot of money to buy a Green
Cosmetic product
Preference for green cosmetic products is the dependent variable and in analysis, it is denoted as
V7. For the purpose, the responses were collected using seven categories; 1 = Very Strongly
Disagree(VSD), 2 = Strongly Disagree(SD) , 3 = Disagree(D) , 4 = Neither Agree Nor
Disagree(NAD) , 5 = Agree(A) , 6 = Strongly Agree(SA) , 7 = Very Strongly Agree(VSA). The
relevant portion of SPSS output sheet is presented below to infer whether there is any significant
effect of Price Sensitivity on the preference of Green Cosmetic products.
Page 211
211
Table 6.13.2.1 ANOVA output for Price Sensitivity in buying green cosmetic products
ANOVAb
Model Sum of Squares Df Mean Square F Sig.
1 Regression 5.047 6 .841 .290 .039a
Residual 559.833 193 2.901
Total 564.880 199
a. Predictors: (Constant), v6, v3, v2, v5, v1, v4
b. Dependent Variable: v7
Source: SPSS Output
6.13.2.1. Hypothesis on Price Sensitivity:
H: Price Sensitivity will not influence preference for green cosmetic products.
The exact significant level (p value) of ANOVA is exhibited in 6th
Col. (Sig.) of the table
6.13.2.1. The level of significance set by us is 5%, i.e., α = 0.05 (on the basis of existing
researches of similar type). The table reveals that ‘p’ value is less than the ‘α’ value. In fact,
since p =0.039 is less than α = 0.05, the null hypothesis is not and the alternative hypothesis is
accepted. That means, Price Sensitivity significantly impact the preference towards green
cosmetic products.
6.13.3 Innovativeness in buying products
The third psychographic variable which is studied is Innovativeness in buying products. One-
Way ANOVA is done in order to know whether Innovativeness in buying products has
significant impact on the preference for green cosmetic products.
The four predictor variables related to Innovativeness in buying Green Cosmetic Products
identified and on which the data has been collected are;
V1: Users of Green Cosmetic Products like to take a chance in buying new products
Page 212
212
V2: Users of Green Cosmetic Products like to try new and different products
V3: Users of Green Cosmetic Products is the first in his circle of friends to buy a new product
when it appears in the market
V4: Users of Green Cosmetic Products is the first in his circle of friends to experiment with the
brands of latest products
Preference for green cosmetic products is the dependent variable and in analysis, it is denoted as
V7. For the purpose, the responses were collected using seven categories; 1 = Very Strongly
Disagree(VSD), 2 = Strongly Disagree(SD) , 3 = Disagree(D) , 4 = Neither Agree Nor
Disagree(NAD) , 5 = Agree(A) , 6 = Strongly Agree(SA) , 7 = Very Strongly Agree(VSA). The
relevant portion of SPSS output sheet is presented below to infer whether there is any significant
effect of Innovativeness in buying products on the preference of Green Cosmetic products.
Table 6.13.3.1 ANOVA output for Innovativeness in buying products
ANOVAb
Model Sum of Squares Df Mean Square F Sig.
1 Regression 15.347 4 3.837 1.361 .079a
Residual 549.533 195 2.818
Total 564.880 199
a. Predictors: (Constant), v4, v3, v2, v1
b. Dependent Variable: v7
Source: SPSS Output
6.13.3.1 Hypothesis on Innovativeness in buying products
H: Innovativeness in buying products will not influence preference for green cosmetic products
The exact significant level (p value) of ANOVA is exhibited in 6th
Col. (Sig.) of the table
6.13.3.1. The level of significance set by us is 5%, i.e., α = 0.05 (on the basis of existing
researches of similar type). The table reveals that ‘p’ value is more than the ‘α’ value. In fact,
since p = 0.079 is more than α = 0.05, the null hypothesis is accepted and established. That
Page 213
213
means, Innovativeness in buying products does not significantly impact the preference towards
green cosmetic products.
6.13.4 Product Involvement
The fourth psychographic variable which is studied is Product Involvement. One-Way ANOVA
is done in order to know whether Product Involvement has significant impact on the preference
for green cosmetic products.
The five predictor variables related to Product Involvement in Buying Green Cosmetic Products
are identified and on which the data has been collected are;
V1: Users of Green Cosmetic Products select the green products very carefully
V2: Using branded green products help Users of Green Cosmetic Products express their
personality
V3: One can tell a lot about a person from whether they buy Green Cosmetic Products
V4: Users of Green Cosmetic Products believe different brands of green products would give
different amounts of satisfaction
Preference for green cosmetic products is the dependent variable and in analysis, it is denoted as
V7.
For the purpose, the respondents studied have been segregated into seven categories; 1 = Very
Strongly Disagree(VSD), 2 = Strongly Disagree(SD) , 3 = Disagree(D) , 4 = Neither Agree Nor
Disagree(NAD) , 5 = Agree(A) , 6 = Strongly Agree(SA) , 7 = Very Strongly Agree(VSA). The
relevant portion of SPSS output sheet is presented below to infer whether there is any
significant effect of Product Involvement on the preference of green cosmetic products.
Page 214
214
Table 6.13.4.1 ANOVA output for Product Involvement in buying products
ANOVAb
Model Sum of Squares Df Mean Square F Sig.
1 Regression 2.828 4 .707 .245 .091a
Residual 562.052 195 2.882
Total 564.880 199
a. Predictors: (Constant), v4, v3, v1, v2
b. Dependent Variable: v7
Source: SPSS Output
6.13.4.1 Hypothesis on Product Involvement
H: Product involvement will not influence preference for green cosmetic products.
The exact significant level (p value) of ANOVA is exhibited in 6th
Col. (Sig.) of the table
6.13.4.1. The level of significance set by us is 5%, i.e., α = 0.05 (on the basis of existing
researches of similar type). The table reveals that ‘p’ value is more than the ‘α’ value. In fact,
since p = 0.091 is greater than α = 0.05, the null hypothesis is accepted and established. That
means - Product involvement will not significantly impact the preference towards green cosmetic
products.
6.13.5 Health Consciousness
The fifth psychographic variable which is studied is Health Consciousness. One-Way ANOVA
is done in order to know whether Health Consciousness has significant impact on the preference
for green cosmetic products.
The eight predictor variables related to Health Consciousness in buying Green Cosmetic
Products are identified and on which the data has been collected are;
V1: Users of Green Cosmetic Products worry that there are chemicals in their food products
V2: Users of Green Cosmetic Products worry that there are chemicals in their cosmetic products
V3: Users of Green Cosmetic Products are concerned about their drinking water quality
Page 215
215
V4: Users of Green Cosmetic Products avoid food containing preservatives
V5: Users of Green Cosmetic Products read more health-related articles than I did 3 years ago
V6: Users of Green Cosmetic Products are interested in information about their health
V7: Users of Green Cosmetic Products are concerned about their health all the time
V8: Pollution in Cosmetic products does not bother users of Green Cosmetic Products
Preference for green cosmetic products is the dependent variable and in analysis, it is denoted as
V9.For the purpose, the respondents studied have been segregated into seven categories; 1 =
Very Strongly Disagree(VSD), 2 = Strongly Disagree(SD) , 3 = Disagree(D) , 4 = Neither Agree
Nor Disagree(NAD) , 5 = Agree(A) , 6 = Strongly Agree(SA) , 7 = Very Strongly Agree(VSA).
The relevant portion of SPSS output sheet is presented below to infer whether there is any
significant effect of Health Consciousness on the preference of green cosmetic products.
Table 6.13.5.1 ANOVA output for Health Consciousness in buying products
ANOVAb
Model Sum of Squares Df Mean Square F Sig.
1 Regression 29.155 8 3.644 1.299 .036a
Residual 535.725 191 2.805
Total 564.880 199
a. Predictors: (Constant), v8, v1, v5, v6, v7, v4, v3, v2
b. Dependent Variable: v9
Source: SPSS Output
6.13.5.1 Hypothesis on Health Consciousness
H: Health consciousness will not influence preference for green cosmetic products.
The exact significant level (p value) of ANOVA is exhibited in 6th
Col. (Sig.) of the table
6.13.5.1. The level of significance set by us is 5%, i.e., α = 0.05 (on the basis of existing
researches of similar type). The table reveals that ‘p’ value is less than the ‘α’ value. In fact,
since p = 0.036 is less than α = 0.05, the null hypothesis is not accepted and the alternative
Page 216
216
hypothesis is accepted. That means, Health Consciousness will significantly impact the
preference towards green cosmetic products.
6.14 Impact of Psychographic variables on Preference for Green Food
Products (ANOVA) for the Non-Users of Green Food Products
6.14.1 Environmental Consciousness
The first psychographic variable which is studied is the Environmental Consciousness. One-
Way ANOVA is done in order to know whether Environmental Consciousness has significant
impact on the preference for Green Food products.
The five predictor variables related to Environmental Consciousness identified and on which the
data has been collected are;
V1: Users of Green Food Products supports different measures to improve water management
leading to water conservation
V2: Users of Green Food Products is aware about the issues and problems related to the
environment
V3: Users of Green Food Products would be willing to pay higher prices for water
V4: It is very difficult for the Users of Green Food Products to do anything about the
environment
V5: Users of Green Food Products believes that using recyclable materials for daily use will
improve the environment
Preference for green food products is the dependent variable and in analysis, it is denoted as V6.
For the purpose, the responses were collected using seven categories; 1 = Very Strongly
Disagree(VSD), 2 = Strongly Disagree(SD) , 3 = Disagree(D) , 4 = Neither Agree Nor
Disagree(NAD) , 5 = Agree(A) , 6 = Strongly Agree(SA) , 7 = Very Strongly Agree(VSA).
Page 217
217
The relevant portion of SPSS output sheet is presented below to infer whether there is any
significant effect of Environmental Consciousness on the preference of Green Food products.
Table 6.14.1.1 ANOVA output for Environmental Consciousness
ANOVAb
Model Sum of Squares Df Mean Square F Sig.
1 Regression 2.585 5 .517 .182 .012a
Residual 551.410 194 2.842
Total 553.995 199
a. Predictors: (Constant), v5, v2, v1, v4, v3
b. Dependent Variable: v6
Source: SPSS Output
6.14.1.1 Hypothesis on Environmental Consciousness
H: Environmental consciousness will not influence preference for green food products.
The exact significant level (p value) of ANOVA is exhibited in 6th
Col. (Sig.) of the table
6.14.1.1. The level of significance set by us is 5%, i.e., α = 0.05 (on the basis of existing
researches of similar type). The table reveals that ‘p’ value is less than the ‘α’ value. In fact,
since p = 0.012 is less than α = 0.05, the null hypothesis is not accepted and the alternative
hypothesis is accepted. That means Environmental consciousness significantly impact the
preference towards green food products.
6.14.2 Price Sensitivity
The second psychographic variable which is studied is the Price Sensitivity. One-Way ANOVA
is done in order to know whether Price Sensitivity has significant impact on the preference for
green food products. The six predictor variables identified and on which the data has been
collected are;
V1: The price of buying Green Food Products is important to users of Green Food Products
Page 218
218
V2: Users of Green Food Products know that a new kind of green food product is likely to be
more expensive than older ones, but that does not matter to them
V3: Users of Green Food Products are less willing to buy a green product if they think that it will
be high in price
V4: Users of Green Food Products don’t mind paying more to try out a new green food products
V5: Users of Green Food Products think that really good Green Food product is worth paying a
lot of money
V6: Users of Green Food Products don’t mind spending a lot of money to buy a Green Food
product
Preference for green food products is the dependent variable and in analysis, it is denoted as V7.
For the purpose, the responses were collected using seven categories; 1 = Very Strongly
Disagree(VSD), 2 = Strongly Disagree(SD) , 3 = Disagree(D) , 4 = Neither Agree Nor
Disagree(NAD) , 5 = Agree(A) , 6 = Strongly Agree(SA) , 7 = Very Strongly Agree(VSA). The
relevant portion of SPSS output sheet is presented below to infer whether there is any significant
effect of Price Sensitivity on the preference of Green Food products.
Table 6.14.2.1 ANOVA output for Price Sensitivity
ANOVAb
Model Sum of Squares Df Mean Square F Sig.
1 Regression 13.284 6 2.214 .790 .028a
Residual 540.711 193 2.802
Total 553.995 199
a. Predictors: (Constant), v6, v3, v2, v5, v1, v4
b. Dependent Variable: v7
Source: SPSS Output
Page 219
219
6.14.2.1 Hypothesis on Price Sensitivity
H: Price Sensitivity will not influence preference for green food products.
The exact significant level (p value) of ANOVA is exhibited in 6th
Col. (Sig.) of the table
6.14.2.1. The level of significance set by us is 5%, i.e., α = 0.05 (on the basis of existing
researches of similar type). The table reveals that ‘p’ value is less than the ‘α’ value. In fact,
since p =0.028 is less than α = 0.05, the null hypothesis is not accepted and the alternative
hypothesis is accepted. That means, Price Sensitivity significantly impact the preference towards
green food products.
6.14.3 Innovativeness in buying products
The third psychographic variable which is studied is Innovativeness in buying products. One-
Way ANOVA is done in order to know whether Innovativeness in buying products has
significant impact on the preference for green food products.
The four predictor variables related to Innovativeness in buying Green Food Products identified
and on which the data has been collected are;
V1: Users of Green Food Products like to take a chance in buying new products
V2: Users of Green Food Products like to try new and different products
V3: Users of Green Food Products is the first in his circle of friends to buy a new product when
it appears in the market
V4: Users of Green Food Products is the first in his circle of friends to experiment with the
brands of latest products
Preference for green food products is the dependent variable and in analysis, it is denoted as V7.
For the purpose, the responses were collected using seven categories; 1 = Very Strongly
Disagree(VSD), 2 = Strongly Disagree(SD) , 3 = Disagree(D) , 4 = Neither Agree Nor
Page 220
220
Disagree(NAD) , 5 = Agree(A) , 6 = Strongly Agree(SA) , 7 = Very Strongly Agree(VSA). The
relevant portion of SPSS output sheet is presented below to infer whether there is any significant
effect of Innovativeness in buying products on the preference of Green Food products.
Table 6.14.3.1 ANOVA output for Innovativeness in buying products
ANOVAb
Model Sum of Squares Df Mean Square F Sig.
1 Regression 15.198 4 3.799 1.375 .064a
Residual 538.797 195 2.763
Total 553.995 199
a. Predictors: (Constant), v4, v3, v2, v1
b. Dependent Variable: v7
Source: SPSS Output
6.14.3.1 Hypothesis on Innovativeness in buying products
H: Innovativeness in buying products will not influence preference for green food products
The exact significant level (p value) of ANOVA is exhibited in 6th
Col. (Sig.) of the table
6.14.3.1. The level of significance set by us is 5%, i.e., α = 0.05 (on the basis of existing
researches of similar type). The table reveals that ‘p’ value is greater than the ‘α’ value. In fact,
since p = 0.064 is more than α = 0.05, the null hypothesis is accepted and established. That
means, Innovativeness in buying products will not significantly impact the preference towards
green food products.
6.14.4 Product Involvement
The fourth psychographic variable which is studied is Product Involvement. One-Way ANOVA
is done in order to know whether Product Involvement has significant impact on the preference
for green food products.
The five predictor variables related to Product Involvement in Buying Green Food Products are
identified and on which the data has been collected are;
Page 221
221
V1: Users of Green Food Products select the green products very carefully
V2: Using branded green products help Users of Green Food Products express their personality
V3: One can tell a lot about a person from whether they buy Green Food Products
V4: Users of Green Food Products believe different brands of green products would give
different amounts of satisfaction
Preference for green food products is the dependent variable and in analysis, it is denoted as V7.
For the purpose, the respondents studied have been segregated into seven categories; 1 = Very
Strongly Disagree(VSD), 2 = Strongly Disagree(SD) , 3 = Disagree(D) , 4 = Neither Agree Nor
Disagree(NAD) , 5 = Agree(A) , 6 = Strongly Agree(SA) , 7 = Very Strongly Agree(VSA). The
relevant portion of SPSS output sheet is presented below to infer whether there is any
significant effect of Product Involvement on the preference of green food products.
Table 6.14.4.1 ANOVA output for Product Involvement
ANOVAb
Model Sum of Squares Df Mean Square F Sig.
1 Regression 10.588 4 2.647 .950 .436a
Residual 543.407 195 2.787
Total 553.995 199
a. Predictors: (Constant), v4, v3, v1, v2
b. Dependent Variable: v7
Source: SPSS Output
6.14.4.1 Hypothesis on Product involvement
H: Product involvement will not influence preference for green food products.
The exact significant level (p value) of ANOVA is exhibited in 6th
Col. (Sig.) of the table
6.14.4.1. The level of significance set by us is 5%, i.e., α = 0.05 (on the basis of existing
researches of similar type). The table reveals that ‘p’ value is less than the ‘α’ value. In fact,
since p = 0.436 is greater than α = 0.05, the null hypothesis is accepted and established. That
Page 222
222
means, Innovativeness in buying products will not significantly impact the preference towards
green food products.
6.14.5 Health Consciousness
The fifth psychographic variable which is studied is Health Consciousness. One-Way ANOVA
is done in order to know whether Health Consciousness has significant impact on the preference
for green food products.
The eight predictor variables related to Health Consciousness in buying Green Food Products are
identified and on which the data has been collected are;
V1: Users of Green Food Products worry that there are chemicals in their food products
V2: Users of Green Food Products worry that there are chemicals in their food products
V3: Users of Green Food Products are concerned about their drinking water quality
V4: Users of Green Food Products avoid food containing preservatives
V5: Users of Green Food Products read more health-related articles than I did 3 years ago
V6: Users of Green Food Products are interested in information about their health
V7: Users of Green Food Products are concerned about their health all the time
V8: Pollution in Food products does not bother users of Green Food Products
Preference for green food products is the dependent variable and in analysis, it is denoted as
V9.For the purpose, the respondents studied have been segregated into seven categories; 1 =
Very Strongly Disagree(VSD), 2 = Strongly Disagree(SD) , 3 = Disagree(D) , 4 = Neither Agree
Nor Disagree(NAD) , 5 = Agree(A) , 6 = Strongly Agree(SA) , 7 = Very Strongly Agree(VSA).
The relevant portion of SPSS output sheet is presented below to infer whether there is any
significant effect of Health Consciousness on the preference of green food products.
Page 223
223
Table 6.14.5.1 ANOVA output for Health Consciousness
ANOVAb
Model Sum of Squares Df Mean Square F Sig.
1 Regression 23.625 8 2.953 1.063 .039a
Residual 530.370 191 2.777
Total 553.995 199
a. Predictors: (Constant), v8, v1, v5, v6, v7, v4, v3, v2
b. Dependent Variable: v9
Source: SPSS Output
6.14.5.1 Hypothesis on Health Consciousness
H: Health Consciousness will not influence preference for green food products.
The exact significant level (p value) of ANOVA is exhibited in 6th
Col. (Sig.) of the table
6.14.5.1. The level of significance set by us is 5%, i.e., α = 0.05 (on the basis of existing
researches of similar type). The table reveals that ‘p’ value is less than the ‘α’ value. In fact,
since p = 0.039 is less than α = 0.05, the null hypothesis is not accepted and the alternative
hypothesis is accepted. That means, Health Consciousness will significantly impact the
preference towards green food products.
6.15 Impact of different independent variables on the preference for Green
Cosmetic Products (ANOVA) for the Non-Users of Green Cosmetic Products
6.15.1 Safety
Here safety perspective is studied. One-Way ANOVA is done in order to know whether Safety
perspective, denoted as v1, has significant impact on the preference for green cosmetic products.
For the purpose, the respondents have been studied using seven categories; 1 = Very Strongly
Disagree(VSD), 2 = Strongly Disagree(SD) , 3 = Disagree(D) , 4 = Neither Agree Nor
Disagree(NAD) , 5 = Agree(A) , 6 = Strongly Agree(SA) , 7 = Very Strongly Agree(VSA).
Preference for green cosmetic products is the dependent variable and in analysis, it is denoted as
Page 224
224
v2. The relevant portion of SPSS output sheet is presented below to infer whether there is any
significant effect of Safety perspective on the preference of green cosmetic products.
Table 6.15.1.1 ANOVA output for Safety
ANOVA
v2
Sum of Squares Df Mean Square F Sig.
Between Groups 21.306 6 3.551 1.261 .027
Within Groups 543.574 193 2.816
Total 564.880 199
Source: SPSS Output
6.15.1.1 Hypothesis on Safety
H: Safety will not influence consumers’ preference for green cosmetic products
The exact significant level (p value) of ANOVA is exhibited in 6th
Col. (Sig.) of the table
6.15.1.1. The level of significance set by us is 5%, i.e., α = 0.05 (on the basis of existing
researches of similar type). The table reveals that ‘p’ value is less than the ‘α’ value. In fact,
since p = 0.027 is less than α = 0.05, the null hypothesis is not accepted and the alternative
hypothesis is accepted. That means, the safety perspective will significantly impact the
consumers’ preference towards green cosmetic products.
6.15.2 Quality
Here quality perspective is studied. One-Way ANOVA is done in order to know whether
quality perspective, denoted as v1, has significant impact on the preference for green cosmetic
products. For the purpose, the respondents have been studied using seven categories; 1 = Very
Strongly Disagree(VSD), 2 = Strongly Disagree(SD) , 3 = Disagree(D) , 4 = Neither Agree Nor
Disagree(NAD) , 5 = Agree(A) , 6 = Strongly Agree(SA) , 7 = Very Strongly Agree(VSA).
Preference for green cosmetic products is the dependent variable and in analysis, it is denoted
Page 225
225
as v2. The relevant portion of SPSS output sheet is presented below to infer whether there is
any significant effect of quality perspective on the preference of green cosmetic products.
Table 6.15.2.1 ANOVA output for Quality
ANOVA
v2
Sum of Squares df Mean Square F Sig.
Between Groups 23.650 6 3.942 1.406 .021
Within Groups 541.230 193 2.804
Total 564.880 199
Source: SPSS Output
6.15.2.1 Hypothesis on Quality
H: Quality will not influence preference for green cosmetic products
The exact significant level (p value) of ANOVA is exhibited in 6th
Col. (Sig.) of the table
6.15.2.1. The level of significance set by us is 5%, i.e., α = 0.05 (on the basis of existing
researches of similar type). The table reveals that ‘p’ value is more than the ‘α’ value. In fact,
since p = 0.021 is less than α = 0.05, the null hypothesis is not accepted and the alternative
hypothesis is accepted. That means, the quality perspective of the consumers significantly impact
the consumers’ preference towards green cosmetic products.
6.15.3 Product Effectivity
Here product effectivity, which is defined as the utility which is expected from a product, is
studied. One-Way ANOVA is done in order to know whether product effectivity, denoted as
v1, has significant impact on the preference for green cosmetic products. For the purpose, the
respondents have been studied using seven categories; 1 = Very Strongly Disagree(VSD), 2 =
Strongly Disagree(SD) , 3 = Disagree(D) , 4 = Neither Agree Nor Disagree(NAD) , 5 =
Agree(A) , 6 = Strongly Agree(SA) , 7 = Very Strongly Agree(VSA). Preference for green
Page 226
226
cosmetic products is the dependent variable and in analysis, it is denoted as v2. The relevant
portion of SPSS output sheet is presented below to infer whether there is any significant effect
of product effectivity on the preference of green cosmetic products.
Table 6.15.3.1 ANOVA output for Product Effectivity
ANOVA
v2
Sum of Squares df Mean Square F Sig.
Between Groups 9.208 6 1.535 .533 .078
Within Groups 555.672 193 2.879
Total 564.880 199
Source: SPSS Output
6.15.3.1 Hypothesis on Product Effectivity
H: Product effectivity will not significantly influence consumers’ preference for green cosmetic
products
The exact significant level (p value) of ANOVA is exhibited in 6th
Col. (Sig.) of the table
6.15.3.1. The level of significance set by us is 5%, i.e., α = 0.05 (on the basis of existing
researches of similar type). The table reveals that ‘p’ value is more than the ‘α’ value. In fact,
since p = 0.078 is greater than α = 0.05, the null hypothesis is accepted and established. That
means, the product effectivity will not significantly impact the consumers’ preference towards
green cosmetic products.
6.15.4 Brands
Here impact of brand on preference for green cosmetic products is studied. One-Way ANOVA
is done in order to know whether brand, denoted as v1, has significant impact on the preference
for green cosmetic products. For the purpose, the respondents have been studied using seven
categories; 1 = Very Strongly Disagree(VSD), 2 = Strongly Disagree(SD) , 3 = Disagree(D) , 4
Page 227
227
= Neither Agree Nor Disagree(NAD) , 5 = Agree(A) , 6 = Strongly Agree(SA) , 7 = Very
Strongly Agree(VSA). Preference for green cosmetic products is the dependent variable and in
analysis, it is denoted as v2. The relevant portion of SPSS output sheet is presented below to
infer whether there is any significant effect of brand on the preference of green cosmetic
products.
Table 6.15.4.1 ANOVA output for Brand
ANOVA
v2
Sum of Squares df Mean Square F Sig.
Between Groups 12.062 6 2.010 .702 .048
Within Groups 552.818 193 2.864
Total 564.880 199
Source: SPSS Output
6.15.4.1 Hypothesis on Brand
H: Brand will not significantly influence consumers’ preference for green cosmetic products
The exact significant level (p value) of ANOVA is exhibited in 6th
Col. (Sig.) of the table
6.15.4.1. The level of significance set by us is 5%, i.e., α = 0.05 (on the basis of existing
researches of similar type). The table reveals that ‘p’ value is more than the ‘α’ value. In fact,
since p = 0.048 is less than α = 0.05, the null hypothesis is not accepted and the alternative
hypothesis is accepted. That means, the branded green cosmetic products significantly impact the
consumers’ preference towards green cosmetic products.
6.15.5 Product Knowledge
Here product knowledge of green cosmetic products is studied. One-Way ANOVA is done in
order to know whether product knowledge, denoted as v1, has significant impact on the
preference for green cosmetic products. For the purpose, the respondents studied have been
Page 228
228
segregated into seven categories; 1 = Very Strongly Disagree(VSD), 2 = Strongly Disagree(SD)
, 3 = Disagree(D) , 4 = Neither Agree Nor Disagree(NAD) , 5 = Agree(A) , 6 = Strongly
Agree(SA) , 7 = Very Strongly Agree(VSA). These categories are denoted respectively as 0, 1,
2, 3, 4, 5 and 6 for analysis purpose in SPSS. Preference for green cosmetic products is the
dependent variable and in analysis, it is denoted as v2. The relevant portion of SPSS output
sheet is presented below to infer whether there is any significant effect of product knowledge
on the preference of green cosmetic products.
Table 6.15.5.1 ANOVA output for Product Knowledge
ANOVA
v2
Sum of Squares df Mean Square F Sig.
Between Groups 39.143 6 6.524 2.395 .030
Within Groups 525.737 193 2.724
Total 564.880 199
Source: SPSS Output
6.15.5.1 Hypothesis on Product Knowledge
H: Product knowledge will not significantly influence consumers’ preference for green cosmetic
products
The exact significant level (p value) of ANOVA is exhibited in 6th
Col. (Sig.) of the table
6.15.5.1. The level of significance set by us is 5%, i.e., α = 0.05 (on the basis of existing
researches of similar type). The table reveals that ‘p’ value is more than the ‘α’ value. In fact,
since p = 0.030 is less than α = 0.05, the null hypothesis is not accepted and the alternative
hypothesis is accepted. That means the product knowledge significantly impact the consumers’
preference towards green cosmetic products.
Page 229
229
6.15.6 Information about the product
Here information about green cosmetic products is studied. One-Way ANOVA is done in order
to know whether information about green cosmetic products, denoted as v1, has significant
impact on the use of green cosmetic products. For the purpose, the respondents have been
studied using seven categories; 1 = Very Strongly Disagree(VSD), 2 = Strongly Disagree(SD) ,
3 = Disagree(D) , 4 = Neither Agree Nor Disagree(NAD) , 5 = Agree(A) , 6 = Strongly
Agree(SA) , 7 = Very Strongly Agree(VSA). Preference for green cosmetic products is the
dependent variable and in analysis, it is denoted as v2. The relevant portion of SPSS output
sheet is presented below to infer whether there is any significant effect of information about
green cosmetic products on the preference of green cosmetic products.
Table 6.15.6.1 ANOVA output for Product Information
ANOVA
v2
Sum of Squares df Mean Square F Sig.
Between Groups 26.649 6 4.442 1.593 .015
Within Groups 538.231 193 2.789
Total 564.880 199
Source: SPSS Output
6.15.6.1 Hypothesis on Information about the product
H: Information about the product will not significantly influence consumers’ preference for
green cosmetic products
The exact significant level (p value) of ANOVA is exhibited in 6th
Col. (Sig.) of the table
6.15.61. The level of significance set by us is 5%, i.e., α = 0.05 (on the basis of existing
researches of similar type). The table reveals that ‘p’ value is more than the ‘α’ value. In fact,
since p = 0.015 is less than α = 0.05, the null hypothesis is not accepted and the alternative
Page 230
230
hypothesis is accepted. That means, the information about the products significantly impact the
consumers’ preference towards green cosmetic products.
6.15.7 Availability
Here availability of green cosmetic products is studied. One-Way ANOVA is done in order to
know whether availability of green cosmetic products, denoted as v1, has significant impact on
the preference for green cosmetic products. For the purpose, the respondents have been studied
using seven categories; 1 = Very Strongly Disagree(VSD), 2 = Strongly Disagree(SD) , 3 =
Disagree(D) , 4 = Neither Agree Nor Disagree(NAD) , 5 = Agree(A) , 6 = Strongly Agree(SA) ,
7 = Very Strongly Agree(VSA). Preference for green cosmetic products is the dependent
variable and in analysis, it is denoted as v2. The relevant portion of SPSS output sheet is
presented below to infer whether there is any significant effect of availability of green cosmetic
products on the preference of green cosmetic products.
Table 6.15.7.1 ANOVA output for Availability
ANOVA
v2
Sum of Squares Df Mean Square F Sig.
Between Groups 15.847 6 2.641 .928 .047
Within Groups 549.033 193 2.845
Total 564.880 199
Source: SPSS Output
6.15.7.1 Hypothesis on Availability of the product
H: Availability of the cosmetic products will not significantly influence preference for Green
Cosmetic products.
The exact significant level (p value) of ANOVA is exhibited in 6th
Col. (Sig.) of the table
6.15.7.1. The level of significance set by us is 5%, i.e., α = 0.05 (on the basis of existing
Page 231
231
researches of similar type). The table reveals that ‘p’ value is less than the ‘α’ value. In fact,
since p = 0.047 is less than α = 0.05, the null hypothesis is not accepted and the alternative
hypothesis is accepted. That means, the availability of the products significantly impact the
consumers’ preference towards green cosmetic products.
6.16 Impact of different independent variables on the preference for Green
Food Products (ANOVA) for the Non-Users of Green Food Products
6.16.1 Safety
Here safety perspective studied. One-Way ANOVA is done in order to know whether Safety
perspective, denoted as v1, has significant impact on the preference for green food products. For
the purpose, the respondents have been studied using seven categories; 1 = Very Strongly
Disagree(VSD), 2 = Strongly Disagree(SD) , 3 = Disagree(D) , 4 = Neither Agree Nor
Disagree(NAD) , 5 = Agree(A) , 6 = Strongly Agree(SA) , 7 = Very Strongly Agree(VSA).
Preference for green food products is the dependent variable and in analysis, it is denoted as v2.
The relevant portion of SPSS output sheet is presented below to infer whether there is any
significant effect of Safety perspective on the preference of green food products.
Table 6.16.1.1 ANOVA output for Safety
ANOVA
v2
Sum of Squares Df Mean Square F Sig.
Between Groups 11.585 6 1.931 .687 .006
Within Groups 542.410 193 2.810
Total 553.995 199
Source: SPSS Output
Page 232
232
6.16.1.1 Hypothesis on Safety
H: Safety will not influence consumers’ preference for green food products
The exact significant level (p value) of ANOVA is exhibited in 6th
Col. (Sig.) of the table
6.16.1.1. The level of significance set by us is 5%, i.e., α = 0.05 (on the basis of existing
researches of similar type). The table reveals that ‘p’ value is more than the ‘α’ value. In fact,
since p = 0.006 is less than α = 0.05, the null hypothesis is not accepted and the alternative
hypothesis is accepted. That means, the safety perspective of the consumers significantly impact
the consumers’ preference towards green food products.
6.16.2 Nutritional Value
Here nutritional value is studied. One-Way ANOVA is done in order to know whether nutritional
value, denoted as v1, has significant impact on the preference for green food products. For the
purpose, the respondents have been studied using seven categories; 1 = Very Strongly
Disagree(VSD), 2 = Strongly Disagree(SD) , 3 = Disagree(D) , 4 = Neither Agree Nor
Disagree(NAD) , 5 = Agree(A) , 6 = Strongly Agree(SA) , 7 = Very Strongly Agree(VSA).
Preference for green food products is the dependent variable and in analysis, it is denoted as v2.
The relevant portion of SPSS output sheet is presented below to infer whether there is any
significant effect of nutritional value on the preference of green food products.
Table 6.16.2.1 ANOVA output for Nutritional Value
ANOVA
v2
Sum of Squares Df Mean Square F Sig.
Between Groups 6.142 5 1.228 .435 .024
Within Groups 547.853 194 2.824
Total 553.995 199
Source: SPSS Output
Page 233
233
6.16.2.1 Hypothesis on Nutritional Value
H: Nutritional value of the products will not significantly influence consumers’ preference for
green food products
The exact significant level (p value) of ANOVA is exhibited in 6th
Col. (Sig.) of the table
6.16.2.1. The level of significance set by us is 5%, i.e., α = 0.05 (on the basis of existing
researches of similar type). The table reveals that ‘p’ value is less than the ‘α’ value. In fact,
since p = 0.024 is less than α = 0.05, the null hypothesis is not accepted and the alternative
hypothesis is accepted. That means, the nutritional value of the products significantly influence
the consumers’ preference towards green food products.
6.16.3 Taste
Here taste of the green food products is studied. One-Way ANOVA is done in order to know
whether taste of the green food products, denoted as v1, has significant impact on the preference
for green food products. For the purpose, the respondents have been studied using seven
categories; 1 = Very Strongly Disagree(VSD), 2 = Strongly Disagree(SD) , 3 = Disagree(D) , 4 =
Neither Agree Nor Disagree(NAD) , 5 = Agree(A) , 6 = Strongly Agree(SA) , 7 = Very Strongly
Agree(VSA). Preference for green food products is the dependent variable and in analysis, it is
denoted as v2. The relevant portion of SPSS output sheet is presented below to infer whether
there is any significant effect of taste of the green food products on the preference of green food
products.
Table 6.16.3.1 ANOVA output for Taste
ANOVA
v2
Sum of Squares Df Mean Square F Sig.
Between Groups 21.182 6 3.530 1.395 .021
Within Groups 488.573 193 2.531
Page 234
234
ANOVA
v2
Sum of Squares Df Mean Square F Sig.
Between Groups 21.182 6 3.530 1.395 .021
Within Groups 488.573 193 2.531
Total 509.755 199
Source: SPSS Output
6.16.3.1 Hypothesis on Taste
H: Taste of the products will not significantly influence consumers’ preference for green food
products
The exact significant level (p value) of ANOVA is exhibited in 6th
Col. (Sig.) of the table
6.16.3.1. The level of significance set by us is 5%, i.e., α = 0.05 (on the basis of existing
researches of similar type). The table reveals that ‘p’ value is more than the ‘α’ value. In fact,
since p = 0.021 is less than α = 0.05, the null hypothesis is not accepted and the alternative
hypothesis is accepted. That means, the taste of the products significantly influence the
consumers’ preference towards green food products.
6.16.4 Product Knowledge
Here product knowledge of green food products is studied. One-Way ANOVA is done in order
to know whether product knowledge, denoted as v1, has significant impact on the preference
for green food products. For the purpose, the respondents studied have been segregated into
seven categories; 1 = Very Strongly Disagree(VSD), 2 = Strongly Disagree(SD) , 3 =
Disagree(D) , 4 = Neither Agree Nor Disagree(NAD) , 5 = Agree(A) , 6 = Strongly Agree(SA) ,
7 = Very Strongly Agree(VSA). Preference for green food products is the dependent variable
and in analysis, it is denoted as v2. The relevant portion of SPSS output sheet is presented
Page 235
235
below to infer whether there is any significant effect of product knowledge on the preference of
green food products.
Table 6.16.4.1 ANOVA output for Product Knowledge
ANOVA
v2
Sum of Squares Df Mean Square F Sig.
Between Groups 19.350 6 3.225 1.164 .032
Within Groups 534.645 193 2.770
Total 553.995 199
Source: SPSS Output
6.16.4.1 Hypothesis on Product Knowledge
H: Product knowledge will not significantly influence preference for green food products
The exact significant level (p value) of ANOVA is exhibited in 6th
Col. (Sig.) of table 6.16.4.1.
The level of significance set by us is 5%, i.e., α = 0.05 (on the basis of existing researches of
similar type). The table reveals that ‘p’ value is less than the ‘α’ value. In fact, since p = 0.032 is
less than α = 0.05, the null hypothesis is not accepted and the alternative hypothesis is accepted.
That means the product knowledge significantly impact the consumers’ preference towards green
food products.
6.16.5 Information about Green Food products
Here information about green food products is studied. One-Way ANOVA is done in order to
know whether information about green food products, denoted as v1, has significant impact on
the preference for green food products. For the purpose, the respondents have been studied
using seven categories; 1 = Very Strongly Disagree(VSD), 2 = Strongly Disagree(SD) , 3 =
Page 236
236
Disagree(D) , 4 = Neither Agree Nor Disagree(NAD) , 5 = Agree(A) , 6 = Strongly Agree(SA) ,
7 = Very Strongly Agree(VSA). Preference for green food products is the dependent variable
and in analysis, it is denoted as v2. The relevant portion of SPSS output sheet is presented
below to infer whether there is any significant effect of information about green food products
on the preference of green food products.
Table 6.16.5.1 ANOVA output for Information about the product
ANOVA
v2
Sum of Squares df Mean Square F Sig.
Between Groups 6.023 6 1.004 .354 .047
Within Groups 547.972 193 2.839
Total 553.995 199
Source: SPSS Output
6.16.5.1 Hypothesis on Information about the product
H: Information about the product will not significantly influence consumers’ preference for
green food products
The exact significant level (p value) of ANOVA is exhibited in 6th
Col. (Sig.) of the table
6.16.5.1. The level of significance set by us is 5%, i.e., α = 0.05 (on the basis of existing
researches of similar type). The table reveals that ‘p’ value is less than the ‘α’ value. In fact,
since p = 0.047 is less than α = 0.05, the null hypothesis is not accepted and the alternative
hypothesis is accepted. That means, the information about the products significantly impact the
consumers’ preference towards green food products.
6.16.6 Brands
Here impact of brand on preference for green food products is studied. One-Way ANOVA is
done in order to know whether brand, denoted as v1, has significant impact on the preference for
Page 237
237
green food products. For the purpose, the respondents studied have been segregated into seven
categories; 1 = Very Strongly Disagree(VSD), 2 = Strongly Disagree(SD) , 3 = Disagree(D) , 4 =
Neither Agree Nor Disagree(NAD) , 5 = Agree(A) , 6 = Strongly Agree(SA) , 7 = Very Strongly
Agree(VSA). Preference for green food products is the dependent variable and in analysis, it is
denoted as v2. The relevant portion of SPSS output sheet is presented below to infer whether
there is any significant effect of brand on the preference of green food products.
Table 6.16.6.1 ANOVA output for Brand
ANOVA
v2
Sum of Squares df Mean Square F Sig.
Between Groups 11.701 6 1.950 .694 .048
Within Groups 542.294 193 2.810
Total 553.995 199
Source: SPSS Output
6.16.6.1 Hypothesis on Brand
H: Brand will not significantly influence consumers’ preference for green food products
The exact significant level (p value) of ANOVA is exhibited in 6th
Col. (Sig.) of the table
6.16.6.1. The level of significance set by us is 5%, i.e., α = 0.05 (on the basis of existing
researches of similar type). The table reveals that ‘p’ value is less than the ‘α’ value. In fact,
since p = 0.048 is less than α = 0.05, the null hypothesis is not accepted and the alternative
hypothesis is accepted. That means, the branded green food products significantly impact the
consumers’ preference towards green food products.
6.16.7 Looks of the Green Food Products
Here looks of the green food products impact on preference for green food products is studied.
One-Way ANOVA is done in order to know whether looks of the green food products, denoted
Page 238
238
as v1, has significant impact on the preference for green food products. For the purpose, the
respondents studied have been segregated into seven categories; 1 = Very Strongly
Disagree(VSD), 2 = Strongly Disagree(SD) , 3 = Disagree(D) , 4 = Neither Agree Nor
Disagree(NAD) , 5 = Agree(A) , 6 = Strongly Agree(SA) , 7 = Very Strongly Agree(VSA).
Preference for green food products is the dependent variable and in analysis, it is denoted as v2.
The relevant portion of SPSS output sheet is presented below to infer whether there is any
significant effect of looks of the green food products on the preference of green food products
Table 6.16.7.1 ANOVA output for Looks of the Green food products
ANOVA
v2
Sum of Squares Df Mean Square F Sig.
Between Groups 9.689 6 1.615 .573 .025
Within Groups 544.306 193 2.820
Total 553.995 199
Source: SPSS Output
6.16.7.1 Hypothesis on Looks of the Green food products
H: Looks of the green food products will not significantly influence consumers’ preference for
them
The exact significant level (p value) of ANOVA is exhibited in 6th
Col. (Sig.) of the table
6.16.7.1. The level of significance set by us is 5%, i.e., α = 0.05 (on the basis of existing
researches of similar type). The table reveals that ‘p’ value is less than the ‘α’ value. In fact,
since p = 0.025 is less than α = 0.05, the null hypothesis is not accepted and the alternative
hypothesis is accepted. That means, looks of the green food products significantly impact the
consumers’ preference towards green food products.
Page 239
239
6.16.8 Availability
Here availability of green food products is studied. One-Way ANOVA is done in order to know
whether availability of green food products, denoted as v1, has significant impact on the
preference for green food products. For the purpose, the respondents have been studied using
seven categories; 1 = Very Strongly Disagree(VSD), 2 = Strongly Disagree(SD) , 3 =
Disagree(D) , 4 = Neither Agree Nor Disagree(NAD) , 5 = Agree(A) , 6 = Strongly Agree(SA) ,
7 = Very Strongly Agree(VSA). Preference for green food products is the dependent variable
and in analysis, it is denoted as v2. The relevant portion of SPSS output sheet is presented below
to infer whether there is any significant effect of availability of green food products on the
preference of green food products.
Table 6.16.8.1: ANOVA for Availability of Green Food Products
ANOVA
v2
Sum of Squares df Mean Square F Sig.
Between Groups 6.637 6 1.106 .390 .085
Within Groups 547.358 193 2.836
Total 553.995 199
Source: SPSS Output
6.16.8.1 Hypothesis on Availability of the Product:
H: Availability of the food products will not significantly influence consumers’ preference for
green food products
The exact significant level (p value) of ANOVA is exhibited in 6th
Col. (Sig.) of the table
6.16.8.1. The level of significance set by us is 5%, i.e., α = 0.05 (on the basis of existing
researches of similar type). The table reveals that ‘p’ value is less than the ‘α’ value. In fact,
since p = 0.085 is greater than α = 0.05, the null hypothesis is accepted and established. That
means, the availability of the food products will not significantly impact the consumers’
preference towards green food products.
Page 240
240
6.17 Impact of Demographic Profile on Preference for Green Cosmetic
Products (ANOVA) for the Non-users of Green Cosmetic products
6.17.1 Age-Group
One-Way ANOVA is applied in order to know whether the age-group, denoted as v1, has
significant impact on the preference for green cosmetic products. For the purpose, the
respondents studied have been segregated into four categories; a) 18yrs – 25 yrs. B) 26 yrs – 35
yrs, c) 36 yrs – 50 yrs and d) > 50 yrs and these age-groups are denoted respectively as 0, 1, 2
and 3 for analysis purpose in SPSS. Preference for green cosmetic products is the dependent
variable and in analysis, it is denoted as v2. The relevant portion of SPSS output sheet is
presented below to infer whether there is any significant effect of age-group on the preference of
green cosmetic products.
Table 6.17.1.1 ANOVA Output for Age-Group
ANOVA
v2
Sum of Squares df Mean Square F Sig.
Between Groups 3.163 3 1.054 .368 .076
Within Groups 561.717 196 2.866
Total 564.880 199
Source: SPSS Output
6.17.1.1 Hypothesis on Age-Group:
H: Age-group does not influence preference towards green cosmetic products. In other
words, there is no significant difference among different age-groups concerning their impact on
preference, i.e., 18-25 = 26-35 = 36-50 = >50.
The exact significant level (p value) of ANOVA is exhibited in 6th Col. (Sig.) of table 6.17.1.1.
The level of significance set by us is 5%, i.e., α = 0.05 (on the basis of existing researches of
similar type). The table reveals that ‘p’ value is more than the ‘α’ value. In fact, since p = 0.076
Page 241
241
is greater than α = 0.05, the null hypothesis is accepted and established. That means, the age-
group does not significantly impact the consumers’ preference towards green cosmetic products.
6.17.2 Gender
Like age-group, for gender also, One-Way ANOVA is done in order to know whether the
gender, denoted as v1, has significant impact on the preference for green cosmetic products. For
the purpose, the respondents studied have been segregated into two categories; a) Female B)
Male and these categories are denoted respectively as 0 and 1 for analysis purpose in SPSS.
Preference for green cosmetic products is the dependent variable and in analysis, it is denoted as
v2. The relevant portion of SPSS output sheet is presented below to infer whether there is any
significant effect of gender on the preference of green cosmetic products.
Table 6.17.2.1 ANOVA Output for Gender
ANOVA
v2
Sum of Squares df Mean Square F Sig.
Between Groups .110 1 .110 .038 .045
Within Groups 564.770 198 2.852
Total 564.880 199
Source: SPSS Output
6.17.2.1 Hypothesis on Gender
H: Gender does not influence consumers’ preference towards green cosmetic products. In
other words, there is no significant difference between two genders concerning their impact on
preference, i.e., Male = Female.
The exact significant level (p value) of ANOVA is exhibited in 6th Col. (Sig.) of table 6.17.2.1.
The table reveals that ‘p’ value is more than the ‘α’ value. In fact, since p = 0.045 is greater than
α = 0.05, the null hypothesis is not accepted and the alternative hypothesis is accepted and
Page 242
242
established. That means, gender does not significantly impact the preference towards green
cosmetic products.
6.17.3 Level of Education
Like the other demographic variables, for level of education also, One-Way ANOVA is done in
order to know whether the level of education, denoted as v1, has significant impact on the use of
green cosmetic products. For the purpose, the respondents studied have been segregated into
three categories; a) High School b) Graduation and c) Post – Graduation. These categories are
denoted respectively as 0, 1 and 2 for analysis purpose in SPSS. Preference for green cosmetic
products is the dependent variable and in analysis, it is denoted as v2. The relevant portion of
SPSS output sheet is presented below to infer whether there is any significant effect of level of
education on the preference of green cosmetic products.
Table 6.17.3.1 ANOVA output for Level of Education
ANOVA
v2
Sum of Squares df Mean Square F Sig.
Between Groups 5.172 2 2.586 .910 .040
Within Groups 559.708 197 2.841
Total 564.880 199
Source: SPSS Output
6.17.3.1 Hypothesis on Level of Education:
H: Level of Education does not influence consumers’ preference towards green cosmetic
products. In other words, there is no significant difference between three levels of education
concerning their impact on preference, i.e., High School = Graduation = Post - Graduation.
The exact significant level (p value) of ANOVA is exhibited in 6th
Col. (Sig.) of table 6.17.3.1.
The table reveals that ‘p’ value is more than the ‘α’ value. In fact, since p = 0.040 is greater than
Page 243
243
α = 0.05, the null hypothesis is accepted and established. That means, level of education does not
significantly impact the preference towards green cosmetic products.
6.17.4 Occupation
Like the other demographic variables, for different types of occupation also, One-Way ANOVA
is done in order to know whether the different types of occupation , denoted as v1, has
significant impact on the use of green cosmetic products. For the purpose, the respondents
studied have been segregated into four categories; a) Student b) Business c) Service and d)
Housewife. These categories are denoted respectively as 0, 1, 2 and 3 for analysis purpose in
SPSS. Preference for green cosmetic products is the dependent variable and in analysis, it is
denoted as v2. The relevant portion of SPSS output sheet is presented below to infer whether
there is any significant effect of level of education on the preference of green cosmetic products.
Table 6.17.4.1 ANOVA Output for Occupation
ANOVA
v2
Sum of Squares Df Mean Square F Sig.
Between Groups 2.724 3 .908 .317 .081
Within Groups 562.156 196 2.868
Total 564.880 199
Source: SPSS Output
6.17.4.1 Hypothesis on Occupation:
H: Occupation does not influence consumers’ preference towards green cosmetic products.
In other words, there is no significant difference between four levels of occupation concerning
their impact on preference, i.e., Student = Business = Service = Housewife.
The exact significant level (p value) of ANOVA is exhibited in 6th Col. (Sig.) of table 6.17.4.1.
The table reveals that ‘p’ value is more than the ‘α’ value. In fact, since p = 0.081 is greater than
Page 244
244
α = 0.05, the null hypothesis is accepted and established. That means Occupation does not
significantly impact the preference towards green cosmetic products.
6.17.5 Income
Like other characteristics of demographic profile as analyzed above, income of the consumers
has also been considered for One-Way ANOVA in order to know whether the income level of
the consumers, denoted as v1, has significant impact on the use of green cosmetic products. For
the purpose, the respondents studied have been segregated into five categories on the basis of
monthly income in Rupees; a) <25,000 b) 25001-49999 c) 50000-74999 d) 75000-99999 and e)
≥100000 and these categories are denoted respectively as 0, 1, 2, 3 and 4 for analysis purpose in
SPSS. Preference for green cosmetic products is the dependent variable and in analysis, it is
denoted as v2. The relevant portion of SPSS output sheet is presented below to infer whether
there is any significant effect of income level of the consumers on the preference of green
cosmetic products.
Table 6.17.5.1 ANOVA Output on Income Level of the Consumers
ANOVA
v2
Sum of Squares Df Mean Square F Sig.
Between Groups 5.085 4 1.271 .443 .008
Within Groups 559.795 195 2.871
Total 564.880 199
Source: SPSS Output
6.17.5.1 Hypothesis on Income Level
H: Income level does not influence consumers’ preference towards green cosmetic products.
In other words, there is no significant difference between five income levels concerning their
impact on preference, i.e., <25,000 = 25001-49999 = 50000-74999 = 75000-99999 = ≥100000.
Page 245
245
The exact significant level (p value) of ANOVA is exhibited in 6th Col. (Sig.) of table 6.17.5.1.
The table reveals that ‘p’ value is less than the ‘α’ value. In fact, since p = 0.008 is less than α =
0.05, the null hypothesis is not accepted and the alternative hypothesis is accepted and
established. That means, income level significantly impacts the preference towards green
cosmetic products.
6.17.6 Number of Members in Household
The last demographic variable which is studied in this paper is the number of members in the
household of the consumer, for different number of members in the household also, One-Way
ANOVA is done in order to know whether different number of members in the household,
denoted as v1, has significant impact on the use of green cosmetic products. For the purpose, the
respondents studied have been segregated into three categories; a) <2 b) 2 - 4 and c) ≥ 5. These
categories are denoted respectively as 0, 1 and 2 for analysis purpose in SPSS. Preference for
green cosmetic products is the dependent variable and in analysis, it is denoted as v2. The
relevant portion of SPSS output sheet is presented below to infer whether there is any significant
effect of level of education on the preference of green cosmetic products.
Table 6.17.6.1 ANOVA Output on Number of members in the household
ANOVA
v2
Sum of Squares Df Mean Square F Sig.
Between Groups 12.891 2 6.446 2.300 .103
Within Groups 551.989 197 2.802
Total 564.880 199
Source: SPSS Output
Page 246
246
6.17.6.1 Hypothesis on Number of members in the household:
H: Number of members in the household does not influence consumers’ preference towards
green cosmetic products. In other words, there is no significant difference between four levels of
occupation concerning their impact on preference, i.e., <2 = 2-4 = ≥ 5.
The exact significant level (p value) of ANOVA is exhibited in 6th Col. (Sig.) of table 6.17.6.1.
The table reveals that ‘p’ value is more than the ‘α’ value. In fact, since p = 0.103 is greater than
α = 0.05, the null hypothesis is accepted and established. That means, Number of members in the
household does not significantly impact the preference towards green cosmetic products.
6.18 Impact of Demographic Profile on Preference for Green Food Products
(ANOVA) for the Non-users
6.18.1 Age Group
One-Way ANOVA is done in order to know whether the age-group, denoted as v1, has
significant impact on the preference for green food products. For the purpose, the respondents
studied have been segregated into four categories; a) 18yrs – 25 yrs. b) 26 yrs – 35 yrs, c) 36 yrs
– 50 yrs and d) > 50 yrs and these age-groups are denoted respectively as 0, 1, 2 and 3 for
analysis purpose in SPSS. Preference for green food products is the dependent variable and in
analysis, it is denoted as v2. The relevant portion of SPSS output sheet is presented below to
infer whether there is any significant effect of age-group on the preference of green food
products.
Page 247
247
Table 6.18.1.1 ANOVA Output for Age-Group
ANOVA
v2
Sum of Squares Df Mean Square F Sig.
Between Groups 4.165 3 1.388 .495 .086
Within Groups 549.830 196 2.805
Total 553.995 199
Source: SPSS Output
6.18.1.1 Hypothesis on Age-Group:
H: Age-group does not influence consumers’ preference towards green food products. In
other words, there is no significant difference among different age-groups concerning their
impact on preference, i.e., 18-25 = 26-35 = 36-50 = >50.
The exact significant level (p value) of ANOVA is exhibited in 6th
Col. (Sig.) of table 6.18.1.1.
The level of significance set by us is 5%, i.e., α = 0.05 (on the basis of existing researches of
similar type). The table reveals that ‘p’ value is more than the ‘α’ value. In fact, since p = 0.086
is greater than α = 0.05, the null hypothesis is accepted and established. That means, the age-
group does not significantly impact the consumers’ preference towards green food products.
6.18.2 Gender
Like age-group, for gender also, One-Way ANOVA is done in order to know whether the
gender, denoted as v1, has significant impact on the use of green food products. For the
purpose, the respondents studied have been segregated into two categories; a) Female B) Male
and these categories are denoted respectively as 0 and 1 for analysis purpose in SPSS.
Preference for green food products is the dependent variable and in analysis, it is denoted as v2.
The relevant portion of SPSS output sheet is presented below to infer whether there is any
significant effect of gender on the preference of green food products.
Page 248
248
Table 6.18.2.1 ANOVA Output for Gender
ANOVA
v2
Sum of Squares Df Mean Square F Sig.
Between Groups .080 1 .080 .029 .066
Within Groups 553.915 198 2.798
Total 553.995 199
Source: SPSS Output
6.18.2.1 Hypothesis on Gender
H: Gender does not influence consumers’ preference towards green food products. In other
words, there is no significant difference between two genders concerning their impact on
preference, i.e., Male = Female.
The exact significant level (p value) of ANOVA is exhibited in 6th
Col. (Sig.) of table 6.18.2.1.
The level of significance set by us is 5%, i.e., α = 0.05 (on the basis of existing researches of
similar type). The table reveals that ‘p’ value is more than the ‘α’ value. In fact, since p = 0.066
is greater than α = 0.05, the null hypothesis is accepted and established. That means, gender does
not significantly impact the consumers’ preference towards green food products.
6.18.3 Level of Education
Like the other demographic variables, for level of education also, One-Way ANOVA is done in
order to know whether the level of education, denoted as v1, has significant impact on the use of
green food products. For the purpose, the respondents studied have been segregated into three
categories; a) High School b) Graduation and c) Post – Graduation. These categories are denoted
respectively as 0, 1 and 2 for analysis purpose in SPSS. Preference for green food products is the
dependent variable and in analysis, it is denoted as v2. The relevant portion of SPSS output
Page 249
249
sheet is presented below to infer whether there is any significant effect of level of education on
the preference of green food products.
Table 6.18.3.1 ANOVA Output for Education
ANOVA
v2
Sum of Squares Df Mean Square F Sig.
Between Groups 9.169 2 4.584 1.658 .093
Within Groups 544.826 197 2.766
Total 553.995 199
Source: SPSS Output
6.18.3.1 Hypothesis on Education
H: Level of Education does not influence consumers’ preference towards green food
products. In other words, there is no significant difference between three levels of education
concerning their impact on preference, i.e., High School = Graduation = Post - Graduation.
The exact significant level (p value) of ANOVA is exhibited in 6th
Col. (Sig.) of table 6.18.3.1.
The level of significance set by us is 5%, i.e., α = 0.05 (on the basis of existing researches of
similar type). The table reveals that ‘p’ value is more than the ‘α’ value. In fact, since p = 0.093
is greater than α = 0.05, the null hypothesis is accepted and established. That means, level of
education does not significantly impact the consumers’ preference towards green food products.
6.18.4 Occupation
Like the other demographic variables, for different types of occupation also, One-Way ANOVA
is done in order to know whether the different types of occupation , denoted as v1, has
significant impact on the use of green food products. For the purpose, the respondents studied
have been segregated into four categories; a) Student b) Business c) Service and d) Housewife.
These categories are denoted respectively as 0, 1, 2 and 3 for analysis purpose in SPSS.
Page 250
250
Preference for green food products is the dependent variable and in analysis, it is denoted as v2.
The relevant portion of SPSS output sheet is presented below to infer whether there is any
significant effect of level of education on the preference of green food products.
Table 6.18.4.1 ANOVA output for Occupation
ANOVA
v2
Sum of Squares Df Mean Square F Sig.
Between Groups 2.153 3 .718 .255 .058
Within Groups 551.842 196 2.816
Total 553.995 199
Source: SPSS Output
6.18.4.1 Hypothesis on Occupation:
H: Occupation does not influence consumers’ preference towards green food products. In
other words, there is no significant difference between four levels of occupation concerning their
impact on preference, i.e., Student = Business = Service = Housewife.
The exact significant level (p value) of ANOVA is exhibited in 6th
Col. (Sig.) of table 6.18.4.1.
The level of significance set by us is 5%, i.e., α = 0.05 (on the basis of existing researches of
similar type). The table reveals that ‘p’ value is more than the ‘α’ value. In fact, since p = 0.058
is greater than α = 0.05, the null hypothesis is accepted and established. That means, Occupation
does not significantly impact the consumers’ preference towards green food products.
6.18.5 Income
Like other characteristics of demographic profile as analyzed above, income of the consumers
has also been considered for One-Way ANOVA in order to know whether the income level of
the consumers, denoted as v1, has significant impact on the use of green food products. For the
purpose, the respondents studied have been segregated into five categories on the basis of
Page 251
251
monthly income in Rupees; a) <25,000 b) 25001-49999 c) 50000-74999 d) 75000-99999 and e)
≥100000 and these categories are denoted respectively as 0, 1, 2, 3 and 4 for analysis purpose in
SPSS. Preference for green food products is the dependent variable and in analysis, it is denoted
as v2. The relevant portion of SPSS output sheet is presented below to infer whether there is
any significant effect of income level of the consumers on the preference of green food
products.
Table 6.18.5.1 ANOVA output for Income Level
ANOVA
v2
Sum of Squares Df Mean Square F Sig.
Between Groups 8.177 4 2.044 .730 .047
Within Groups 543.571 194 2.802
Total 551.749 198
Source: SPSS Output
6.18.5.1 Hypothesis on Income Level
H: Income level does not influence consumers’ preference towards green food products. In
other words, there is no significant difference between five income levels concerning their
impact on preference, i.e., <25,000 = 25001-49999 = 50000-74999 = 75000-99999 = ≥100000.
The exact significant level (p value) of ANOVA is exhibited in 6th
Col. (Sig.) of table 6.18.5.1 is
.047. The level of significance set by us is 5%, i.e., α = 0.05 (on the basis of existing researches
of similar type). The table reveals that ‘p’ value is less than the ‘α’ value. In fact, since p = 0.039
is less than α = 0.05, the null hypothesis is not accepted and the alternative hypothesis is
accepted and established. That means, income level significantly impacts the consumers’
preference towards green food products.
Page 252
252
6.18.6 Number of Members in Household
The last demographic variable which is studied is the number of members in the household of
the consumer, for different number of members in the household also, One-Way ANOVA is
done in order to know whether different number of members in the household, denoted as v1,
has significant impact on the use of green food products. For the purpose, the respondents
studied have been segregated into three categories; a) <2 b) 2 - 4 and c) ≥ 5. These categories
are denoted respectively as 0, 1 and 2 for analysis purpose in SPSS. Preference for green food
products is the dependent variable and in analysis, it is denoted as v2. The relevant portion of
SPSS output sheet is presented below to infer whether there is any significant effect of level of
education on the preference of green food products.
Table 6.18.6.1 ANOVA output for Number of members in the household
ANOVA
v2
Sum of Squares df Mean Square F Sig.
Between Groups .781 2 .390 .139 .036
Within Groups 553.214 197 2.808
Total 553.995 199
Source: SPSS Output
6.18.6.1 Hypothesis on Number of members in the Household
H: Number of members in the household does not influence consumers’ preference towards
green food products. In other words, there is no significant difference between four levels of
occupation concerning their impact on preference, i.e., <2 = 2-4 = ≥ 5.
The exact significant level (p value) of ANOVA is exhibited in 6th
Col. (Sig.) of table 6.18.6.1.
The level of significance set by us is 5%, i.e., α = 0.05 (on the basis of existing researches of
similar type). The table reveals that ‘p’ value is more than the ‘α’ value. In fact, since p = 0.036
is greater than α = 0.05, the null hypothesis is not accepted and the alternative hypothesis is
Page 253
253
accepted and established. That means, number of members in the household significantly impact
the preference towards green food products.
6.19 Reasons for not buying Green Cosmetic or Food products
1) Still now, the price of the green products for both the cosmetic and food products is the
most significant barrier. Although, the environment is changing and the awareness among
the masses are improving, still the price is acting as a barrier. For the cosmetic products,
the price difference is at least three times as compared to non-green products.
2) Green food products are healthier compared to non-green conventional food products.
But this awareness is not so much among the masses. This may be due to the reason that
for green food products, unbranded products are more dominant than that of branded
products. They are not promoting so much to aware the consumers about the positive
effects of the green products. Also, for the branded products, the promotional investments
are not so much which actually can make the customers aware about the positive features
about the green products.
3) Availability is also a very important barrier with respect to mainly food products and
more so in the semi-urban and rural areas. Once a consumer likes a product, as s/he again
goes to buy the product, the products’ unavailability lead to a negative mind-set. This
actually prevents the customer from becoming a regular customer.
4) Looks for green food products is also an obstacle since they are not so attractive in looks
as compared to conventional food products. For example, Green Haldi will not be so
much yellowish in nature as it will be for conventional haldi packets.
5) Family size – Bigger family size leads to non-regular usage for the green food products.
This is due to bulk expenditure for the products as the quantity of the products to be
Page 254
254
demanded is reasonably high owing to bigger family size. But, if the family size is small,
then in spite of high price, consumers used to buy the green products as the total
expenditure is not so much.
6) Improper promotion and communication from the green product organizations towards
the prospective buyers. Still now, except the educated part of the society, people do not
know about the positive effects of the green products. Some online retailers are selling
the products specifically to the computer-literate groups of the society only leaving aside
the computer illiterate group of the society.
7) Product effectivity/product performance is an important barrier. Consumers of green
products presume that the effectivity of these products will be better than that of
conventional products. This mindset is generated due to the concept of paying higher
price. But this is not always true practically. It basically depends on the product category
whether it will be needed less or more in quantity. For example, in case of some beauty
products, this may be applicable. But for many types of food products this concept is not
applicable which actually makes product effectivity an important barrier towards
preference for green products.
8) There is a gap between the consumers’ belief and their behavior for buying green
products. This may be due to the fact of the role of the influencers around them and
presence of barriers for buying green products. Also, less involved in the buying green
products and less innovative behavior in buying the products can lead to the above
mentioned situation.
9) Skepticism about the certification boards and organic food labels. Many educated
consumers do not believe on the certification boards certifying the green cosmetic and
Page 255
255
food products. Better acceptability among the consumers about this agencies will help the
organizations to increase the market share.
6.20 Comparison of Findings of this Study with that of the Existing
Literature
6.20.1 Green Cosmetic Products
The findings of the study with that of the existing literatures are explained over here. Since no
study had taken place in the area selected for this study, so this comparison will help to identify
whether there are any deviations from the existing research findings and the reason behind that.
With respect to the Environmental Consciousness, Price Sensitivity, Innovativeness in buying
products, Product involvement , Health Consciousness, Safety perspective of the consumer,
Quality of the Green Cosmetic product, Product Effectivity, Product Knowledge, Information
about the product, Brand of the Green Cosmetic product, Availability of the product, Income ,
the findings of the study matches with that of the existing literatures. But, for the Age, Gender,
Education and Occupation of the consumers, the finding of the study does not match with that of
the existing literature. For Age and gender, the market of green cosmetic products in Indian
market is different from the other parts of the world. Here, due to glamour-driven mind set,
males are becoming equally conscious about the cosmetic products as compared to the females.
For studying occupation of the respondents’, the sample units considered in this Study are
customers both from the sophisticated organized retail outlets like Spencer’s and local brands
like Aromatic Herbals which directly sell to the customers. Since the local brand users, mainly
from the areas in and around Kolkata, such as Howrah, North and South 24 Parganas are not that
well placed with respect to their occupation but are happy with the green cosmetic products, the
Hypothesis is not accepted. Studying product involvement with respect to the consumers’
Page 256
256
preference for Green Cosmetic products was a new task as it was not tested for green cosmetic
products, but was tested for other categories of products, specifically non-green cosmetic
products. The findings state that Product involvement does not influence consumers’ preference
for Green Cosmetic products. Similarly, Product Effectivity with respect to consumers’
preference for green cosmetic products was also not studied, but was studied for other categories
of products, specifically, non-green cosmetic products. The findings state that Product effectivity
does not influence consumers’ preference for Green Cosmetic products. The same way, the
number of members in the household, which was not, tested earlier state that it will not influence
consumers’ preference for Green Cosmetic products.
6.20.2 Green Food Products
Here the findings of the study about green food products with that of the existing literatures.
Since no study had taken place in the area selected for this study, so this comparison will help to
identify whether there are any deviations and the reason behind that. With respect to the
Environmental Consciousness, Price Sensitivity, Innovativeness in buying products, Product
involvement, Health Consciousness, Safety perspective of the consumer, Quality of the Green
Food products, Product Effectivity, Product Knowledge, Information about the product, Brand of
the Green Food product, Availability of the product, Nutritional value, Income, the findings of
the study matches with that of the existing literatures. But, for the Age, Gender, Education and
Occupation of the consumers, the findings of the study do not match with that of the existing
literature. For Age and gender, the market of green food products in Indian market is different
from the other parts of the world. Here, due to glamour-driven mind set, males are becoming
equally conscious about the food products as compared to the females.
Page 257
257
For studying occupation of the respondents’, the sample units considered in this Study are
customers both from the sophisticated organized retail outlets like Spencer’s and local brands
like Aromatic Herbals which directly sell to the customers. Since the local brand users, mainly
from the areas in and around Kolkata, such as Howrah, North and South 24 Parganas are not that
well placed with respect to their occupation but are happy with the green food products, the
Hypothesis is not accepted. Studying product involvement with respect to the consumers’
preference for Green Food products was a new task as it was not tested for green food products,
but was tested for other categories of products, specifically non-green food products. The
findings state that Product involvement does not influence consumers’ preference for Green
Food products. Similarly, Product Effectivity with respect to consumers’ preference for green
food products was also not studied, but was studied for other categories of products, specifically,
non-green food products. The findings state that Product effectivity does not influence
consumers’ preference for Green Food products. The same way, the number of members in the
household, which was not, tested earlier state that it will not influence consumers’ preference for
Green Food products.
6.20 Summary
In this chapter a detailed description about the analysis of the data collected using the
questionnaires is presented. At first, minimization of factors with respect to the various
independent variables by Factor analysis was done. After that among the factors, prioritization
was done using Multiple Regression technique. Also, the hypotheses formulated were tested
using ANOVA to arrive at the results. A comparison between the preference for Green Cosmetic
and Food product was made. After that, the same variables were tested for the non-users of
Green Cosmetic and Food products. The chapter ends with identifying the barriers for buying
Green Cosmetic and Food products.
Page 258
258
7. Conclusion
7.1 Overview
While details about the findings with respect to factors influencing consumer preferences for
Green Cosmetic and Food products have been discussed in previous sections, the most
significant findings and comparison of those with that of the existing literatures are highlighted
in this section.
7.2 Summary of Research Findings
In order to meet the purpose of the study as envisaged in the earlier sections, factor analysis is
used to know important factors which insist buyers to go for both green cosmetic and food
products and also find out the impact of psychographic variables on the popularity of them.
On the basis of analysis done using Exploratory Factor Analysis, huge number of variables used
in the study, to be specific forty five variables, had been scaled down to twenty variables.
Concerning the facet - impact of Environmental consciousness towards popularity of Green
products, factors such as; Environmental Sense and Environmental Callousness are the most
important. Relating to relevance of price towards popularity of green products, factors such as;
Higher Price, Price Sensitivity and Price Barrier plays the most important role. In the pretext of
studying the innovation of the respondents’ about buying green products, it has been found that
New Product Initiative and Experimental Attitude are two important factors. Regarding
involvement in buying process while buying green products, factors such as; Satisfaction from
Branded Green products and Branded Green products reveal personality are the key contributors.
About health consciousness of the respondents in buying green products, factors such as; Health
Page 259
259
Sensitivity, Health Concern, Avoid preservative food and Food pollution play the most important
role.
Regarding general factors contributing for the popularity of green cosmetic products, important
factors are; Green Product Knowledge, Branded Green Cosmetic Products, Reliability of Green
Cosmetic Product and Green Products expensive.
Pertaining to general factors impacting green food products, factors such as; Green Food
Products’ Nutritional Taste, Green Food Products are Healthier, Lack of information and
availability of Green Food Products, Green Food Products are safe and expensive and Branded
Green Food Products’ Look and Quality impact the respondents’ decision for buying green food
products.
After identifying the factors using Exploratory Factor analysis, Multiple Regression is used to
know the important factors which insist buyers to go for green cosmetic products and also find
out the impact of psychographic variables on the popularity of green cosmetic products.
Concerning the facet – ‘impact of Environmental consciousness towards popularity of Green
cosmetic products’, the factor - ‘users of green cosmetic products to do anything about the
environment’ has highest level of impact on preferring green cosmetic products. On the other
hand, the factor – ‘willing to pay higher prices for water’ has the least level of impact on
preferring green cosmetic products. Relating to relevance of price towards popularity of green
cosmetic products, factors such as, ‘Users of Green Cosmetic Products don’t mind spending a lot
of money to buy a Green Cosmetic product’ has highest level of impact on preferring green
cosmetic products. The factor – ‘Users of Green Cosmetic Products know that a new kind of
Page 260
260
green cosmetic product is likely to be more expensive than older ones, but that does not matter to
them’ has least level of impact on preferring green cosmetic products.
In the pretext of studying the innovation of the consumers about buying green cosmetic products,
it has been found that ‘Users of Green Cosmetic Products like to take a chance in buying new
products’ has highest level of impact on preferring green cosmetic products. But, the factor
‘Users of Green Cosmetic Products like to try new and different products’ has the least level of
impact on preferring green cosmetic products. Regarding involvement in buying process while
buying green cosmetic products, the factor ‘Users of Green Cosmetic Products select the green
cosmetic products very carefully’ has highest level of impact on preferring green cosmetic
products. Similarly the variable – ‘One can tell a lot about a person from whether they buy Green
Cosmetic Products’ has the least level of impact on preferring green cosmetic products.
About health consciousness of the respondents in buying green products, ‘Users of Green
Cosmetic Products are concerned about their drinking water quality’ has highest level of impact
on preferring green cosmetic products. Similarly, the factor – ‘Users of Green Cosmetic Products
are interested in information about their health’ has the least level of impact on preferring green
cosmetic products.
After identifying the factors, like green cosmetic products, Multiple Regression is used to know
important factors which insist buyers to go for Green Food products and also find out the impact
of psychographic variables on the popularity of green Food products.
Page 261
261
Concerning the facet – ‘impact of Environmental consciousness towards popularity of Green
Food products’, the factor - ‘Users of Green Food Products would be willing to pay higher prices
for water’ has highest level of impact on preferring green Food products. On the other hand, the
factor – ‘Users of Green Food Products is aware about the issues and problems related to the
environment’ has the least level of impact on preferring green Food products. Relating to
relevance of price towards popularity of green Food products, factors such as, ‘Users of Green
Food Products don’t mind spending a lot of money to buy a Green Food product’ has highest
level of impact on preferring green Food products. The factor – ‘The price of buying Green Food
Products is important to users of Green Food Products’ has least level of impact on preferring
green Food products.
In the pretext of studying the innovation of the consumers about buying green Food products, it
has been found that ‘Users of Green Food Products like to take a chance in buying new products’
has highest level of impact on preferring green Food products. In case of involvement in buying
process while buying green Food products, the factor ‘Users of Green Food Products select the
green products very carefully’ has highest level of impact on preferring green Food products.
Similarly the variable – ‘One can tell a lot about a person from whether they buy Green Food
Products’ has the least level of impact on preferring green Food products.
About health consciousness of the respondents in buying green products, ‘Users of Green Food
Products are concerned about their drinking water quality’ has highest level of impact on
preferring green Food products. Similarly, the factor – ‘Pollution in Food products does not
bother users of Green Food Products’ has the least level of impact on preferring green Food
products.
Page 262
262
After identifying the factors with respect to green cosmetic and food products and finding the
most significant among them, One-Way ANOVA is used to know whether any facet of
demographic profile of the consumers has significant impact on the preference of the green
cosmetic products. Out of six facets of demographic profile considered, only one, i.e., income
level of the consumers has significant impact on preference for green cosmetic products.
Participatory observation method followed in uncovering the logic behind our findings reveals
that owing to comparatively highly priced, the preference for green cosmetic products is a direct
function of the income level of the consumers. Although all the respondents are the users of
green cosmetic products, consumers in relatively lower income basket don’t afford to all the
green cosmetic products available in the market and prefer to conventional cosmetic products for
reasonability of prices.Some goes for occasional buying but not for regular buying. Other five
facets of demographic profile such as age, gender, education, occupation and family size don’t
significantly impact the preference for green cosmetic product. On observation, it is found that
those who are users, they know very well the utility of the green cosmetic products vis-à-vis their
conventional counterparts. Thus irrespective of gender, education, occupation and family size,
the preference gets intact. However, in-depth study on facet-wise demographic profile on
preference may bring forth some exceptional result which may be considered for future research.
On the basis of the research findings, it is inferred that, in order to popularize the use of green
cosmetic products, the producers need to focus on either of the following two points; a) keep the
prices of the green cosmetic products in reasonable range to make it affordable to a wider base of
consumers and b) to market the same amongst the consumers of higher income-group basket
exhaustively.
Page 263
263
Like green cosmetic products, for green food products also, One-Way ANOVA is applied to
know whether any facet of demographic profile of the consumers has significant impact on the
preference of the green food products. Out of six facets of demographic profile considered, only
one, i.e., income level of the consumers has significant impact on preference for green food
products. Participatory observation method followed in uncovering the logic behind our findings
reveals that owing to comparatively highly priced, the preference for green food products is a
direct function of the income level of the consumers. Although all the respondents are the users
of green food products, consumers in relatively lower income basket don’t afford to all the green
food products available in the market and prefer to conventional food products for reasonability
of prices. Other five facets of demographic profile such as age, gender, education, occupation
and family size don’t significantly impact the preference for green food product. On observation,
it is found that those who are users, they know very well the utility of the green food products
vis-à-vis their conventional counterparts. Thus irrespective of gender, education, occupation and
family size, the preference gets intact. However, in-depth study on facet-wise demographic
profile on preference may bring forth some exceptional result which may be considered for
future research.
On the basis of the research findings, it is inferred that, in order to popularize the use of green
food products, the producers need to focus on either of the following two points; a) keep the
prices of the green food products in reasonable range to make it affordable to a wider base of
consumers and b) to market the same amongst the consumers of higher income-group basket
exhaustively.
Page 264
264
After analysing the impact of the various demographic variables with respect to consumers’
preference for Green cosmetic and food products, it is very important to analyse the role of
various psychographic and independent variables and their impact on consumers’ preference for
Green cosmetic and food products. Regarding the various psychographic variables studied,
Environmental Consciousness, Price Sensitivity, Innovativeness in buying products, Product
Involvement and Health Consciousness,significantly impact consumers’ preference for Green
Cosmetic and Food products.
Regarding the other independent variables, Safety perspective of the consumer, Product
effectivity, Product knowledge, Information about the products, Brand of the green product,
Availability of the green product significantly impact consumers’ preference for Green Cosmetic
products. Likewise all the above mentioned factors significantly impact consumers’ preference
for Green Food products too. In addition to these, Taste, Nutritional value and Looks of the
Green Food products significantly impact consumers’ preference for Green Food products. This
is against the common perception that the green food products are good to taste compared to
conventional products. Also, looks of the green food products are more original and not so
attractive looking as compared with conventional food products. Green haldi will not be so
yellowish and attractive looking as compared with conventional haldi. Also, while comparing the
findings for the cosmetic products with that of the food products, there was not so much of
difference. This may be due to the reason that the respondents for the cosmetic and food products
were same.
Also, the same hypotheses were tested with respect to the non-users or occasional users of the
green cosmetic and food products to compare the findings of the users and the non-users. The
Page 265
265
findings of most of the hypothesis were same except a few. This proves that the findings of the
research are consistent. Also, enquiring about the barriers which prevents the buyers from buying
green products occasionally also, are price and its availability. The price is most significant
barrier. Mainly for the semi-urban and rural areas, availability is a problem as the local retailers
does not stock much product due to less demand. Also, awareness about the products needs to be
improved by effective use of the promotional tools.
In comparing the above mentioned results with that of the existing literatures, the results
obtained from this research are in line with that of the existing literatures, barring a few cases. In
demographic variables Age, Gender, Occupation, Education and Number of members in the
household does not significantly impact consumers’ reference for Green cosmetic and food
products. Some variables studied are not being tested earlier, such as Taste, Looks of the Green
Food products, it can be seen that they significantly impact consumers’ preference for Green
Food products.
Only 18% respondents buy either green cosmetic or food products regularly compared to the
others and they are mostly from the urban areas. This is due to the problem of availability of the
products in the semi-urban or rural areas. Also, brands play a more significant role in case of
preference for green cosmetic products more than that of green food products. In unorganized
retailing sector, selling is mostly happening in case of fruits and vegetables. The unorganized
sellers are selling both in the rural markets and also in the urban areas. In case many localities of
Kolkata, such as Alipore, Salt Lake, green fruits and vegetables are sold on Saturdays and
Sundays by the unorganized retailers.
Page 266
266
7.3 Managerial Implications
The findings of the research will help the organizations to identify the key factors leading to
more acceptability of the green cosmetic and food products in the Indian market, more
specifically in Kolkata and the districts around it in West Bengal. Also, it will help all the
concerned persons to identify the factors which act as barriers for green products’ popularity and
take corrective actions to overcome these barriers. The customers can be made more aware about
the positive aspects of the green cosmetic and food products as a result of which they will be
accepting these for their daily use. Some specific suggestions are listed below:-
1) More effective promotional campaigns to be undertaken to inform about the positive
effects of Green products. The promotional campaigns should target all the geographies
starting from urban to rural areas.
2) When consumers hold ambivalent attitudes toward buying green products, high effort
should be given by the organizations to remove the discomfort of the consumers
regarding buying green products. So, while going for green advertising, the organizations
should assess the ambivalence of their target consumers’ attitude toward buying green
products. They should also try to map the relationship of demographics with that of
ambivalence attitude.
3) Effective demographic or psychographic segmentation should be implemented so that the
different categories of green products can be targeted according to the selected segment
of the market.
4) The research also helps to understand the varying behavior pattern between the urban and
rural consumers. For example, in case of rural consumers of green products, brand does
not play an effective role whereas for urban consumers brand plays an effective role
Page 267
267
while selecting specifically green cosmetic products. The above statement is not valid for
green cosmetic products.
5) Overall all, these steps will help the organization to promote green products better, which
will ultimately increase the number of green consumers and reduce environmental
degradation. This will help the earth as well as the mankind to be sustainable.
7.4 Limitations of the Research
Limitations of the research study are as follows:
7.4.1 The research study is limited to respondents related to only Green Cosmetic and Food
products. The other types of green product users are not being studied in this research
project.
7.4.2 The research study is limited to only Kolkata and the districts around it such as, North 24
Parganas , South Parganas, Howrah , Hooghly only. The other parts of West Bengal are
not being studied.
7.4.3 Domain specific psychographic constructs used in this study consisted of truncated
number of dimensions, compared to that in existing literature, created by researchers in
the past. These limited numbers of dimensions of each construct were chosen
specifically, ensuring that these were non-overlapping between dimensions of other
constructs, to reflect the impact of marketing strategies of marketers, pertinent to this
study.
7.4.4 The research study is limited to data collection over a period from December 2013 to
January 2015.
Page 268
268
7.4.5 The awareness about green products both with respect to the consumers’ and the
organizations have changed dramatically during the research period. So, the population
size of 400 may be is not sufficient with respect to the current scenario.
7.4.6 The responses from the respondents can be biased and as a result some findings can be
incorrect.
7.5 Scope of Future Research
The quest for knowledge, solutions to problems and research questions leading to improved
quality of research is synonymous with progress of human civilization. Whereas the current
research provided answers to the research questions, it also highlighted its limitations in the
previous section 7.4. This section provides brief directions for future researchers to pursue, in the
domain of impact of marketing strategies of marketers on popularizing and successfully selling
green cosmetic and food products.
7.5.1 Future research can improve generalization of the findings of this research by extending
this study to include the following:
other geographies like different states
localities with wide variations in their socio-economic profile,
other categories of green products except than cosmetic and food products
7.5.2 Future research can take place to enrich the research work by incorporating the following
additional factors which are expected to change over time:
expected increase in awareness of consumers regarding green products
Page 269
269
change in involvement due to increase in product complexity, durability, performance
and price
change in consumer exposure to social and online media due to wider access through
improved internet connectivity
increase in disposable income
7.5.3 Researchers in future are encouraged to create and develop new constructs to better
reflect evolution of marketing in future and changes in lifestyle of communities, as
follows:
propensity of consumers towards opportunities of co-creation of innovative solutions
by marketers,
emotional and enthusiastic affiliation to a brand
7.6 Summary
The thesis highlights the importance of identifying the various psychographic variables and
demographic variables which act as positive motivators influencing the preference for the Green
Cosmetic and Food products , specifically for Kolkata and in and around of it. But, still now
there are some important barriers which need to be tackled by the organizations to establish the
Green product industry in a sustainable manner. The chapter also discusses the limitations,
contribution of the research findings and future scope of research which will actually lead to
newer areas of research in the specified domain.
Page 270
270
8. References
1. Ahmad, S. & Juhdi, N. Organic Food : A Study on Demographic Characteristics and
Factors Influencing Purchase Intentions among Consumers in Klang Valley, Malaysia
International Journal of Business and Management, 2010, Vol. 5(2), pp. 105-118.
2. A Prakash, Hart J A (eds) “In Coping with Globalization”, Routledge: London;1997; pp.
77–93.
3. A Prakash. “Responsible Care: An Assessment.” Business & Society, Vol. 39, No. 2,
2000; pp. 183-209.
4. A. Michael, Tarrant H., and Ken Cordell, “The Effect of Respondent Characteristics on
General Environmental Attitude-Behavior”, Correspondence Environment and Behavior
vol. 29 no. 5 September 1997; pp. 618-637.
5. Adamantios Diamantopoulos, Bodo B Schlegelmilch, Rudolf R Sinkovics, Greg M
Bohlen, “Can socio-demographics still play a role in profiling green consumers? A
review of the evidence and an empirical investigation” Journal of Business Research
Volume 56, Issue 6, June 2003, Pages 465-480.
6. Albino V., Balice A. and Dangelico R. M., “Environmental strategies and green product
development: an overview on sustainability-driven companies”, Business Strategy and
the Environment, 18,2009; pp. 83–96.
7. Alreck, P L (2000). "Consumer Age Role Norms," Psychology and Marketing, October,
pp. 891-900.
8. Antil H. John, “Uses Of Response Certainty In Attitude Measurement”, Advances
Consumer Research Volume 10, 1983; pp. 409-415.
9. Arbuthnot Jack and Lingg Sandra, “A Comparison of French and American
Environmental Behaviors, Knowledge, and Attitudes”, International Journal of
Psychology, Volume 10, Issue 4 1975; pp. 275– 281.
10. Arcury A.Thomas, “Environmental Attitude and Environmental Knowledge” Human
Organization Volume 49, Number 4, Winter 1990, pp. 300–304.
Page 271
271
11. Aris Solomon and Linda Lewis, “Incentives and disincentives for corporate
environmental disclosure”, Business Strategy and the Environment, Volume 11, Issue 3,
2002; pp.154–169.
12. Azzone, G. and Manzini R., “Measuring styrategic environmental performance” Business
Strategy and the Environment, Vol. 3, 1994; pp. 1-15.
13. Bamberg, S.How does environmental concern influence specific environmentally related
behaviors? A new answer to an old question Journal of Environmental Psychology,
2003, Vol. 23, pp. 21–32.
14. Balderjahn I. “Personality variables and environmental attitudes as predictors of
ecologically responsible consumption patterns”, Journal of Business Research, Volume
17, Issue 1,1988; pp. 51-56.
15. Barr Stewart “Factors Influencing Environmental Attitudes and Behaviors: A U.K. Case
Study of Household Waste Management”, Environment and Behavior vol. 39 no. 4 July
2007; pp. 435-473.
16. Barrett S. Environmental regulations for Barrett, S., “Environmental Regulation for
Competitive Advantage”. Business Strategy Review, 2 : 1991; pp. 1–15.
17. Bhate Seema, “An examination of the relative roles played by consumer behavior settings
and levels of involvement in determining environmental behavior”, Journal of Retailing
and Consumer Services, Vol. 12, Iss : 6, November 2005; pp. 419-42.
18. Bloom, G.S. and Scott Morton, M.S., “Hazardous waste most ever uamager’s problem”.
Sloan Management Review, 1991; pp. 23-42.
19. Bodo B. Schlegelmilch, Greg M. Bohlen, Adamantios Diamantopoulos, (1996) "The link
between green purchasing decisions and measures of environmental consciousness",
European Journal of Marketing, Vol. 30 Iss: 5, pp.35–55.
20. Boer, J., “Sustainability labeling schemes: the logic of their claims and their functions for
stakeholders”, Business Strategy and the Environment, 12: 1995; pp. 254–264.
21. Bridget Martin and Antonis C. Simintiras, “The impact of green product lines on the
environment : does what they know affect how they feel?”, Marketing Intelligence &
Planning, Vol. 13 Iss : 4, 1995; pp.16–23.
Page 272
272
22. Butler Sara M. and Francis Sally, “The Effects of Environmental Attitudes on Apparel
Purchasing Behavior”, Clothing and Textiles Research Journal vol. 15 no. 2 March 1997;
pp. 76-85.
23. Carlson, Stephen J. Grove, Russell N. Laczniak and Norman Kangun “Does
environmental advertising reflect integrated marketing communication” journal of
business research, Vol. 15, 1996; pp. 36-42.
24. Caroline Gauthier, “Measuring Corporate Social and Environmental Performance : The
Extended Life-Cycle Assessment” Journal of Business Ethics, Volume 59, No.1-2, 2005
pp. 199-206.
25. Castro Paula, Garrido Margarida, Reis Elizabeth and Menezes Joao, “Ambivalence and
conservation behavior : An exploratory study on the recycling of metal cans” Journal of
Environmental Psychology Volume 29, Issue 1, March 2009; pp. 24-33.
26. Catherine A. Ramus and Ivan Montiel, “When Are Corporate Environmental Policies a
Form of Greenwashing?” Business Society, vol. 44 December 2005; pp. 377-414.
27. Chan Ricky Y. K., “Determinants of Chinese consumers green purchase behavior”
Psychology and Marketing, Vol. 18, Iss : 4, April 2001; pp 389–413.
28. Chao Yu-Long and Lam San-Pui “Measuring Responsible Environmental Behavior :
Self-Reported and Other-Reported Measures and Their Differences in Testing a
Behavioral Model”, Environment and Behavior 43: January 1, 2011 pp. 53-71.
29. `Chang, C. Feeling Ambivalent About Going Green Implications for Green Advertising
Processing The Journal of Advertising, 2011, Vol. 40(4), pp. 19-31.
30. Chinnici, G.and D'Amico, M. & Pecorino, B. A multivariate statistical analysis on the
consumers of organic products British Food Journal, 2002, Vol. 104(3/4/5), pp. 187-199.
31. Clinton J. Andrews “Environmental business strategy : Corporate leaders' perceptions”
Society and Natural Resources, July/August 1998, 11 (5); pp. 531–40.
32. Coddington W. 1993. Environmental Marketing : Positive Strategies for Reaching the
Green Consumer. McGraw-. Hill : New York. 1993.
33. Coddington Walter, “Environmental marketing's new relationship with corporate
environmental management”, environmental Quality Management, volume 2, Issue 3,
Page 273
273
spring 1993 pp. 297-302.
34. Conraud-Koellner Eva and Arturo Luis RIVAS-TOVAR “Study of Green Behavior with
a Focus on Mexican Individuals”, iBusiness, Vol.1 No.2, December 2009; pp.124-131.
35. Cowen Scott S., Ferreri Linda B., Parker Lee D. “The impact of corporate characteristics
on social responsibility disclosure : A typology and frequency-based analysis
Accounting”, Organizations and Society Volume 12, Issue 2, 1987; pp. 111-122.
36. Davies, A., Titterington, A. & Cochrane, C. Who buys organic food? A profile of the
purchasers of organic food in Northern Ireland British Food Journal, 1995, Vol. 97(10),
pp. 17-23.
37. Davis Joel J., “Ethics and environmental marketing” Journal of Business Ethics (eds).
Random : New York; 2001; pp. 233–346.
38. Davis, J. J., “Strategies for Environmental Advertising”, Journal of Consumer Marketing,
10 (2), 19 1993; pp. 36-69.
39. Decicco, J. M. and Thomas, M., “A Method for Green Rating of Automobiles”, Journal
of Industrial Ecology, 3 : 1999; pp. 55–75.
40. D’Souza Clare and Peretiatko Roman. “The nexus between industrialization and
environment : A case study of Indian enterprises”, Environmental Management and
Health, Vol. 13 Iss : 1, 2002; pp.80–97.
41. D'Souza Clare, "Ecolabel programmes: a stakeholder (consumer) perspective", Corporate
Communications: An International Journal, Vol. 9 Iss : 3, 2004; pp.179–188.
42. Duckitt John and Linda D. Cameron, “A Cross-Cultural Study of Environmental Motive
Concerns and Their Implications for Proenvironmental Behavior”, Environment and
Behavior vol. 38 no. 6 November 2006; pp. 745-767.
43. Eagly, A. H. and Carli, L (1981). "Sex of Researchers and Sex-Typed Communications
as Determinants of Sex Differences on Influenceability : A Meta-Analysis of Social
Influence Studies," Psychological Bulletin, 90 (1),pp 1-20.
44.. Eriksson Clas “Customer reaction towards the advertisements showing eco concern of the
companies”, Environmental Management and Health, Vol. 13 Iss : 1, 2002; pp.80–97.
Page 274
274
45. Everhart, D E, Shucard, J L, Quatrin, T and Shucard, D W (2001). "Sex-related
Differences”.
46. Fern K. Willits, “Environmental Attitudes and Behavior A Pennsylvania Survey”
Environment and Behavior, vol. 26 no. 2 March 1994; pp. 239-260.
47. First I. and Khetriwal, D. S., “Exploring the relationship between environmental
orientation and brand value : is there fire or only smoke?” Business Strategy and the
Environment, 19 : 2010; pp. 90–103.
48. Fischer E and, S J Arnold (1994). "Sex, Gender Identity, Gender Role Attitudes, and
Consumer Behavior," Psychology & Marketing, 11(2), 163-182.
49. Florian G. Kaiser, Britta Oerke and Franz X. Bogner, “Behavior-based environmental
attitude : Development of an instrument for adolescents”, Journal of Environmental
Psychology, Volume 27, Issue 3, September 2007; pp. 242-251.
50. Florian G. Kaiser, Michael Ranney, Terry Hartig and Peter A. Bowler, “Ecological
Behavior, Environmental Attitude, and Feelings of Responsibility for the Environment”,
European Psychologist Volume 4, Issue 2, June 1999; pp. 59-74.
51. Forbes Sharon L., Cohen A David., Ross Cullen, Stephen D. Wratten and Joanna
Fountain, “Consumer attitudes regarding environmentally sustainable wine: an
exploratory study of the New Zealand marketplace” Journal of Cleaner Production
Volume 17, Issue 13, September 2009; pp. 1195-1199.
52. Freeman R E. “Strategic Management: a Stakeholder Approach” Strategic Management
Journal, 26: 1984; pp. 541-555.
53. Fri RW., “The corporation as a non-governmental organization”. The Columbia Journal
of World Business 27 : 1992; pp. 91–95.
54. Friedman, M., "The social responsibility of business is to increase its profits", New York
Times Magazine, Vol. 33 No.30 September 1970; pp.122-125.
55. Gerard P. Prendergast and Edmund R. Thompson “Cynical Segmentation of
Environmental Markets : The Product of Marketers' Dispositions or Corporate
Demands?” Journal of Euromarketing Volume 6, Issue 4, 1998; pp. 17–34.
Page 275
275
56. Gert Cornelissen, Mario Pandelaere, Luk Warlop and Siegfried Dewitte “Positive cueing
: Promoting sustainable consumer behavior by cueing common environmental behaviors
as environmental”, International Journal of Research in Marketing, Volume 25, Issue 1,
March 2008; pp. 46-55.
57. Gilg Andrew, Barr Stewart and Ford Nicholas, “Green consumption or sustainable
lifestyles? Identifying the sustainable consumer” Journal of Environmental Psychology
Volume 30, Issue 1, 2010; pp. 80-94.
58. Giovanni Azzone, and Raffaella Manzini “Measuring strategic environmental
performance” Business Strategy and the Environment, 3.1, 1994; pp. 1-14.
59. Gonzalo Diaz Meneses and Asuncion Beerli Palacio, “Recycling Behavior : A
Multidimensional Approach” Environment and Behavior November 1, Vol. 37 : 2005;
pp. 837-860.
60. Goswami, P., “Is the urban Indian consumer ready for clothing with eco-labels?”
International Journal of Consumer Studies, 32: 2001; pp.438–446.
61. Greenan Kate, Paul Humphreys and Ronan McIvor, “The green initiative: improving
quality and competitiveness for European SMEs”, European Business Review, Vol. 97
Iss : 5, 1997; pp.208–214.
62. Hansen, E. “Forest certification and its role in marketing strategy”, Forest Products
Journal, 47 (3) 1997; pp. 16-22.
63. Harper, G. & Makatouni, A. Consumer perception of organic food production and farm
animal welfare British Food Journal, 2002, Vol. 104(3/4/5), pp. 287-299.
64. Hartmann Patrick Vanessa and Apaolaza-Ibanez, “Virtual Nature Experiences as
Emotional Benefits in Green Product Consumption: The Moderating Role of
Environmental Attitudes”, Environment and Behavior vol. 40 no. 6, November 2008; pp.
818-842.
65. Hawkins I. Del, Roger J. Best, Kenneth A. Coney (2003). Consumer Behaviour–Building
Marketing Strategy, Ninth Edition, Tata McGraw Hill, New Delhi.
66. Henry, P (2000). "Modes of Thought that vary Systematically with both Social Class and
Page 276
276
Age," Psychology and Marketing, May, 421-440.
67. Herrmann K Kristina., “Corporate Social Responsibility and Sustainable Development :
The European Union Initiative as a Case Study”, Indiana Journal of Global Legal Studies
11.2 2004; pp. 205-232.
68. Herzberg, F. Work and the Nature of Man. Cleveland : World Publishing Co.67. 1966.
69. Hoffman, A. J. From Heresy to Dogma: An Institutional History of Corporate
Environmentalism. San Francisco: New Lexington Press 1997; pp. 12-21.
70. Hussain, S. S., “Green Consumerism and Ecolabelling : A Strategic Behavioural Model”
Journal of Agricultural Economics, 51 : 2000; pp. 77–89.
71. Hutchinbson, C., “Integrating environmental policy with business strategy”, Long Range
Planning. Vol. 29 No. 1, 1996; pp. 1-10.
72. Hye-Shin Kim and Mary Lynn Damhorst, “Environmental Concern and Apparel
Consumption”, Clothing and Textiles Research Journal vol. 16 no. 3 June 1998; pp. 126-
133.
73. Hyllegard H. Karen , Ogle Jennifer Paff and Dunbar Brian H., “The Influence of
Consumer Identity on Perceptions of Store Atmospherics and Store Patronage at a
Spectacular and Sustainable Retail Site”, Clothing and Textiles Research Journal October
2006 vol. 24 no. 4 , 2006; pp. 316-334.
74. Indiana Mary "Modes of Thought that vary systematically with both Social Class and
Age," Psychology and Marketing, May, 421 -440.
75. Jain K. Sanjay and Sharma Kavita (2002)."Relevance of Personal Factors as Antecedents
of Consumer Involvement : An Exploration," Vision, January - June, 13 – 24.
76. K Suresh “Green Marketing, ed. Book, ICFAI Publications, vol. 1 pp. 237.
77. K.S.Chandrasekar, Marketing Management text and cases, tata Mc Graw hill education
pvt. Ltd. 2010 pp 12-15.
78. Kaiser, F. G. and Wilson, M., “Assessing People's General Ecological Behavior : A
Cross-Cultural Measure”, Journal of Applied Social Psychology, 30 : 2000; pp. 952–978.
Page 277
277
79. Kaiser, F., Wolfing, S. & Fuhrer, U. Environmental attitude and Ecological behavior
Journal of Environmental Psychology, 1999, Vol. 19, pp. 1-19.
80. Karns David A. and Khera Inder P. U.S., “consumer attitudes and home-heating
conservation behavior : A multiattribute longitudinal model”, Journal of Economic
Psychology, Volume 4, Issues 1-2, October 1983; pp.57-70.
81. Ken Peattie “Golden goose or wild goose? The hunt for the green consumer”. Business
Strategy and the Environment Volume 10, Issue 4, July/August 2001; pp. 87–199.
82. Kent L. Granzin, Janeen E. and Bottom Olsen, “ Characterizing Participants in Activities
Protecting the Environment : A Focus on Donating, Recycling, and Conservation
Behaviors”, Journal of Public Policy & Marketing Vol. 10, No. 2, Fall, 1991; pp. 1-27.
83. Keren Priyadarshini and Gupta K Omprakash., “Compliance to Environmental
Regulations : The Indian Context” International Journal of Business and Economics, Vol.
2, No. 1, 2003; pp 9-26.
84. Kilbourne William and Pickett Gregory, “How materialism affects environmental beliefs,
concern, and environmentally responsible behavior” Journal of Business Research
Volume 61, Issue 9, September 2008, pp. 885-893.
85. Kimerling Judith “Corporate Ethics in the Era of Globalization: The Promise and Peril of
International Environmental Standards” Journal of Agricultural and Environmental Ethics
Volume 14, Number 4, 2001; pp.425-455.
86. Kozup, J., Creyer, E. & Burton, S. Making Healthful Food Choices: The Influence of
Health Claims and Nutrition Information on Consumers' Evaluation of Packaged Food
Products and Restaurant Menu Items Journal of Marketing, 2003, Vol. 67, pp. 19-34.
87. Kulkarni Prasad, Times of India 23 March 2008, pp. 13.
88. Kumar Rajeev ,Consumer Behaviour: An applied orientation in Indian context, Ist
edition, Himalaya publishing house. 1997.
89. Kumar Sushil, “Be a Changemaker, join voluntary carbon markets”, Guest colums,
Financial Express, March 23, 2008.
90. Lam San-Pui. “What Makes Customers Bring Their Bags or Buy Bags from the Shop? A
Survey of Customers at a Taiwan Hypermarket”. Environment and Behavior, 38, May
Page 278
278
2006; pp. 318-332.
91. Laroche Michel, Bergeron Jasmin and Guido Barbaro-Forleo, "Targeting consumers who
are willing to pay more for environmentally friendly products", Journal of Consumer
Marketing, Vol. 18 Iss: 6, (2001) pp.503 –520.
92. Laroche Michel, Bergeron Jasmin, and Barbaro-Forleo Guido, "Targeting consumers
who are willing to pay more for environmentally friendly products", Journal of Consumer
Marketing, Vol. 18 Iss : 6, 2001; pp.503– 520.
93. Laufer William S., “Social Accountability and Corporate Greenwashing” Journal of
Business Ethics Volume 43, Number 3, 2007 pp. 253-261.
94. Lea, E. & Worsley, T. Australians’ organic food beliefs, demographics and values
British Food Journal, 2005, Vol. 107(11), pp. 855-869.
95. Liere Van, K. "Environmental Concern: Does it make a difference how it's measured?"
Environment and Behavior, 13 : 1981, pp. 651-676.
96. Lindzey, G., & Aronson, E. (1968 & 1985). The handbook of social psychology (2nd &
3rd ed.). New York: Random House.
97. Lin, Y. & Chang.C.A. Doubie Standard: The Role of Environmentai Consciousness in
Green Product Usage Journal of Marketing, 2012, Vol. 76, pp. 125-134.
98. Livesey Sharon M., “McDonald's and the Environmental Defense Fund : A Case Study of
a Green Alliance”, Journal of Business Communication vol. 36 January 1999; pp. 15-39.
99. Lockie, S., Lyons, K., Lawrence, G. & Mummery, K. Eating ‘Green’: Motivations
Behind Organic Food Consumption in Australia European Society for Rural Sociology,
2002, Vol. 42(1), pp. 23-40.
100. Lubna Kably “Towards a greener, cleaner world, Economic Times 30June 2007.
101. Lyon, T. P. and Maxwell, J. W., “Greenwash : Corporate Environmental Disclosure
under Threat of Audit”, Journal of Economics & Management Strategy, 20 2011; pp. 3–
41.
Page 279
279
102. Mainieri Tina, Barnett Elaine G., Valdero Trisha R., Unipan John B., and Oskamp Stuart,
“Green Buying : The Influence of Environmental Concern on Consumer Behavior”, The
Journal of Social Psychology, Volume 137, Issue 2, 1997, Pages 189–204.
103. Mayers C. K., France C. M. and Cowell S. J., Extended Producer Responsibility for
Waste Electronics : An Example of Printer Recycling in the United Kingdom”. Journal of
Industrial Ecology, 9: 2005; pp. 169–189.
104. McGuire, W. J. Attitudes and attitude change. In G. Lindzey & E. Aronson (Eds.),
Handbook of social psychology (3rd Ed., Vol. 2, pp. 233-346). 1985
105. Meinhold L. Jana and Malkus Amy J., “Environmental Behaviors Can Knowledge,
Attitudes, and Self-Efficacy Make a Difference?”, Environment and Behavior , vol. 37
no. 4, July 2005; pp. 511-532
106. Mendleson Nicola and Polonsky Jay Michael, "Using strategic alliances to develop
credible green marketing", Journal of Consumer Marketing, Vol. 12 Iss : 2, 1995; pp.4–
18
107. Mobley, A., Painter, T., Untch, E. & Unnava, H. Consumer Evaluation of Recycled
Products Psychology & Marketing, 1995, Vol. 12(3), pp. 165-176.
108. Moisander, J. Motivational complexity of green consumerism International Journal of
Consumer Studies, 2007, Vol. 31, pp. 404-409.
109. Mulhern, F J, Williams JD and Leone RP (1998). "Variability of Brand Price Elasticities
Across Retail Stores, "Journal of Retailing, 3, 427-445.
110. Nyborg Karine, Howarth B. Richard and Kjell Arne Brekke, “Green consumers and
public policy : On socially contingent moral motivation”, Resource and Energy
Economics, Volume 28, Issue 4, November 2006; pp. 351-366.
111. Olson, E. It’s not easy being green: the effects of attribute tradeoffs on green product
preference and choice J. of the Acad. Mark. Sci., 2012.
112. Oskamp Stuart , Harrington Maura J., Todd C. Edwards Deborah L. Sherwood, Shawn
M. Okuda and Deborah C. Swanson “Factors Influencing Household Recycling
Behavior” Environment and Behavior, vol. 23 no. 4 July 1991, pp. 494-519.
Page 280
280
113. Osterhus T L. “Pro-social consumer influence strategies : When and how do they work?”
Journal of Marketing, 61, 1997; pp. 16–29.
114. Ozkam Yasemin “The effect of some demographic Characteristics of Turkish Consumers
on their Socially Responsible Consumption Behaviors”, world applied science
Journal/IDOSI Publications, ISSN1818-49526 (7), 2009; 946-960.
115. Pickett-Baker, J. & Ozaki, R. Pro-environmental products: marketing influence on
consumer purchase decision Journal of Consumer Marketing, 2008, Vol. 25(5), pp. 281-
293.
116. Raghunathan, R., Naylor, R. & Hoyer, W. The Unhealthy = Tasty Intuition and Its
Effects on Taste Inferences, Enjoyment, and Choice of Food Products Journal of
Marketing, 2006, Vol. 70, pp. 170-184.
117. Razzaque, M. (1995), 'Demographics, Psychographics and Consumer Value Dimensions:
a Study of Consumers in a Traditional Asian Society', European Advances in Consumer
Research 2, 183-192.
118. Schlegelmilch, B., Arizona, B., Bohlen, G. & Diamantopoulos, A. The link between
green purchasing decisions and measures of environmental consciousness European
Journal of Marketing, 1996, Vol. 30(5), pp. 35-55.
Page 281
281
9. Appendices
Appendix 1
Questionnaire used for Physical survey(Offline mode):-
Survey Questionnaire
Dear Respondent,
This questionnaire is prepared regarding a research activity related to PhD program at ICFAI
University, Jharkhand on Green products. Green products can be stated as environment friendly
or sustainable products, organic in nature. I shall be highly grateful if you could spare a few
minutes to complete the questionnaire. There is no right or wrong answers to the questions.
Answers given by you will be kept confidential and used for academic purpose only.
1) Do you know about green products?
i) Yes ii) No
2) Do you buy green products?
i) Yes ii) No
3) How much do you spend in buying green products (monthly)?
________________________________________________________________________
4) Did you buy green products in this shopping trip?
i) Yes ii) No
5) What all green products did you buy in this shopping trip?
A) Green cosmetics products i) Yes ii) No
B) Green food products i) Yes ii) No
6) Name the green products you have bought _____________________________________
7) Reasons for buying the above mentioned green products
________________________________________________________________________
8) How much did you spend for buying green products in this shopping trip?
________________________________________________________________________
9) How frequently do you buy green products?
i) Less than once a month iii) Once a fortnight
Page 282
282
ii) Once a month iv) More than once a fortnight
Reasons_________________________________________________________________
Part -1
Environmental Consciousness:-
10) On a seven point scale (i.e. 1 = Very Strongly Disagree(VSD), 2 = Strongly
Disagree(SD) , 3 = Disagree(D) , 4 = Neither Agree Nor Disagree(NAD) , 5 = Agree(A) ,
6 = Strongly Agree(SA) , 7 = Very Strongly Agree(VSA)) , please indicate how strongly
you agree or disagree to the following statements.
Factors Views
VSD SD D NAD A SA VSA
I support different measures to improve water
management leading to water conservation
1 2 3 4 5 6 7
I am aware about the issues and problems related
to the environment
1 2 3 4 5 6 7
I would be willing to pay higher prices for water
1 2 3 4 5 6 7
It is very difficult for a person like me to do
anything about the environment
1 2 3 4 5 6 7
I believe that using recyclable materials for daily
use will improve the environment
1 2 3 4 5 6 7
Part -2
Price sensitivity
11) On a seven point scale (i.e. 1 = Very Strongly Disagree(VSD), 2 = Strongly
Disagree(SD) , 3 = Disagree(D) , 4 = Neither Agree Nor Disagree(NAD) , 5 = Agree(A) ,
6 = Strongly Agree(SA) , 7 = Very Strongly Agree(VSA)) , please indicate how strongly
you agree or disagree to the following statements.
Factors Views
VSD SD D NAD A SA VSA
In general the price or cost of buying green
products is important to me
1 2 3 4 5 6 7
I know that a new kind of green product is likely to
be more expensive than older ones , but that does
not matter to me
1 2 3 4 5 6 7
I am less willing to buy a green product if I think
that it will be high in price
1 2 3 4 5 6 7
I don’t mind paying more to try out a new green
product
1 2 3 4 5 6 7
A really good green product is worth paying a lot 1 2 3 4 5 6 7
Page 283
283
of money
I don’t mind spending a lot of money to buy a
green product
1 2 3 4 5 6 7
Part -3
Innovativeness
12) On a seven point scale (i.e. 1 = Very Strongly Disagree(VSD), 2 = Strongly
Disagree(SD) , 3 = Disagree(D) , 4 = Neither Agree Nor Disagree(NAD) , 5 = Agree(A) ,
6 = Strongly Agree(SA) , 7 = Very Strongly Agree(VSA)) , please indicate how strongly
you agree or disagree to the following statements.
Factors Views
VSD SD D NAD A SA VSA
I like to take a chance in buying new products
1 2 3 4 5 6 7
I like to try new and different products
1 2 3 4 5 6 7
I am the first in my circle of friends to buy a new
product when it appears in the market
1 2 3 4 5 6 7
I am the first in my circle of friends to experiment
with the brands of latest products
1 2 3 4 5 6 7
Part -4
Involvement
13) On a seven point scale (i.e. 1 = Very Strongly Disagree(VSD), 2 = Strongly
Disagree(SD) , 3 = Disagree(D) , 4 = Neither Agree Nor Disagree(NAD) , 5 = Agree(A) ,
6 = Strongly Agree(SA) , 7 = Very Strongly Agree(VSA)) , please indicate how strongly
you agree or disagree to the following statements.
Factors Views
VSD SD D NAD A SA VSA
I select the green products very carefully
1 2 3 4 5 6 7
Using branded green products helps me express my
personality
1 2 3 4 5 6 7
You can tell a lot about a person from whether
he/she buys green products
1 2 3 4 5 6 7
I believe different brands of green products would
give different amounts of satisfaction
1 2 3 4 5 6 7
Page 284
284
Part -5
Health consciousness
14) On a seven point scale (i.e. 1 = Very Strongly Disagree(VSD), 2 = Strongly
Disagree(SD) , 3 = Disagree(D) , 4 = Neither Agree Nor Disagree(NAD) , 5 = Agree(A) ,
6 = Strongly Agree(SA) , 7 = Very Strongly Agree(VSA)) , please indicate how strongly
you agree or disagree to the following statements.
Factors Views
VSD SD D NAD A SA VSA
I worry that there are chemicals in my food.
1 2 3 4 5 6 7
I worry that there are chemicals in my cosmetic
products
1 2 3 4 5 6 7
I’m concerned about my drinking water quality.
1 2 3 4 5 6 7
I avoid foods containing preservatives.
1 2 3 4 5 6 7
I read more health-related articles than I did 3
years ago.
1 2 3 4 5 6 7
I’m interested in information about my health. 1 2 3 4 5 6 7
I’m concerned about my health all the time. 1 2 3 4 5 6 7
Pollution in food and cosmetic products does not
bother me.
1 2 3 4 5 6 7
Part– 6
General characteristics about green cosmetic products
15) On a seven point scale (i.e. 1 = Very Strongly Disagree(VSD), 2 = Strongly Disagree(SD) ,
3 = Disagree(D) , 4 = Neither Agree Nor Disagree(NAD) , 5 = Agree(A) , 6 = Strongly
Agree(SA) , 7 = Very Strongly Agree(VSA)) , please indicate how strongly you agree or
disagree to the following statements with respect to green cosmetic products.
Factors Views
VSD SD D NAD A SA VSA
Green cosmetic products are safer to use than non-green
cosmetic products
1 2 3 4 5 6 7
Green cosmetic products are of better quality than non-
green cosmetic products
1 2 3 4 5 6 7
Green cosmetic products are more effective than non-
green cosmetic products
1 2 3 4 5 6 7
Page 285
285
Branded green cosmetic products are better than non-
branded green cosmetic products
1 2 3 4 5 6 7
Less knowledge about green cosmetic products prevent
people from buying them
1 2 3 4 5 6 7
Less information about green cosmetic products prevent
people from buying them
1 2 3 4 5 6 7
Less availability about green cosmetic products prevent
people from buying them
1 2 3 4 5 6 7
Green cosmetic products are expensive than non-green
cosmetic products
1 2 3 4 5 6 7
16) i) What is your experience of using green cosmetic products?
Not at
all
satisfied
1 2 3 4 5 6 7 Extremely
Satisfied
ii) Reasons
____________________________________________________________________
Part – 7
General characteristics about green food products
15) On a seven point scale (i.e. 1 = Very Strongly Disagree(VSD), 2 = Strongly Disagree(SD) , 3
= Disagree(D) , 4 = Neither Agree Nor Disagree(NAD) , 5 = Agree(A) , 6 = Strongly Agree(SA)
, 7 = Very Strongly Agree(VSA)) , please indicate how strongly you agree or disagree to the
following statements with respect to green food products.
Factors Views
VSD SD D NAD A SA VSA
Green food products are safer than non- green food
products
1 2 3 4 5 6 7
Green food products are healthier than non-green food
products
1 2 3 4 5 6 7
Green food products have more nutritional value than
non-green food products
1 2 3 4 5 6 7
Green food products are tastier than non-green food
products
1 2 3 4 5 6 7
Page 286
286
Less knowledge about green food products prevent
people from buying them
1 2 3 4 5 6 7
Less information about green food products prevent
people from buying them
1 2 3 4 5 6 7
Branded green products are better than non-branded
green food products
1 2 3 4 5 6 7
Green food products do not look good in appearance
1 2 3 4 5 6 7
Less availability about green food products prevent
people from buying them
1 2 3 4 5 6 7
Green food products are expensive
1 2 3 4 5 6 7
16) i)What is your experience of using green food products?
Not at
all
satisfied
1 2 3 4 5 6 7 Extremely
Satisfied
ii) Reasons - _______________________________________________________________
Part –8
Demographic information
Please supply the following details about yourself:-
Age:
a) 18 – 25 b) 26 – 35 c) 36 – 50 d) > 50
Gender:
a) Male b) Female
Last grade of school you completed:
a) High School b)Graduate c) Post – Graduation d)Others _____________________
Occupation:
a) Student b) Business c) Service d) Housewife e) Others
Income (monthly):
a) <25,000 b) 25,000– 49,999 c) 50,000 – 74,999
d) 75,000 – 99,999 e) >=1,00,000
Page 287
287
Number of members in the household:
a) < 2 b) 2 – 4 c) >= 5
Name:-______________________________________
Location: - ___________________________________
Contact No.-__________________________________ (optional)
----------------------------------Thank you very much for your time-------------------------------------
Page 288
288
Appendix 2
Questionnaire used for Online survey:-
Survey Questionnaire
Dear Respondent,
This questionnaire is prepared regarding a research activity related to PhD program at ICFAI
University, Jharkhand on Green products. Green products can be stated as environment friendly
or sustainable products, organic in nature. I shall be highly grateful if you could spare a few
minutes to complete the questionnaire. There is no right or wrong answers to the questions.
Answers given by you will be kept confidential and used for academic purpose only.
Thanks and regards
Sudipta Majumdar
Kolkata
09883138397
* Required
1) Do you know about green products? *
o Yes
o No
2) Do you buy green products? *
o Yes
o No
3) How much do you spend in buying green products (monthly)? *
Page 289
289
4) Did you buy green products in the last shopping trip? *
o Yes
o No
5) What all green products did you buy in that trip? *
o Green cosmetic products
o Green food products
6) How much did you spend for buying green products in the last shopping trip? *
7) How frequently do you buy green products? *
o Less than once a month
o Once a month
o Once a fortnight
o More than once a fortnight
8) On a seven point scale (i.e. 1 = Very Strongly Disagree, 2 = Strongly Disagree , 3 =
Disagree , 4 = Neither Agree Nor Disagree , 5 = Agree , 6 = Strongly Agree , 7 =
Very Strongly Agree) , please indicate how strongly you agree or disagree to the
following statements. *
1 2 3 4 5 6 7
I support different
measures to
improve water
management
leading to water
conservation
I am aware about
the issues and
problems related
to the
environment
I would be willing
to pay higher
Page 290
290
1 2 3 4 5 6 7
prices for water
It is very difficult
for a person like
me to do anything
about the
environment
I believe that
using recyclable
materials for daily
use will improve
the environment
9) On a seven point scale (i.e. 1 = Very Strongly Disagree, 2 = Strongly Disagree , 3 =
Disagree , 4 = Neither Agree Nor Disagree , 5 = Agree , 6 = Strongly Agree , 7 =
Very Strongly Agree) , please indicate how strongly you agree or disagree to the
following statements. *
1 2 3 4 5 6 7
In general the
price or cost of
buying green
products is
important to me
I know that a
new kind of
green product is
likely to be more
expensive than
older ones , but
that does not
matter to me
I am less willing
to buy a green
product if I think
that it will be
high in price
I don't mind
paying more to
try out a new
green product
Page 291
291
1 2 3 4 5 6 7
A really good
green product is
worth paying a
lot of money
I don't mind
spending a lot of
money to buy a
green product
10) On a seven point scale (i.e. 1 = Very Strongly Disagree, 2 = Strongly Disagree , 3
= Disagree , 4 = Neither Agree Nor Disagree , 5 = Agree , 6 = Strongly Agree , 7 =
Very Strongly Agree) , please indicate how strongly you agree or disagree to the
following statements. *
1 2 3 4 5 6 7
I like to take a
chance in buying
new green
products
I like to try new
and different
products
I am the first in
my circle of
friends to buy a
new product
when it appears
in the market
I am the first in
my circle of
friends to
experiment with
the brands of
latest products
11) On a seven point scale (i.e. 1 = Very Strongly Disagree, 2 = Strongly Disagree , 3
= Disagree , 4 = Neither Agree Nor Disagree , 5 = Agree , 6 = Strongly Agree , 7 =
Very Strongly Agree) , please indicate how strongly you agree or disagree to the
following statements. *
Page 292
292
1 2 3 4 5 6 7
I select the green
products very
carefully
Using branded
green products
help me to
express my
personality
You can tell a lot
about a person
from whether
he/she buys green
products
I believe different
brands of green
products would
give different
amount of
satisfaction
12) On a seven point scale (i.e. 1 = Very Strongly Disagree, 2 = Strongly Disagree , 3
= Disagree , 4 = Neither Agree Nor Disagree , 5 = Agree , 6 = Strongly Agree , 7 =
Very Strongly Agree) , please indicate how strongly you agree or disagree to the
following statements. *
1 2 3 4 5 6 7
I worry that there
are chemicals in
my food.
I’m concerned
about my drinking
water quality.
I avoid foods
containing
preservatives.
I read more health-
related articles
than I did 3 years
ago.
Page 293
293
1 2 3 4 5 6 7
I’m interested in
information about
my health.
I’m concerned
about my health all
the time.
I worry that there
are chemicals in
my cosmetic
products
Pollution in food
and cosmetic
products does not
bother me
13) On a seven point scale (i.e. 1 = Very Strongly Disagree, 2 = Strongly Disagree, 3
= Disagree, 4 = Neither Agree Nor Disagree, 5 = Agree, 6 = Strongly Agree, 7 = Very
Strongly Agree), please indicate how strongly you agree or disagree to the following
statements with respect to green cosmetic products. *
1 2 3 4 5 6 7
Green cosmetic
products are safer
to use than non-
green cosmetic
products
Green cosmetic
products are of
better quality than
non-green cosmetic
products
Green cosmetic
products are more
effective than non-
green cosmetic
products
Branded green
cosmetic products
are better than non-
branded green
cosmetic products
Less knowledge
Page 294
294
1 2 3 4 5 6 7
about green
cosmetic products
prevent people
from buying them
Less information
about green
cosmetic products
prevent people
from buying them
Less availability
about green
cosmetic products
prevent people
from buying them
Green cosmetic
products are
expensive than
non-green cosmetic
products
14)i)What is your experience of using green cosmetic products? *
o Not at all Satisfied (1)
o 2
o 3
o 4
o 5
o 6
o 7(Extremely Satisfied)
ii) Reasons
15) On a seven point scale (i.e. 1 = Very Strongly Disagree, 2 = Strongly Disagree , 3
= Disagree , 4 = Neither Agree Nor Disagree , 5 = Agree , 6 = Strongly Agree , 7 =
Page 295
295
Very Strongly Agree) , please indicate how strongly you agree or disagree to the
following statements with respect to green food products. *
1 2 3 4 5 6 7
Green food
products are safer
than non-green
food products
Green food
products are
healthier than non-
green food
products
Green food
products have
more nutritional
value than non-
green food
products
Green food
products are tastier
than non-green
food products
Less knowledge
about green food
products prevent
people from
buying them
Less information
about green food
products prevent
people from
buying them
Branded green
food products are
better than non-
branded green food
prducts
Green food
products do not
look good in
appearance
Page 296
296
1 2 3 4 5 6 7
Less availability
about green food
products prevent
people from
buying them
Green food
products are
expensive
16)i)What is your experience of using green food products? *
o Not at all Satisfied(1)
o 2
o 3
o 4
o 5
o 6
o (Extremely Satisfied)7
ii) Reasons
Please supply the following details about you
Please supply the following details about you
Age
o 18-25
o 26-35
o 35-50
o > 50
Gender
o Male
o Female
Last grade of school you completed:
o High School
o Graduate
o Post Graduate
Page 297
297
o Others
Occupation
o Student
o Business
o Service
o Housewife
o Others
Income(monthly)
o < 25,000
o 25,000 - 49,999
o 50,000 - 74,999
o 75,000 - 99,999
o >= 1,00,000
Number of members in the household
o < 2
o 2 - 4
o >=5
Name
Location
Contact Number
Submit
Never submit passwords through Google Forms.
Page 298
298
Appendix 3
Publications by the Scholar in the Research area
1. Majumdar, S and Swain, S. (2015). Mapping of Demographic Profile of Consumers vis-à-vis
Preference for Green Cosmetic Products: A Study in and around Kolkata, India. Household
& Personal Care Today, Italy, Vol. 10, Issue 6 , pp. 26 – 29, December, 2015.
2. Majumdar, S and Swain, S. (2015). Prioritization of Factors influencing Preferences for
Green Cosmetic Products: A Study in and around Kolkata (India). International Journal of
Trend in Research and Development, Vol 2, Issue 3, pp. 103 – 111,June, 2015.
3. Majumdar, S and Swain, S. (2015). Prioritization of Factors influencing Preferences for
Green Food Products: A Study in and around Kolkata (India). International Journal of
Research & Development in Technology and Management Science, Vol 21 , Issue 6, pp. 157
– 170, March , 2015
4. Majumdar, S and Swain, S. (2015). Identification of Factors influencing Preferences for
Green Products: A Study in and around Kolkata (India). Academicia (An International
Multidisciplinary Research Journal), Vol 5 , Issue 4, pp. 354 – 370, April , 2015
5. Majumdar, S and Swain, S. (2015). Identification and Analysis of Factors influencing
Preferences for Green Products: A Study in and around Kolkata (India). International Journal
of Business Quantitative Economics and Applied Management Research, Vol 1 , Issue 9, pp.
36 – 49, February , 2015
6. Majumdar, S (2014). Factor influencing Preferences for Green Products: A Literature
Review. IUJ Journal of Management, Vol 2, Issue 1, pp, May, 2014.