Date: 2015-11-01 IJS-DP-11965 Analysis of Financial News with NewsStream Petra Kralj Novak, Miha Grˇ car, Borut Sluban and Igor Mozetiˇ c Joˇ zef Stefan Institute Ljubljana, Slovenia {petra.kralj.novak, miha.grcar, borut.sluban, igor.mozetic}@ijs.si Abstract Unstructured data, such as news and blogs, can provide valuable in- sights into the financial world. We present the NewsStream portal, an in- tuitive and easy-to-use tool for news analytics, which supports interactive querying and visualizations of the documents at different levels of detail. It relies on a scalable architecture for real-time processing of a continu- ous stream of textual data, which incorporates data acquisition, cleaning, natural-language preprocessing and semantic annotation components. It has been running for over two years and collected over 18 million news articles and blog posts. The NewsStream portal can be used to answer the questions when, how often, in what context, and with what sentiment was a financial entity or term mentioned in a continuous stream of news and blogs, and therefore providing a complement to news aggregators. We illustrate some features of our system in four use cases: relations between the rating agencies and the PIIGS countries, reflection of financial news on credit default swap (CDS) prices, the emergence of the Bitcoin digital currency, and visualizing how the world is connected through news. Keywords: stream processing architecture, unstructured data, financial news, sentiment analysis, ontology-based entity recognition, visual analytics 1 Introduction Tens of thousands of news articles are being published daily on the world wide web by thousands of news sources. People usually track only a small number of stories from a selected set of news sources, since the articles from different sources are redundant and the number of news is unmanageable. News aggrega- tors group similar stories together and sort them according to their importance, making it easy to get an overview of the important stories of the day. By using the available on-line tools, it is, however, difficult to focus on specific entities and topics, search through their history, evaluate their relative importance, and observe the evolution of the context in which they appear over time. We present NewsStream (http://newsstream.ijs.si), a web portal for interactive and visual exploration of news and blogs. It allows to focus on spe- cific entities and topics from the financial domain, search through their history, 1 arXiv:1508.00027v2 [cs.IR] 7 Nov 2015
Transcript
Date: 2015-11-01 IJS-DP-11965
Analysis of Financial News with NewsStream
Petra Kralj Novak, Miha Grcar, Borut Sluban and Igor MozeticJozef Stefan InstituteLjubljana, Slovenia
Unstructured data, such as news and blogs, can provide valuable in-sights into the financial world. We present the NewsStream portal, an in-tuitive and easy-to-use tool for news analytics, which supports interactive querying and visualizations of the documents at different levels of detail. It relies on a scalable architecture for real-time processing of a continu-ous stream of textual data, which incorporates data acquisition, cleaning, natural-language preprocessing and semantic annotation components. It has been running for over two years and collected over 18 million news articles and blog posts. The NewsStream portal can be used to answer the questions when, how often, in what context, and with what sentiment was a financial entity or term mentioned in a continuous stream of news and blogs, and therefore providing a complement to news aggregators. We illustrate some features of our system in four use cases: relations between the rating agencies and the PIIGS countries, reflection of financial news on credit default swap (CDS) prices, the emergence of the Bitcoin digital currency, and visualizing how the world is connected through news.
Tens of thousands of news articles are being published daily on the world wideweb by thousands of news sources. People usually track only a small numberof stories from a selected set of news sources, since the articles from differentsources are redundant and the number of news is unmanageable. News aggrega-tors group similar stories together and sort them according to their importance,making it easy to get an overview of the important stories of the day. By usingthe available on-line tools, it is, however, difficult to focus on specific entitiesand topics, search through their history, evaluate their relative importance, andobserve the evolution of the context in which they appear over time.
We present NewsStream (http://newsstream.ijs.si), a web portal forinteractive and visual exploration of news and blogs. It allows to focus on spe-cific entities and topics from the financial domain, search through their history,
1
arX
iv:1
508.
0002
7v2
[cs
.IR
] 7
Nov
201
5
estimate the overall sentiment attached to them through time, evaluate the rela-tive importance of events, summarize the news through tag clouds, and observethe evolution of the context in which they appear. The main characteristic ofthis portal is in its focus on when something happened, how big was the storyand its sentiment ahead of what the event was. By doing so, the NewsStreamportal gives a novel perspective on the reporting in global news media. An-other unique aspect of NewsStream is its focus on the financial domain withlightweight semantics and sentiment analysis.
In three use cases, we exemplify different features of the querying and vi-sualization mechanisms and hint at a variety of investigations than could befurther performed by using the NewsStream portal. In the first use case, weseek for insights in the financial domain: we investigate the time-lines of newsabout credit rating agencies related to the European countries with increas-ing sovereign debt. The second use case studies the relation of economic newsand their sentiment to the CDS prices of a troubled eurozone country, Cyprus.The third use case describes the emergence of Bitcoin, a controversial digitalcurrency, which received widespread attention in 2013.
The basis of the NewsStream portal is DacqPipe, a data acquisition andprocessing pipeline. DacqPipe consists of a number of connected data analy-sis components, each performing some text processing operation. Dependingon the load, several pipelines can be run in parallel. Most of the DacqPipecomponents perform language-independent text processing with the exceptionof the semantic annotation component which is tailored to the financial domainby employing a domain-specific ontology of financial entities and terms. Theresult of DacqPipe are two databases: a set of annotated documents storedon the file system, and a dedicated database which supports efficient query-ing over specific, finance-oriented aspects of the news. The databases can bequeried through an API, which provides views, aggregates, and access to thedocuments. The applicability of the data collected and processed by DacqPipeis very diverse [20, 21, 5, 1]; one of the applications is the NewsStream webportal.
This report is organized as follows. Section 2 is dedicated to the descriptionof the architecture and details of the DacqPipe data acquisition and processingpipeline. Section 3 presents the main functionalities of the NewsStream por-tal which are then illustrated in three use cases. In Section 4, we provide anoverview of the related work, the relationship between NewsStream and othernews aggregation web sites, emphasize similarities and differences to those ap-proaches and present the complementarity and added value of NewsStream.Section 5 summarizes the presented work and gives directions for further devel-opment and research.
2 Data Acquisition and Processing
Our DacqPipe data acquisition and processing pipeline consists of a number ofinteroperating technologies. It is responsible for acquiring unstructured data
2
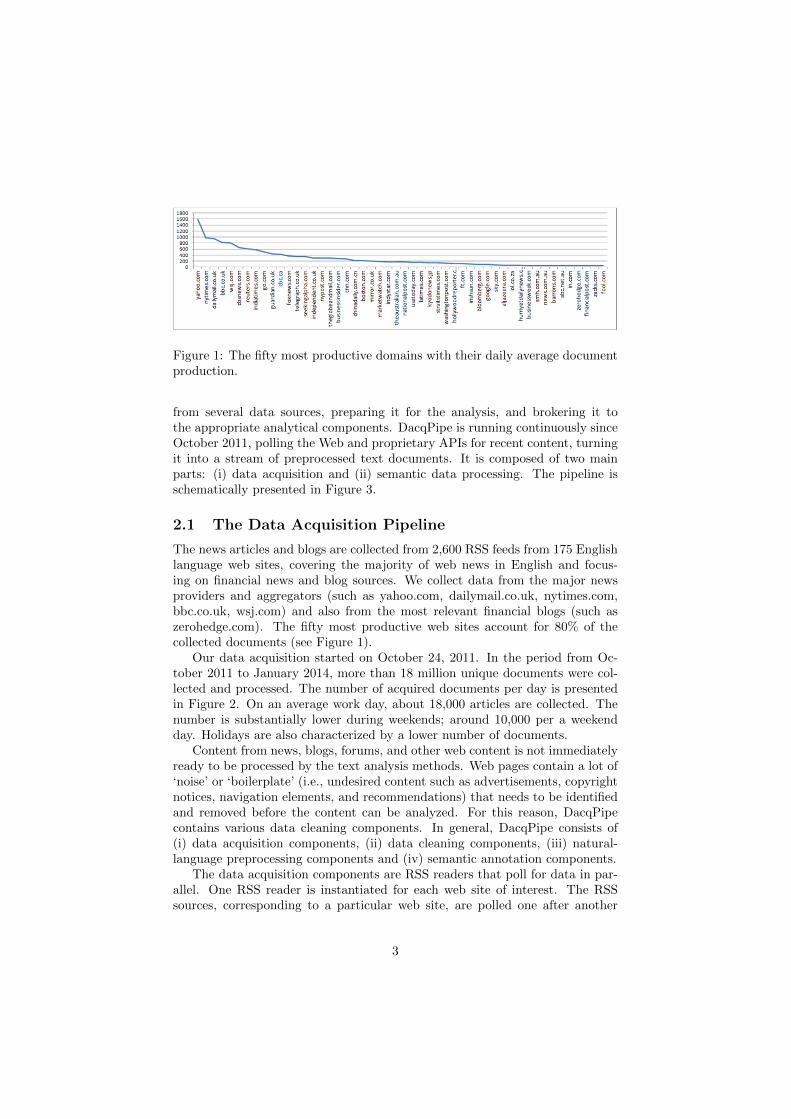
Figure 1: The fifty most productive domains with their daily average documentproduction.
from several data sources, preparing it for the analysis, and brokering it tothe appropriate analytical components. DacqPipe is running continuously sinceOctober 2011, polling the Web and proprietary APIs for recent content, turningit into a stream of preprocessed text documents. It is composed of two mainparts: (i) data acquisition and (ii) semantic data processing. The pipeline isschematically presented in Figure 3.
2.1 The Data Acquisition Pipeline
The news articles and blogs are collected from 2,600 RSS feeds from 175 Englishlanguage web sites, covering the majority of web news in English and focus-ing on financial news and blog sources. We collect data from the major newsproviders and aggregators (such as yahoo.com, dailymail.co.uk, nytimes.com,bbc.co.uk, wsj.com) and also from the most relevant financial blogs (such aszerohedge.com). The fifty most productive web sites account for 80% of thecollected documents (see Figure 1).
Our data acquisition started on October 24, 2011. In the period from Oc-tober 2011 to January 2014, more than 18 million unique documents were col-lected and processed. The number of acquired documents per day is presentedin Figure 2. On an average work day, about 18,000 articles are collected. Thenumber is substantially lower during weekends; around 10,000 per a weekendday. Holidays are also characterized by a lower number of documents.
Content from news, blogs, forums, and other web content is not immediatelyready to be processed by the text analysis methods. Web pages contain a lot of‘noise’ or ‘boilerplate’ (i.e., undesired content such as advertisements, copyrightnotices, navigation elements, and recommendations) that needs to be identifiedand removed before the content can be analyzed. For this reason, DacqPipecontains various data cleaning components. In general, DacqPipe consists of(i) data acquisition components, (ii) data cleaning components, (iii) natural-language preprocessing components and (iv) semantic annotation components.
The data acquisition components are RSS readers that poll for data in par-allel. One RSS reader is instantiated for each web site of interest. The RSSsources, corresponding to a particular web site, are polled one after another
3
Figure 2: The number of acquired documents per day. The blue color representsall acquierd documents, the red line represents unique documents, the green linerepresents first revisions of documents.
by the same RSS reader to prevent the servers from rejecting requests due toconcurrency. An RSS reader, after it has collected a new set of documentsfrom an RSS source, dispatches the data to one of several processing pipelines.The pipeline is chosen according to its current load which ensures proper loadbalancing. A processing pipeline consists of a boilerplate remover, duplicatedetector, language detector, sentence splitter, tokenizer, part-of-speech tagger,lemmatizer, stop-word detector and a semantic annotator. Some of the com-ponents are based on LATINO, our own text mining library [10], while othersuse the functionality from the OpenNLP library [2]. In the following, we brieflypresent the data processing components employed in DacqPipe.
Boilerplate Remover. Extracting meaningful content from Web pages presents achallenging problem which was already extensively addressed in the offline set-ting. Our setting, however, requires content extraction from streams of HTMLdocuments in real-time. The content extraction algorithm is efficient, unsuper-vised, and language-independent. It is based on the observation that HTMLdocuments from the same source normally share a common template. The coreof the proposed content extraction algorithm is a data structure called the URLTree. The performance of the algorithm was evaluated in a stream setting on atime-stamped semi-automatically annotated dataset which was also made pub-licly available [26]. It was shown that the algorithm clearly outperforms anextensive set of open-source boilerplate removal algorithms.
Duplicate Detector. Due to news aggregators and redirect URLs, one articlecan appear on the web with many different URLs pointing to it. To have aconcise dataset of unique articles, we developed a duplicate detector that is ableto determine whether the document was already acquired or not.
Language Detector. By using a machine learning model, the language detectorrecognizes the language and discards all the documents that are detected to be
4
Figure 3: The data acquisition, processing and semantic annotation pipeline.
5
non-English. The model is trained on a large multilingual set of documents.The basic features for the model training are frequencies of several consecutiveletters.
Sentence Splitter. The sentence splitter splits the text into sentences. The resultis the input to the part-of-speech tagger. We use the OpenNLP [2] implemen-tation of the sentence splitter.
Tokenizer. Tokenization is the process of breaking a text into words, phrases,symbols, or other meaningful elements called tokens. In DacqPipe, we use ourown implementation of tokenization, which supports the Unicode character setand is based on rules.
Part-of-Speech Tagger. The part-of-speech (POS) tagger marks tokens withtheir corresponding word type (e.g., noun, verb, proposition) based on the tokenitself and the context of the token. The part-of-speech tagger from the OpenNLPlibrary [2] is used.
Lemmatizer. Lemmatization is the process of finding the normalized formsof words appearing in text. It is a useful preprocessing step for a numberof language engineering and text mining tasks, and especially important forlanguages with rich inflectional morphology. In our data acquisition pipeline,we use LemmaGen [13], the most efficient publicly available lemmatizer trainedon large lexicons for various languages.
Stop-word Detector. In automated text processing, stop words are words that donot carry any semantic meaning. DacqPipe detects and annotates such words.
2.2 Semantic Data Processing
DacqPipe’s data acquisition, cleaning and natural-language preprocessing com-ponents are domain-independent and biased towards finance only by the selec-tion of RSS sources. Semantic data processing is, however, tailored to the fi-nancial domain by employing a domain-specific lightweight ontology of financialentities and terms. The ontology also includes gazetteers, and a dictionary ofpositive and negative words for dictionary-based sentiment analysis. A gazetteerspecifies the lexicographic information about possible appearances of an entityin text, and is used for named entity recognition (NER).
2.2.1 Ontology of Financial Entities and Terms
The ontology consists of three main categories: (i) financial entities, (ii) financialterms related to the latest financial crisis, and (iii) geographical entities. Most ofthe ontology was automatically constructed by integrating various data sources.The geographical entities (continents, countries, cities, organizations (such asEuropean Union and United Nations) and currencies) and the relations betweenthem were extracted from GeoNames (http://www.geonames.org/). We used
6
MSN Money (http://money.msn.com/) to link stocks to the companies thatissue them. We added a list of ‘over-the-counter’ stocks from OTC Markets(http://www.otcmarkets.com/home). The hierarchy of financial terms relatedto the financial crisis was developed in collaboration with economy experts. Itincludes the main European politicians and economy leaders (called “protago-nists”), central banks and other financial institutions, rating agencies, and fiscaland monetary policy terms. The class hierarchy of the ontology and the numberof concepts per class are given in Figure 4.
2.2.2 Semantic Annotator
Each entity in the ontology is associated with a gazetteer; a gazetteer specifiesrules which define possible appearances of the entity in text. For example,’The United States of America‘ can appear in text as ‘USA’, ‘US’, ‘The UnitedStates’ and so on. The rules include capitalization, lemmatization, and POS tagconstraints, ‘must contain’ constraints (i.e., term from another gazetteer mustbe detected in the document or in the sentence) and ‘followed by’ constraints.An example of a gazetteer attached to an entity is given in Figure 5.
2.2.3 Sentiment Analysis
Sentiment analysis is the computational study of how opinions, attitudes, emo-tions, and perspectives are expressed in language. There exist three main ap-proaches to sentiment analysis: rule-based, classification-based and the dictionary-based approach. In [19], the authors provide a survey of sentiment analysischallenges and the approaches used to tackle them. Specifics of opinion miningin news articles are described in [25]. The text classification approach involvesbuilding classifiers from labeled instances of texts or sentences. It is essentiallya supervised classification task. The dictionary-based approach involves cal-culating orientation for a document from the semantic orientation of words orphrases in the document. We use the dictionary-based approach, since we areconstrained by real-time performance and do not have a corpus of sentimentlabeled news articles.
We use the Harvard-IV-4 Sentiment Dictionary [29, 30] with 2,006 negativewords and 1,636 positive words. We compute document sentiment polarityaccording to Equation 1, where pos denotes the number of positive words in atext segment (paragraph or document) and neg denotes the number of negativewords in this same text segment. The range of document polarity is between−1 and 1, −1 being the most negative sentiment polarity, 1 the most positivesentiment polarity and 0 indicating neutral sentiment.
polarity =pos − neg
pos + neg(1)
For efficiency reasons, we have precomputed document sentiment polarityfor each of the stored documents and for each paragraph in the documents.We compute the sentiment per entity per day by aggregating the sentiment
7
Figure 4: The ontology of classes of financial objects with the number of in-stances (entities and terms) belonging to each class.
8
Figure 5: An example of a semantic entity and its gazetteer, encoded as triplesin the Notation 3 (or N3) format.
polarity of documents where an entity appears in a certain day. The aggregationfunction can either be sum (default) or average. The sentiment granularity level(sentiment scope) can be either document or paragraph.
By using this approach to sentiment analysis, we are able to automaticallydetect sentiment regarding an entity in real-time, and aggregate it on a dailybasis.
Semantic Annotation Database. The information about the terms (entities andsentiment words) and their location (paragraph, character position) in each doc-ument is stored in an SQL database. Additionally, the entity-class relationshipand the hierarchy of ontology classes is also stored. Various meta-data aboutthe document, including the document title, acquisition and publication time,source domain, response URL, allow the drill-down to the concrete document.Some aggregates, such as the sentiment polarity of each document and eachparagraph, are also precomputed and stored in the database for performancereasons. Such a database enables efficient and diverse querying.
We have implemented an API for data access. The API allows us to retrievedocument titles and response URLs, documents by sources, dates, recognizedentities, sentiment words and aggregated sentiment over documents/paragraphs.We use these and several other queries in our applications.
The use of the data collected and processed by DacqPipe is very diverse.There are already several applications which rely on the DacqPipe API suchas (i) a new measure of cohesiveness of news, the News Cohesiveness Index(NCI) [20], (ii) a method for constructing time varying co-occurrence networks ofentities from texts [21], (iii) a decision support model for estimating reputationrisk of a bank, based on the financial properties of the products it offers andthe sentiment about their counterparts [5], (iv) the detection of illegal ‘pumpand dump’ scenarios, where a low volume stock is heavily advertised (to pumpits price) and then sold (dumped) with a profit [1].
The rest of this paper is dedicated to a new application: the NewsStreamweb portal for news and blogs analytics. The portal allows everybody to easily
9
access and query our data.
3 The NewsStream Portal
NewsStream (http://newsstream.ijs.si) is a web-based interactive news andblogs analytics portal. Prior to what happened, it focuses on the questions (i)when something important happened, (ii) what was the amplitude (volume),and (iii) what was the related sentiment. Its main functionality is the projectionof relevant documents (news articles and blog posts) and their sentiment ontoa time-line, summarization of the documents by aggregation, and drill-down tothe original documents. The main features of NewsStream are:
• Visualization of occurrences and co-occurrences of financial and geograph-ical entities and financial terms, as lines, stacked lines or canyon flowcharts;
• Sentiment aggregation (either sum or average) in different scopes (docu-ment or paragraph);
• Retrieval of documents strictly related to finance;
• Adjustable window size for smoothing;
• Visualization of tag clouds that summarize the content of the documentsfor a selected day and entity (or entity pair);
• Drill-down to the individual annotated documents with hyper-links to theoriginals ordered by relevance to the query or by sentiment;
• Computation of trends with parametrized MACD (moving average con-vergence/divergence);
• Adjustable confidence level with min-occurrence per document;
• Intuitive and friendly user interface with drop-downs and automated querycompletion.
• Visualization of temporal country co-occurrence networks extracted fromnews and embedded on the world map.
These atomic operations can provide insight and help answering more pro-found questions. The basic use case of NewsStream is to visualize the numberof documents and aggregated sentiment of documents for selected entities or en-tity co-occurrences in time. Abnormalities in the fluctuation of the number ofdocuments reflect an entity or co-occurrence of entities being unusually presentin the news. The respective aggregated sentiment reflects the positive or nega-tive context in which the entity (or entities) occur. The contents summary bytag clouds is used to quickly gain insight in an event while the drill-down tothe specific articles allows in-depth investigations. The visualization of country
10
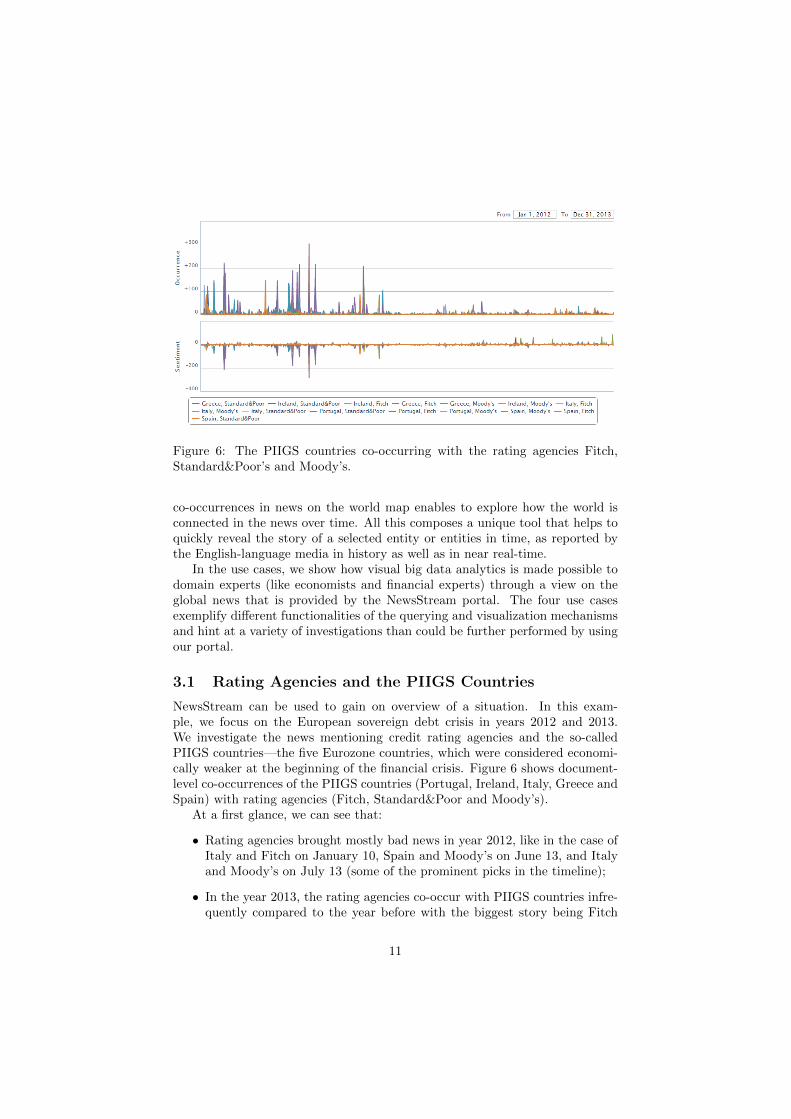
Figure 6: The PIIGS countries co-occurring with the rating agencies Fitch,Standard&Poor’s and Moody’s.
co-occurrences in news on the world map enables to explore how the world isconnected in the news over time. All this composes a unique tool that helps toquickly reveal the story of a selected entity or entities in time, as reported bythe English-language media in history as well as in near real-time.
In the use cases, we show how visual big data analytics is made possible todomain experts (like economists and financial experts) through a view on theglobal news that is provided by the NewsStream portal. The four use casesexemplify different functionalities of the querying and visualization mechanismsand hint at a variety of investigations than could be further performed by usingour portal.
3.1 Rating Agencies and the PIIGS Countries
NewsStream can be used to gain on overview of a situation. In this exam-ple, we focus on the European sovereign debt crisis in years 2012 and 2013.We investigate the news mentioning credit rating agencies and the so-calledPIIGS countries—the five Eurozone countries, which were considered economi-cally weaker at the beginning of the financial crisis. Figure 6 shows document-level co-occurrences of the PIIGS countries (Portugal, Ireland, Italy, Greece andSpain) with rating agencies (Fitch, Standard&Poor and Moody’s).
At a first glance, we can see that:
• Rating agencies brought mostly bad news in year 2012, like in the case ofItaly and Fitch on January 10, Spain and Moody’s on June 13, and Italyand Moody’s on July 13 (some of the prominent picks in the timeline);
• In the year 2013, the rating agencies co-occur with PIIGS countries infre-quently compared to the year before with the biggest story being Fitch
11
upgrading Greece credit rating on May 14, 2013 (this story was reportedsix times less then the downgrades one year earlier);
• More optimism is on the horizon in year 2013 since the sentiment of thereported news is predominantly positive. By using the drill-down func-tionality of NewsStream, we discover that the rating agency Fitch changedthe outlook to stable for Greek bonds.
We compare the co-occurrences of rating agencies and selected countries withthe country ratings data from CountryEconomy.com (http://countryeconomy.com/ratings). The credit rating changes are reported consistently. For exam-ple, the rating downgrade of Italy by Moody’s on February 13, 2012 was coveredby 210 articles the following day and the rating downgrade of Italy by Moody’s afew months later on July 13, 2012 was reported by 305 articles on the downgradeday. Not all the rating changes have the same media attention and, surprisingly,the media attention does not seem to decrease over time. The rating downgradesare also reported more than the upgrades.
3.2 Reflection of Financial News in CDS Prices
In this use case, we consider the European sovereign debt crisis and ask thequestion: what insights can we get from the NewsStream portal about theevolution of the crisis and what are the relations to the financial markets? Weshow that the portal can guide one (1) to detect emerging topics through canyon-flow visualization, (2) to get a condensed overview of relevant news through tagclouds, (3) to track the evolution of the sentiment through time, and (4) to drillall the way down to individual news.
First, we focus on the financial news about the PIIGS countries (Portugal,Ireland, Italy, Greece, and Spain) and Cyprus, nicknamed PIIGSC. The relativedistribution of news between the PIIGSC individual countries during the lastyear is in Figure 7 (note that the window size is one week, to allow for smoothtransitions of occurrences). One can observe that the interest in the most prob-lematic country, Greece, has mostly disappeared after the onset of the crisisin 2008. Also, the attention to Spain has decreased, while it has increased forIreland. There is very few news about Portugal, with a notable jump in July2013. Cyprus is mostly ignored until March 2013, when one observes a hugeincrease in the number of news concerning Cyprus.
Next, we focus on the news concerning Cyprus in conjunction with the entity‘eurozone’ during March 2013. The top chart in Figure 8 shows the volume ofjoint occurrences of both terms in the number of paragraphs (not documents),while the bottom chart shows the sentiment associated with both terms in thesame paragraph. One observes a large increase in the number of news fromMarch 12 to March 18, an initial positive sentiment (until March 15), and thena sharp drop in sentiment until March 18.
A summary of news can be represented by a tag cloud. Figure 9 gives twotag clouds for March 15: the first one is constructed from the titles of news,while the second one is constructed from the ontology entities recognized in
12
Figure 7: Canyon flow of financial news about the PIIGS countries (Portugal,Ireland, Italy, Greece, and Spain) and Cyprus.
Figure 8: Top - Joint occurrences of Cyprus and ‘eurozone’ in the number ofparagraphs. Bottom - The sentiment associated with both terms in the sameparagraph.
13
Figure 9: Left - A tag cloud of titles of documents mentioning Cyprus andeurozone. Right - A tag cloud of ontology entities recognized in the news bodies,together with Cyprus and eurozone.
the bodies of the news. The size of a tag is proportional to the number ofoccurrences of the term in the news. Cyprus is prevailing in both clouds (nosurprise, since it is part of the query). However, it is interesting to observethe difference: while titles emphasize ‘bailout’, the news themselves emphasizeEU related terms (Brussels, Europe, European Union, eurozone), InternationalMonetary Fund and United States.
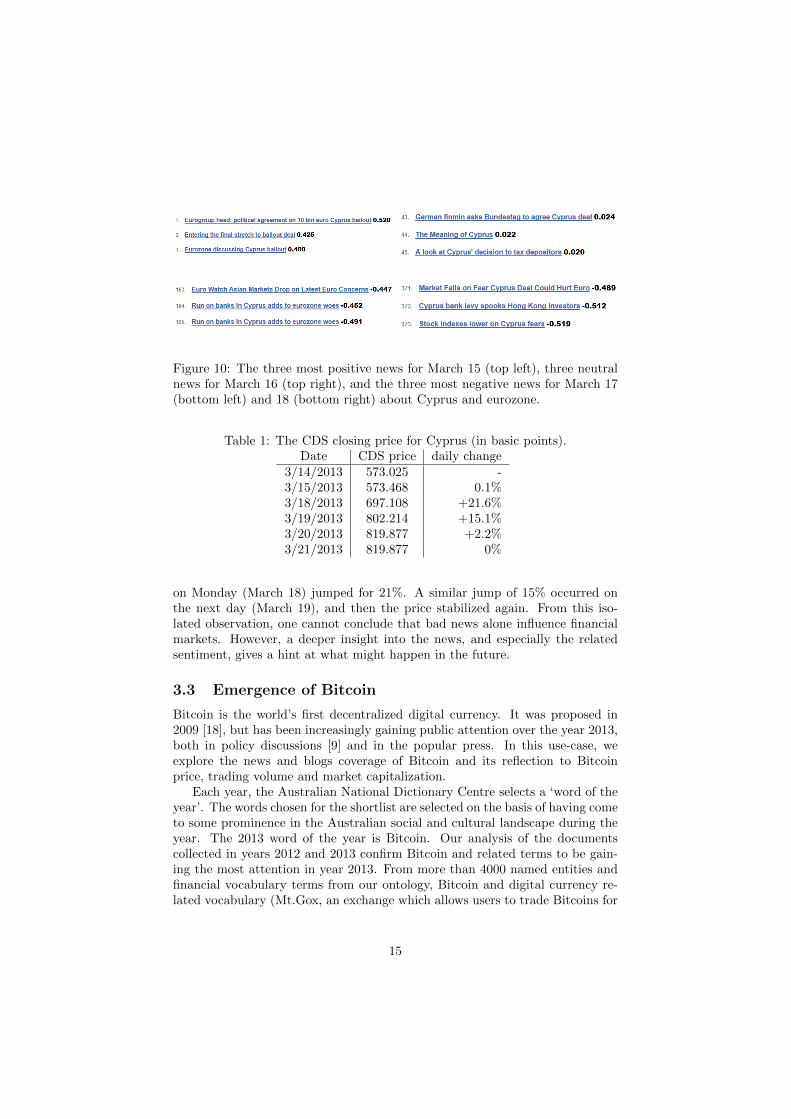
The tag clouds for the subsequent days are very similar, so they offer noinsight into why the sentiment about Cyprus and eurozone changed. One hasto dig into the individual news for the following four days. Figure 10 gives thethree most positive news for March 15, the three neutral news for March 16, andthe three most negative news for March 17 and 18. From the titles alone, it isobvious that there was an initial agreement on the Cyprus bailout which evokedpositive sentiment in the news. However, during the weekend (March 16 and17) more details of the deal were revealed which culminated in the sentimentdrop on March 18.
It is interesting to observe what was going on in the financial markets at thesame time. The perception of financial markets about an individual countryis usually reflected in the price of its sovereign bonds or CDS (credit defaultswap). Essentially, a CDS is insurance for the buyer of the country bonds inthe case that the country is unable to repay its debt (declares a default). Thehigher price of CDS reflects the perception of the higher risk of default. Wecompare the sentiment about Cyprus to the closing price of CDS in the middleof March 2013 (see Table 1). CDS prices are given in basic points (b.p.), i.e.,100 b.p. equals 1% of the underlying bond value.
Until the emergence of Cyprus in the media (March 15), the CDS priceswere stable (albeit relatively high in comparison to the other eurozone coun-tries). After the weekend (March 16 and 17) of negative news, the closing price
14
Figure 10: The three most positive news for March 15 (top left), three neutralnews for March 16 (top right), and the three most negative news for March 17(bottom left) and 18 (bottom right) about Cyprus and eurozone.
Table 1: The CDS closing price for Cyprus (in basic points).Date CDS price daily change
on Monday (March 18) jumped for 21%. A similar jump of 15% occurred onthe next day (March 19), and then the price stabilized again. From this iso-lated observation, one cannot conclude that bad news alone influence financialmarkets. However, a deeper insight into the news, and especially the relatedsentiment, gives a hint at what might happen in the future.
3.3 Emergence of Bitcoin
Bitcoin is the world’s first decentralized digital currency. It was proposed in2009 [18], but has been increasingly gaining public attention over the year 2013,both in policy discussions [9] and in the popular press. In this use-case, weexplore the news and blogs coverage of Bitcoin and its reflection to Bitcoinprice, trading volume and market capitalization.
Each year, the Australian National Dictionary Centre selects a ‘word of theyear’. The words chosen for the shortlist are selected on the basis of having cometo some prominence in the Australian social and cultural landscape during theyear. The 2013 word of the year is Bitcoin. Our analysis of the documentscollected in years 2012 and 2013 confirm Bitcoin and related terms to be gain-ing the most attention in year 2013. From more than 4000 named entities andfinancial vocabulary terms from our ontology, Bitcoin and digital currency re-lated vocabulary (Mt.Gox, an exchange which allows users to trade Bitcoins for
15
Table 2: The top five named entities and financial vocabulary terms gaining themost prominence in year 2013 compared to year 2012. #2012 and #2013 arethe number of documents mentioning the entity in the respective year and lastcolumn is the ratio of the two values .
Figure 11: Bitcoin occurrence timeline and Bitcoin market capitalization in year2013. The first significant wave of news reports about Bitcoin started just afterBitcoin has reached market capitalization of $500 Million on March 14, 2013.
US Dollars, and other synonyms of digital currency, like cryptocurrency) gotthree out of top five placements (Table 2). Less than a thousand documentsmentioned Bitcoin in year 2012 and more then thirty-eight thousand documentsmentioned Bitcoin in 2013.
The Bitcoin occurrence timeline (Figure 11, top) shows us when articlesabout Bitcoin stopped being solitaires but gained popularity in mainstreammedia. The first significant wave of news reports about Bitcoin started just afterBitcoin has reached market capitalization of $500 Million on March 14, 2013 (seeFigure 11, bottom), probably contributing to the increase on the demand forBitcoin. As Bitcoin reached the price of $200 in April and market capitalizationjust over $1.7 Billion on April 11, 2013, payment processors BitInstant andMt.Gox experienced processing delays due to insufficient capacity resulting in
16
Figure 12: The three most positive (left) and three most negative (right) newson Bitcoin on April 11, 2013. The first number next to the title is the documentsentiment and the second number is the occurrence count of the term ’Bitcoin‘in the document.
Figure 13: Tag cloud of document titles of documents about Bitcoin on Octo-ber 2 and October 26 2013.
the Bitcoin exchange rate dropping from $266 to $76 before returning to $160within six hours. We use the NewStresm drill-down functionality to look at thedocuments about Bitcoin on that day. By sorting the documents by sentiment,one can easily access the most positive and negative documents of the day.Figure 12 shows the titles of the three most positive documents (top) and thetitles of the most negative documents (bottom).
The Bitcoin occurrence timeline (Figure 11, top) shows when news aboutBitcoin were reported. It is just a click away to see the documents summarizedby tag clouds. The tag clouds of titles of documents mentioning Bitcoin onOctober 3 and 26, 2013 (two peeks in the October occurrence timeline) arepresented in Figure 13. It is easy to see that on October 3, 2013 the Silk Roadwebsite was shut down and on October 26, 2013, $28 Million in Bitcoin wereseized by US prosecutors in the related federal investigation. On the web portal,the titles of the documents are listed below the tag clouds in order of relevance,giving further meaning to the tag clouds.
By using NewsStream, we can relatively easily reconstruct the Bitcoin story.The first Bitcoin ATM in Canada, the US Senate hearing on Bitcoin, Bitcoins be-ing accepted as a tuition payment by a university and Bitcoin reaching the priceof $1000 all happened in November 2013, enforcing the Bitcoin price growth and
17
market capitalization. The most reported news about Bitcoin was the Chinacentral bank banning financial companies from using the digital currency in thebeginning of December 2013. The European Banking Authority issued a warnon Bitcoin in mid December 2013, followed by the Indian Central Bank at theend of December 2013.
The Bitcoin example is ideal for studying the relation between the financialentity on the market and in the news, since it is, up to now, unregulated. Byusing the NewsStream portal, we can see that Bicoin first gained a decent mar-ket capitalization, followed by mass media attention and, in turn, even biggerdemand on exchanges that allow trading Bitcoins for US Dollar.
We have demonstrated the functionality of the NewsStream portal in threediverse use-cases. By starting from an entity (or entities) of interest, NewsStreamfirst answers the questions when something was reported about the entity, howbig were the stories and what was the associated sentiment. The drill-down toindividual events is supported by tag clouds and listings of underlying docu-ments ordered by relevance or sentiment. The NewsStream portal thus gives anovel perspective on the reporting in global news media.
3.4 Entity Co-occurence Network Visualization
Within the NewsStream portal we have also implemented a visualization of en-tity co-occurrences over time. At first we limit ourselves to countries as entitiesof interest, and represent significant co-occurrences by a network of links be-tween countries. We employ the significance algorithm proposed in [21] to showonly links between countries, that did not co-occur in the news by change. Thenetwork is embedded into the world map, which enables an intuitive presenta-tion of the relations between countries that significantly co-occur in the news.The temporal dimension can be explored in monthly snapshots, and the signif-icance threshold of the visualized links can be adjusted to views only the mostsignificant links. Figure 14 shows the interactive visualization of the countryco-occurrence network.
Tracking entity co-occurrences over time can give many insights into varioustypes of relations between entities, ranging from collaborations or partnershipsto conflicts or lawsuits. Entity co-occurrence networks extracted from news havea great potential for exploring the semantics among entities, and identifyinggroups of entities that co-occur in different contexts. The temporal aspect ofthe network reveals the emergence and decline of topics in the news, as well asthe entities’ participation in these topics. Furthermore, the network can be alsocompared to other real-world networks to discover any structural similaritiesthat might explain how the majority of news is formed.
4 Related Work
The analysis of large quantities of news is an emerging area in the field of dataanalysis and visualization [15]. According to Thomas and Cook (2005) [31],
18
Figure 14: Interactive visualization of the country co-occurrence network inNewsStream.
Visual Analytics is the science of analytical reasoning supported by interac-tive visual interfaces. In [15], the three challenges of visually representing newsstreams are identified: First, when dealing with thousands of articles, articlescannot be shown in full detail, and often not even all the titles can be displayed.Second, the timeline approach is inappropriate for some applications, since theold news lose importance and are replaced by the updates or completely dif-ferent information. Furthermore, keeping all the historic news in the displayis infeasible for both, space and performance reasons. Third, in many cases,articles from various sources report on the same topic, producing a lot of redun-dancy. The NewsStream portal addresses the above challenges by decomposingthe analysis into two steps, the information volume and the information content,allowing the user to focus on the desired timespan and content.
Current visual techniques that deal with temporal evolution of such complexdatasets, together with research efforts in related domains, such as text miningand topic detection and tracking, represent early attempts to understand, gaininsight and make sense of these data. Lack of techniques dealing directly withthe problem of visualizing news streams in an ‘on-line’ fashion is identified in[15]. The authors propose a purely visual technique that permits to see the evo-lution of news in real-time. A visual analytics system for exploration of newstopics in dynamic information streams, which combines interactive visualizationand text mining techniques to facilitate the analysis of similar topics that splitand merge over time is presented in [17]. CloudLines [14] is a time-series vi-sualization technique of time-based representations of large and dynamic eventdata sets in limited space. Timeriver [11] visualizes thematic variations overtime within a large collection of documents. The ‘river’ flows from left to right
19
through time, changing width to depict changes in thematic strength of tem-porally associated documents. In [12], both, the user interaction and technicaldetails for visual analysis of constantly evolving text collections, are described.Our work is most similar to [16], where temporal analysis of occurrence andco-occurrence of entities in news is studied, but there the sentiment is not con-sidered.
Besides the research efforts in the area of news analytics, there are severalgroups of applications that collect news and blogs information, process themand serve them with added value to the interested users. Here we presentthe relationship between NewsStream and news aggregation web sites, newsmedia monitoring services and Google Trends. We emphasize similarities anddifferences to those approaches and present the complementarity and addedvalue of NewsStream.
4.1 News Aggregation Websites
News aggregation websites periodically read a set of news sources, find the newbits, group similar stories together, sort the stories according to their importanceand display the aggregated information to the user. The aggregation can beentirely automatic (as in Google News, Newslookup, Newsvine, World NewsNetwork, and Daily Beast) or semi-automatic, as in the case of JockSpin. Acomparison of news aggregator services in terms of their features and usabilityfrom the users’ perspective is presented in [6].
Similarly to news aggregators, NewsStream’s data acquisition pipeline isconnected to RSS feeds and regularly pools and processes the data. In contrastto news aggregators which focus on providing a quick overview of the mainnews of the day, NewsStream provides a historical view on news about selectedentities, focusing on their importance and sentiment.
4.2 Media Monitoring Services
Europe Media Monitor (EMM, http://emm.newsbrief.eu/) [4, 3] is a newsaggregation and analysis system to support EU institutions. It gathers reportsfrom news portals world-wide in 60 languages, classifies the articles, analyses thenews by extracting information from them, aggregates the information, issuesalerts and produces intuitive visual presentations. It monitors over 10000 RSSfeeds and HTML pages from 3750 key news portals world-wide plus 20 com-mercial news feeds and, for some applications, also specialist sites. It retrievesover 150.000 reports per day in 60 languages. The EMM news gathering enginefeeds its articles into automatic public news analysis systems [27]: NewsBrief [28]and MediSys focus on the breaking news and short-term trend detection, earlyalerting and up-to-date category-specific news display, while NewsExplorer fo-cuses on daily overviews, long-term trends, in-depth analysis and extraction ofinformation about people and organizations.
While the focus of European Media Monitor is to detect events in near real-time, our focus is a comprehensive overview of news about entities over time.
20
Similarly to NewsExplorer which detects names of persons, organizations andlocations, we detect entities from our financial ontology. While NewsExplorer fo-cuses on the description of entities by gathering and summarizing the extractedmeta-information on individual news pages, NewsStream focuses on news aboutentities by showing volumes and aggregated sentiment of news and tag-cloudsmentioning those entities over time.
In addition to the European Media Monitor, there are several commercialmedia monitoring services (also called press clipping services), which provideclients with copies of media content, of specific interest to them. These ser-vices tend to specialize their coverage by subject, industry, size, geography,publication, journalist, or editor. PickANews (http://www.pickanews.com/),for example, is a European multimedia search engine indexing over 50,000 me-dia sources (print, web, radio and TV). Results can be analysed by country andtype of media. The engine allows users to search for article extracts by keyword,company, brand, product or person. In PickANews, the search and viewing ofextracts is free, while subscriptions are required for the alert service by keyword,full content access and visualizing key indicators. Other commercial news mon-itoring services include MSBA News Clipping Service (http://www.mnmsba.org/NewsClippingService) and WebClipping (http://webclipping.com/).
4.3 Google Trends
Google Trends [8] is a public web facility of Google Inc. for displaying searchquery trends. It shows how often a particular term has been entered into GoogleSearch relative to the total search-volume across various regions of the world,and in various languages (starting from 2004). The results can be further refinedby region and time period. Google Trends has weekly data granularity.
The Google Trends data were used in studies in a variety of fields, for examplein health to predict the spread of influenza [7] and in finance and economy torelate search query volumes to financial time-series. Search volume data andfinancial market fluctuations have been investigated by [24] showing that weeklytransaction volumes of S&P 500 companies are correlated with weekly searchvolume of the corresponding company names. Patterns in Google query volumesfor search terms related to finance may be interpreted as “early warning signs”of stock market moves [22]. Another study reports a correlation between acountry’s GDP and the degree to which Internet users worldwide seek moreinformation about years in the future than years in the past [23].
Similar to Google Trends, NewsStream also shows a term occurrence overtime. While Google Trends shows the occurrence of terms from search queries,NewsStream shows the occurrence of terms in news articles and financial blogposts. The search query volumes are therefore a complement to media monitor-ing, as they measure the activity of regular users on the web.
21
5 Conclusions and Further Work
We have presented NewsStream, a visual news analytics platform which focuseson the question when something happened, and what were the amplitude (vol-ume) and sentiment about the event, prior to what happened. The portal allowsto focus on specific entities and topics, search through their history, estimatethe overall sentiment attributed to those entities through time, evaluate the rel-ative importance of events, summarize collections of news with tag clouds, andobserve the evolution of the context in which they appear. It is, therefore, acomplementary service to news aggregators and news monitoring services. Wehave demonstrated the usefulness of NewsStream in four different use cases: (i)study of co-occurrences of rating agencies and the PIIGS countries, (ii) reflec-tion of financial news in CDS prices, (iii) the emergence of the Bitcoin digitalcurrency, and (iv) visualizing how the world is connected through news.
The paper describes the architecture and details about our data acquisitionand processing pipeline of (financial) news and blog posts, which acquires, cleansand processes about 40,000 documents (mainstream news and financial blogs)daily in near real time. The underlying database supports efficient queryingover specific, finance-oriented aspects of the news.
NewsStream is being further developed in various EU-funded projects. Weare working on an inverted index of the documents that will allow querying forarbitrary words in the documents as well as the ontology instances and higher-level terms. We also plan to include topic detection to ease the interpretationof the events on time-lines. Another direction for further work is the general-ization to other languages. Large parts of our data acquisition and processingpipeline are language independent (e.g., the boilerplate remover and the dupli-cate detector), many language dependent components are already developed formany languages (e.g., the lemmatizer and the stop word detector). We havestarted collecting the news for the Slovenian language as well. Interesting re-search questions emerge from the availability of such data, for example, theempiric comparison between the visibility and delay of news in its country oforigin and in the global news.
To summarize, by making our visual news analytics platform available on theweb, we provide an intuitive and easy-to-use use tool for massive news analytics.By putting the questions when something happened, how big was the story, andwhat was the related sentiment, ahead of what the event was, the NewsStreamportal gives a novel view on the reporting in global news media.
Acknowledgements
This work was supported in part by the European Commission under the FP7project FOC (Forecasting financial crises, grant no. 255987), and by the Slove-nian Research Agency programme Knowledge Technologies (grant no. P2-103).NewsStream is being used, adapted, and further developed in the following EU-funded projects: SIMPOL (Financial Systems Simulation and Policy Modelling,
22
grant no. 610704), MULTIPLEX (Foundational Research on MULTIlevel com-PLEX networks and systems, grant no. 317532), and DOLFINS (DistributedGlobal Financial Systems for Society, grant no. 640772). We also thank SasoRutar and Matjaz Jursic for their help in solving various technical and concep-tual issues.
References
[1] Irina Alic, Michael Siering, and Marko Bohanec. Hot stock or not? Aqualitative multi-attribute model to detect financial market manipulation.D. L. Wigand), pp. 64-77, June, 9-13:64–77, 2013.
[2] Apache. OpenNLP, 2010.
[3] M. Atkinson and E. Van Der Goot. Near real time information mining inmultilingual news. In Proceedings of the 18 th International World WideWeb Conference (WWW’2009), pages 1153–1154, 2009.
[4] C. Best, E. van der Goot, K. Blackler, T. Garcia, and D. Horby. EuropeMedia Monitor. Technical Report EUR 22173 EN, European Commission,2005.
[5] Marko Bohanec, Giorgio Aprile, Maria Costante, Morena Foti, and NejcTrdin. Decision support model for the assessment of bank reputational risk.Proc. 16th Intl. Conf. Information Society, pp. 11-14, October 7-11, pages11–14, 2013.
[6] Sudatta Chowdhury and Monica Landoni. News aggregator services: userexpectations and experience. Online Information Review, 30(2):100–115,2006.
[7] Jeremy Ginsberg, Matthew H. Mohebbi, Rajan S. Patel, Lynnette Bram-mer, Mark S. Smolinski, and Larry Brilliant. Detecting influenza epidemicsusing search engine query data. Nature, 457(7232):1012–1014, Nov 2008.
[8] Google. How does google trends work, official site, 2010.
[9] Reuben Grinberg. Bitcoin: An innovative alternative digital currency.Hastings Science & Technology Law Journal, 4:160, 2011.
[10] Miha Grcar. Mining Text-Enriched Heterogeneous Information Networks.PhD thesis, Jozef Stefan International Postgraduate School, Ljubljana,Slovenia, 2015.
[11] Susan Havre, Beth Hetzler, and Lucy Nowell. Themeriver: Visualizingtheme changes over time. In Proc. IEEE Symposium on Information Visu-alization, pages 115–123, 2000.
23
[12] Elizabeth G. Hetzler, Vernon L. Crow, Deborah A. Payne, and Alan Turner.Turning the bucket of text into a pipe. In John T. Stasko and Matthew O.Ward, editors, INFOVIS, page 12. IEEE Computer Society, 2005.
[13] Matjaz Jursic, Igor Mozetic, Tomaz Erjavec, and Nada Lavrac. Lemmagen:Multilingual lemmatisation with induced ripple-down rules. Journal ofUniversal Computer Science - J.UCS, 16(9):1190–1214, may 2010. http:
[14] M. Krstajic, E. Bertini, and D. Keim. Cloudlines: Compact display ofevent episodes in multiple time-series. IEEE Transactions on Visualizationand Computer Graphics, 17(12):2432–2439, Dec 2011.
[15] Milos Krstajic, Enrico Bertini, Florian Mansmann, and Daniel A. Keim.Visual analysis of news streams with article threads. In StreamKDD ’10:Proceedings of the First International Workshop on Novel Data StreamPattern Mining Techniques, pages 39–46, New York, NY, USA, 2010. ACM.
[16] Milos Krstajic, Florian Mansmann, Andreas Stoffel, Martin Atkinson, andDaniel A. Keim. Processing Online News Streams for Large-Scale Seman-tic Analysis. In Proceedings of the 1st International Workshop on DataEngineering meets the Semantic Web (DESWeb 2010), 2010.
[17] Milos Krstajic, Mohammad Najm-Araghi, Florian Mansmann, andDaniel A. Keim. Incremental Visual Text Analytics of News Story Devel-opment. In Pak Chung Wong, David L. Kao, Ming C. Hao, Chaomei Chen,Robert Kosara, Mark A. Livingston, Jinah Park, and Ian Roberts, editors,Proceedings of Conference on Visualization and Data Analysis (VDA ’12),2012.
[18] Satoshi Nakamoto. Bitcoin: a peer-to-peer electronic cash system, http:
// bitcoin. org/ bitcoin. pdf . Retrieved January 24, 2009.
[19] Bo Pang and Lillian Lee. Opinion mining and sentiment analysis. Founda-tions and Trends in Information Retrieval, 2(1-2):1–135, 2008.
[20] Matija Piskorec, Nino Antulov-Fantulin, Petra Kralj Novak, Irena Voden-ska, and Tomislav Smuc. Cohesiveness in financial news and its relation tomarket volatility. Scientific Reports, 4:5038, 2014.
[21] Marko Popovic, Hrvoje Stefancic, Borut Sluban, Petra Kralj Novak, MihaGrcar, Michelangelo Puliga, Igor Mozetic, and Vinko Zlatic. Extractionof temporal networks from term co-occurrences in online textual sources.PLoS ONE, 9(12):e99515, 2014.
[22] Tobias Preis, Helen Susannah Moat, and H. Eugene Stanley. Quantify-ing trading behavior in financial markets using google trends. ScientificReports, 3, Apr 2013.
24
[23] Tobias Preis, Helen Susannah Moat, H. Eugene Stanley, and Steven R.Bishop. Quantifying the advantage of looking forward. Scientific Reports,2, Apr 2012.
[24] Tobias Preis, Daniel Reith, and H Eugene Stanley. Complex dynamics ofour economic life on different scales: insights from search engine query data.Philosophical Transactions of the Royal Society A: Mathematical, Physicaland Engineering Sciences, 368(1933):5707–5719, Nov 2010.
[25] Thomas Scholz, Stefan Conrad, and Isabel Wolters. Comparing differentmethods for opinion mining in newspaper articles. In Gosse Bouma, Ash-win Ittoo, Elisabeth Metais, and Hans Wortmann, editors, Natural Lan-guage Processing and Information Systems, volume 7337 of Lecture Notesin Computer Science, pages 259–264. Springer, 2012.
[26] Borut Sluban and Miha Grcar. URL Tree: Efficient unsupervised contentextraction from streams of web documents. In ACM International Confer-ence on Information and Knowledge Management (CIKM 2013), 2013.
[27] Ralf Steinberger, Bruno Pouliquen, and Erik Van der Goot. An intro-duction to the europe media monitor family of applications. InformationAccess in a Multilingual World - Proceedings of the SIGIR 2009 workshop,pages 1–8, 2009.
[28] Hristo Tanev, Jakub Piskorski, and Martin Atkinson. Real-time news eventextraction for global crisis monitoring. In Proceedings of the 13th inter-national conference on Natural Language and Information Systems: Ap-plications of Natural Language to Information Systems, NLDB ’08, pages207–218, Berlin, Heidelberg, 2008. Springer-Verlag.
[29] P. C. Tetlock, M. Saar-Tsechansky, and S. Macskassy. More than words:Quantifying language to measure firms’ fundamentals. Journal of Finance,2007.
[30] Paul C. Tetlock. Giving Content to Investor Sentiment: The Role of Mediain the Stock Market. The Journal of Finance, 62(3):1139–1168, June 2007.
[31] James J. Thomas and Kristin A. Cook. Illuminating the Path: The Re-search and Development Agenda for Visual Analytics. National Visualiza-tion and Analytics Ctr, 2005.