Page 1
Analysis of Fluidized-Bed and Fluidized-Bed-Membrane
Reactor Concepts for Oxidative Coupling of Methane
Vorgelegt von
M. Sc.
Setarehalsadat Sadjadi
geb. in Tehran
von der Fakultät III – Prozesswissenschaften
der Technischen Universität Berlin
zur Erlangung des akademischen Grades
Doktor der Ingenieurwissenschaften
- Dr. –Ing. -
genehmigte Dissertation
Promotionsausschuss:
Vorsitzenderin: Prof. Dr. Tetyana Morozyuk (TU Berlin)
Gutachter: Prof. Dr.-Ing. habil. Prof. h.c. Dr. h.c. Günter Wozny (TU Berlin)
Gutachter: Prof. Dr. Reinhard Schomäcker (TU Berlin)
Gutachter: Prof. Dr. ir. Martin van Sint Annaland (TU Eindhoven)
Tag der wissenschaftlichen Aussprache: 23 September 2015
Berlin 2016
Page 3
ABSTRACT
Oxidative Coupling of Methane (OCM) is a reaction for converting methane, as
the main component of natural gas, directly to ethylene. The importance of OCM
is based on the economic interest of ethylene which can be used widely in
different chemical processes.
Currently about 150 billion cubic meters of methane are flared or vented annually
which leads to production of about 400 million tonnes of carbon dioxide each
year. This makes OCM of great environmental benefit as well because of the
current non-sustainable use of natural gas. However, OCM research has not found
its industrial application till now after almost three decades of research, due to low
yields of ethylene production.
This work is focused on applicability of the fluidized-bed reactor (FBR) concept
for OCM and testing the novel idea of fluidized-bed membrane reactor (FBMR)
for the first time on OCM. In the course of this work, two FBRs and one FBMR
have been tested in pilot-plant scale. All reactors are installed in the UniCat OCM
mini-plant based in Technische Universität Berlin.
FBRs have the advantage of providing an isothermal catalyst bed to prevent hot-
spot formation, which is one of the main problems of OCM due to highly
exothermic reactions. The FeCrAlloy reactor is designed for studying the material
influence on OCM FBRs and to see if this material can provide better results in
contrast with OCM stainless steel reactors. The reactor of the same dimensions
was designed using quartz glass as the reactor material, as it is an inert material to
have a base of comparison. Different reaction temperatures and reactant
compositions have been tested for both reactors and the highest C2 yield achieved
from FeCrAlloy FBR was 20% (methane conversion of 49%) at low nitrogen
content of 40%. The maximum C2 yield achieved from the quartz glass reactor in
the same conditions was 23% (methane conversion of 47%). The results showed
the applicability of FeCrAlloy for OCM although it shows lower performance in
Page 4
comparison with quartz glass because of material reactivity at high temperatures,
however, the difference is not so significant and it can be even lower in larger
scales where the effect of the reactor wall material decreases. The scale of FBRs
used in this work is one of the largest OCM FBRs reported in accessible literature
and the C2 yield obtained is the highest as well.
The FeCrAlloy FBR was modified by installing two membranes in order to study
the novel concept of OCM FBMR, resulting in a performance enhancement
achieved by dosing oxygen inside the fluidized-bed through the membranes. In
this case, the fluidized-bed provides an isothermal catalyst bed and the
membranes provide distributed dosage of oxygen, supplying the advantages of
both fluidized-bed and membrane reactors in one reactor. The highest C2 yield
achieved from this reactor was 19.5% with a gas flow containing 55% nitrogen
dilution, which is a 2% improvement of C2 yield in comparison with the result
from the FeCrAlloy FBR without membranes at the same conditions (17.5% C2
yield).
The catalyst used for most of the experiments was 2.2%Na2WO4-2%Mn/SiO2,
prepared by incipient wetness impregnation. Two other catalysts were prepared,
by coating in a fluidized bed granulator, as well as a catalyst prepared on a
monolithic ordered mesoporous silica support. However, the performance of these
two catalysts was not as promising as the conventional catalyst prepared by
incipient wetness impregnation.
The second chapter of this work is a detailed explanation of experimental set-up
used in this work. The experimental results from fluidized-bed reactors and
fluidized-bed membrane reactor are discussed in chapter 3 and 4. The last chapter
is about conclusion and the new ideas for the future work.
Page 5
ZUSAMMENFASSUNG
Die oxidative Kopplung von Methan (OCM) ist eine Reaktion zur direkten
Umwandlung von Methan, einem Erdgasbestandteil, zu Ethen. Die Bedeutung der
OCM beruht auf dem wirtschaftlichen Interesse an Ethen, welches vielseitig in der
chemischen Industrie eingesetzt werden kann. Außerdem ist die OCM von
großem Nutzen für die Umwelt aufgrund der derzeitig nicht nachhaltigen Nutzung
von Erdgas. Jährlich werden ungefähr 150 Milliarden Kubikmeter Methan
verbrannt oder abgelassen, was zu einer jährlichen Produktion von ca. 400
Millionen Tonnen Kohlendioxid führt. OCM kann aufgrund der aktuell nicht
nachhaltigen Nutzung von Erdgas von großem ökologischen Nutzen sein. Jedoch
konnte die OCM-Forschung auch nach 3 Jahrzehnten aufgrund der niedrigen
Ethylen-Ausbeute noch zu keiner industriellen Anwendung führen.
Diese Arbeit konzentriert sich auf die Anwendbarkeit des Wirbelschichtreaktor-
Konzepts (FBR) für die OCM und die erstmalige Testung der neuartigen Idee
eines Wirbelschichtmembranreaktors (FBMR) für die OCM. Im Laufe dieser
Arbeit wurden zwei FBR und ein FBMR im Pilotmaßstab getestet. Alle Reaktoren
sind aufgebaut in der Unicat OCM-Miniplant der Technischen Universität Berlin.
FBRs haben den Vorteil eines isothermen Katalysatorbetts, wodurch die Bildung
von Hot Spots durch stark exotherme Reaktionen unterbunden wird, eines der
Hauptprobleme der OCM. Der FeCrAlloy-Reaktor wurde entwickelt, um bei
OCM FBRs den Materialeinfluss zu untersuchen, und um zu sehen, ob dieses
Material bessere Ergebnisse erzeugen kann im Vergleich zu Edelstahl-OCM-
Reaktoren. Ein Reaktor gleicher Dimensionen wurde aus inertem Quarzglas
entwickelt, um als Vergleichsbasis zu dienen. Verschiedene
Reaktionstemperaturen und Zusammensetzungen der Edukte wurden in beiden
Reaktoren untersucht. Im FeCrAlloy-Wirbelschichtreaktor konnte eine maximale
C2-Ausbeute von 20 % (Methan-Umwandlung von 49 %) bei niedriger Stickstoff-
Verdünnungszusammensetzung von 40 % erreicht werden. Die maximal erreichte
Page 6
C2-Ausbeute im Quarzglas-Reaktor bei gleichen Konditionen lag bei 23 %
(Methan-Umwandlung bei 47 %). Die Ergebnisse zeigen die Eignung von
FeCrAlloy für die OCM, obwohl die Leistung etwas niedriger war im Vergleich
zum Quarzglasreaktor, aufgrund der Materialreaktivität bei hohen Temperaturen.
Die Differenz ist nicht signifikant und kann weiter verringert werden bei größeren
Maßstäben, wo der Einfluss der Reaktorwand nachlässt. Die FBRs in dieser
Arbeit sind unter den größten bisher gemeldeten, auch im Vergleich zu aktueller
Literatur, und die C2-Ausbeute ist höher als anderweitig berichtet.
Der FeCrAlloy-FBR wurde modifiziert, um innen zwei Membranen einzubauen,
um das neuartige Konzept eines OCM FBMRs zu untersuchen, was zu einer
Leistungssteigerung durch Dosierung von Sauerstoff durch die Membranen in das
Wirbelbett führte. In diesem Fall liefert Wirbelschicht ein isothermes
Katalysatorbett und die Membranen erzeugen verteilte Dosierung von Sauerstoff,
wodurch die Vorteile von FBR und Membranreaktor in einem Reaktor vereint
werden können. Die höchste C2-Ausbeute dieses Reaktors lag bei 19,5 % mit
einem Gasfluss mit 55 % Stickstoff Verdünnung, was eine 2% ige Verbesserung
der C2-Ausbeute im Vergleich zum FeCrAlloy-FBR ohne Membranen unter
gleichen Bedingungen (17,5% C2-Ausbeute) ist.
Für die meisten Experimente wurde ein 2,2 % Na2WO4-2 % Mn/SiO2-Katalysator
verwendet, welcher über das Feuchte-Imprägnierverfahren hergestellt wurde.
Außerdem kamen ein mit dem Wirbelschichtgranulierer hergestellter und ein 2,2
% Na2WO4-2 % Mn-Katalysator auf monolithischem Silica-Träger zum Einsatz.
Allerdings zeigten die Katalysatoren aus der Feuchte-Imprägnier-Herstellung die
besten Ergebnisse.
Das zweite Kapitel dieser Arbeit beinhaltet die detaillierte Erklärung zum
Versuchsaufbau. Die experimentellen Ergebnisse des Wirbelschichtreaktors
werden in Kapitel 3 ausführlich besprochen, die Ergebnisse des Wirbelschicht-
Membran-Reaktors werden in Kapitel 4 diskutiert. Das letzte Kapitel präsentiert
neue Ideen für die Zukunft.
Page 7
To Simin and Jalal
my beloved parents
Page 8
ACKNOWLEDGEMENTS
I wish to express my sincere thanks to my supervisor Prof. Dr.-Ing. Günter Wozny
for his full support of my work. I learned a lot from him during my PhD at DBTA.
He was a supervisor who left my hands open and flexible on my project but at the
same time gave me the best advices when I needed them, during our discussions.
He is a great teacher and a great engineer like a never-ending source of
knowledge.
I would also say my thanks to my second supervisor Prof. Schomäcker who
supported and helped me with his comments and remarks on scientific topics and
he opened my eyes on different aspects of my work.
I am grateful to Dr. Godini for his scientific support during my project. He shared
his outstanding knowledge on OCM with me and he taught me what a good
scientific work should focus on. And I am also thankful to Dr. Stanislav Jaso who
supervised my work during my master studies and leaded me to my PhD thesis in
the same direction and never left me unanswered whenever I needed his help
during my project.
My special thanks go to my colleague and friend Dr. Ulla Simon who was not just
a great scientist who helped me a lot with our scientific collaboration but also a
kind friend who supported me a lot during my PhD. She was a source of
motivation for me on my work and whenever I lost a little bit of hope, she was the
one who encouraged me to go further.
I place on record, my thanks to Dr. Jean-Philippe Lonjaret, the managing director
of BIG-NSE graduate school, for his kind supports for me to be part of BIG-NSE
school, being the one who helped me with all he could whenever I needed. I also
use this opportunity to say my thanks to my BIG-NSE 2011 batch colleagues and
friends Laura, Daniel, Moritz, Fanni, Patrick, Gengwen and the others for the
good moments I shared with them in Berlin experiencing a new phase of life and
exchange different scientific experiences as well as life experience with them.
Page 9
I also use this opportunity to show my love to my friends in crime Leo, Maria,
Albert and Andreas that without them and the sweet moments we had as friends at
TU Berlin I couldn’t finish this work.
I thank my friends Pazhareh, Arezoo, Asadeh, Hamid, Parisa, Saeed, Kaveh, Hoda
and Firuzeh who were my second family in Berlin and the life could be really
hard for me, far from Tehran, without them and their love. They certainly played a
big role for me finishing my PhD. I also want to thank my flatmates Maja, Nicole
and Tilman who made our shared-flat like home for me and tolerated my stressful
times during my PhD.
The last but not the least, I want to thank my parents Simin and Jalal who I
couldn’t be where I am without them. They supported me in every phase of my
life, especially during my PhD although they are themselves having really hard
time dealing with cancer disease without me being there for them but still they are
an infinite source of love for me. They are who I turn to first when I face difficult
times and who I share with them first the happiness of my achievements.
Page 11
CONTENTS
1 INTRODUCTION ................................................................................................................................................... 1
1.1 NATURAL GAS, METHANE AND CONVERSION ROUTS ..................................................................................... 1
1.1.1 Direct Conversion of Natural Gas to Ethylene .............................................................................. 4
1.2 NA2WO4-MN/SIO2 CATALYST FOR OCM ....................................................................................................... 6
1.3 FLUIDIZED-BED AND FLUIDIZED-BED MEMBRANE REACTORS FOR OCM .................................................. 8
1.3.1 Fluidized-bed Reactor ............................................................................................................................ 9
1.3.2 Fluidized-bed-membrane Reactor ................................................................................................. 16
1.4 REACTOR MATERIAL ......................................................................................................................................... 21
1.5 ELEVATED PRESSURE INFLUENCE ON OCM .................................................................................................. 21
1.6 OBJECTIVES OF THIS THESIS ............................................................................................................................. 22
2 EXPERIMENTAL SET-UPS & PROCEDURES ............................................................................................. 26
2.1 FLUIDIZED-BED REACTORS .............................................................................................................................. 26
2.1.1 FeCrAlloy Reactor ................................................................................................................................. 26
2.1.2 Quartz Glass Reactor ........................................................................................................................... 29
2.2 FLUIDIZED-BED MEMBRANE REACTOR ........................................................................................................... 30
2.3 UNICAT OCM MINI-PLANT ............................................................................................................................... 34
2.3.1 P&ID of the reactor set-up ................................................................................................................ 36
2.3.2 Process Control System ...................................................................................................................... 37
2.3.3 Gas Analysis IR and Micro-GC .......................................................................................................... 38
2.3.3.1 Sick S700 Gas Analyzer ................................................................................................................................. 38
2.3.3.2 Varian Online Micro-GC ................................................................................................................................ 39
2.4 SEM/EDX .......................................................................................................................................................... 42
2.5 EXPERIMENTS PROCEDURE AND EXPERIMENTAL DESIGN .......................................................................... 42
3 FLUIDIZED-BED REACTORS, RESULTS AND DISCUSSION .................................................................. 46
3.1 EMPTY REACTORS AND FECRALLOY OXIDATION ......................................................................................... 46
3.2 QUARTZ GLASS FLUIDIZED-BED REACTOR .................................................................................................... 50
3.2.1 Temperature and Methane to Oxygen Ratio Influence for 2.2%Na2WO4-2%Mn/SiO2
Catalyst................................................................................................................................................................ 51
3.2.2 Dilution Influence for 2.2%Na2WO4-2%Mn/SiO2 Catalyst ................................................... 57
3.2.3 Monolithic Silica Support Catalyst ................................................................................................ 60
3.2.4 Fluidized Granulator Catalyst ......................................................................................................... 63
Page 12
3.3 FECRALLOY FLUIDIZED-BED REACTOR ......................................................................................................... 67
3.3.1 Temperature and Methane to Oxygen Ratio Influence for 2.2%Na2WO4-2%Mn/SiO2
Catalyst ............................................................................................................................................................... 67
3.3.2 Fluidization Velocity Influence for 2.2%Na2WO4-2%Mn/SiO2 Catalyst ......................... 72
3.3.3 Dilution Influence for 2.2%Na2WO4-2%Mn/SiO2 Catalyst .................................................. 74
3.3.4 Elevated Pressure ................................................................................................................................. 76
3.3.5 Stability Test .......................................................................................................................................... 79
4 FLUIDIZED-BED MEMBRANE REACTOR, RESULTS AND DISCUSSION ............................................ 81
4.1 EXPERIMENTAL RESULTS ................................................................................................................................. 82
4.1.1 5500 ml/min Total Gas Flow, 5-12% of Fluidization Gas through Membranes .......... 84
4.1.2 5500 ml/min Total Gas Flow, 12-20% of Fluidization Gas through Membranes ....... 90
4.1.3 6000 ml/min Total Gas Flow, ~10% of Fluidization Gas through Membranes ........... 92
5 CONCLUSION AND OUTLOOK ....................................................................................................................... 96
5.1 CONCLUSION ....................................................................................................................................................... 97
5.2 OUTLOOK TO FUTURE WORKS ......................................................................................................................... 99
5.2.1 Fluidized-bed Reactor ........................................................................................................................ 99
5.2.2 Fluidized-bed Membrane Reactor ............................................................................................... 100
6 REFERENCES.................................................................................................................................................... 104
7 APPENDICES .................................................................................................................................................... 116
7.1 APPENDIX A- P&ID OF THE REACTOR SYSTEM ......................................................................................... 117
7.2 APPENDIX B – MINIMUM FLUIDIZATION VELOCITY CALCULATION ....................................................... 118
7.3 APPENDIX C – INFRARED GAS ANALYZER CALIBRATION ......................................................................... 120
7.4 APPENDIX D - MICRO-GC CALIBRATION .................................................................................................... 121
Page 13
LIST OF TABLES
TABLE 1-1 SOME ADVANTAGES AND DISADVANTAGES OF FLUIDIZED-BED REACTORS. 13
TABLE 1-2 DIFFERENT STUDIES WITH FLUIDIZED-BED REACTORS FOR OCM. 15
TABLE 2-1 MEMBRANES SPECIFICATIONS USED FOR FBMR. 33
TABLE 2-2 MICRO-GC CALIBRATION PEAK IDENTIFICATION. 40
TABLE 3-1 ETHYLENE/ETHANE RATIO FROM MESOSPORUS SILICA CATALYST IN FLUIDIZED-BED
REACTOR AT 800°C. 62
TABLE 3-2 RESULTS OF MINIPLANT-SCALE FLUIDIZED-BED REACTORS AT 830 °C, CH4/O2=2, TOTAL
FLOW=5 L/MIN, 40% N2. X IS FOR CONVERSION, S FOR SELECTIVITY AND Y FOR YIELD. 75
TABLE 4-1 C1-C5 AND M1-M5 EXPERIMENTS SET FOR FBMR. 85
TABLE 4-2 C6-C10 EXPERIMENTS SET FOR FBMR. 90
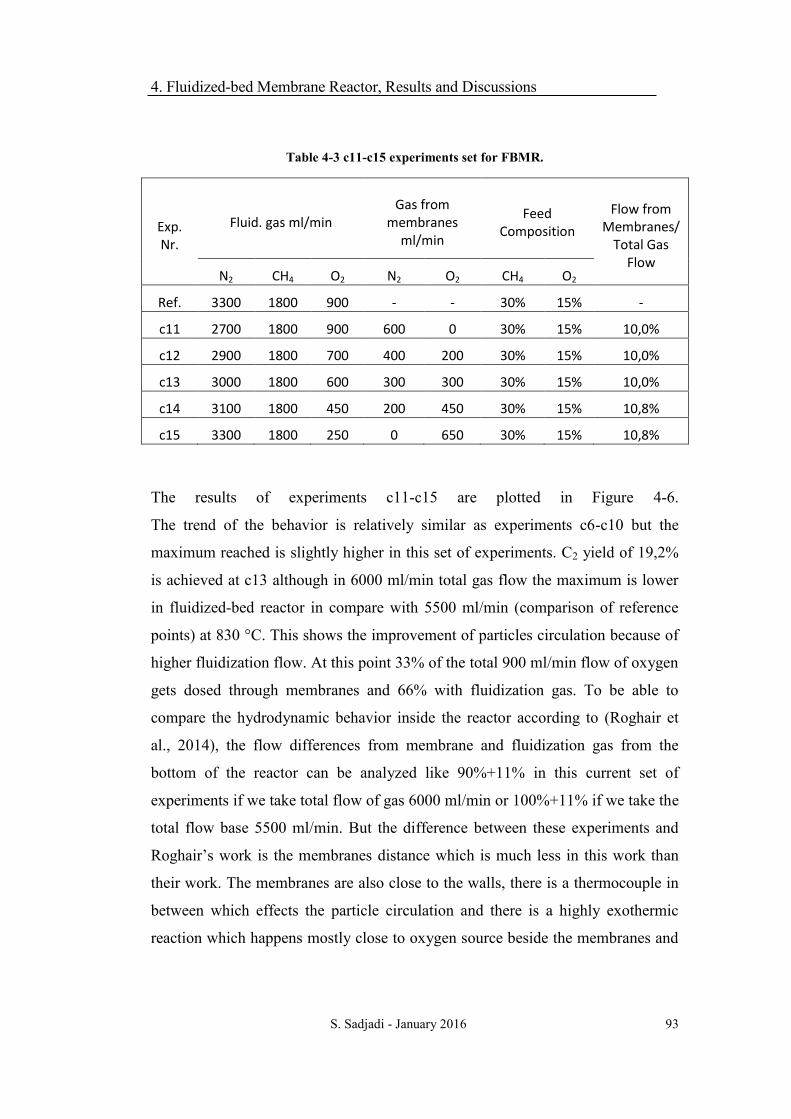
TABLE 4-3 C11-C15 EXPERIMENTS SET FOR FBMR. 93
TABLE 7-1 GAS ANALYZER IR CALIBRATION FOR METHANE. 120
TABLE D. 7-2 TEST GASES CONCENTRATION USED FOR MICRO-GC CALIBRATION. 121
TABLE D. 7-3 MICRO-GC CALIBRATION STEP BY STEP. 121
Page 14
LIST OF FIGURES
FIGURE 1-1 DIRECT AND INDIRECT CONVERSION ROUTES OF NATURAL GAS TO OTHER
CHEMICALS. BLUE; ................................................................................................................... 3
FIGURE 1-2: SELECTIVITY AND YIELD RESULTS OF DIFFERENT CATALYSTS ........................................ 7
FIGURE 1-3 VARIOUS KINDS OF FLUID/SOLID PARTICLES CONTACT FROM (KUNII & LEVENSPIEL
1991). ....................................................................................................................................... 9
FIGURE 1-4 PRESSURE DROP VERSUS GAS VELOCITY FOR A BED .................................................... 10
FIGURE 1-5 GELDART PARTICLE CALSSIFICATION (GELDART 1973) AND THE RANGE CHOSEN FOR
THIS WORK. ............................................................................................................................ 11
FIGURE 1-6 PSEUDO-2D FLUIDIZED BED SETUP .............................................................................. 19
FIGURE 1-7 CHANGES IN PARTICLE CIRCULATION AND BUBBLES FORMATION IN A FBMR IN
COMPARE WITH FBR. ............................................................................................................. 20
FIGURE 2-1 FECRALLOY FLUIDIZED-BED REACTOR. ......................................................................... 27
FIGURE 2-2 QUARTZ GLASS REACTOR USED AS FLUIDIZED-BED REACTOR ..................................... 30
FIGURE 2-3 FBMR WITH METAL MEMBRANES INSTALLED INSIDE. ................................................. 31
FIGURE 2-4 DIMENSIONS OF MEMBRANES INSIDE FBMR (A) FROM THE SIDE (B) THE TOP FLANGE
FROM ABOVE. ........................................................................................................................ 32
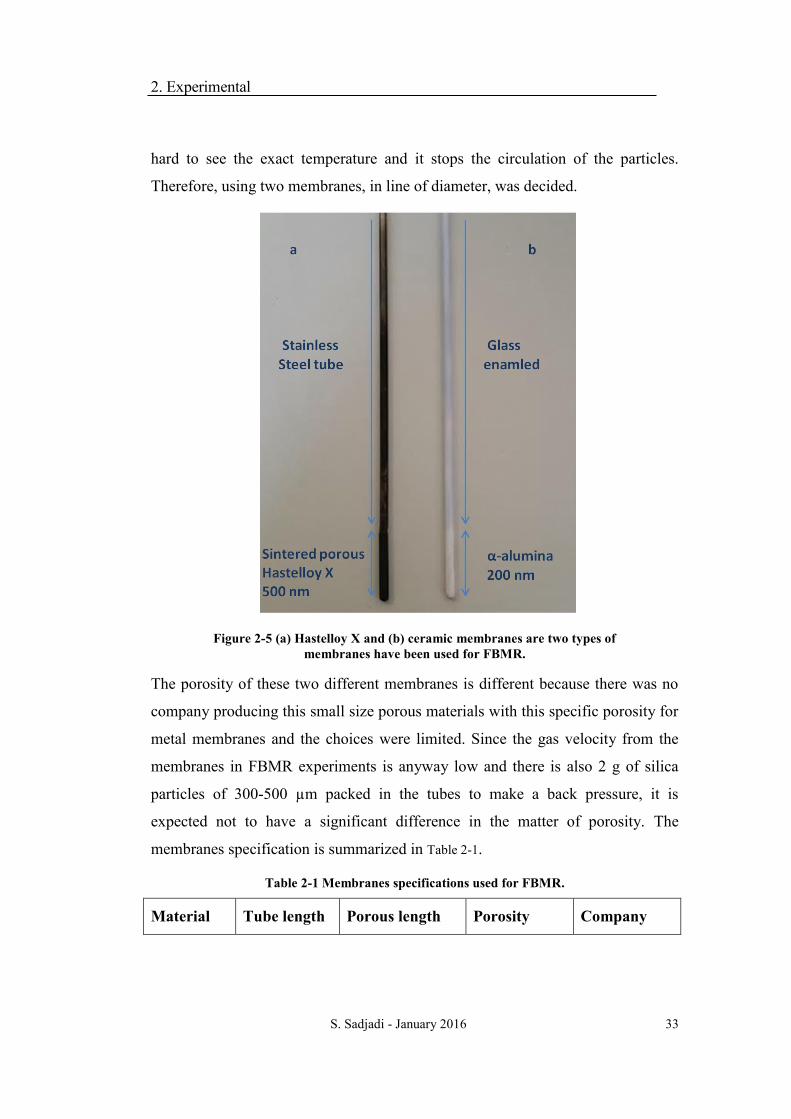
FIGURE 2-5 (A) HASTELLOY X AND (B) CERAMIC MEMBRANES ARE TWO TYPES OF MEMBRANES
HAVE BEEN USED FOR FBMR. ................................................................................................ 33
FIGURE 2-6 UNICAT OCM MINI-PLANT, ........................................................................................... 35
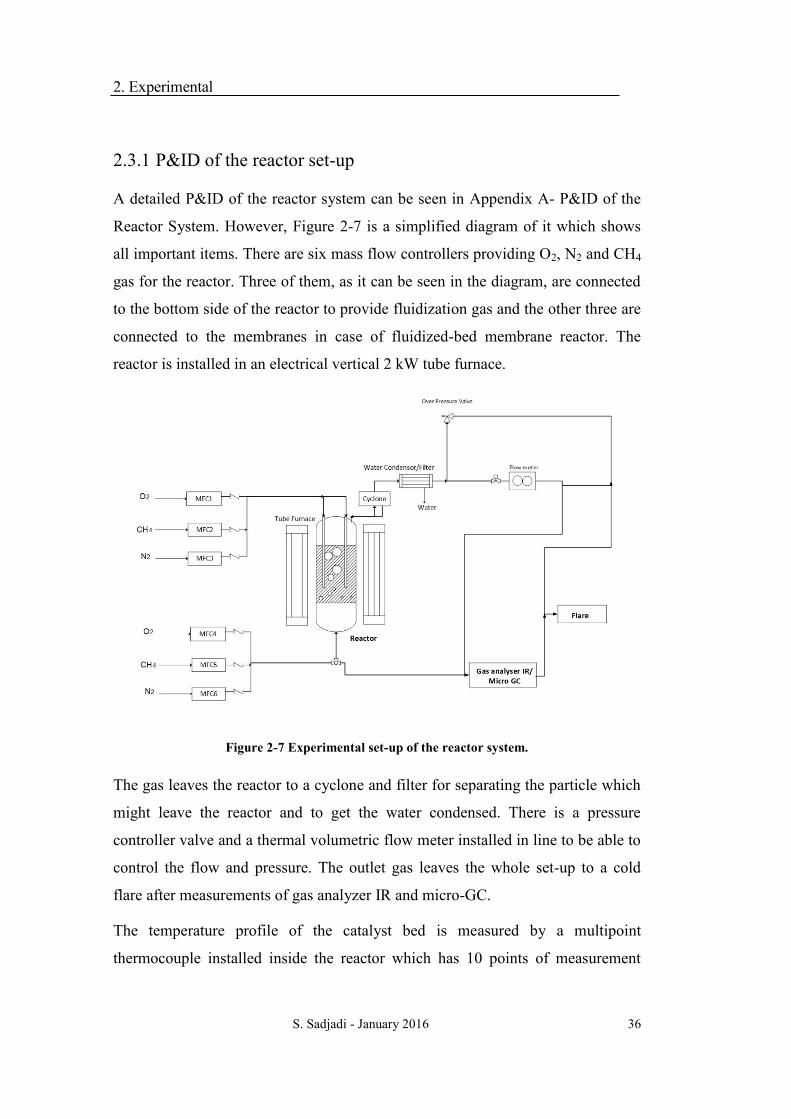
FIGURE 2-7 EXPERIMENTAL SET-UP OF THE REACTOR SYSTEM. ..................................................... 36
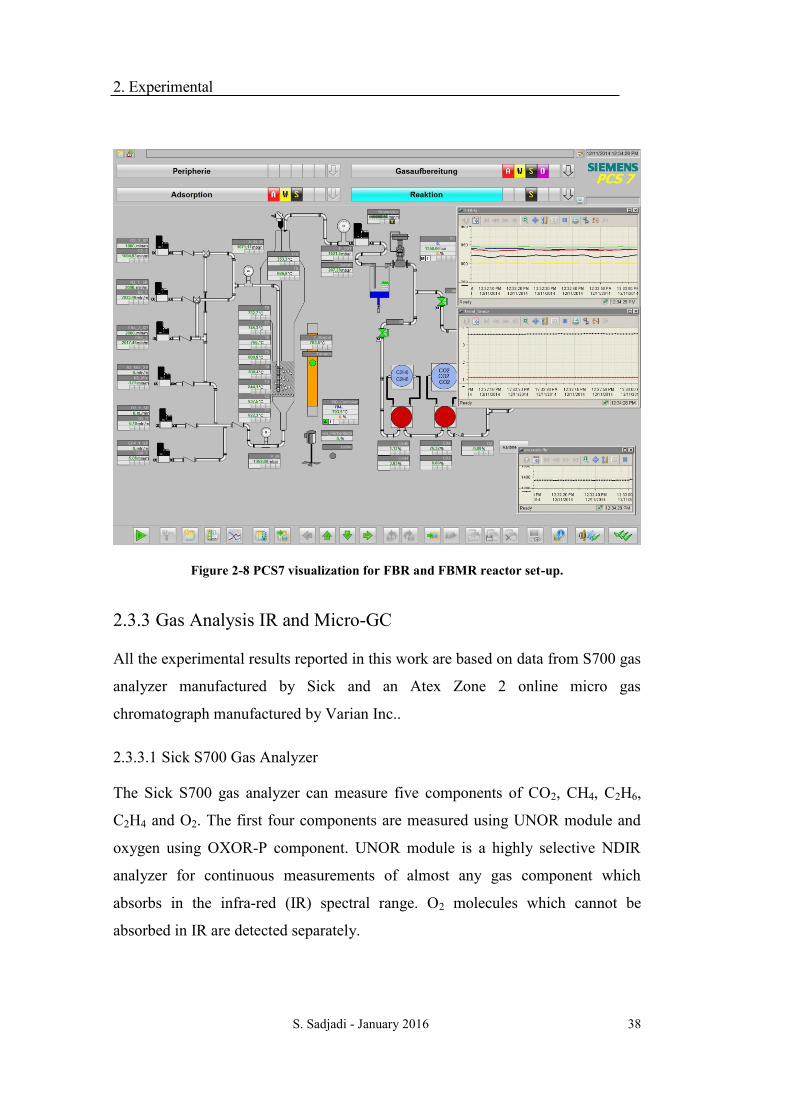
FIGURE 2-8 PCS7 VISUALIZATION FOR FBR AND FBMR REACTOR SET-UP. ..................................... 38
FIGURE 2-9: PLUG FLOW DIAGRAM OF MICRO-GC CONNECTION. ................................................. 39
FIGURE 2-10 TYPICAL MEASUREMENT OF MICRO-GC. .................................................................... 41
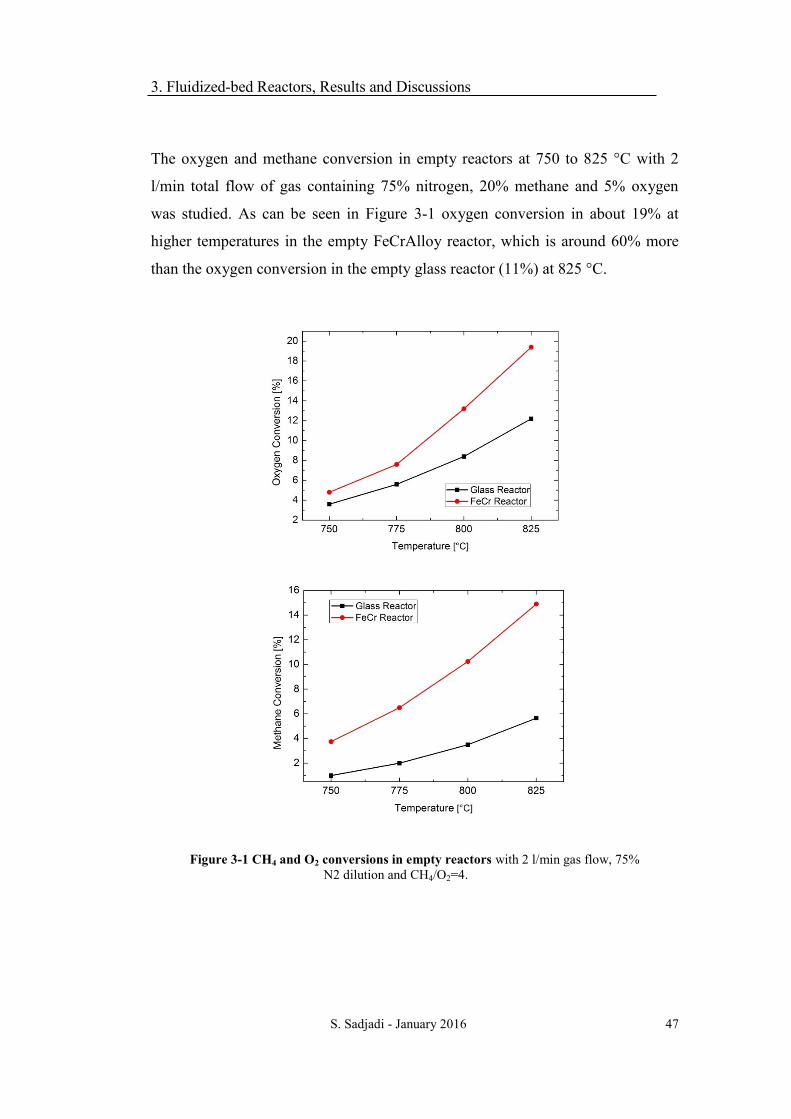
FIGURE 3-1 CH4 AND O2 CONVERSIONS IN EMPTY REACTORS ........................................................ 47
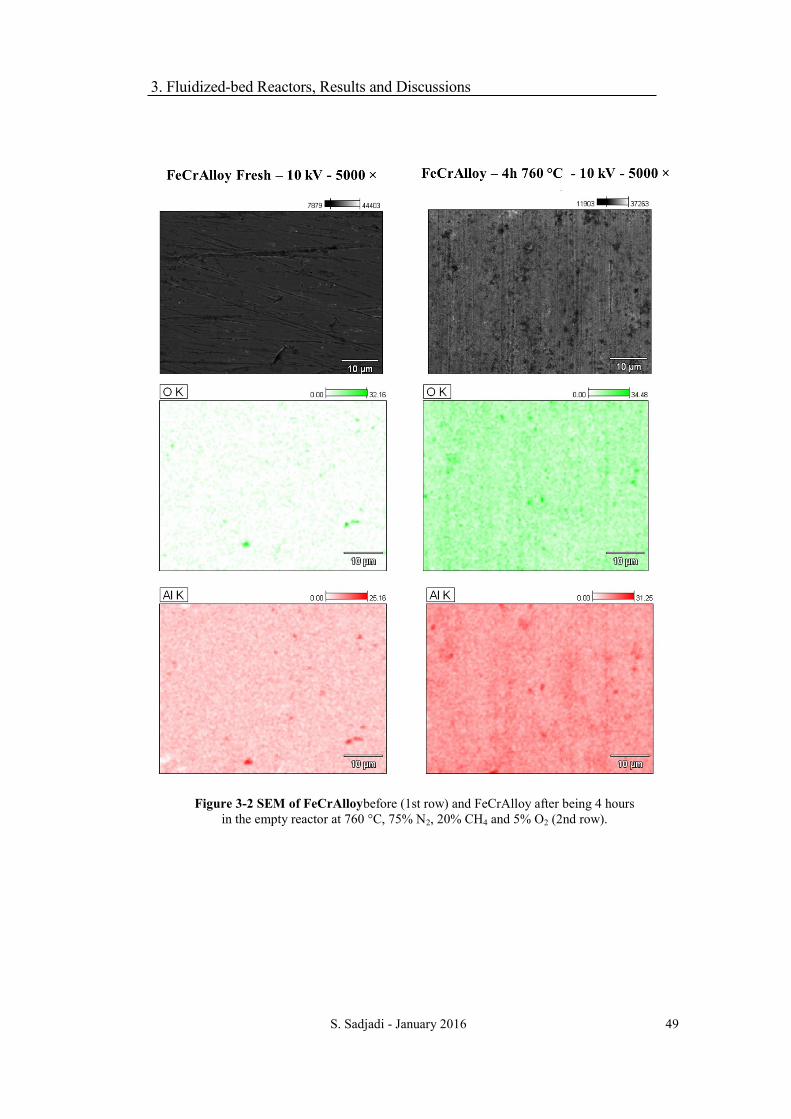
FIGURE 3-2 SEM OF FECRALLOY ...................................................................................................... 49
FIGURE 3-3 THE INFLUENCE OF TEMPERATURE ON C2 YIELD, SELECTIVITY AND CH4 CONVERSION.
............................................................................................................................................... 50
FIGURE 3-4 REACTION TEMPERATURE INFLUENCE ON METHANE CONVERSION IN GLASS
REACTOR ................................................................................................................................ 52
Page 15
FIGURE 3-5 REACTION TEMPERATURE INFLUENCE ON C2 SELECTIVITY IN GLASS REACTOR .......... 53
FIGURE 3-6 REACTION TEMPERATURE INFLUENCE ON C2 YIELD IN GLASS REACTOR ..................... 53
FIGURE 3-7 REACTION TEMPERATURE INFLUENCE ON OXYGEN CONVERSION IN GLASS REACTOR
............................................................................................................................................... 54
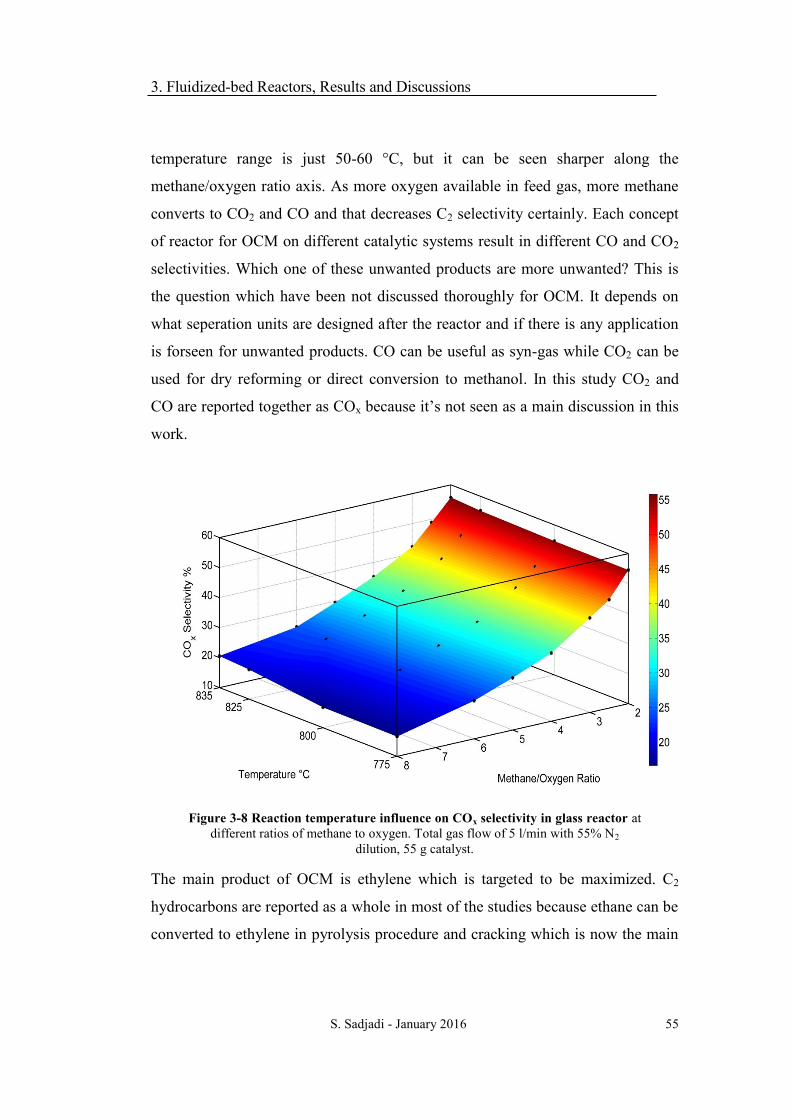
FIGURE 3-8 REACTION TEMPERATURE INFLUENCE ON COX SELECTIVITY IN GLASS REACTOR ........ 55
FIGURE 3-9 TYPICAL PROPOSED OCM PROCESS WITH DOWNSTREAM .......................................... 56
FIGURE 3-10 REACTION TEMPERATURE INFLUENCE ON ETHYLENE/ETHANE RATIO IN GLASS
REACTOR ................................................................................................................................ 57
FIGURE 3-11 NITROGEN DILUTION EFFECT ON METHANE CONVERSION, C2 YIELD AND SELECTIVITY
IN QUARTZ GLASS REACTOR .................................................................................................. 58
FIGURE 3-12 C2 SELECTIVITY, YIELD AND METHANE CONVERSION AT DIFFERENT
METHANE/OXYGEN RATIOS AT LOW DILUTION .................................................................... 59
FIGURE 3-13 EXPERIMENTAL RESULTS OF MESOSPOROUS SILICA CATALYST AT 800 °C, TOTAL
FLOW OF 3 L/MIN. ................................................................................................................. 61
FIGURE 3-14 AGGLOMERATED CATALYST PARTICLES. .................................................................... 62
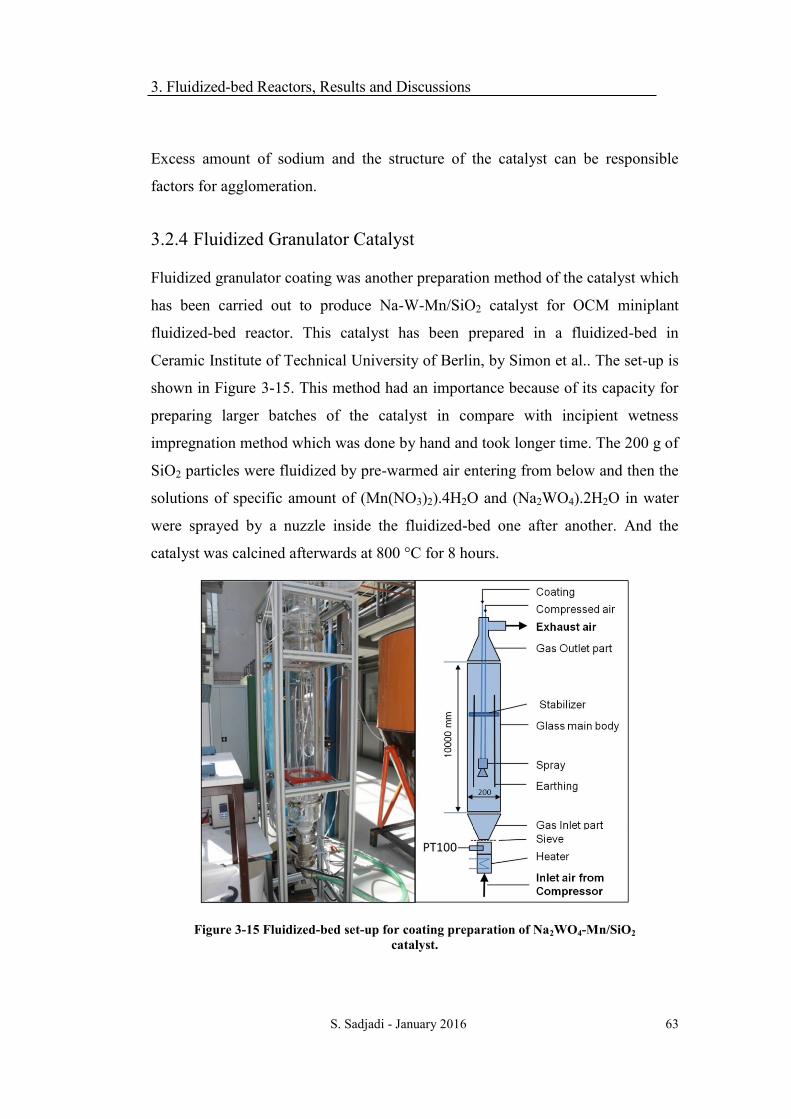
FIGURE 3-15 FLUIDIZED-BED SET-UP FOR COATING PREPARATION OF NA2WO4-MN/SIO2
CATALYST. .............................................................................................................................. 63
FIGURE 3-16: SCHEMATIC OF FLUIDIZED-BED COATING METHOD. ................................................ 64
FIGURE 3-17 TEMPERATURE AND METHANE TO OXYGEN RATIO INFLUENCE ON THE CATALYST
PREPARED BY FLUIDIZED GRANULATOR COATING METHOD. ............................................... 65
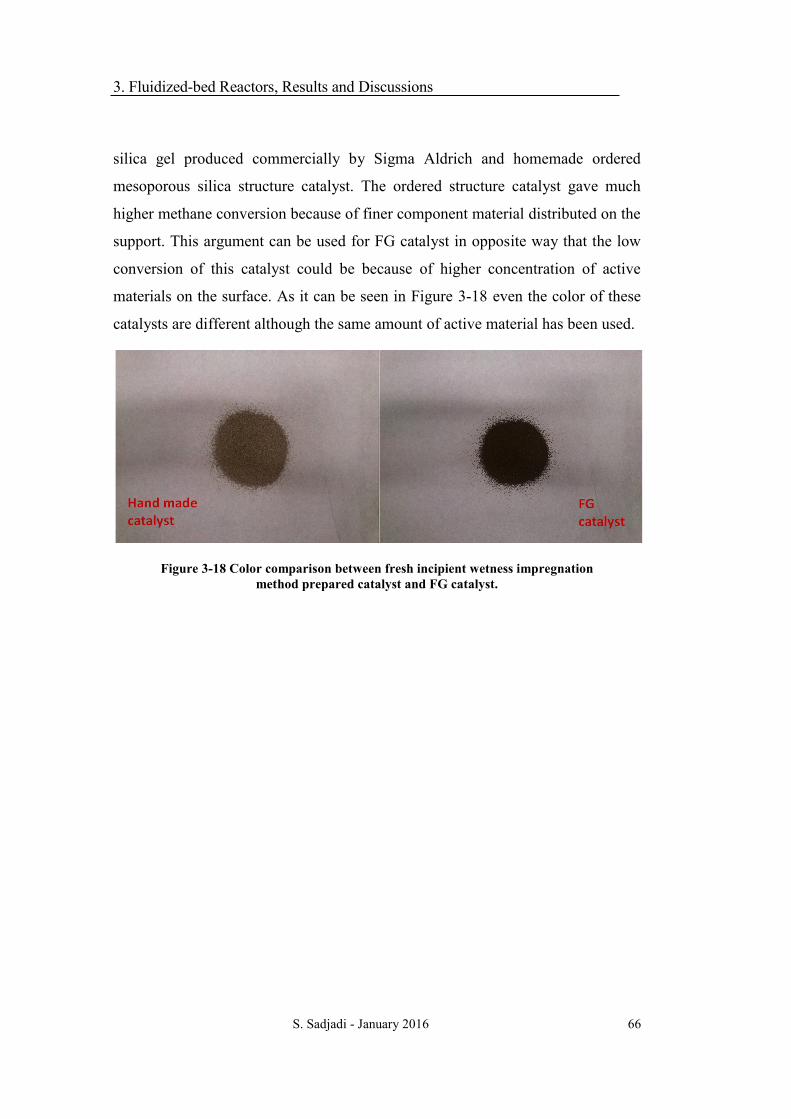
FIGURE 3-18 COLOR COMPARISON BETWEEN FRESH INCIPIENT WETNESS IMPREGNATION
METHOD PREPARED CATALYST AND FG CATALYST. .............................................................. 66
FIGURE 3-19 REACTION TEMPERATURE INFLUENCE ON METHANE CONVERSION IN FECR REACTOR
............................................................................................................................................... 68
FIGURE 3-20 REACTION TEMPERATURE INFLUENCE ON C2 SELECTIVITY IN FECR REACTOR .......... 68
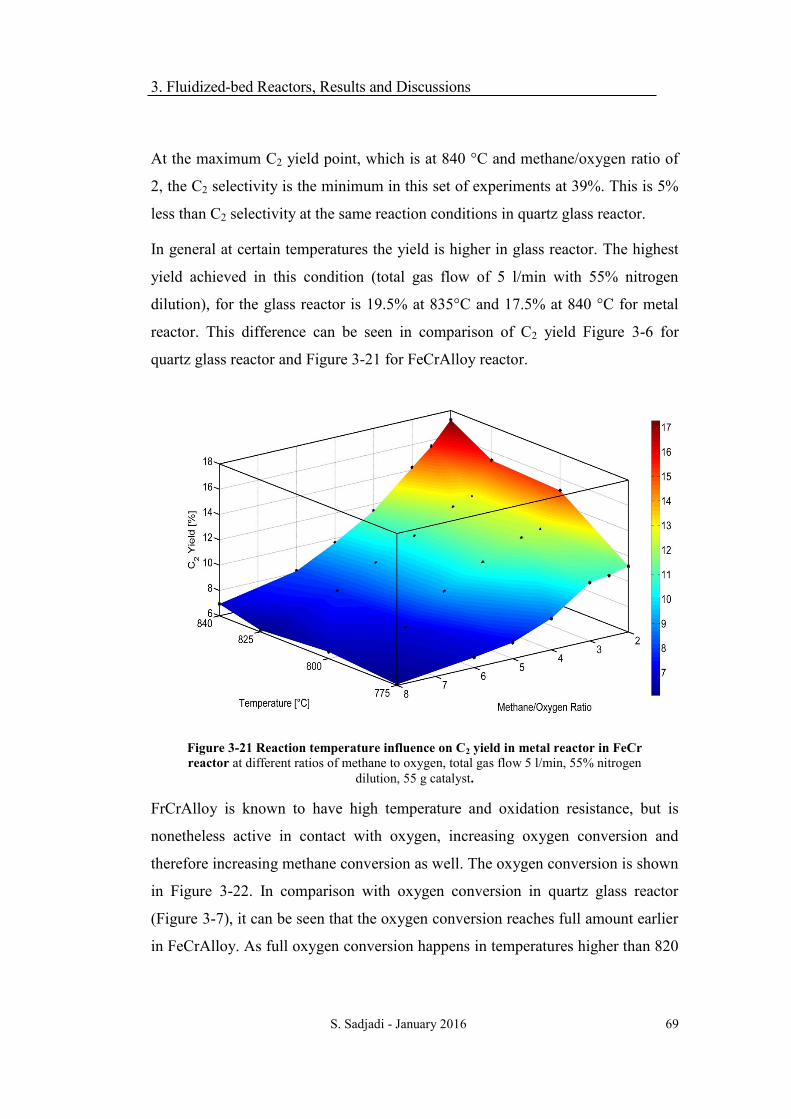
FIGURE 3-21 REACTION TEMPERATURE INFLUENCE ON C2 YIELD IN METAL REACTOR IN FECR
REACTOR ................................................................................................................................ 69
FIGURE 3-22 REACTION TEMPERATURE INFLUENCE ON OXYGEN CONVERSION IN FECR REACTOR
............................................................................................................................................... 70
FIGURE 3-23 REACTION TEMPERATURE INFLUENCE ON COX SELECTIVITY IN FECR REACTOR ........ 71
Page 16
FIGURE 3-24 REACTION TEMPERATURE INFLUENCE ON ETHANE/ETHANE RATIO IN FECR REACTOR
............................................................................................................................................... 71
FIGURE 3-25 FLUIDIZATION VELOCITY INFLUENCE ON METHANE CONVERSION AND C2
SELECTIVITY IN FECRALLOY REACTOR, AT 800 °C, METHANE/OXYGEN RATIO=2. ................. 73
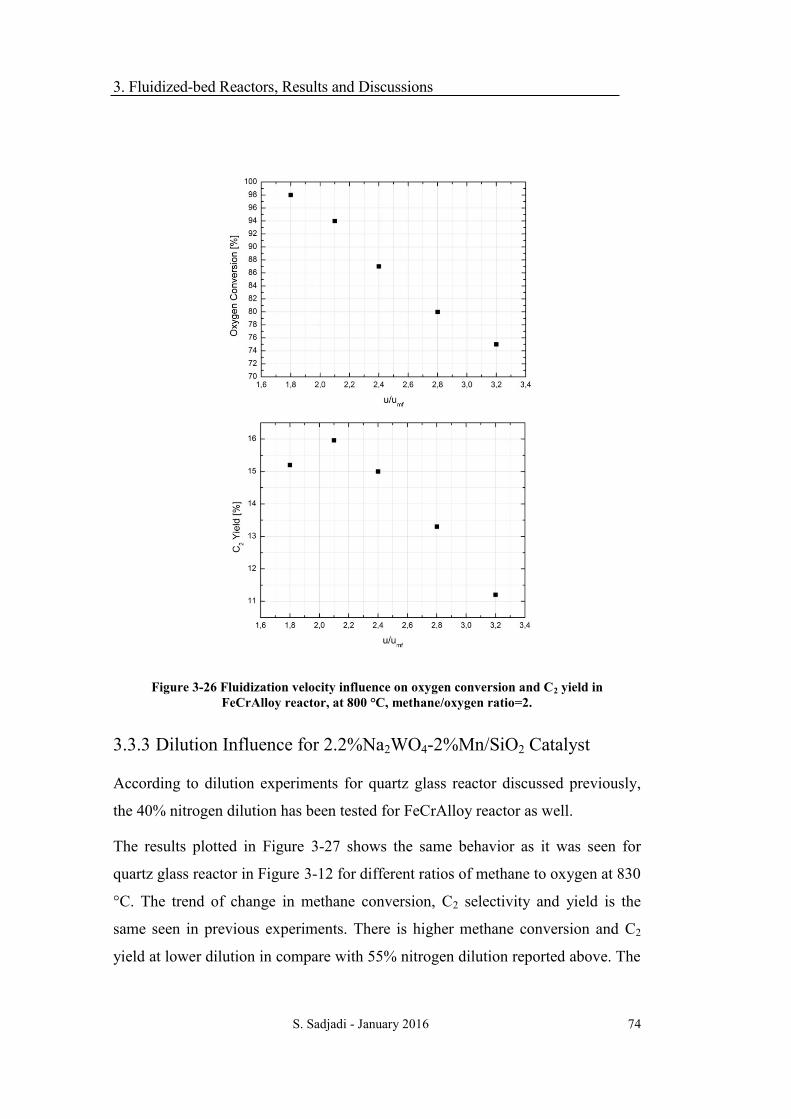
FIGURE 3-26 FLUIDIZATION VELOCITY INFLUENCE ON OXYGEN CONVERSION AND C2 YIELD IN
FECRALLOY REACTOR, AT 800 °C, METHANE/OXYGEN RATIO=2. .......................................... 74
FIGURE 3-27 C2 SELECTIVITY, YIELD AND METHANE CONVERSION AT DIFFERENT
METHANE/OXYGEN RATIOS AT LOW DILUTION .................................................................... 75
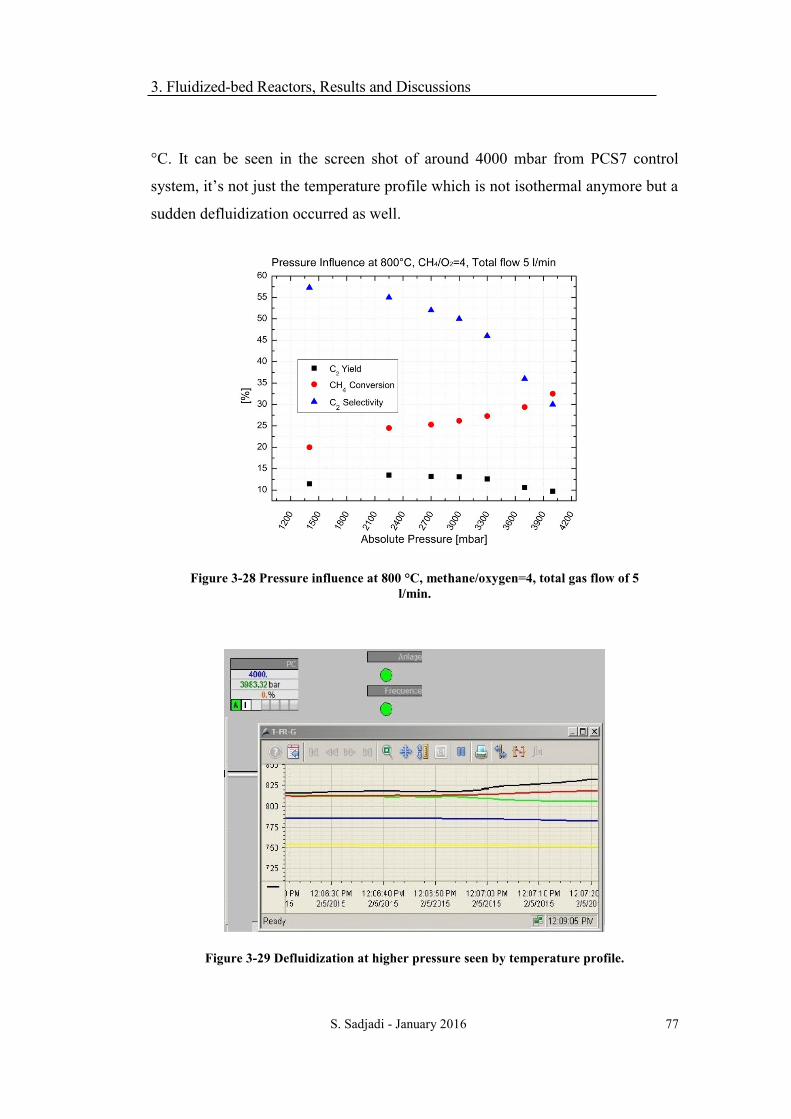
FIGURE 3-28 PRESSURE INFLUENCE AT 800 °C, METHANE/OXYGEN=4, TOTAL GAS FLOW OF 5
L/MIN. .................................................................................................................................... 77
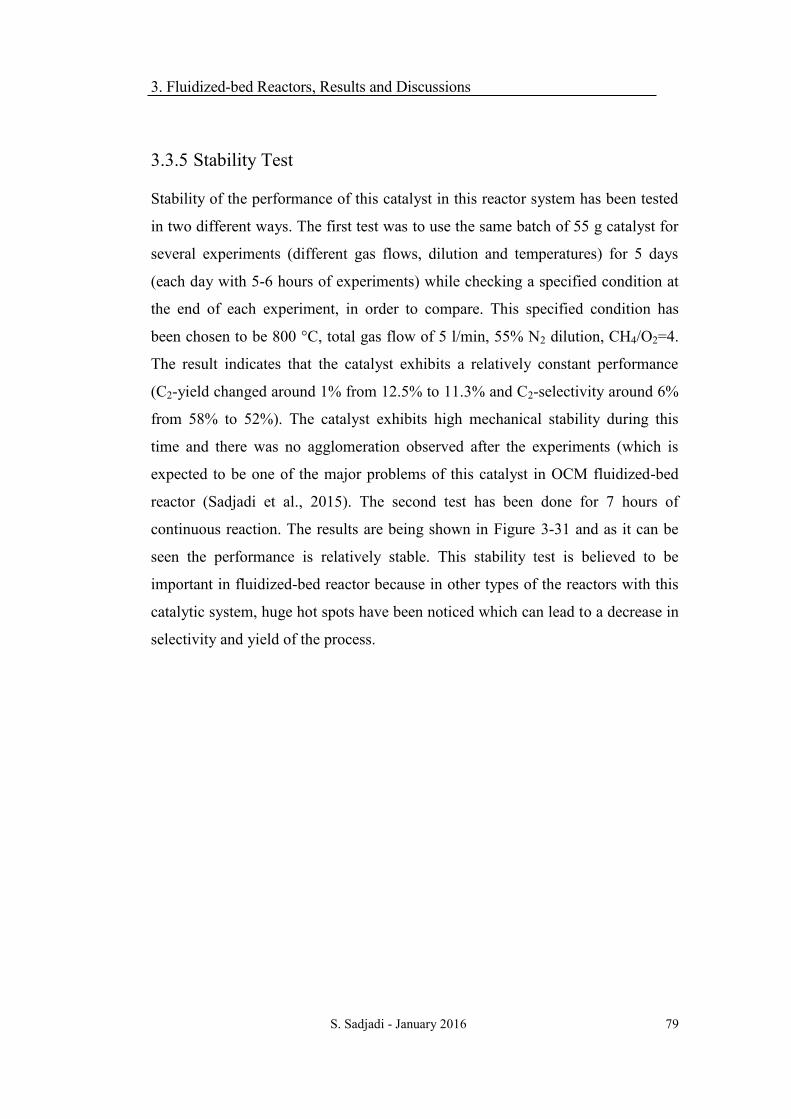
FIGURE 3-29 DEFLUIDIZATION AT HIGHER PRESSURE SEEN BY TEMPERATURE PROFILE. .............. 77
FIGURE 3-30 PRESSURE INFLUENCE AT 800 °C, METHANE/OXYGEN=4, TOTAL GAS FLOW OF 5-10
L/MIN. .................................................................................................................................... 78
FIGURE 3-31 STABILITY TEST FOR C2 YIELD, SELECTIVITY AND CH4 CONVERSION IN 7 HOURS. ...... 80
FIGURE 4-1 TIME-AVERAGED PARTICLE MOVEMENT AND TIME-AVERAGED PROFILE OF THE AXIAL
SOLIDS PHASE VELOCITY FOR DIFFERENT HEIGHTS IN THE FLUIDIZED-BED. ......................... 82
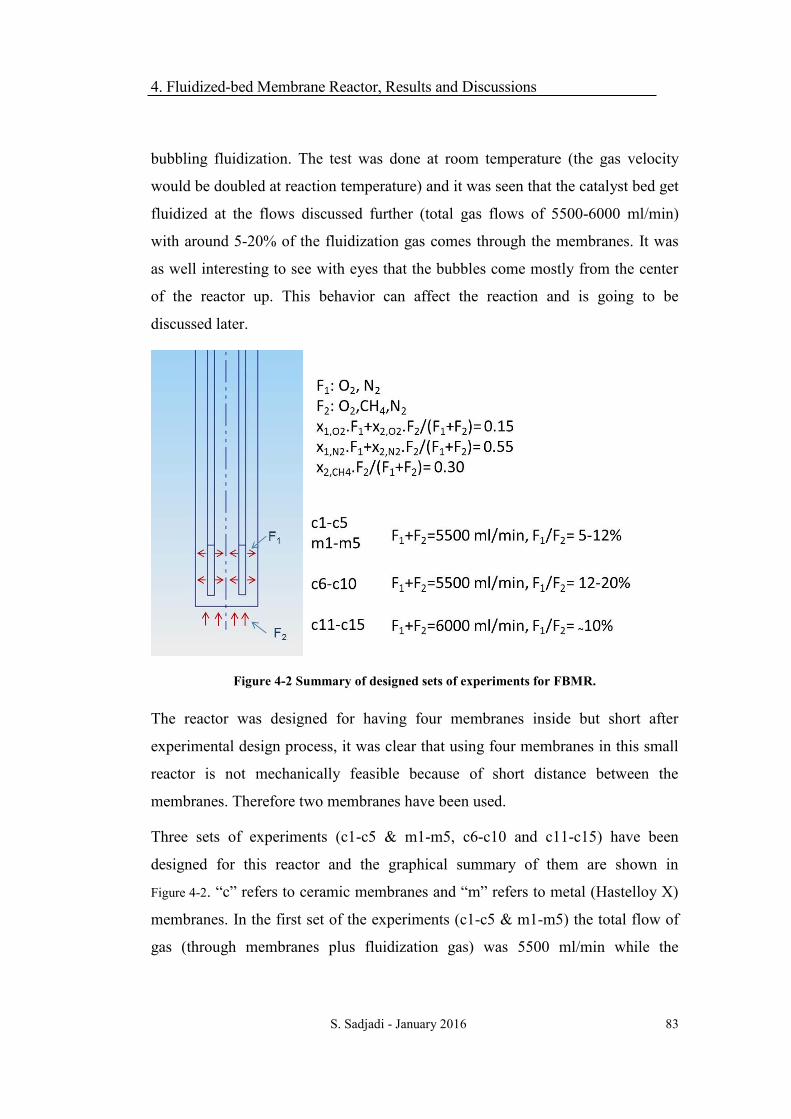
FIGURE 4-2 SUMMARY OF DESIGNED SETS OF EXPERIMENTS FOR FBMR. ..................................... 83
FIGURE 4-3 FBMR RESULTS FOR C1-C5 AND M1-M5 EXPERIMENT SETS. ....................................... 88
FIGURE 4-4 USED MEMBRANE ON THE LEFT SIDE WITH OXIDIZED SURFACE SEEN WITH RED
COLOR, NOT-USED MEMBRANE ON THE RIGHT SIDE. ........................................................... 89
FIGURE 4-5 FBMR RESULTS FOR C6-C10 EXPERIMENT SETS. .......................................................... 92
FIGURE 4-6 FBMR RESULTS FOR C11-C15 EXPERIMENT SET. .......................................................... 94
FIGURE 5-1 DESIGN OF A FBMR REACTOR FOR FUTURE WORK. ...................................................101
FIGURE 7-1 P&ID OF REACTOR SET-UP. .........................................................................................117
FIGURE 7-2 EXPERIMENTAL FINDING OF MINIMUM FLUIDIZATION VELOCITY. ...........................119
Page 17
LIST OF ABBREVIATIONS
BV Ball Valve
CFD Computational fluid dynamics
DBTA Chair of Process Dynamics and Operation at TU Berlin
DIA Digital Image Analysis
DME Dimethyl Ether
EDX Energy Dispersive X-Ray
EIA U.S. Energy Informtaion Administration
FBR Fluidized-Bed Reactor
FBMR Fluidized-Bed Membrane Reactor
FCC Fluid Catalytic Cracking
FG Fluidized Granulator
GC Gas Chromatography
HAZOP Hazard and Operability Study
I.D. Inner Diameter
IR Infrared
MFC Mass Flow Controller
M-OMS Monolithic Ordered Mesoporous Silica
OCM Oxidative Coupling of Methane
O.D. Outer Diameter
OMS Ordered Mesoporous Silica
OS Operating System
PCS Process Control System
PI Process Intensification
P&ID Piping and Instrumentation Diagram
PIV Particle Image Velocimetry
Page 18
PPQ Part per Quadrillion
SBA Santa Barbara Amorphous
SEM Scanning Electron Microscope
TAP Temporal Analysis of Products
UniCat Unifying Concepts of Catalysis
Page 19
LIST OF SYMBOLS
Ar Archimedes number
d µm Particle average diameter
𝑑𝑝 µm Particle diameter
𝜀𝑚ƒ Bed voidage at minimum fluidization
∆𝑝 Pa Pressure drop
∆𝑝mf Pa Pressure drop at minimum fluidization
∆𝑝mff Pa Pressure drop at minimum fully fluidization
g m/s2
Acceleration due to gravity
𝜌𝑔 kg/m3
Density of gas
𝜌𝑠 kg/m3 Density of solid particles
𝜑𝑠 Sphercity or shape factor
𝜇𝑔 kg/m.s Viscosity of gas
P Pa Pressure
S % Selectivity
T K Temperature
u m/s Superficial gas velocity
𝑢𝑚ƒ m/s Minimum fluidization velocity
V m3
Volume of reactor
Vg m/s Gas Velocity
Vmf m/s Gas velocity at minimum partially fluidized
bed
Vmff m/s Gas velocity at minimum fully fluidized bed
Vt m/s Gas velocity at pneumatic transport
X % Conversion of reactant
Y % Yield of a product
Page 21
1.Introduction
S. Sadjadi - January 2016 1
1 INTRODUCTION
1.1 Natural Gas, Methane and Conversion Routs
Natural gas is a fossil fuel formed under the earth and as a non-renewable energy
has many advantages over other non-renewable energy sources. It benefits better
energy saving when it is used instead of oil or coal (Mokhatab et al., 2015).Crude
oil production in the world increased constantly till 2005 when it got the peak and
stayed more or less around this peak in the last decade (US Energy Information
Administration). The oil price rapidly went up in the beginning of twenty first
century because of demand growing countries like China and because of Middle
East wars as well, but faced rapid decrease with 2008 financial crisis and then
again went up with economic recovery. Middle Eastern and North African
unstable political situation because of wars, invasions and revolutions made
instability in oil market. High price of oil (around 125$ per barrel in 2010 till
2014) was one of the motivations for the growth in research on natural gas and
methane processing. Limited oil reserves in compare with natural gas reserves
make another reason to think and act in developing new ways of energy
production from natural gas rather than oil. The reserves-to-production ratio of
world crude oil in 2013 was around 45 and this ratio for natural gas was around 60
Page 22
1.Introduction
S. Sadjadi - January 2016 2
in the same year (IEA, 2014). This shows more availability of natural gas reserves
even considering the price drop of oil at the end of 2014 – beginning of 2015.
Natural gas was used first in China in 500 BC to boil sea water to extract the salt
(Natural Gas Supply Association, 2013). They were using pipeline of bamboos to
transport it close to the sea. The first industrially extraction of natural gas was in
1825 at USA (Natural Gas Supply Association, 2013).
Nowadays most of the natural gas extracted in the world is being used as a fuel,
warming houses or cooking. In some countries it is still being flared immediately
at oil fields and it is called as “unwanted gas”. The “unwanted gas” sometimes
gets injected back to wells at many oil fields or being flared. Natural gas can be
found at oil fields (“associated”), or at only-natural gas fields (“non-associated”)
or at coal-beds (“coal-bed methane”). Different kind of sources of natural gas and
geographical distances make different compositions of natural gas. It contains
typically 70-90% methane, 0-20% ethane-propane-butane, 0-8% carbon dioxide,
0-5% hydrogen sulphide and 0-5% nitrogen. The sulphide and carbon dioxide
should be removed in the processing step before transporting the natural gas in
pipes to costumers, in case of using the gas for households. The moisture of the
gas should also be separated to avoid forming corrosive acids in contact with
hydrogen sulphide (H2S) and carbon dioxide (CO2). All this processes make costs
for transporting this gas which doesn’t have a high price itself. It should be
emphasized on natural gas containing really light gas (methane) which makes the
transportation more difficult because it should be compressed under 10-100 bar.
All these can explain the reason of studying the alternatives for producing more
valuable chemicals from natural gas on-site which might be themselves being
used as a reactant of another process. Right now just small portion of the world
produced natural gas being used in process to produce other chemicals such as
methanol and ammonia.
One of the main routs of natural gas process is to produce synthesis gas (syn-gas)
by either partial oxidation or steam reforming of natural gas and then using the
Page 23
1.Introduction
S. Sadjadi - January 2016 3
syn-gas for producing liquid hydrocarbons (gasoline) via Fischer-Tropsch process
or methanol which can be used itself as an intermediate for producing
dimethylether (DME) or other products. These processes are being used in
industry in different countries. Natural gas is also being used for pyrolysis to
produce hydrogen but not widely.
What is more attractive is to study the possibility of using natural gas in a direct
conversion to more valuable products, like oxidative coupling of methane for
producing C2 hydrocarbons (ethylene as main product), methane aromatization,
methanol and formaldehyde production from direct conversion rout.
The three studies of (Zaman, 1999; Gesser & Hunter, 1998; Ross, et al., 1996)
from 90s summarized all direct and indirect conversion routs of natural gas which
are either commercialized or being under research.
Main conversion routs of natural gas are being illustrated in Figure 1-1 including
commercialized and not-commercialized ones. The commercialized ones are the
ones shown in blue colour and not-commercialized ones are the ones shown in red
colour in this figure.
Figure 1-1 Direct and indirect conversion routs of natural gas to other
chemicals. Blue; commercialized processes and red; not commercialized processes.
All direct conversion routes of methane which has been illustrated in Figure 1-1
suffer almost the same problems for being commercialized. Low product
Page 24
1.Introduction
S. Sadjadi - January 2016 4
selectivity and oxidation of products (because of high reaction temperatures) are
of those problems (Zaman, 1999).
1.1.1 Direct Conversion of Natural Gas to Ethylene
One of the direct routs of converting natural discussed above was to produce C2
hydrocarbons such as ethylene. This reaction is being called as Oxidative
Coupling of Methane which from now on in this text mentioned as OCM.
It was in 1982 that for the first time, Keller and Bhasin, proposed OCM (Keller &
Bhasin, 1982). They suggested that two molecules of methane can be coupled
oxidatively to produce ethane and ethylene. They discussed the undesired
products of monoxide carbon and dioxide carbon which make the low selectivity
of desired products. Keller and Bhasin studied different oxides of metals on alpha-
alumina as catalysts for this reaction and they tried stainless steel and glass
reactors. They reported stainless steel as not appropriate material because it was
converting methane to dioxide carbon but the glass material as an inert material.
It is suspected that Baerns group was working on OCM at the same time but
published later. They first published a paper in German language (Hinsen &
Baerns, 1983) about OCM and then their work continued to more detailed studies
of OCM (Hinsen et al., 1984).
In the last three decades of research on OCM, different aspects such as reaction
engineering, reactor design, catalyst synthesis, new catalysts development and
feasibility studies have been investigated. OCM is not yet commercialized in
petrochemical industry but Siluria Technologies might be the first one making
OCM plant. After five years of working on OCM, in 2014, Siluria announced an
agreement with the German Linde Gas Company for the final scale-up and
demonstration of the OCM technology at the Braskem demonstration plant which
is constructed in La Porte, Texas (Siluria Technologies, 2014). In April 2015 they
Page 25
1.Introduction
S. Sadjadi - January 2016 5
announced the successful start-up of the demonstration plant with the capacity of
around 350 tons per year.
Apart from Siluria’s technology, which is yet not enough known especially about
the catalyst, the main two barriers for commercializing OCM in more than thirty
years of research are low C2 selectivity of the reaction and hot-spot formation
which is because of the high heat release of the reaction.
Unfortunately, methane as well as ethylene plus ethane products (C2 products)
may be oxidized to CO plus CO2 (COx) which is the reason for low selectivity of
the OCM. Over promised catalysts like SrO/La2O3 (Mimoun et al., 1990) and Mn-
Na-W/SiO2 (Fang et al., 1992a; Pak et al., 1998a) C2 selectivity of about 70-80%
was achieved at methane conversion of 20-30%. The conversion of methane can
be improved by increasing the reactant of oxygen but the C2 selectivity decreases
meantime. The high selectivities were always achieved at low concentration of
oxygen therefore with lower methane conversion. Hot-spot formation is one of the
other main barriers of OCM, which was reported for more than 150 °C in packed-
bed reactors (Schweer et al., 1994; Pak & Lunsford, 1998b). These barriers are
being discussed more detailed by Lunsford (Lunsford, 2000).
The low selectivity can be improved by better reactor engineering, for example
with distributing oxygen by using membranes. Omata et al. (1989) were the first
ones introducing membrane reactor research for OCM. Their main argument to
use membrane was to be able to dose oxygen while not letting the nitrogen of the
air get mixed with other hydrocarbons in the reactor due to economical
disadvantage of costly nitrogen separation in next steps. In the decade of 90s there
were many studies focused on using membranes in OCM packed-bed reactors
(Fujimoto et al., 1991; Eng & Stoukides, 1991; Nozaki et al., 1992; Coronas et al.,
1994a; Conoras et al., 1994b; Tonkovich et al., 1996a; Tonkovich et al., 1996b)
and continued in the 21st century in both porous and dense membrane studies as
well (Lu et al., 2000; Kao et al., 2003; Bhatia et al., 2009; Kiatkitipong et al.,
2005; Olivier et al., 2008a; Godini, 2014). These researches all reported higher C2
Page 26
1.Introduction
S. Sadjadi - January 2016 6
selectivity using membranes but hot-spot formation and low conversion of
methane is also reported in many or being neglected to be reported about as a
problem by others.
Hot-spot formation can be avoided by using fluidized-bed membrane reactors
because of their isothermal catalyst bed and possibility of better temperature
control. This matter and fundamentals of fluidized-bed reactors will be explained
thoroughly in next sections.
1.2 Na2WO4-Mn/SiO2 Catalyst for OCM
Another way to work on increasing the selectivity is developing new catalysts but
this has been widely under investigation in last three decades by many groups.
There have been hundreds of catalysts being tested in different kinds of reactors
(Wolf, 1992; Maitry, 1993).
In Figure 1-2, there is a graph summary using the data from the work of (Olivier
et al., 2008b).
This graph shows the best C2 selectivity and yield from many different catalysts in
fixed-bed reactors till 2008. There are few catalysts that can give even more than
90% selectivity but at poor conversion, therefore low yield as well. And many of
these catalysts haven’t been tested for stability or gave short time stability. Na-W-
Mn/SiO2 is one of the catalysts which its stability was proven by many literatures
according to (Arndt et al., 2012) and showed a promising selectivity as well.
Na-W-Mn/SiO2 was first reported by Fang (Fang et al., 1992a; Fang et al. 1992b).
They obtained the results of this relatively high active and selective catalyst for
OCM in a fixed-bed reactor. Members of the same group continued to publish
regarding this matter (Lin et al., 1995; Wu & Li, 1995; Li, 2001; Li, 2003; Wang
et al., 1997; Wang et al., 2006). There have been several stability tests all reported
relatively good stability of this catalyst in (Lin et al., 1995; Wang et al., 1997; Pak
Page 27
1.Introduction
S. Sadjadi - January 2016 7
et al., 1998a; Liu et al., 2008; Simon et al., 2011). The longest stability test is
from Wang which has been done in a fluidized-bed reactor (Wang et al., 1997).
Figure 1-2: Selectivity and yield results of different catalysts used in fixed-bed
reactors based on table information of (Olivier et al., 2008b).
Among other things they considered distorted WO4 tetrahedron as the active
phase for OCM. However, a more precise model on two active sites related to
W6+/5+
and Mn3+/2+
was subsequently postulated for the activation of methane and
oxygen, respectively. Li’s group (1997) tested the Mn–Na2WO4/SiO2 catalyst in a
200 ml stainless steel fluidized-bed reactor, and reported a good and stable
performance over 450 h time on stream, in accordance with the results of the
fixed-bed reactor. They achieved a maximum of 19.4% C2 yield at a CH4
conversion of 25.6%.
OCM results concerning activity and stability over Mn–Na2WO4/SiO2 catalyst in
fixed-bed reactors were reproduced by different research groups all over the world
(Arndt et al., 2012).
Page 28
1.Introduction
S. Sadjadi - January 2016 8
Talebizadeh et al. studied the dynamics of Mn–Na2WO4/SiO2 in a micro-reactor
and demonstrated that the C2 selectivity decreases slowly at 800 °C and it has a
sharper decrease at 850 °C (Talebizadeh et al. 2009).
Ji and the group (Ji et al. 2002) varied the Na, Mn and W content for Mn–
Na2WO4/SiO2. The highest C2 yields could be reached in a broad concentration
range of 0.4% - 2.3% Na, 2.2% - 8.9% W and 0.5% - 3% Mn.
By substituting WO42-
for a variety of oxyanions, the stability and or activity of
the catalyst was drastically decreased (Hou et al., 2006; Mahmoodi et al., 2010;
Wang et al., 1995; Ji et al., 2003), only SO42-
and MnO4- led to similar results as
WO42-
(Hou et al., 2006; Wang et al., 1995). The replacement of Na with different
cations, such as K and Rb, led to similar results (Ji et al., 2003), as well as the
substitution of Mn with Ce (Malekzadeh et al., 2001 and 2008; Gholipour et al.,
2010).
SiO2 is the most common used support material for Mn–Na2WO4 (Arndt et al.,
2012). Variations in the catalyst support material showed that SiO2 leads to the
best OCM results in regard to C2 yield and a potential industrial application (Pak
& Lunsford 1998b; Yildiz et al., 2014a). However, SiC, Fe2O3 and TiO2 (Rutile)
led to promising results as well (Yildiz et al., 2014a). Most of the catalysts were
prepared via incipient wetness impregnation (Arndt et al., 2012). However, by
varying the preparation rout, Fang et al. and Wang et al. demonstrated changes
that occurred in catalyst properties (Fang et al., 1992b; Wang et al., 2006).
In short, this catalyst showed promising results and high stability in different
studies and was chosen for this work as part of UniCat OCM project.
1.3 Fluidized-bed and Fluidized-bed Membrane Reactors for
OCM
Fluidized-bed reactor concept is one of the solutions to overcome the hot-spot
formation in case of OCM because of its function for an isothermal catalyst bed
Page 29
1.Introduction
S. Sadjadi - January 2016 9
due to fluidization. And fluidized-bed membrane reactor is an option to joint both
advantages of fluidization and distributed dosing of reactants. These reactor
concepts are discussed more detailed below.
1.3.1 Fluidized-bed Reactor
Fluidization is an operation in which solid particles behave like fluid in contact
with gas or liquid. More common practice of fluidization is when the gas or liquid
enters upward through the particles and the velocity of the gas/liquid is more than
the point in which frictional force between a particle and fluid counterbalances the
particle’s weight – this point called minimum fluidization - (Kunii & Levenspiel,
1991). In Figure 1-3, the different kinds of solid/fluid contact have been
visualized.
Fluidization engineering is about the understanding and analysis of the fluid
behaviour which is complicated in compare with fixed-beds, studying different
flows, particle sizes, temperature and pressure and their effect on fluidization.
Figure 1-3 Various kinds of fluid/solid particles contact from (Kunii &
Levenspiel 1991).
Page 30
1.Introduction
S. Sadjadi - January 2016 10
There are equations developed for calculating the minimum fluidization velocity.
As mentioned before, minimum fluidization happens when drag force by upward
moving gas is equal to weight of particles or in other words:
(𝒑𝒓𝒆𝒔𝒔𝒖𝒓𝒆 𝒅𝒓𝒐𝒑 𝒂𝒄𝒓𝒐𝒔𝒔𝒆 𝒃𝒆𝒅)(𝒄𝒓𝒐𝒔𝒔 𝒔𝒆𝒄𝒕𝒊𝒐𝒏𝒂𝒍 𝒂𝒓𝒆𝒂 𝒐𝒇 𝒓𝒆𝒂𝒄𝒕𝒐𝒓)
= (𝒗𝒐𝒍𝒖𝒎𝒆 𝒐𝒇 𝒑𝒂𝒓𝒕𝒊𝒄𝒍𝒆𝒔)(𝒔𝒑𝒆𝒄𝒊𝒇𝒊𝒄 𝒘𝒆𝒊𝒈𝒉𝒕 𝒐𝒇 𝒔𝒐𝒍𝒊𝒅𝒔) (1)
Ergun (Ergun, 1952) developed a pressure drop correlation for fixed-beds.
Bringing that pressure drop equation in the equation above would be:
(𝝆𝒔-𝝆𝒈)g=
150μ𝒖𝒎ƒ(1-𝜺𝒎ƒ)
𝝋𝒔𝟐𝒅𝒑
𝟐𝜺𝒎ƒ𝟑
+1,75𝒖𝒎ƒ
𝟐𝝆𝒈(1-𝜺𝒎ƒ)𝝆𝒈
𝝋𝒔𝒅𝒑𝜺𝒎ƒ𝟑
(2)
But the minimum fluidization velocity is still being seen empirically because the
experiments data differ from calculation due to complex fluid behaviour. Some
experimental data from Shirai’s work (1958) shown in Figure 1-4 plots the
pressure drop behaviour based on fluid velocity and which point is known to be
minimum fluidization point. What affects most on minimum fluidization is
particles classification.
Figure 1-4 Pressure drop versus gas velocity for a bed for a bed of uniformly
sized sand particles based on experimental data from (Shirai 1958).
Geldart (1973) suggested four classifications of particles based on their behaviour
with gas. He concluded that the behaviour of solid particles is just based on their
size and their density difference with the fluid. Figure 1-5 represents the result of
his work on powder classifications and as it can be seen the particle (average) size
and density both play roles in that classification.
Page 31
1.Introduction
S. Sadjadi - January 2016 11
Powder group A shows dense phase expansion after minimum fluidization and
before bubbling, group B particles bubble at minimum fluidization velocity,
particles in group C are so difficult to fluidized and the group D can form stable
spouted beds. The problem with group A particles is agglomeration in highly
exothermic reactions because of small particle size and cohesion. Group C
particles have strong inter-particle forces and wouldn’t be recommended for
highly exothermic reaction again and Geldart D particles cannot be used in small
scale reactors because of high velocity needed to fluidize. Therefore group B was
chosen for this study. The particle size used for this study is between 300 – 500
µm and the density difference of gas and particles is in range of 1 – 2 g/cm3.
Figure 1-5 Geldart particle calssification (Geldart 1973) and the range chosen for
this work.
It is then important to choose which classification for specific reactor scales. The
development of using fluidized-bed reactors in industry benefited a lot from
Geldart’s work.
The huge breakthrough of fluidized-bed was in 1942, by catalytic cracking of
gasoil into gasoline at Baton Rouge refinery of Standard Oil of New Jersey, new
Page 32
1.Introduction
S. Sadjadi - January 2016 12
Exxon, although the technology was introduced much earlier in 1926 by Winkler
to produce syn-gas from coal in Germany. Catalytic cracking deposits
carbonaceous products on the catalyst, causing fast deactivation of the catalyst. To
continue the production capacity, the coke had to be burned. In order to eliminate
the cycling, attempts were made to circulate the catalyst and burn off the coke in a
separate vessel, the regenerator. The first approach was using a moving catalyst
bed: in the reactor the catalyst moves downwards against the fluid into the
regenerator. From the regenerator the catalyst was returned to the top of the
reactor by a bucket conveyor. Later, the conveyor system was replaced by a gas
lift. It was then found that the dense mixture of solids and gas behaved like a fluid
and this makes the control of the system much easier. This process was called
fluid catalytic cracking, FCC (Froment & Bischoff, 1990). Afterwards many FCC
plants were built industrially and also fluidization technology was used in many
chemical and petrochemical processes such as producing Phtalic anhydride, Vynil
acetate, Acrylonitrile, Ethylene dichloride and etc. or in processes like Fischer
Tropsch, solid waste gasification, limestone calcinations and etc.. Some
advantages and disadvantages of fluidized-bed reactors are listed in the Table 1-1
based on Kunii and Levenpiel’s book (Kunii & Levenspiel, 1991).
As being seen, the advantages of fluidized-bed reactor over other types of
reactors, is based all on great heat transfer because of fluid behaviour of the whole
bed. This is a key factor for highly exothermic reactions like OCM.
Fixed bed reactors and membrane reactors have been studied widely for the OCM
reaction in combination with different catalysts but fluidized-bed reactors were
investigated less.
Page 33
1.Introduction
S. Sadjadi - January 2016 13
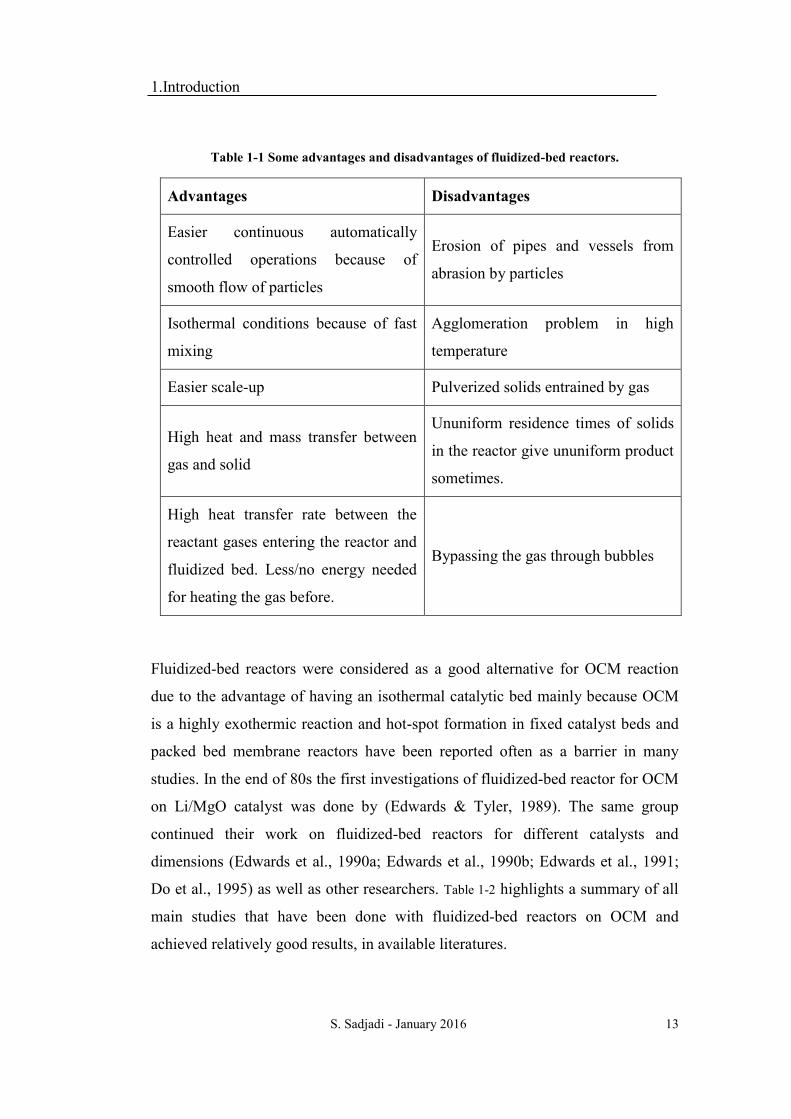
Table 1-1 Some advantages and disadvantages of fluidized-bed reactors.
Advantages Disadvantages
Easier continuous automatically
controlled operations because of
smooth flow of particles
Erosion of pipes and vessels from
abrasion by particles
Isothermal conditions because of fast
mixing
Agglomeration problem in high
temperature
Easier scale-up Pulverized solids entrained by gas
High heat and mass transfer between
gas and solid
Ununiform residence times of solids
in the reactor give ununiform product
sometimes.
High heat transfer rate between the
reactant gases entering the reactor and
fluidized bed. Less/no energy needed
for heating the gas before.
Bypassing the gas through bubbles
Fluidized-bed reactors were considered as a good alternative for OCM reaction
due to the advantage of having an isothermal catalytic bed mainly because OCM
is a highly exothermic reaction and hot-spot formation in fixed catalyst beds and
packed bed membrane reactors have been reported often as a barrier in many
studies. In the end of 80s the first investigations of fluidized-bed reactor for OCM
on Li/MgO catalyst was done by (Edwards & Tyler, 1989). The same group
continued their work on fluidized-bed reactors for different catalysts and
dimensions (Edwards et al., 1990a; Edwards et al., 1990b; Edwards et al., 1991;
Do et al., 1995) as well as other researchers. Table 1-2 highlights a summary of all
main studies that have been done with fluidized-bed reactors on OCM and
achieved relatively good results, in available literatures.
Page 34
1.Introduction
S. Sadjadi - January 2016 14
Tyler’s group (Do et al., 1995) reported relatively high yield from fluidized-bed
reactor with two types of catalysts. They argue the advantage of the fluidized-bed
reactor over other types of the reactor because of its easier control of the heat
release and being able to remove the catalyst from the reactor during the reaction.
They reported, like others following in this chapter, that the increase of oxygen
reduces the selectivity of the reaction but it increases the methane conversion.
What missing in their study was to have a stability test for the catalysts in their
set-up. They also had an ongoing research, known as OXCO process (Edwards et
al., 1991), in which a single fluidize-bed reactor was used to combine OCM with
pyrolysis of ethane and other hydrocarbons of natural gas. The important feature
was the pyrolysis of ethane to ethylene using the heat generated from OCM. This
was achieved by injection of alkanes into the top part of the fluidized-bed reactor
which no oxygen existed anymore. The pyrolysis was carried out under isothermal
conditions using heat which is transferred continuously from the OCM zone to the
pyrolysis zone by recirculation of the particles. They could achieve up to 47%
ethylene selectivity at methane conversion of 24%. Overall in that OXCO study,
maximum C2 yield they achieved in 60mm diameter fluidized-bed reactor was
around 15%.
Mleczko et al. (1996a) also reported same trends of reaction engineering
parameters effect on OCM regarding the oxygen partial pressure but they also
reported on fluidization difficulty because of agglomeration problem they faced
during the experiments.
Andorf (Andorf & Baerns, 1990) used high fluidization velocities to avoid the
agglomeration problem and reported better results in fluidized-bed reactor rather
than other types of the reactor. Santos (Santos et al., 1995) discusses two
drawbacks of fluidized-bed reactors which is related to bypass of the gas through
bubbles- which in the case of OCM would be more important because of low
selectivity of gas phase reactions (Lane & Wolf, 1988) - and back mixing which
Page 35
1.Introduction
S. Sadjadi - January 2016 15
can also reduce the selectivity (Kunii & Levenspiel, 1991). Therefore, low
fluidization velocities have been chosen by them to avoid these drawbacks.
Wang (1997) and Talebizadeh (2009) reported working with the Na2WO4-
Mn/SiO2 catalyst in fluidized-bed reactors, but these studies do not aim at
optimizing reaction parameters such as temperature and feed composition.. In
Wang et al. study, a 200 ml stainless steel reactor was used and they didn’t report
on the problems of the stainless steel material and how they solved the problem.
The previous works before this thesis have showed detailed results of a 500 ml
quartz glass fluidized-bed reactor for 2.2%Na2WO4-2%Mn/SiO2 catalyst (Sadjadi
et al., 2015). All reaction parameters affect have been studied in this work and it
reported the highest yield in OCM fluidized-bed reactor studies.
Table 1-2 Different studies with fluidized-bed reactors for OCM.
Author Catalyst Temp.
°C
C2
Yield
Reactor
Material
(Do et al.,
1995)
Na promoted Sr-
Bentoite 850 °C 19.4% Quartz
Glass (Sr0.2Mg0.8)CO3Zr0.01Cl0
.04 850 °C 18.1%
(Mleczko et al.,
1996a)
La2O3/CaO 840 °C 16.0% Quartz
Glass Zr/Sr/La 880 °C 18.0%
(Andorf &
Baerns, 1990)
NaOH/CaO 800° C 13.5% Quartz
Glass Pb/y-Al2O3 800° C 11.3%
(Santos et al.,
1995)
Li/MgO 800 °C 16.8% Quartz
Glass Li/Sn/MgO 800°C 21.8%
(Wang et al.,
1997) Na2WO4-Mn/SiO2 875° C 19.4% Stainless Steel
(Talebizadeh et
al., 2009) Na2WO4-Mn/SiO2 800° C 19.0%
Quartz
Glass
(Sadjadi et al.,
2015) Na2WO4-Mn/SiO2
750 –
840
°C,
19.6% Quartz
Glass
Page 36
1.Introduction
S. Sadjadi - January 2016 16
1.3.2 Fluidized-bed-membrane Reactor
Fluidized-bed membrane reactors are chemical integrated types of reactors (with
heterogeneously catalyzed reactions) in which membranes can be used to extract
products or to dose the reactants in fluidized-bed. Fluidized-bed reactors are
famous for their advantage of excellent heat transfer and having an isothermal
catalyst bed especially for exothermic reactions, and membrane reactors are being
used for catalytic reactions and separation processes and are well known for the
advantage of shifting the reaction equilibrium to the product side and higher
product selectivity. Fluidized-bed-membrane reactors (FBMRs) can use the both
reactor concepts advantages. Some of the most known advantages of FBMRs are
integrated separation (when membranes are used for separating a product),
excellent dosing of a reactant (when membranes are used to dose reactants), good
heat and mass transfer and low pressure drop (Roghair et al., 2014).
FBMRs were being patented first in 90s for separating hydrogen from fluidized-
bed methane reforming by Adris et al. (1991; 1994; 1997).
Mleczko (Mleczko, et al., 1996b) studied this concept of reactor for oxidizing
methane to syn-gas, using the membrane to separate the hydrogen. In his study the
reaction happens from 700 till 800 °C and two types of membranes, Palladium
and ceramic membranes have been tested, and the comparison results of FBMR
set-up with conventional membrane reactor shows a really high improvement in
the yield of the process (Ostrowski et al., 1997). They discussed the importance of
the interaction between membrane and bed hydrodynamics as a primary
importance. This means the interaction of emulsion phase and bubbling phase.
Many researches in the last decade followed to study using the FBMRs for
extracting hydrogen (Grace et al., 2005; Patil et al., 2007; Gallucci et al., 2008;
Chen et al., 2008). There have been both simulation (theoretical) and experimental
works.
Page 37
1.Introduction
S. Sadjadi - January 2016 17
Another application of FBMRs is to dose a reactant, mainly oxygen, which is
under focus here because of its use in this current work. These reactors can be
called membrane assisted fluidized-bed reactors as well. Al-Sherehy (Al-Sherehy
et al., 2005) studied this concept for dehydrogenataion of ethane to ethylene but
with injection of oxygen along the height of a fluidized bed reactor which can be
close to FBMR concept in this work application.
Ahchieva (Ahchieva et al., 2005) used fluidized-bed-membrane reactor for dosing
the oxygen in ethane dehydrogenation reactor and achieved higher yield and
selectivity in compare with fluidized-bed and packed-bed reactors. The
advantages of safety and large-scale application of FBMR is being discussed in
their work and higher yield and selectivity of ethylene is reported in a pilot-plant
scale reactor with one membrane immersed in compare with more numbers of
membranes.
Deshmukh (Deshmukh et al., 2005a) studied partial oxidation of methanol to
formaldehyde with ceramic membranes both experimentally and theoretically.
What is also interesting in both studies of Al-Sherehy et al. and Deshmukh et al.
for dosing oxygen is the possibility to use higher amount of oxygen in compare
with composition allowed for conventional fluidized-bed reactors (FBRs) from
safety point of view.
Abashar (Abashar et al., 2008) worked on dosing oxygen in a FBMR reactor for
hydrogen production. In this concept the membranes are installed to separate the
product, hydrogen, and the oxygen is being dosed in different heights separately
but not through membranes. In explanation of the reason for not using membranes
in this case, low permeation flux of oxygen through the dense membranes was
being discussed. And the risk of reactor temperature run away is minimized as
well by leveling the temperature profiles and the elimination of immersed oxygen
tubes.
Page 38
1.Introduction
S. Sadjadi - January 2016 18
In general, very limited studies have been done on the concept of FBMRs with
distributing of oxygen for catalytic oxidation.
While CFD simulations on FBRs give an almost good view about the
hydrodynamic of these reactors, it is yet not developed that well for FBMRs.
Therefore, experimental studies on hydrodynamic of FBMRs have a high
importance for the ones studying them. Annaland and his group worked on
FBMRs detailed and specifically on the effect of membranes on hydrodynamic of
fluidized-bed reactors for more than a decade (Roghair et al., 2014; Patil et al.,
2007; Gallucci et al., 2008; Dang et al., 2014; 2011; 2012a; 2012b; 2012c; 2012d;
2013; Deshmukh et al., 2003; 2005a; 2005b; 2007a; 2007b; Tan et al. 2014).
Here more detailed studies of the latter groups would be discussed because these
are the only available scientifically studies on FBMRs and the hydrodynamic in
these reactor set-ups. The main experimental set-ups of Annaland’s group in this
field is about fluidized-bed reactors in which the side membrane walls, vertical
and horizontal membranes are installed to extract or add gas. In current OCM
FBMR work concept vertical membranes are used to add gas through them in the
fluidized catalyst bed regarding the previous simulations results (Jaso, 2012).
Therefore, the elimination of gas and horizontal membranes are not going to be
discussed.
The experimental study from this group which was used to design some of the
current work experiments is shown in Figure 1-6 which is a fluidized-bed reactor
with membrane walls and the bed behaviour was studied using particle image
velocimetry (PIV) and digital image analysis (DIA) methods.
PIV works through dividing the recorded images into small interrogation areas
and using spatial cross-correlation on two consecutive images so the velocity of
each zone can be calculated. This method was used to estimate the velocity of the
particles and their direction. The advantage of PIV lays on the possibility to
achieve instantaneous flow fields by just two high-speed images of the bed. DIA
Page 39
1.Introduction
S. Sadjadi - January 2016 19
was used to analysis the pixel intensity to separate gas (bubble) and emulsion
phase. There were special algorithms used to detect the bubbles and calculating
their diameters.
All reported results from this set-up include a reference one which is the same set-
up without the membranes; neither extraction nor addition of gas from membranes
has been carried out. The results from addition of gas from membranes (the
extraction of gas is not described here) show that the catalyst bed expands more in
this case in compare with the reference one, the particles circulate in opposite
direction (in conventional fluidized-bed reactors the particles tend to go up from
the centre and come down near to the walls but in case of having gas addition
through membranes, the particles tend to move upwards close to membranes and
come downwards from the centre), the bubbles increase in number and increase
slightly in size.
Figure 1-6 Pseudo-2D fluidized bed setupfrom Annaland’s group used for optical
measurement techniques PIV and DIA from (Roghair et al. 2014).
Page 40
1.Introduction
S. Sadjadi - January 2016 20
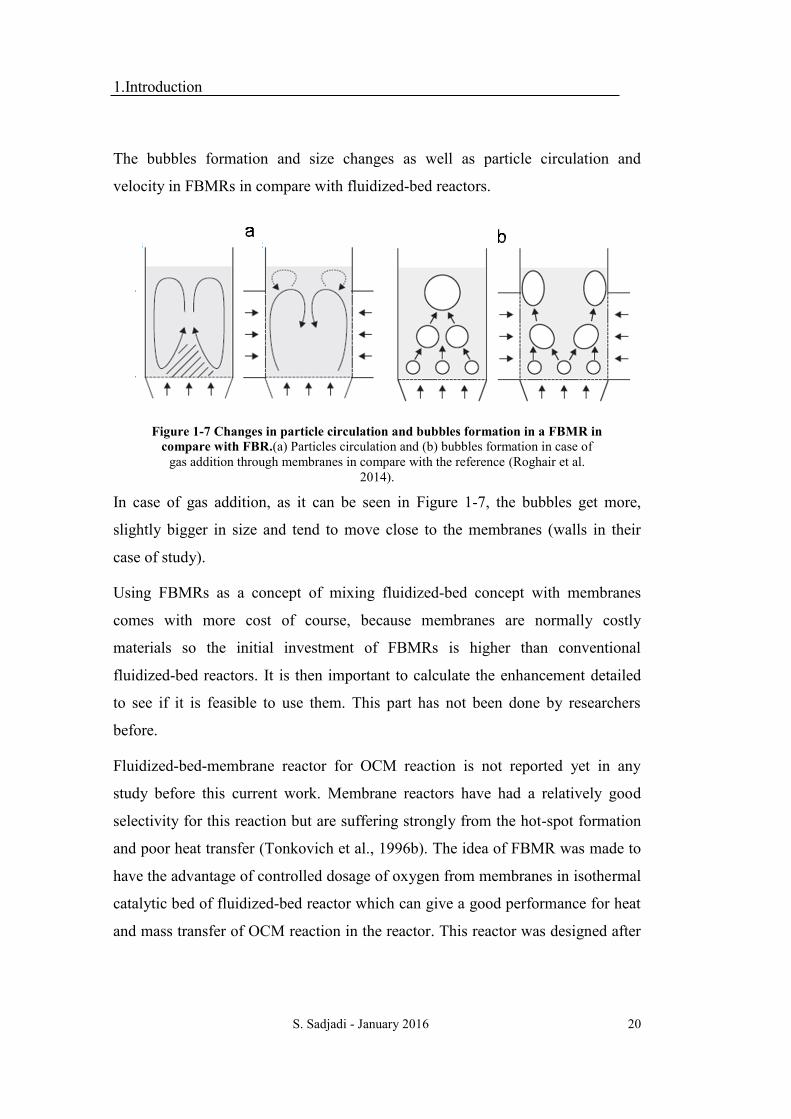
The bubbles formation and size changes as well as particle circulation and
velocity in FBMRs in compare with fluidized-bed reactors.
Figure 1-7 Changes in particle circulation and bubbles formation in a FBMR in
compare with FBR.(a) Particles circulation and (b) bubbles formation in case of
gas addition through membranes in compare with the reference (Roghair et al.
2014).
In case of gas addition, as it can be seen in Figure 1-7, the bubbles get more,
slightly bigger in size and tend to move close to the membranes (walls in their
case of study).
Using FBMRs as a concept of mixing fluidized-bed concept with membranes
comes with more cost of course, because membranes are normally costly
materials so the initial investment of FBMRs is higher than conventional
fluidized-bed reactors. It is then important to calculate the enhancement detailed
to see if it is feasible to use them. This part has not been done by researchers
before.
Fluidized-bed-membrane reactor for OCM reaction is not reported yet in any
study before this current work. Membrane reactors have had a relatively good
selectivity for this reaction but are suffering strongly from the hot-spot formation
and poor heat transfer (Tonkovich et al., 1996b). The idea of FBMR was made to
have the advantage of controlled dosage of oxygen from membranes in isothermal
catalytic bed of fluidized-bed reactor which can give a good performance for heat
and mass transfer of OCM reaction in the reactor. This reactor was designed after
Page 41
1.Introduction
S. Sadjadi - January 2016 21
detailed CFD simulations of Dr. Jaso (Jaso et al., 2011) and the experimental
results are discussed in this current work.
1.4 Reactor Material
Quartz glass reactors have been widely tested for OCM laboratory scales and also
for fluidized-bed reactors as can be seen in Table 1-2. There are few studies using
stainless steel as the reactor material (Wang et al., 1997; Liu et al., 2008; Bhasin,
1988; Chou et al., 2002a; Beck et al., 2014; Thien et al., 2008). Bhasin (1988)
discussed the reactivity of stainless steel for OCM and since then this
disadvantage has been taken into account. For some studies, however, especially
for experiments involving elevated pressures, this material has been chosen,
reporting the solutions to deal with reactor wall reactivity and also against
poisoning the catalyst due to the reactor material (Thien et al., 2008; Beck et al.,
2014). Beck (2014) used a corundum tube inside the stainless steel reactor to
avoid the contact with gas.
FeCrAlloy has been chosen to be studied for OCM in this work. This alloy is one
of the most resistant alloys against oxidation at high temperatures.
1.5 Elevated Pressure Influence on OCM
Elevated pressure tests are necessary for future industrial application of OCM,
which was not studied widely before.
Ekstrom et al. (1990), Liu et al. (1998), Chou et al. (2002b; 2003; 2004), Ahari et
al. (2011; 2013), and Beck et al. (2014) tested elevated pressures influence for
different catalysts. Since the pressure influence can be different on different
systems, here the Na-W-Mn/SiO2 catalytic system in a fluidized-bed reactor
would be under focus. The results are not compatible. All of the studies
mentioned above were done for fixed-bed reactors. Ekstrom reports decrease in C2
products and selectivity at elevated pressure (Ekstrom et al., 1990). The same
Page 42
1.Introduction
S. Sadjadi - January 2016 22
findings were reported by Chou et al. (2002b) but the stainless steel material of
the reactor was not considered to be studied as one factor of influence in their
work. Ahari et al. (2011) which tested elevated pressure influence at low flow and
temperature reported a decrease in C2 selectivity while ethylene/ethane ratio
remained the same at elevated pressure in their work.
Beck et al. (2014) had tested an empty reactor as well as the same reactor filled
with quartz granules and the reactor filled with quartz granules plus Na-W-
Mn/SiO2 catalyst till 10 bar and the filled reactor with granules of quartz and
catalyst showed much higher C2 yields and selectivity at higher pressures. The
packed-bed reactor was made of stainless steel but a corundum tube was installed
inside to avoid the wall reactivity of the reactor. The methane/oxygen ratio was
really high equal to 19 in all experiments due to safety issues they mentioned and
probably to maintain the selectivity high as the major factor under investigation.
They discussed the shift to the explosion region for lower amount of oxygen at
higher pressures. The temperature was fixed at 700 °C. They reported an
enhancement in C2 selectivity at elevated pressure till 10 bar with temporal
analysis of products (TAP) method.
1.6 Objectives of this thesis
To think forward for industrial application of OCM in the current time that oil
resources are more limited than natural gas resources, many aspects of OCM
research should be considered. Scale-up possibilities, reactor material and novel
ideas of reactors are among the aspects which need to be overviewed when talking
about commercializing the OCM process.
The main two barriers for having OCM as a commercialized process are:
- High amount of heat release which leads to hot-spots and reduction of
the product selectivity
Page 43
1.Introduction
S. Sadjadi - January 2016 23
- Low selectivity of catalysts in contact with more oxygen (at higher
methane conversions)
As it was discussed thoroughly in the last parts, fluidized-bed reactors are good
solution for scale-up reactors of OCM because of their advantage for controlling
the heat. Huge heat release of OCM reactions is one of the difficulties of OCM
and having an isothermal catalyst bed to be able to control the heat release is the
main advantage of fluidized-bed reactors for OCM.
The first barrier stays the same with packed-bed and membrane reactors for
different kinds of catalysts especially in bigger scales, therefore; fluidized-bed
reactor concept has been chosen for this study.
The initial finding of a quartz glass fluidized-bed reactor with 40 mm diameter is
discussed detailed in previous works of the same department (Jaso, 2012; Sadjadi
et al., 2015). Highest results achieved in these works are C2 yield of 19.6% for
Na-W-Mn/SiO2 catalytic system with C2 selectivity of 40%. This current work is
in continuation of the previous one, studying two fluidized-bed reactors with the
dimension of 56 mm diameter (volume 1100 ml); one made of quartz glass and
one FeCrAlloy to study the material effect and elevated pressure influence. The
dimension of the current work fluidized-bed reactors are the biggest scale in
accessible literatures for this catalytic system. The material FeCrAlloy is studied
because of failure of stainless steel for OCM due to high reactivity at high
temperatures in contact with oxygen. Stability test of this catalyst in the fluidized-
bed reactor is another aspect of the work which has not been studied before in
such scale of reactor.
Developing new ideas for reactor design of OCM is necessary since the
conventional types of reactors have been studied widely before and each has their
own disadvantages for OCM. Combining new ideas to develop a new concept of
reactor, which known as process intensification (PI), should be one direction of
expanding the research on this theme.
Page 44
1.Introduction
S. Sadjadi - January 2016 24
To work on the second barrier, the fluidized-bed-membrane reactor has been
designed for dosing oxygen in fluidized-bed of the reactor and to study the
influence of it. There were several CFD simulations before designing this reactor
included in the previous work (Jaso, 2012) which is the starting point of this part
of the current work. The fluidization would help the heat transfer by offering an
isothermal bed and the membranes would help the selectivity of the reaction by
dosing the oxygen. For that, two types of porous membranes are studied,
Hastelloy X membranes and ceramic ones due to study the influence of the
membrane material on the performance as well.
Na-W-Mn/SiO2 catalyst has been chosen for this work because of its promising
performance for OCM among other catalysts and its reported high stability as
well. Previous works reported the agglomeration problem of 2%Mn–
4.5%Na2WO4/SiO2 catalyst which leaded this work to test lower sodium content
catalyst 2%Mn–2.2%Na2WO4/SiO2 to avoid the agglomeration problem for low
fluidization. Most of the main experiments are done with the catalyst prepared by
incipient impregnation method but there are tests with this catalyst prepared by
fluidized-granulator method as well as mesoporous silica one in the fluidized-bed
reactor.
For studying different parameters of the reaction engineering of OCM,
methane/oxygen ratio, reaction temperature, fluidization velocity and nitrogen
dilution are the parameters which are going to be discussed in this work in
fluidized-bed reactors (FBRs) made of quartz glass and FeCrAlloy. Fluidized-bed-
membrane reactor is going to be discussed in a different chapter.
In summary, this work aims to study these:
- Reactor material influence in FBRs
- Elevated pressure in FBR
- Scale-up study and comparison with smaller scale FBRs in previous
works
Page 45
1.Introduction
S. Sadjadi - January 2016 25
- Methane/oxygen ratio, nitrogen dilution, fluidization velocity and
temperature effect in FBRs
- Stability test of 2%Mn–2.2%Na2WO4/SiO2 in FBR
- Other preparation methods of Na-W-Mn/SiO2 and their application for
OCM FBRs
- FBMR and its application for OCM
Experimental set-up is going first explained in chapter 2 and results plus
discussions in chapter 3 and 4 following.
Page 46
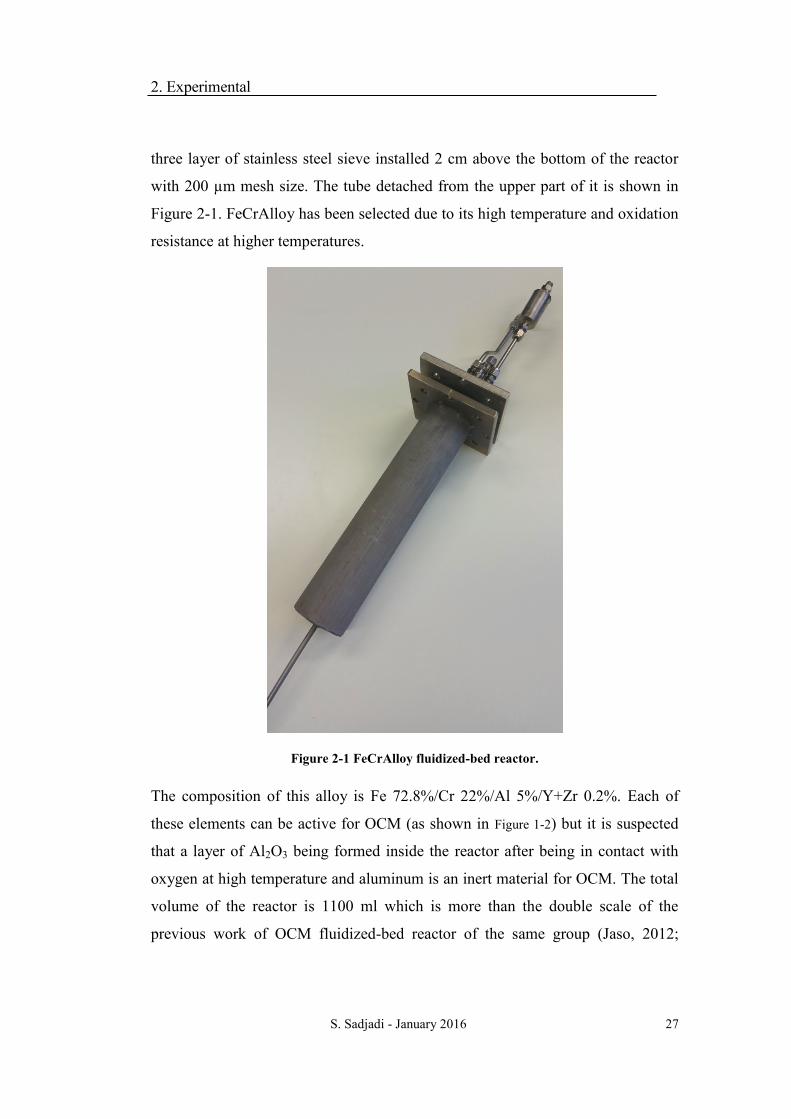
2. Experimental
S. Sadjadi - January 2016 26
2 EXPERIMENTAL SET-UPS
& PROCEDURES
2.1 Fluidized-bed Reactors
Two fluidized-bed reactors made of FeCrAlloy and quartz glass materials, with
the same dimensions, were tested in this work. Each of them is going to be
explained in following sections.
2.1.1 FeCrAlloy Reactor
The FeCrAlloy1 fluidized-bed reactor tested in this work is a FeCrAlloy material
tube with inner diameter of 56 mm and length of 450 mm. The gas distributer is
1 FeCrAlloy is being written Fecralloy or Fe-Cr alloy as well in different literatures.
Page 47
2. Experimental
S. Sadjadi - January 2016 27
three layer of stainless steel sieve installed 2 cm above the bottom of the reactor
with 200 µm mesh size. The tube detached from the upper part of it is shown in
Figure 2-1. FeCrAlloy has been selected due to its high temperature and oxidation
resistance at higher temperatures.
Figure 2-1 FeCrAlloy fluidized-bed reactor.
The composition of this alloy is Fe 72.8%/Cr 22%/Al 5%/Y+Zr 0.2%. Each of
these elements can be active for OCM (as shown in Figure 1-2) but it is suspected
that a layer of Al2O3 being formed inside the reactor after being in contact with
oxygen at high temperature and aluminum is an inert material for OCM. The total
volume of the reactor is 1100 ml which is more than the double scale of the
previous work of OCM fluidized-bed reactor of the same group (Jaso, 2012;
Page 48
2. Experimental
S. Sadjadi - January 2016 28
Sadjadi et al., 2015). The aim for designing this scale and material of the reactor
was to study this material effect on the performance for OCM in compare with
quartz glass which is an inert material, to investigate the elevated pressure effect
which has not been possible in quartz glass reactor and to study this stage of
scale-up using the results from previous work smaller reactor.
The capacity of the previous works fluidized-bed reactor, in UniCat2 OCM mini-
plant, with 40 mm inner diameter was to carry up to 40 g of Na2WO4-Mn/SiO2
catalyst (Jaso, 2012), but this scaled-up reactor is designed for bigger amounts of
catalyst. It can carry 50-200 g of this catalyst with particle size of 200-500 µm.
Nevertheless, the amount of 55 g of catalyst has been chosen for most of the
experiments because of having lower costs of using catalyst and having some
limitations to prepare catalysts in big batches. Another factor should be mentioned
in this scale of reactor in compare with the smaller scale one, is less effect of
reactor walls on fluid dynamics of fluidization in the reactor. In this case the
bubbles are supposed to be bigger and faster.
As it can be seen in Figure 2-1, there is a cyclone installed at outlet of the reactor
for collecting the particles leaving the reactor for higher gas velocities.
2 “Unifying Concepts in Catalysis” (UniCat) is a Cluster of Excellence within the framework of
the Excellence Initiative researching the field of catalysis. This project is part of OCM project of
UniCat.
Page 49
2. Experimental
S. Sadjadi - January 2016 29
2.1.2 Quartz Glass Reactor
The quartz glass reactor with the same diameter of FeCrAlloy reactor was
designed to study the effect of reactor material on OCM and to study the
minimum fluidization velocity for the cases of fluidized-bed reactor and fluidized-
bed membrane reactor as well and to be able to have a base of comparison for
FeCrAlloy effect since quartz glass is almost an inert material for OCM. As it can
be seen in Figure 2-2, the top part of the tube was designed in a way to have the
possibility of installing two membranes inside as well for the case of fluidized-bed
membrane reactor and this possibility was used for experimenting minimum
fluidization in cold tests. The gas distributor is sintered quartz frit material with
average porosity of 200 µm installed 50 mm from the bottom of the reactor where
the inlet gas flows in. In all the experiments described in this work, quartz wool
was packed below the gas distributor for safety reasons.
Page 50
2. Experimental
S. Sadjadi - January 2016 30
Figure 2-2 Quartz glass reactor used as fluidized-bed reactor
with I.D. of 56 mm. (a) Not used one and dimensions, (b) used one with catalyst and
quartz wool inside.
2.2 Fluidized-bed membrane Reactor
The design of this FBMR is based on CFD simulations (Jaso et al., 2011) of Dr.
Stanislav Jaso which reported in his dissertation more detailed (Jaso, 2012). There
have been four case studies in his work of simulation. Two of the first case studies
were fluidized-bed reactors and two were FBMRs. First one was with ideal gas
distributor and the second one with perforated gas distributor. The third case study
Page 51
2. Experimental
S. Sadjadi - January 2016 31
was the same fluidized-bed reactor which had vertical membranes inside for
dosing the oxygen. The fourth case study was with vertical membranes as well but
distanced from the gas distributor (bottom). The experimental reactor was
designed based on the fourth case study because of better results based on
simulations. The reactor with metal membranes installed inside is shown in
Figure 2-3.
Figure 2-3 FBMR with metal membranes installed inside.
The fluidized-bed membrane reactor is the same FeCrAlloy tube explained above
as a fluidized-bed reactor with 56 mm inner diameter in which till maximum 4
membranes can be installed. Membranes used for FBMR were 6 mm outer
diameter tubes and 3 mm inner diameter from two different materials of Hastelloy
X and α-alumina membranes. As it can be seen in Figure 2-4, there can be four
membranes installed with outer diameter of 6 mm and in the middle there is 4mm
O.D. thermocouple to indicate and control the temperature profile inside the
reactor.
Page 52
2. Experimental
S. Sadjadi - January 2016 32
Figure 2-4 Dimensions of membranes inside FBMR (a) from the side (b) the top
flange from above.
The membranes are like normal tubes in the whole height of the reactor but just 45
mm in the bottom side of the tubes is porous material and the bottom end is
blocked that the gas leaves just horizontal. The upper side of tubes is a normal
stainless steel tube in case of metal membranes and enameled ceramic in case of
alumina membranes. The Hastelloy X porous material is ordered from GKN
Sinter Metals Filters and ceramic membranes are from Atech Innovations.
Figure 2-5 shows the two different membranes have been used in this reactor.
This reactor was designed to function with four membranes but at the very
beginning of the experiments, it was experienced that using four membranes cause
many mechanical limitations which make it almost impossible to use all four
membranes in this dimension of reactor. Simulations and design of Jaso (2012)
didn’t foresee the thermocouple which is in the center of the reactor and the small
distances between each membrane, the thermocouple and the reactor walls make it
Page 53
2. Experimental
S. Sadjadi - January 2016 33
hard to see the exact temperature and it stops the circulation of the particles.
Therefore, using two membranes, in line of diameter, was decided.
Figure 2-5 (a) Hastelloy X and (b) ceramic membranes are two types of
membranes have been used for FBMR.
The porosity of these two different membranes is different because there was no
company producing this small size porous materials with this specific porosity for
metal membranes and the choices were limited. Since the gas velocity from the
membranes in FBMR experiments is anyway low and there is also 2 g of silica
particles of 300-500 µm packed in the tubes to make a back pressure, it is
expected not to have a significant difference in the matter of porosity. The
membranes specification is summarized in Table 2-1.
Table 2-1 Membranes specifications used for FBMR.
Material Tube length Porous length Porosity Company
Page 54
2. Experimental
S. Sadjadi - January 2016 34
Hastelloy X 450 mm 45 mm 500 nm GKN
α-Alumina 450 mm 45 mm 20 nm Atech
Innovations
2.3 UniCat OCM mini-plant
This reactor system reported in this work is installed in the UniCat mini-plant at
Technical University of Berlin, with other projects involved (different reactors
and separation units) (Godini et al., 2013). The units are being operated
separately, aiming to incorporate them in the future. It is possible to observe and
study hot-spots in the catalyst bed in mini-plant scale reactors which might be not
clear in smaller scales of reactor. Hot-spots are an important focus of study in
OCM reaction research because of their tendency to decrease the selectivity of the
catalyst in long-running tests and making the temperature control difficult.
The units in UniCat OCM mini-plant are:
- Membrane reactor (And network of membrane reactors)
- Fluidized-bed (membrane) reactor
- Absorption column for CO2 removal
- Desorption column for regenerating the absorbent
- Adsorption separation process
- Polymeric membrane for CO2 separation
The mini-plant can be seen in Figure 2-6 in three floors and reactors are located in
the basement.
Page 55
2. Experimental
S. Sadjadi - January 2016 35
Figure 2-6 UniCat OCM mini-plant, Containing units of absorption, desorption,
adsorption, membrane CO2 removal, membrane and fluidized-bed (membrane)
reactors.
Page 56
2. Experimental
S. Sadjadi - January 2016 36
2.3.1 P&ID of the reactor set-up
A detailed P&ID of the reactor system can be seen in Appendix A- P&ID of the
Reactor System. However, Figure 2-7 is a simplified diagram of it which shows
all important items. There are six mass flow controllers providing O2, N2 and CH4
gas for the reactor. Three of them, as it can be seen in the diagram, are connected
to the bottom side of the reactor to provide fluidization gas and the other three are
connected to the membranes in case of fluidized-bed membrane reactor. The
reactor is installed in an electrical vertical 2 kW tube furnace.
Figure 2-7 Experimental set-up of the reactor system.
The gas leaves the reactor to a cyclone and filter for separating the particle which
might leave the reactor and to get the water condensed. There is a pressure
controller valve and a thermal volumetric flow meter installed in line to be able to
control the flow and pressure. The outlet gas leaves the whole set-up to a cold
flare after measurements of gas analyzer IR and micro-GC.
The temperature profile of the catalyst bed is measured by a multipoint
thermocouple installed inside the reactor which has 10 points of measurement
Page 57
2. Experimental
S. Sadjadi - January 2016 37
every 2 cm. By using this thermocouple, the temperature profile is being read
continuously during the experiments to evaluate the fluidization situation and
monitoring the agglomeration possibility. In case of perfect fluidization the first 5-
6 measurements of temperature shows an isothermal catalyst bed and it drops
drastically in free board of the reactor. The temperature of the tube furnace is
being controlled using another thermocouple installed inside the furnace.
2.3.2 Process Control System
The reactor set-up as well as the whole OCM mini-plant is connected to PCS7
Siemens control system, which is based on PLC S7-400. Computer based
Operator Station (OS) has the measurement data stored from this system and a
graphical human machine interface is used to visualize all connections and
measurements Figure 2-8. Safety issues extracted from HAZOP meeting are
considered in this control system programming. For example when temperature or
pressure of the system goes higher than accepted range, the oxygen source first
and then the flammable gas would be cut from the system.
The PCS7 software is programmed on three computers which leave the possibility
of monitoring three different interfaces or parts of the mini-plant simultaneously.
Overall there are 5 interfaces programmed there which are fluidized-bed (-
membrane) reactor, membrane reactor, adsorption, absorption and membrane CO2
separation.
Page 58
2. Experimental
S. Sadjadi - January 2016 38
Figure 2-8 PCS7 visualization for FBR and FBMR reactor set-up.
2.3.3 Gas Analysis IR and Micro-GC
All the experimental results reported in this work are based on data from S700 gas
analyzer manufactured by Sick and an Atex Zone 2 online micro gas
chromatograph manufactured by Varian Inc..
2.3.3.1 Sick S700 Gas Analyzer
The Sick S700 gas analyzer can measure five components of CO2, CH4, C2H6,
C2H4 and O2. The first four components are measured using UNOR module and
oxygen using OXOR-P component. UNOR module is a highly selective NDIR
analyzer for continuous measurements of almost any gas component which
absorbs in the infra-red (IR) spectral range. O2 molecules which cannot be
absorbed in IR are detected separately.
Page 59
2. Experimental
S. Sadjadi - January 2016 39
More detailed explanation of the IR measurements can be found in PhD thesis by
S. Jaso (Jaso, 2012), PhD thesis by X.S. Nghiem (Nghiem, 2014) and H.R. Godini
(Godini, 2014) from the same group.
2.3.3.2 Varian Online Micro-GC
The micro-GC used in this work is an atex zone 2 online micro-GC located in
OCM mini-plant, which is connected to a control computer Optiplex 740 in the
OCM mini-plant control room. The software being used is ProStation.
The plug flow diagram of the connection of micro-GC is illustrated in Figure 2-9.
Figure 2-9: Plug flow diagram of micro-GC connection.
The gas from the reactor first meets a condenser and a filter to eliminate all water
molecules and particles and then the micro-GC which has two channels. Helium
and Argon are the two carrier gases used in two channels in this online micro-GC
with purity of 99.995%. Helium is the best carrier gas after H2 for fast online
samples.
The sample gas should have pressure between 0 and 100 kPa and temperature
between 0 and 110 °C.
Page 60
2. Experimental
S. Sadjadi - January 2016 40
The micro-GC has a micro-TCD (thermal conductivity detector) installed inside
and two columns of Molsieve 5A 20m and PPQ 10m. The channels settings are:
- Channel 1 Molsieve 5A: 150 °C and 200 kPa
- Channel 2 PPQ: 50 °C and 150 kPa
Table 2-2 is pick identification in calibration process of micro-GC. As it can be
seen channel 1 detects O2, N2, CH4 and CO and channel 2 detects N2, CH4, CO2,
C2H4 and C2H6. The peak times can be moved during the time, especially in case
of this micro-GC which is not used 24 hours every day so it is necessary to have
the calibration process after every week of experiments. More detailed
explanations about micro-GC calibration can be read in Appendix D - Micro-GC
Calibration
Table 2-2 Micro-GC calibration peak identification.
Channel
1 ID Time
Level
1
Level
2
Level
3
Level
4
Level
5
Level
6
O2 1 107.32 - - - - 20 -
N2 2 122.38 - 60 76.1 76.1 80 100
CH4 3 151.29 70 - - - - -
CO 4 172.98 - 10 - - - -
Channel 2
N2 1 22.35 - 60 76.1 76.1 80 100
CH4 2 25.29 70 - - - - -
CO2 3 31.12 30 10 - - - -
C2H4 4 42.6 - 10 23.9 - - -
C2H6 5 49.2 - 10 - 23.9 - -
In Figure 2-10 a typical measurement of micro-GC is shown and as it can be seen
there are precise measurements of both channels in a table and graphs of picks.
On the right side it is the settings for that measurement and time calculation.
Page 61
2. Experimental
S. Sadjadi - January 2016 41
Figure 2-10 Typical measurement of micro-GC.
Micro-GC is highly accurate and in this work channel 2 was found more accurate
because of CO2 gas which probably poisons the Molesieve 5A. It can be
concluded that Sick S700 gas analyzer has around +/-5% error with comparison of
its results with online micro-GC.
Page 62
2. Experimental
S. Sadjadi - January 2016 42
2.4 SEM/EDX
The Scanning electron microscopy (SEM) and Energy dispersive X-Ray (EDX)
study3
was carried out using a Zeiss microscope (Gemini Leo 1530) with
integrated energy dispersive X-ray spectroscopy (Noran System, Thermo
Scientific – NSS software 6) to characterize surface compositions of FeCrAlloy
before and after being in contact with oxygen at high temperature. These
characterizations are being described in subchapter 3.1.
2.5 Experiments Procedure and Experimental Design
Each experiment from this work was designed for a specific temperature, total gas
flow and nitrogen percentage but varying the methane to oxygen ratio. The
catalyst bed temperature was controlled to stay constant with the temperature
controller of the furnace. Each data for specific gas composition has been taken
after 10 minutes of stabilizing.
The composition of the reactors outlet gas was measured by the online Sick 700
infrared gas analyzer (IR) for all the experiments and with the ATEX Zone 2
online micro gas chromatography (µGC) for 3.2.1, 3.3.1 and 3.3.3 in results and
discussion part. The IR gas analyzer can measure the components C2H4, C2H6,
CO2, CH4 and O2 while µGC can measure all those component plus CO and N2
with two channels.
3 SEM/EDX characterization was done by Dr. Oliver Görke from Ceramic Institute of TU Berlin
in collaboration with our group.
Page 63
2. Experimental
S. Sadjadi - January 2016 43
Most of the experiments for loaded fluidized-bed reactors, designed for
comparing the quartz glass and FeCrAlloy reactors, have been carried out for the
temperature range of 775-840 °C because the maximum product yield of the
process was suspected to be seen in this range and broader temperature profile
have been tested before for smaller scale reactor in previous works (Jaso, 2012;
Sadjadi et al., 2015). However, the fluidized-bed membrane reactor was tested for
single bed temperature of 830 °C. This temperature is supposed to be close to the
temperature which gives the maximum yield but studying the complexity of this
reactor system made it limited to test in one temperature and it was not aimed to
optimize the yield.
The methane to oxygen ratio was varied between 8 and 2 in experiments for both
fluidized-bed reactors. For the ratios higher than 8, the conversion and products
yield are so low and for the ratios lower than 2, the gas composition can be
explosive at higher temperatures. Therefore, the range of 8 to 2 was chosen. In
each experiment, at certain temperature, the total gas flow and the nitrogen
dilution percentage was fixed, first the ratio of 8 was tested and then step by step
with changing the amount of methane and oxygen, the ratios of 6, 5, 4, 3, 2.5 and
2 were tested.
The methane to oxygen ratio was fixed and not varied in the experiments for
fluidized-bed membrane reactor, as well as the temperature.
Elevated pressure tests have been done for catalyst bed temperature of 800 °C and
methane to oxygen ratio of 4 to study the effect of the pressure. However, the
absolute pressure over 4 bar was not tested due to the operational problems which
included agglomeration, defluidization and micro-GC/IR limitation for higher
pressure tests.
The procedure for each test is in summary: warming the reactor step by step each
100 °C and then waiting for stabilization of the temperature while the fluidization
gas amount containing 100% N2 was inserted from the bottom of the reactor.
Page 64
2. Experimental
S. Sadjadi - January 2016 44
When the reactor reached the reaction temperature in which the experiment was
designed to be carried out, the methane and nitrogen gas were open and
meanwhile the oxygen gas was increased step by step to reach the certain amount.
Letting the oxygen gas to increase step by step has an importance for safety
reasons as well as controlling the temperature in case of really active catalysts.
The amount of catalyst used for all the experiments of this work was 55-60 gr
which corresponds to the bed height to diameter ratio of 1.2. This ratio was
chosen to avoid catalyst entrainment and to provide a smooth fluidization.
Another important factor for choosing the amount of catalyst was related to
catalyst preparation difficulty for larger batches and the cost.
Shutting down process of the reactor was performed in this sequence:
- Shutting down the reactant gases. First O2 and then CH4
- Leaving 1000 – 3000 ml/min N2 gas flow through the reactor
- Shutting down the furnace
- Opening the valve of outlet gas to the flare
- Waiting till the temperature reaches below 150 °C before shutting down
N2 gas
The results in this study have been calculated like following:
YC2 =(C2H4 + C2H6) × 2
CH4in
SC2 =(C2H4 + C2H6) × 2
((C2H4 + C2H6) × 2) + CO2 + CO
SCOx =CO2+CO
((C2H4 + C2H6) × 2) + CO2 + CO
XCH4 =CH4 in − CH4out
CH4in
Page 65
2. Experimental
S. Sadjadi - January 2016 45
XO2 =O2 in − O2out
O2in
Page 66
3. Fluidized-bed Reactors, Results and Discussions
S. Sadjadi - January 2016 46
3 FLUIDIZED-BED
REACTORS, RESULTS AND
DISCUSSION
3.1 Empty Reactors and FeCrAlloy Oxidation
Based on previous knowledge regarding the possibility of oxidation of FeCrAlloy
in high temperatures in contact with oxygen (Bennett & Houton, 1978), it was
suspected from the beginning that different results would be achieved in
comparison with the quartz glass reactor, but it was necessary to have the direct
comparison between these reactors under the same conditions to precisely
determine the influence of the reactor material which is going to be discussed in
following parts. Before running the main experiments in full reactors, a test has
been carried out in both blank reactors, with high diluted composition of the gas
feed (for safety reasons). As can be seen in Figure 3-1, the empty FeCrAlloy
reactor converts CH4 and O2 much more than the glass reactor at the same
conditions.
Page 67
3. Fluidized-bed Reactors, Results and Discussions
S. Sadjadi - January 2016 47
The oxygen and methane conversion in empty reactors at 750 to 825 °C with 2
l/min total flow of gas containing 75% nitrogen, 20% methane and 5% oxygen
was studied. As can be seen in Figure 3-1 oxygen conversion in about 19% at
higher temperatures in the empty FeCrAlloy reactor, which is around 60% more
than the oxygen conversion in the empty glass reactor (11%) at 825 °C.
Figure 3-1 CH4 and O2 conversions in empty reactors with 2 l/min gas flow, 75%
N2 dilution and CH4/O2=4.
Page 68
3. Fluidized-bed Reactors, Results and Discussions
S. Sadjadi - January 2016 48
Methane conversion exhibits the same tendency for the FeCrAlloy reactor in
comparison with the glass reactor. FeCrAlloy behaves like an active material in
higher temperatures in contact with oxygen, and due to the catalytic behavior of
the material there would be more COx because of producing more radicals of
oxygen in gas phase which leads to have higher methane conversion for undesired
products as well.
To monitor the material changes during testing, an untreated fresh flat platelet of
FeCrAlloy and a platelet of FeCrAlloy with the same size which was left in the
empty reactor for 4 hours at 760°C with 2 l/min gas flow (75% N2, 20% CH4, 5%
O2) were analyzed by SEM and EDX. After being 4 hours in contact with oxygen
containing atmosphere the comparison shows the existence of metal oxides on the
surface (Figure 3-2). The growing oxide layer on the surface increases the oxygen
content at the surface from 0.6 to more than 11 wt% (EDX results). Also sodium
and even manganese with an irregular distribution could be detected at the surface
after the treatment. This is maybe related to the active components of the catalyst
which remained in the reactor. Due to diffusion processes under these conditions
the aluminum containing FeCrAlloy shows also significant aluminum and no
chromium enrichment at the surface. The SEM images before and after catalytic
testing show a slightly increase in roughness due to oxidation and the adhesion of
different species (primarily sodium).
It is also important to discuss that the wall material is more important in smaller
reactors rather than scaled-up ones because the ratio of reactor wall surface to
catalyst surface decreases in bigger reactors and the bubble size and velocity
which affects gas/solid mixing, yield and selectivity changes as well (Yang,
2003).
Page 69
3. Fluidized-bed Reactors, Results and Discussions
S. Sadjadi - January 2016 49
Figure 3-2 SEM of FeCrAlloybefore (1st row) and FeCrAlloy after being 4 hours
in the empty reactor at 760 °C, 75% N2, 20% CH4 and 5% O2 (2nd row).
Page 70
3. Fluidized-bed Reactors, Results and Discussions
S. Sadjadi - January 2016 50
3.2 Quartz Glass Fluidized-bed Reactor
The quartz glass fluidized-bed reactor was tested first with total flow of 5 l/min
which corresponds to u
umƒ= 2 (the minimum fluidization velocity of this reactor
containing 55 g of the catalyst was identified experimentally explained in
Appendix B – Minimum Fluidization Velocity Calculation) containing 50%
nitrogen, for methane/oxygen ratios of 6 and 2, in different temperatures between
700 and 845 °C. The results are plotted in Figure 3-3.
Figure 3-3 The influence of temperature on C2 yield, selectivity and CH4
conversion.Total gas flow of 5 l/min, 50% N2 dilution (a) C2 selectivity at
CH4/O2=6, (b) CH4 conversion at CH4/O2=6, (c) C2 yield at CH4/O2=6, (d) C2
selectivity at CH4/O2=2, (e) CH4 conversion at CH4/O2=2, (f) C2 yield at CH4/O2=2.
As it can be seen for both ratios, higher temperatures resulted in higher methane
conversion and C2 yields but there is a peak around 835 °C for C2 yield and
afterwards the selectivity reduces so sharp that the yield decreases as well. C2
selectivity increases by increase of temperature at lower temperature where lower
amount of CO and CO2 are getting produced but at higher temperature it starts to
Page 71
3. Fluidized-bed Reactors, Results and Discussions
S. Sadjadi - January 2016 51
decrease in contrary with methane conversion which increases. There are detailed
reports in previous works (Sadjadi et al., 2015), therefore; the range of this study
in following experiments, for both quartz glass reactor and FeCrAlloy reactor, get
narrowed to higher temperatures of 775 °C - 840 °C where the maximum C2 yield
is supposed to be seen and methane conversion is higher.
In all the experiments in this chapter as well as FeCrAlloy reactor part, 55 g of
catalyst have been used which corresponds to bed height to diameter ratio of 1,2-
1,3. Smaller particle sizes and smoother fluidization in lower fluidization
velocities are important for OCM (Santos et al., 1995). Therefore controlling the
fluidization behaviour before the slugging regime and avoiding back mixing is of
importance. The slugging regime is evident in the catalyst bed when the bed
height to diameter ratio is bigger than 2 (Yang, 2003).
3.2.1 Temperature and Methane to Oxygen Ratio Influence for
2.2%Na2WO4-2%Mn/SiO2 Catalyst
Studying the temperature influence and methane to oxygen ratio on OCM is one
of the main areas of OCM reaction engineering studies to find the optimum for C2
yield and selectivity.
For reaching the reaction temperature the reactor was fluidized and heated in
sequential. Different tests have been done in 775 °C, 800 °C, 825 °C, 835 °C, 840
°C and higher. In each experiment, for each temperature, the CH4/O2 ratio was
decreased from 8 to 2. Higher ratios doesn’t have much affect because of really
low methane conversion and lower ratios (lower than 2) might make the gas
explosive. As it is shown in Figure 3-4, increasing the O2 component affected the
methane conversion in a positive way.
Page 72
3. Fluidized-bed Reactors, Results and Discussions
S. Sadjadi - January 2016 52
Figure 3-4 Reaction temperature influence on methane conversion in glass
reactorat different ratios of methane to oxygen. Total gas flow of 5 l/min with 55%
N2 dilution, 55 g catalyst.
At lower temperatures and higher methane to oxygen ratio the methane
conversion is lower because of less oxygen available, therefore lower methane
conversion was observed.
The methane conversion reaches 42% at 835 °C with methane/oxygen ratio of 2
when the total feed gas is 5 l/min consisting 55% nitrogen.
As it is shown Figure 3-5, increasing the O2 component affected the selectivity in
negative way in contrary with methane conversion. This is due to have more
unwanted products in higher temperatures with higher oxygen component
available. The selectivity of products decreases from 83% at 775°C with methane
to oxygen ratio of 8 to 45% at 835 °C with methane/oxygen ratio of 2 where the
maximum of methane conversion has been seen. The yield was increased in each
step of reducing the methane to oxygen ratio as can be seen in Figure 3-6.
Page 73
3. Fluidized-bed Reactors, Results and Discussions
S. Sadjadi - January 2016 53
Figure 3-5 Reaction temperature influence on C2 selectivity in glass reactor at
different ratios of methane to oxygen. Total gas flow of 5 l/min with 55% N2
dilution, 55 g catalyst.
Figure 3-6 Reaction temperature influence on C2 yield in glass reactor at
different ratios of methane to oxygen. Total gas flow of 5 l/min with 55% N2
dilution, 55 g catalyst.
Page 74
3. Fluidized-bed Reactors, Results and Discussions
S. Sadjadi - January 2016 54
The highest yield achieved in this condition (total gas flow of 5 l/min with 55%
nitrogen dilution), for the glass reactor is 19.5% at 835°C.
There is 100% oxygen conversion at higher temperatures which is because of the
increase in catalyst activity. As it can be seen in Figure 3-7 oxygen conversion
increases as the temperature goes high and it is slightly higher with higher
methane/oxygen ratios because of less available oxygen. But in higher
temperatures than 820°C there is 100% conversion of it at any ratio.
C2 selectivity decreases at higher temperatures because of high oxygen conversion
which leaves upper part of the catalyst bed without oxygen and promotes
unwanted reactions which produces unwanted CO2 and CO. But on the other hand
full oxygen conversion is important for safety reasons that no free oxygen leaves
the reactor.
Figure 3-7 Reaction temperature influence on oxygen conversion in glass
reactor at different ratios of methane to oxygen. Total gas flow of 5 l/min with 55%
N2 dilution, 55 g catalyst.
The decrease of C2 selectivity and increase of COx selectivity while rising the
temperature is not sharp seen in Figure 3-5 and Figure 3-8 because the
Page 75
3. Fluidized-bed Reactors, Results and Discussions
S. Sadjadi - January 2016 55
temperature range is just 50-60 °C, but it can be seen sharper along the
methane/oxygen ratio axis. As more oxygen available in feed gas, more methane
converts to CO2 and CO and that decreases C2 selectivity certainly. Each concept
of reactor for OCM on different catalytic systems result in different CO and CO2
selectivities. Which one of these unwanted products are more unwanted? This is
the question which have been not discussed thoroughly for OCM. It depends on
what seperation units are designed after the reactor and if there is any application
is forseen for unwanted products. CO can be useful as syn-gas while CO2 can be
used for dry reforming or direct conversion to methanol. In this study CO2 and
CO are reported together as COx because it’s not seen as a main discussion in this
work.
Figure 3-8 Reaction temperature influence on COx selectivity in glass reactor at
different ratios of methane to oxygen. Total gas flow of 5 l/min with 55% N2
dilution, 55 g catalyst.
The main product of OCM is ethylene which is targeted to be maximized. C2
hydrocarbons are reported as a whole in most of the studies because ethane can be
converted to ethylene in pyrolysis procedure and cracking which is now the main
Page 76
3. Fluidized-bed Reactors, Results and Discussions
S. Sadjadi - January 2016 56
way of ethylene production in the world but still OCM cannot be compatible with
naphta cracking or ethane cracking processes in terms of conversion, yield and
selectivities (Nghiem, 2014). The typical OCM process proposed till now is
shown in Figure 3-9 (Nghiem, 2014).
Figure 3-9 Typical proposed OCM process with downstream(Nghiem 2014).
There are normally two different types of C2 splitters in olefin plants which are
low pressure C2 splitters with heat pump or refrigeration and high pressure C2
splitters. In both cases, normally, the ethylene produces overhead will have 99.9%
purity and a recovery in excess of 99% and occasionally to 99.9% with respect to
the ethylene in the feed (Bravo & Sikkenk, 2002). Therefore, the ratio between
ethylene and ethane has an importance for downstream processes for lower
investment costs because as higher the amount of ethane is, there are more
separation stages needed. The ethylene/ethane ratio achieved in this study is one
of the highest amounts reported till now from OCM. The ethylene/ethane ratio
goes till 6.2 at 835 °C with methane/oxygen ratio of 2, where the maximum C2
yield was observed. As it can be seen in Figure 3-10, ethylene/ethane ratio
behavior depending on temperature and methane/oxygen ratio looks similar to C2
yield and methane conversion trend.
Page 77
3. Fluidized-bed Reactors, Results and Discussions
S. Sadjadi - January 2016 57
Figure 3-10 Reaction temperature influence on ethylene/ethane ratio in glass
reactor at different ratios of methane to oxygen. Total gas flow of 5 l/min with 55%
N2 dilution, 55 g catalyst.
3.2.2 Dilution Influence for 2.2%Na2WO4-2%Mn/SiO2 Catalyst
Using nitrogen as an inert gas has the advantage of offering the possibility of
using air in the gas feed, eliminating the need for an expensive air separation
process before the reactor.
Meanwhile, studying the nitrogen dilution effect in this reaction is important
because, as we have seen, more than 40-50% of the methane leaves the reactor un-
reacted. Using a high flow of nitrogen implies costly methane separation process
in future industrial scales. So it is necessary to study the possibility of using either
lower amounts of nitrogen or no dilution in this reactor. The influence of nitrogen
dilution has been studied at 775 °C in the glass reactor. The results are shown in
Figure 3-11.
Page 78
3. Fluidized-bed Reactors, Results and Discussions
S. Sadjadi - January 2016 58
Figure 3-11 Nitrogen dilution effect on methane conversion, C2 yield and
selectivity in quartz glass reactor with 5 l/min total flow over 55 g of catalyst.
Page 79
3. Fluidized-bed Reactors, Results and Discussions
S. Sadjadi - January 2016 59
A total gas flow of 5 l/min has been used carrying 40%, 50% and 60% nitrogen,
lower amounts of nitrogen resulted in hot spots in the catalyst bed and demanded
higher fluidization velocities which hindered the possibility for comparison, and
higher amounts of nitrogen could not be adjusted to the air composition for any of
the experiments so there was no need for the analysis. The highest methane
conversion and C2 yield were achieved at 40% dilution with methane to oxygen
ratio of 2. Figure 3-11 shows the methane conversion reaches 41% at 40% nitrogen
dilution with methane/oxygen ratio of 2, and the C2 yield reaches 18,2% at the
same point, which is close to the maximum yield and conversion seen in
Figure 3-4 and Figure 3-6 at much higher temperature (840 °C).
Following the dilution results from glass reactor at 775 °C, the reactor has been
tested at 830 °C (which is suspected to be around the optimum temperature for
this reactor based on the previous tests described above) with low dilution gas
content (40%). In comparison with higher dilution of nitrogen, the methane
conversion and product yield were enhanced in comparison with higher dilution of
nitrogen. The result achieved from quartz glass reactor is plotted in Figure 3-12.
Figure 3-12 C2 selectivity, yield and methane conversion at different
methane/oxygen ratios at low dilution 40 % nitrogen for 5 l/min total flow in
quartz glass reactor.
Page 80
3. Fluidized-bed Reactors, Results and Discussions
S. Sadjadi - January 2016 60
The general trend of changes is the same in compare with higher dilution but the
methane conversion is higher and in result C2 yield as well. The maximum C2
yield achieved at lower dilution of nitrogen is 23% for quartz glass reactor, total
flow of 5 l/min and methane/oxygen ratio if 2. Methane conversion is 48% at this
point.
3.2.3 Monolithic Silica Support Catalyst
In this part, the results of testing Na-W-Mn catalyst on monolithic silica support is
going to be discussed but first the catalyst is going to be described.
The catalyst is prepared via incipient wetness impregnation, by incorporating a
solution of the catalytic precursors drop wise onto the silica support.
The silica support is an ordered mesoporous silica (OMS) analogous to SBA-15
(Jammaer et al., 2009) prepared in ceramic institute of TU Berlin. The synthesis
follows a typical soft-templating technique in which an amphiphillic block
copolymer is used to template the final porous structure of the material. The
ordered nature of the pore network ensures a fine distribution of the catalytic
components on the final catalyst surface, as opposed to catalysts prepared on
commercial amorphorous silica supports.
The final composition of the catalyst is supposed to be the same as the
conventional catalyst on powder silica. A modified OMS support was prepared,
by changing the synthesis to achieve monolithic (M-OMS) instead of powder
silica. This synthesis modification however resulted in a material with higher
sodium content than the powder form, and this excess of sodium was present in
the final catalyst. The first test was done at 800 °C in quartz glass reactor trying
to decrease methane/oxygen ratio from 8 to 2 like other experiments with the
conventional catalyst on silica powder. The results are plotted in Figure 3-13 and
it was not possible to increase the oxygen gas flow to achieve methane/oxygen
ratio of smaller than 3 because of agglomeration problem and defluidization of the
Page 81
3. Fluidized-bed Reactors, Results and Discussions
S. Sadjadi - January 2016 61
catalyst bed. The excess of sodium can explain the agglomeration of particles
during reaction, increasing the probability of the occurrence of a melted phase at
high temperatures. Even for ratios of 3 and 4 temperature profile didn’t show a
perfect fluidization. The density of this catalyst is almost ¼ of the conventional
one, therefore lower fluidization velocity corresponding to 3 l/min total flow gas
was chosen for this experiment.
It can be seen in Figure 3-13 that the methane conversion achieved from this
catalyst was really low although C2 selectivity was higher than conventional
catalyst. The C2 yield was also low respectively and this can be explained by
agglomeration of the catalyst because of melt phase sodium on the surface.
It is suspected that the catalyst bed didn’t get fluidized or not well fluidized for
lower amounts of oxygen and most of the gas was passing by and most of the
reactions happened in gas phase over the catalyst bed.
Figure 3-13 Experimental results of mesosporous silica catalyst at 800 °C, total
flow of 3 l/min.
The point attracted our attention was the ethylene/ethane ratio which was really
high in compare with conventional catalyst on silica powder. In Table 3-1 the ratios
Page 82
3. Fluidized-bed Reactors, Results and Discussions
S. Sadjadi - January 2016 62
are reported and it can be seen that although the conversion of methane was really
low due to not perfect fluidization, but this ratio was high.
Table 3-1 Ethylene/ethane ratio from mesosporus silica catalyst in fluidized-bed
reactor at 800°C.
CH4/O2 C2H4/C2H6
8 6,5
6 6,6
5 6,8
4 6,5
3 6,3
For these following experiments, in order to produce particles within the required
size range and required higher density for the fluidized-bed reactor, the catalyst
was calcinated 2 times and this increased the density close to the conventional
catalyst. The results of test on this catalyst with higher density showed the
immediate agglomeration at higher temperature even before doing the
experiments with reactant gases. The cooled down reactor was open later and in
Figure 3-14 the catalyst is being shown which made a stone shaped solid which
was even difficult to bring it out from the reactor.
Figure 3-14 Agglomerated catalyst particles.
Page 83
3. Fluidized-bed Reactors, Results and Discussions
S. Sadjadi - January 2016 63
Excess amount of sodium and the structure of the catalyst can be responsible
factors for agglomeration.
3.2.4 Fluidized Granulator Catalyst
Fluidized granulator coating was another preparation method of the catalyst which
has been carried out to produce Na-W-Mn/SiO2 catalyst for OCM miniplant
fluidized-bed reactor. This catalyst has been prepared in a fluidized-bed in
Ceramic Institute of Technical University of Berlin, by Simon et al.. The set-up is
shown in Figure 3-15. This method had an importance because of its capacity for
preparing larger batches of the catalyst in compare with incipient wetness
impregnation method which was done by hand and took longer time. The 200 g of
SiO2 particles were fluidized by pre-warmed air entering from below and then the
solutions of specific amount of (Mn(NO3)2).4H2O and (Na2WO4).2H2O in water
were sprayed by a nuzzle inside the fluidized-bed one after another. And the
catalyst was calcined afterwards at 800 °C for 8 hours.
Figure 3-15 Fluidized-bed set-up for coating preparation of Na2WO4-Mn/SiO2
catalyst.
Page 84
3. Fluidized-bed Reactors, Results and Discussions
S. Sadjadi - January 2016 64
The active material on the surface of the silica particles looks thicker in compare
with the catalyst prepared by impregnation method showing SEM results
(Wiedenmann, 2014).
Figure 3-16: Schematic of fluidized-bed coating method.
The results from this catalyst are plotted inFigure 3-17. First a test has been done at
750 °C for different methane/oxygen ratios and the trend shown by this catalyst
was similar to impregnation method prepared catalyst. As oxygen increased in the
gas feed the methane conversion increased and C2 selectivity decreased as a result.
The performance, in general, is poor in compare with conventional Na-W-
Mn/SiO2 catalyst described in experiments earlier. The influence of bed
temperature at specific methane/oxygen ratio of 2 is shown in the same plot and
the maximum C2 yield achieved was at 800 °C around 11%. In higher
temperatures the drop of the selectivity was so much to decrease the C2 yield.
Methane conversion at the highest C2 yield was around 22% and C2 selectivity
around 42%. As it can be compared to conventional catalyst results, what differs
much with FG catalyst is methane conversion. This catalyst was not so active for
OCM.
Page 85
3. Fluidized-bed Reactors, Results and Discussions
S. Sadjadi - January 2016 65
Figure 3-17 Temperature and methane to oxygen ratio influence on the catalyst
prepared by fluidized granulator coating method.
One of the explanations about low activity of this catalyst could be less dispersion
of active components on silica support. Yildiz (Yildiz et al., 2014b) argues that
finer active components lead to higher activity of the catalyst. The comparison of
their case is between impregnation method prepared catalyst on conventional
Page 86
3. Fluidized-bed Reactors, Results and Discussions
S. Sadjadi - January 2016 66
silica gel produced commercially by Sigma Aldrich and homemade ordered
mesoporous silica structure catalyst. The ordered structure catalyst gave much
higher methane conversion because of finer component material distributed on the
support. This argument can be used for FG catalyst in opposite way that the low
conversion of this catalyst could be because of higher concentration of active
materials on the surface. As it can be seen in Figure 3-18 even the color of these
catalysts are different although the same amount of active material has been used.
Figure 3-18 Color comparison between fresh incipient wetness impregnation
method prepared catalyst and FG catalyst.
Page 87
3. Fluidized-bed Reactors, Results and Discussions
S. Sadjadi - January 2016 67
3.3 FeCrAlloy Fluidized-bed Reactor
In this part the results achieved from FeCrAlloy fluidized-bed reactor are being
discussed. The same reaction conditions as quartz glass reactor have been implied
to this reactor to study the differences and scientifically comparison. Moreover,
Fluidization velocity and elevated pressure impacts are going to be discussed as
well which was not carried out for quartz glass reactor because of pressure
limitations.
3.3.1 Temperature and Methane to Oxygen Ratio Influence for
2.2%Na2WO4-2%Mn/SiO2 Catalyst
The influence of temperature and methane/oxygen ratio has been studied detailed
for quartz glass reactor in the last session. The same trends have been observed in
FeCrAlloy reactor with the same dimension, at the same reaction conditions.
More methane is converted in the metal reactor in compare with quartz glass
reactor (comparison between Figure 3-19 with Figure 3-4). Maximum methane
conversion of 47% in this range was observed at 840 °C with methane/oxygen
ratio of 2. This is slightly more than quartz glass reactor which was 42%.
More methane is converted in the metal reactor but less selectivity of the desired
products is observed. This can be seen in comparison of C2 selectivities of quartz
glass reactor Figure 3-5 and FeCralloy fluidized-bed reactor Figure 3-20.
The alloy material of the metal reactor is not a selective material for this reaction,
enhancing unwanted reactions, therefore the C2 selectivity reduces.
Page 88
3. Fluidized-bed Reactors, Results and Discussions
S. Sadjadi - January 2016 68
Figure 3-19 Reaction temperature influence on methane conversion in FeCr
reactor at different ratios of methane to oxygen, total gas flow of 5 l/min, 55% nitrogen
dilution, 55 g catalyst.
Figure 3-20 Reaction temperature influence on C2 selectivity in FeCr reactor at
different ratios of methane to oxygen, total gas flow of 5 l/min, 55% nitrogen dilution, 55 g
catalyst.
Page 89
3. Fluidized-bed Reactors, Results and Discussions
S. Sadjadi - January 2016 69
At the maximum C2 yield point, which is at 840 °C and methane/oxygen ratio of
2, the C2 selectivity is the minimum in this set of experiments at 39%. This is 5%
less than C2 selectivity at the same reaction conditions in quartz glass reactor.
In general at certain temperatures the yield is higher in glass reactor. The highest
yield achieved in this condition (total gas flow of 5 l/min with 55% nitrogen
dilution), for the glass reactor is 19.5% at 835°C and 17.5% at 840 °C for metal
reactor. This difference can be seen in comparison of C2 yield Figure 3-6 for
quartz glass reactor and Figure 3-21 for FeCrAlloy reactor.
Figure 3-21 Reaction temperature influence on C2 yield in metal reactor in FeCr
reactor at different ratios of methane to oxygen, total gas flow 5 l/min, 55% nitrogen
dilution, 55 g catalyst.
FrCrAlloy is known to have high temperature and oxidation resistance, but is
nonetheless active in contact with oxygen, increasing oxygen conversion and
therefore increasing methane conversion as well. The oxygen conversion is shown
in Figure 3-22. In comparison with oxygen conversion in quartz glass reactor
(Figure 3-7), it can be seen that the oxygen conversion reaches full amount earlier
in FeCrAlloy. As full oxygen conversion happens in temperatures higher than 820
Page 90
3. Fluidized-bed Reactors, Results and Discussions
S. Sadjadi - January 2016 70
°C for the glass reactor, there is 100% conversion even for lower temperatures but
high methane to oxygen ratio for FeCrAlloy reactor.
Figure 3-22 Reaction temperature influence on oxygen conversion in FeCr reactor
at different ratios of methane to oxygen, total gas flow 5 l/min, 55% nitrogen dilution,
55 g catalyst.
Further analysis of the results illustrated in these graphs from quartz glass reactor
and FeCrAlloy reactor and also COx selectivity (Figure 3-23 for FeCrAlloy
reactor and Figure 3-8 for quartz glass reactor) reveals this information that
although CH4 conversion is higher in FeCrAlloy reactor, C2 selectivity is less and
in result the COx selectivity increases. Higher methane conversion is the material
affect which was discussed in empty reactor test as well. When higher amount of
methane get converted to CO2 and CO, conversion to desired products like
ethylene and ethane is reduced.
Ethylene/ethane ratio shows the same trend in FeCrAlloy reactor (Figure 3-24), in
comparison with quartz glass reactor (Figure 3-10), but it is lower in general than
quartz glass reactor.
Page 91
3. Fluidized-bed Reactors, Results and Discussions
S. Sadjadi - January 2016 71
Figure 3-23 Reaction temperature influence on COx selectivity in FeCr reactor at
different ratios of methane to oxygen, total gas flow 5 l/min, 55% nitrogen dilution, 55
g catalyst.
Figure 3-24 Reaction temperature influence on ethane/ethane ratio in FeCr reactor
at different ratios of methane to oxygen, total gas flow 5 l/min, 55 % nitrogen dilution,
55 g catalyst.
Page 92
3. Fluidized-bed Reactors, Results and Discussions
S. Sadjadi - January 2016 72
The maximum ethylene/ethane point reached in FeCrAlloy reactor is 5.5 which is
slightly lower than quartz glass reactor at the same reaction condition.
3.3.2 Fluidization Velocity Influence for 2.2%Na2WO4-2%Mn/SiO2
Catalyst
According to previous works (Jaso, 2012) and literature about fluidized-bed
reactor for OCM (Santos et al. 1995), low fluidization velocity was suspected to
give better results in OCM fluidized-bed reactors. The study of fluidization
velocity influence on OCM reaction involves hydrodynamic influence as well as
gas residence time in the reactor. At lower fluidization velocities the behavior of
the catalyst bed is like plug flow as suggested by Kunii and Lavenspiel (1991). As
the fluidization velocity gets higher the bubbles started to rise and they get bigger
and faster with higher gas velocities. This might affect in a negative way for OCM
in higher temperatures when methane and oxygen gets trapped in bubbles in gas
phase or when there is a back mixing of gas at higher velocities which both lead in
lower selectivity. On the other hand, really low fluidization velocity might also
lead to more oxidation of methane to unwanted products as well as product
oxidation. The fluidization velocity should be studied for each reactor and
catalytic system independently. In this experiment in FeCrAlloy fluidized-bed
reactor containing 55 g of Na-W-Mn/SiO2 catalyst, total gas flows of 4500-8000
ml/min were tested which corresponds to u/umf between 1.8 and 3.2 for this
specific reactor and catalyst particles. The temperature was fixed at 800 °C and
methane/oxygen ratio equal to 2. The result plotted in Figure 3-25 shows the
influence on methane conversion and C2 selectivity. It can be seen that methane
conversion has a linear relationship with increasing the total gas velocity. As
higher the gas velocity, there is lower conversion of methane in this reactor which
is because of lower gas residence time in the reactor. The C2 selectivity has an
opposite behavior. It rises till u/umf=2.8 but then it drops radically afterwards. The
enhancement in selectivity can be explained by less gas residence time and less
Page 93
3. Fluidized-bed Reactors, Results and Discussions
S. Sadjadi - January 2016 73
unwanted reactions but bubbles size get bigger in higher gas velocities that lead to
a sudden drop in C2 selectivity.
Figure 3-25 Fluidization velocity influence on methane conversion and C2 selectivity in
FeCrAlloy reactor, at 800 °C, methane/oxygen ratio=2.
The oxygen conversion shows a linear behavior as well as the methane conversion
for the same reason in Figure 3-26. It reduces as higher amount of gas velocity
gets applied in the reactor. In this figure the C2 yield is also plotted, which shows
a maximum around u/umf=2 but then it drops mainly because of decrease in
methane conversion.
This velocity corresponds to about 5000 ml/min total flow of gas which was
chosen the base of comparison for almost all experiments reported in this work.
The minimum fluidization at 2500 ml/min was calculated experimentally with
pressure drop test.
Page 94
3. Fluidized-bed Reactors, Results and Discussions
S. Sadjadi - January 2016 74
Figure 3-26 Fluidization velocity influence on oxygen conversion and C2 yield in
FeCrAlloy reactor, at 800 °C, methane/oxygen ratio=2.
3.3.3 Dilution Influence for 2.2%Na2WO4-2%Mn/SiO2 Catalyst
According to dilution experiments for quartz glass reactor discussed previously,
the 40% nitrogen dilution has been tested for FeCrAlloy reactor as well.
The results plotted in Figure 3-27 shows the same behavior as it was seen for
quartz glass reactor in Figure 3-12 for different ratios of methane to oxygen at 830
°C. The trend of change in methane conversion, C2 selectivity and yield is the
same seen in previous experiments. There is higher methane conversion and C2
yield at lower dilution in compare with 55% nitrogen dilution reported above. The
Page 95
3. Fluidized-bed Reactors, Results and Discussions
S. Sadjadi - January 2016 75
maximum C2 yield of 20% was achieved at methane to oxygen ratio of 2 at 830
°C with total gas flow of 5000 ml/min containing 40% nitrogen.
Figure 3-27 C2 selectivity, yield and methane conversion at different
methane/oxygen ratios at low dilution 40% nitrogen for 5 l/min total flow containing
in FeCrAlloy reactor.
There is more information about the maximum C2 yield point of Figure 3-12 and
Figure 3-27 for the both reactors extracted from micro-GC measurements which
can be seen in Table 3-2. At 830 °C in same reaction condition for these two
reactors, selectivity of CO2 and CO is lower in glass reactor. The ethylene to
ethane ratio is higher for glass reactor at this point.
Table 3-2 Results of Miniplant-scale Fluidized-bed Reactors at 830 °C, CH4/O2=2,
total flow=5 l/min, 40% N2. X is for conversion, S for selectivity and Y for yield.
Reactor
material
X (CH4) S (C2) Y (C2) S (CO2) S (CO)
FeCr Reactor 47% 41% 20% 50% 9%
Glass Reactor 49% 48% 23% 46% 6%
Page 96
3. Fluidized-bed Reactors, Results and Discussions
S. Sadjadi - January 2016 76
3.3.4 Elevated Pressure
Testing the elevated pressure effect on OCM performance has an importance for
industrial applications as discussed before. This effect has not been studied before
on OCM fluidized-bed reactors because studying this effect as a solely parameter
is complicated due to change in hydrodynamic, temperature profile and gas
residence time at the same time. The other barrier is to control the fluidization
which with increasing the pressure gets affected as well. As it was discussed by
Yang (Yang, 2003) there are different studies showing different results about the
effect of pressure on minimum fluidization velocity and bubble formation in
fluidized-bed reactors. But what all studies agree on about Geldart B particles is a
decrease in Umf with increase of pressure. The ranges of the pressure tests are
much larger than this work therefore, it is assumed that the pressure doesn’t affect
the Umf in current work because King et al. (King & Harrison 1982) reported
about 25% decrease in Umf till 12 bars which can be a negligible change till 3-4
bars in the current work. At higher pressures, the bubbles get smaller in size,
faster in rise and more concentrated in the center of the reactor based on
Kawabata’s study (Kawabata et al., 1981). Therefore, in the first step of testing
pressure the total flow of gas was fixed in this work at 5000 ml/min. As it can be
seen in Figure 3-28, the test was done for methane/oxygen ratio of 4 at 800 °C and
a decrease in C2 selectivity, increase in methane conversion and slightly decrease
in C2 yield was observed. The pressure was controlled by a pressure controller
valve after the reactor which means by increasing the back pressure from 1.4 bar
till almost 4 bar, the linear gas velocity decreases more than two times and gas
residence time increases as well.
This can lead in pressuring the catalyst particles to the wall sides and make
agglomeration, hot-spots and defluidization for higher pressures. It is then
explainable why the methane conversion increases. In each experiment with 5000
ml/min of total gas, defluidization was observed around 4000 mbar. This could be
seen by observing the temperature profile. Figure 3-29 shows this behavior at 800
Page 97
3. Fluidized-bed Reactors, Results and Discussions
S. Sadjadi - January 2016 77
°C. It can be seen in the screen shot of around 4000 mbar from PCS7 control
system, it’s not just the temperature profile which is not isothermal anymore but a
sudden defluidization occurred as well.
Figure 3-28 Pressure influence at 800 °C, methane/oxygen=4, total gas flow of 5
l/min.
Figure 3-29 Defluidization at higher pressure seen by temperature profile.
Page 98
3. Fluidized-bed Reactors, Results and Discussions
S. Sadjadi - January 2016 78
The agglomerated particles have be seen after opening the reactor as well which
proves the reason of such extended temperature profiles.
In the next round of the experiments which were designed to eliminate this affect,
the total flow of the gas was increased respectively with increasing the pressure as
well. The results plotted in Figure 3-30 shows that the selectivity increases a little
bit with increasing the pressure, methane conversion doesn’t change much and C2
yield increases slightly as well. The defluidization was not observed till 4 bar but
controlling the temperature profile with higher flows and higher pressure got
difficult to continue the test. In summary it can be said that the influence of
elevated pressure in this OCM fluidized-bed reactor and its effect on reaction
performance is comparable with results achieved by Beck‘s investigation (Beck et
al., 2014).
Figure 3-30 Pressure influence at 800 °C, methane/oxygen=4, total gas flow of 5-
10 l/min.
Page 99
3. Fluidized-bed Reactors, Results and Discussions
S. Sadjadi - January 2016 79
3.3.5 Stability Test
Stability of the performance of this catalyst in this reactor system has been tested
in two different ways. The first test was to use the same batch of 55 g catalyst for
several experiments (different gas flows, dilution and temperatures) for 5 days
(each day with 5-6 hours of experiments) while checking a specified condition at
the end of each experiment, in order to compare. This specified condition has
been chosen to be 800 °C, total gas flow of 5 l/min, 55% N2 dilution, CH4/O2=4.
The result indicates that the catalyst exhibits a relatively constant performance
(C2-yield changed around 1% from 12.5% to 11.3% and C2-selectivity around 6%
from 58% to 52%). The catalyst exhibits high mechanical stability during this
time and there was no agglomeration observed after the experiments (which is
expected to be one of the major problems of this catalyst in OCM fluidized-bed
reactor (Sadjadi et al., 2015). The second test has been done for 7 hours of
continuous reaction. The results are being shown in Figure 3-31 and as it can be
seen the performance is relatively stable. This stability test is believed to be
important in fluidized-bed reactor because in other types of the reactors with this
catalytic system, huge hot spots have been noticed which can lead to a decrease in
selectivity and yield of the process.
Page 100
3. Fluidized-bed Reactors, Results and Discussions
S. Sadjadi - January 2016 80
Figure 3-31 Stability test for C2 yield, selectivity and CH4 conversion in 7 hours.
The catalyst showed a good mechanical stability as well. The amount of catalyst
of the reactor was measured after 7 hours of stability test and it didn’t show any
loss because of attrition.
Page 101
81
4 FLUIDIZED-BED
MEMBRANE REACTOR,
RESULTS AND DISCUSSION
Using Fluidized-bed membrane reactor concept has not been studied for OCM
before and it is the first time under investigation. As discussed thoroughly before,
the idea was using both advantages of membrane effect and fluidization in one
reactor for OCM and the simulation studies have been done by Jaso (Jaso et al.,
2011; Jaso 2012) and experiments have been designed mostly based on De Jong et
al. studies (De Jong et al., 2011; 2012a; 2012b; 2012c; 2012d; 2013). They
studied the influence of gas extraction or addition from membranes in fluidized-
bed on hydrodynamic of the reactor. Figure 4-1 represents some of their studies. In
this figure the reference point, c, is the case without any addition of the gas
through membranes and on the left side, a and b, are the cases where the
fluidization gas stayed 100% same and then 20% or 40% of that amount went
through membranes. On the right side, d and e, the fluidization gas decreased to
80% and then extra gas went through membranes. As it is shown in Figure 4-1,
Page 102
4. Fluidized-bed Membrane Reactor, Results and Discussions
S. Sadjadi - January 2016 82
the particles tend to circulate in different direction when there is gas addition in
the reactor and they go upwards beside the membranes and come downwards in
the middle of the reactor. This effect has a big importance for this study because
the membranes are really close to each other and this change of the circulation
might lead to defluidization of particles in this case. Therefore, low flows of gas
from membranes have been chosen for the experiments.
Figure 4-1 Time-averaged particle movement and time-averaged profile of the
axial solids phase velocity for different heights in the fluidized-bed.(a) and (b)
additional gas through membranes while the total flow of gas stays constant, (c) the
reference without membranes, (d) and (e) additional gas through membranes while
the fluidization gas from bottom of the reactor stays constant. (De Jong et al., 2011).
4.1 Experimental Results
A fluidization test was done in the same dimension quartz glass reactor, with two
membranes installed, to see if at the following flows, there would be a minimum
Page 103
4. Fluidized-bed Membrane Reactor, Results and Discussions
S. Sadjadi - January 2016 83
bubbling fluidization. The test was done at room temperature (the gas velocity
would be doubled at reaction temperature) and it was seen that the catalyst bed get
fluidized at the flows discussed further (total gas flows of 5500-6000 ml/min)
with around 5-20% of the fluidization gas comes through the membranes. It was
as well interesting to see with eyes that the bubbles come mostly from the center
of the reactor up. This behavior can affect the reaction and is going to be
discussed later.
Figure 4-2 Summary of designed sets of experiments for FBMR.
The reactor was designed for having four membranes inside but short after
experimental design process, it was clear that using four membranes in this small
reactor is not mechanically feasible because of short distance between the
membranes. Therefore two membranes have been used.
Three sets of experiments (c1-c5 & m1-m5, c6-c10 and c11-c15) have been
designed for this reactor and the graphical summary of them are shown in
Figure 4-2. “c” refers to ceramic membranes and “m” refers to metal (Hastelloy X)
membranes. In the first set of the experiments (c1-c5 & m1-m5) the total flow of
gas (through membranes plus fluidization gas) was 5500 ml/min while the
Page 104
4. Fluidized-bed Membrane Reactor, Results and Discussions
S. Sadjadi - January 2016 84
membrane gas was about 5-12% of the fluidization gas. Afterwards the next set of
experiments (c6-c10) was designed (using metal membranes was not continued
and it will be explained in following) with the same total gas flow but increasing
the membrane gas to see the effect. According to Figure 4-1 the circulation of
particles should be intensified between the membranes in this set of experiments
in compare with the first set.
In the last set of the experiments (c11-c15) the opposite affect was studied which
is increasing the total flow which is supposed to lead in less intensification
between the membranes. In following sessions, the results are going to be
discussed.
4.1.1 5500 ml/min Total Gas Flow, 5-12% of Fluidization Gas
through Membranes
The first designed experiments are listed in the Table 4-1. for two types of
membranes. Reference point is the point from fluidized-bed FeCrAlloy reactor
without membranes installed inside. All experiments have been done with total
flow of 5500 ml/min containing 55% inert gas. The maximum yield achieved with
this total flow in fluidized-bed reactor was 17,2% at around 830 °C. This was used
as the reference point to be able to compare the results. m1-m5 experiments are
with metal (Hastelloy X) membranes and c1-c5 experiments are with ceramic (α-
Alumina) membranes. The flow through membranes was chosen to be low based
on the experimental results of (De Jong et al., 2011) discussed above. Due to the
influence of membrane flow on hydrodynamic of the fluidization, it was tried to
minimize this affect as low as possible.
Page 105
4. Fluidized-bed Membrane Reactor, Results and Discussions
S. Sadjadi - January 2016 85
Table 4-1 c1-c5 and m1-m5 experiments set for FBMR.
Exp. Nr.
Fluidization gas ml/min Gas from
membranes ml/min Feed Composition
Flow from Membranes/Fluidization
gas flow
Temperature °C
N2 CH4 O2 N2 O2 CH4 O2
Ref. 3025 1650 825 - - 30% 15% - 830
c1 2725 1650 825 300 0 30% 15% 5,50% 830
c2 2725 1650 725 300 100 30% 15% 7,80% 830
c3 2775 1650 675 250 150 30% 15% 7,80% 830
c4 2825 1650 625 200 200 30% 15% 7,80% 830
c5 2925 1650 350 100 475 30% 15% 11,70% 830
m1 2725 1650 825 300 0 30% 15% 5,50% 830
m2 2725 1650 725 300 100 30% 15% 7,80% 830
m3 2775 1650 675 250 150 30% 15% 7,80% 830
m4 2825 1650 625 200 200 30% 15% 7,80% 830
m5 2925 1650 350 100 475 30% 15% 11,70% 830
Page 106
4. Fluidized-bed Membrane Reactor, Results and Discussions
S. Sadjadi - January 2016 86
In the experiments c1 and m1, there is 300 ml/min flow of inert gas (nitrogen)
through the membranes just to avoid entering the fluidization gas into the
membranes, both for safety and reaction design engineering. In next experiments,
the oxygen concentration was reduced step by step from fluidization gas coming
from bottom adding to the oxygen dosed through membranes. The total
concentration of the oxygen remained fixed at 15% of the total flow which
corresponds to methane to oxygen ratio of 2 which showed to be the maximum C2
yield point at almost all the experiments in fluidized-bed reactors of this work.
The results of these experiments are shown in Figure 4-3. As it can be seen, the
selectivity gets improved in case of the step by step increase of oxygen dosing
through membranes till a certain point. The C2 yield increases as well although the
CH4 conversion decreases. The maximum point of C2 yield and selectivity in
experiments of c1-c5 is c3 which corresponds to 18% of the total 825 ml/min
oxygen dosed through membranes and the rest, which is 82% of the total oxygen
with fluidization gas. At this point C2 yield of 19.5% was achieved at C2
selectivity of 46% which is around 2% higher yield and 5% higher selectivity in
compare with the reference point. More dosing oxygen leads to lower selectivity
and lower yield in result. It is also interesting to see that all selectivities in these
five experiments are higher than the reference point but decreasing methane
conversion lead to lower products yield at higher oxygen dosed through
membranes. As being discussed in (Ahchieva et al., 2005) it was predicted to have
lower conversion in fluidized-bed membranes reactors with distributed oxygen
because of slightly shift towards products rather than carbon oxides. But then the
question rises why the methane conversion is lower even in cases of c4 and c5
which product selectivity goes down and carbon oxides selectivity goes higher.
One explanation can be oxygen gas run-away beside membranes. As higher
amount of oxygen dosed from membranes the gas tends to move upward beside
the membranes with more velocity and doesn’t have much contact with methane
from the fluidized gas entering the reactor from bottom.
Page 107
4. Fluidized-bed Membrane Reactor, Results and Discussions
S. Sadjadi - January 2016 87
As it can be seen even the oxygen conversion graph shows suddenly lower
conversion at those c4 and c5 points (Figure 4-3).
What can be also mentioned interesting from the results is the improvement of
yield and conversion of c1 in comparison with the reference point although there
is no dosage of oxygen through membranes in this point and just 300 ml/min
nitrogen goes through. This can be the effect of lower nitrogen dilution at the first
centimeter of the catalyst bed. 300 ml/min is around 6% of the total flow and
when 6% less nitrogen enters the catalyst bed, higher conversion of methane
would occur.
This behavior changes completely when it comes to metal membranes. In the case
of metal membranes, in experiments m1-m5, product selectivity and methane
conversion both decreases constantly as more oxygen dosed through membranes.
This is in contrast with most of the results from fixed-bed and fluidized-bed
reactors in which methane conversion and C2 selectivity always showed opposite
direction. This behavior can be for the mixture of two factors;
- Oxidation of Hastelloy X of membrane part and stainless steel which is
the material of the upper side of the tubes of membranes. Hastelloy X
can be oxidized as well as stainless steel in contact of oxygen at high
temperatures.
- Oxygen run-away beside the membranes.
The oxidation of membrane and tubes materials can happen even before entering
the oxygen to the fluidized-bed by membranes when the total oxygen enters from
the bottom. Therefore, higher oxygen conversion (in compare with ceramic
membranes) and lower methane conversion can be seen. The C2 selectivity is also
lower because of reactivity of membranes.
Page 108
4. Fluidized-bed Membrane Reactor, Results and Discussions
S. Sadjadi - January 2016 88
Figure 4-3 FBMR results for c1-c5 and m1-m5 experiment sets.
Page 109
4. Fluidized-bed Membrane Reactor, Results and Discussions
S. Sadjadi - January 2016 89
Figure 4-4 Used membrane on the left side with oxidized surface seen with red
color, not-used membrane on the right side.
After few experiments with Hastelloy X membranes, even the color of the
membranes has been changed and showed an obvious oxidation in contact with
oxygen at higher temperature. In Figure 4-4 a used and a fresh membrane are
shown. The left membrane which is the one in experiments had a thick layer of
oxidized metal on surface especially on stainless steel top part. Both stainless steel
upper part of the tube and Hastelloy X membrane part changed color to almost red
because of the oxidation. Due to this effect of membrane material, the rest of the
experiments have been carried out just with alumina membranes.
Page 110
4. Fluidized-bed Membrane Reactor, Results and Discussions
S. Sadjadi - January 2016 90
4.1.2 5500 ml/min Total Gas Flow, 12-20% of Fluidization Gas
through Membranes
The next round of experiments, c6-c10 set, were designed to study the influence
of higher flow of gas dosing through membranes (and higher velocity
respectively) and higher concentration of oxygen through membranes as well.
They can be seen in Table 4-2. The reference was written there again (fluidized-
bed reactor) for the comparison.
Table 4-2 c6-c10 experiments set for FBMR.
Exp. Nr.
Fluidization gas ml/min
Gas from membranes
ml/min
Feed Composition
Flow from Membranes/Total
gas flow
N2 CH4 O2 N2 O2 CH4 O2
Ref. 3025 1650 825 - - 30% 15% -
c6 2425 1650 825 600 0 30% 15% 10,9%
c7 2625 1650 625 400 200 30% 15% 10,9%
c8 2725 1650 525 300 300 30% 15% 10,9%
c9 2825 1650 375 200 450 30% 15% 11,8%
c10 2925 1650 0 100 825 30% 15% 16,8%
In all these experiments the temperature of the fluidized-bed was kept again
constant at 830 °C as well as constant ratio of 2 for total methane to total oxygen.
As it can be seen in Figure 4-5, there is a maximum C2 yield and selectivity at c7
experiment which corresponds to around 25% of the total 825 ml/min oxygen
dosed through membrane and the rest (75%) enters with fluidization gas. C2,
yield, C2 selectivity and methane conversion all decreases with more oxygen
dosing through membranes. At c10 experiment where the whole amount of
oxygen (825 ml/min) dosed through membranes and the rest of the gas (nitrogen
and methane) enters from the bottom, there is the minimum of C2 yield.
Page 111
4. Fluidized-bed Membrane Reactor, Results and Discussions
S. Sadjadi - January 2016 91
The maximum c7 point in this set of experiments (19,1% yield) is slightly lower
than the maximum point of c3 experiment (19,5%) but comparable from the
aspect of the composition of gases. This can be analyzed because of the poor
fluidization inside the reactor. The membrane gas flow was increased in this set of
experiments; therefore the fluidization gas competition with membrane gas to
circulate the particles got shifted more to the direction of the membrane gas. This
means if we use the Figure 4-1 considering the thermocouple in between the
membranes in our reactor set-up and the low fluidization velocity of these
experiments, the particle circulation might have become stopped under this affect
by having big gas bubbles in the middle.
It is again obvious that c6 experiment resulted in higher conversion and C2 yield
(18,5%) in compare with the reference point (C2 yield of 17.3%) and also in
compare with the c1 point (C2 yield of 18,1%), because of lower amount of inert
gas in fluidization gas entering the reactor from bottom which increases methane
conversion.
What can be also observed in comparison between Figure 4-3 and Figure 4-5 is
the higher oxygen conversion in tests c6 and c7 in compare with c1 and c2
experiments but much lower oxygen conversion at point where more oxygen gas
dosed through membranes. This result can be also analyzed again with the
assumption that the gas through the membranes moves upwards beside the
membrane and leaves the reactor without being so much involved in the emulsion
phase.
Page 112
4. Fluidized-bed Membrane Reactor, Results and Discussions
S. Sadjadi - January 2016 92
Figure 4-5 FBMR results for c6-c10 experiment sets.
4.1.3 6000 ml/min Total Gas Flow, ~10% of Fluidization Gas through
Membranes
The third set of the experiments was designed to see if the negative effect of
higher velocity membrane gas can be compensated with higher fluidization
velocity from bottom as well. c11-c15 are with 6000 ml/min total flow of gas
which around 10-11% of it doses through membranes with different composition
of oxygen but the total oxygen flow stays constant 900 ml/min which is 15% of
the total flow. In these experiments as well as c1-c10 experiments the ratio of
methane to oxygen stays constant equal to 2 and total flow contains 55% of
nitrogen as inert gas. The reactor bed temperature was fixed at 830 °C.
More details about the experiments are listed in Table 4-3.
Page 113
4. Fluidized-bed Membrane Reactor, Results and Discussions
S. Sadjadi - January 2016 93
Table 4-3 c11-c15 experiments set for FBMR.
Exp. Nr.
Fluid. gas ml/min Gas from
membranes ml/min
Feed Composition
Flow from Membranes/
Total Gas Flow
N2 CH4 O2 N2 O2 CH4 O2
Ref. 3300 1800 900 - - 30% 15% -
c11 2700 1800 900 600 0 30% 15% 10,0%
c12 2900 1800 700 400 200 30% 15% 10,0%
c13 3000 1800 600 300 300 30% 15% 10,0%
c14 3100 1800 450 200 450 30% 15% 10,8%
c15 3300 1800 250 0 650 30% 15% 10,8%
The results of experiments c11-c15 are plotted in Figure 4-6.
The trend of the behavior is relatively similar as experiments c6-c10 but the
maximum reached is slightly higher in this set of experiments. C2 yield of 19,2%
is achieved at c13 although in 6000 ml/min total gas flow the maximum is lower
in fluidized-bed reactor in compare with 5500 ml/min (comparison of reference
points) at 830 °C. This shows the improvement of particles circulation because of
higher fluidization flow. At this point 33% of the total 900 ml/min flow of oxygen
gets dosed through membranes and 66% with fluidization gas. To be able to
compare the hydrodynamic behavior inside the reactor according to (Roghair et
al., 2014), the flow differences from membrane and fluidization gas from the
bottom of the reactor can be analyzed like 90%+11% in this current set of
experiments if we take total flow of gas 6000 ml/min or 100%+11% if we take the
total flow base 5500 ml/min. But the difference between these experiments and
Roghair’s work is the membranes distance which is much less in this work than
their work. The membranes are also close to the walls, there is a thermocouple in
between which effects the particle circulation and there is a highly exothermic
reaction which happens mostly close to oxygen source beside the membranes and
Page 114
4. Fluidized-bed Membrane Reactor, Results and Discussions
S. Sadjadi - January 2016 94
on top of the gas distributor. It can also be seen the difference between the
reference point and c11 that the methane conversion and C2 yield get enhanced as
oxygen conversion. This affect is because of lower nitrogen dilution from the
bottom of the reactor. In c11 the nitrogen dilution percentage is 45% entering the
reactor although the total flow dilution percentage is 55% because 600 ml/min of
it enters through membranes.
The 45% C2 selectivity of c13 experiment is the highest achieved in these
experiments at 830 °C with ratio of methane to oxygen equals to 2.
Figure 4-6 FBMR results for c11-c15 experiment set.
Oxygen conversion is not 100% at reference point due to higher fluidization
velocity in fluidized-bed reactor but at c11 it gets complete because of reduction
of 600 ml/min flow of nitrogen from the bottom and doses it higher than gas
distributor. Most of the oxygen conversion for OCM happens in the first 2-3
centimeters of the reactor.
Page 115
4. Fluidized-bed Membrane Reactor, Results and Discussions
S. Sadjadi - January 2016 95
Testing higher flows from the membranes was not possible because of high
pressure drop between gas inside and outside of the membrane and general
pressure of the reactor which made it not possible to go higher due to safety
aspects. And also such different pressures make the comparison impossible.
At the end, it can be concluded that in all maximum points of fluidized-bed-
membrane reactor tests, around 18-30% of the total oxygen got doses through
membranes while the rest enters the reactor from the bottom with fluidization gas.
More percentage of oxygen dosing through membranes leaded in poor results. The
maximum C2 yield achieved in fluidized-bed membrane reactor was 19.5% at
experiment c3 and the highest selectivity was achieved at c13 around 46% in the
reaction condition of 55% nitrogen dilution, total gas flow (fluidization and
membrane flow) of 5500-6000 ml/min at reactor temperature of 830 °C. This
result is higher than the result from the same conditions in fluidized-bed
FeCrAlloy reactor without the membranes (2% C2 yield enhancement and 3% for
C2 selectivity). The methane and oxygen conversions are slightly lower than
fluidized-bed membrane reactor in compare with fluidized-bed reactor because of
better mixing in fluidized-bed reactor.
There can be place for much more experimental design for this reactor because
this was the first time to test this reactor concept for OCM and the new ideas are
going to be discussed in the next chapter.
Page 116
96
5 CONCLUSION AND
OUTLOOK
Oxidative Coupling of Methane has been studied since more than three decades
and still there are many barriers for industrial application of OCM as it is
discussed in the beginning of this work and one main focus of improvement
should be reactor design and engineering of these complex and exothermal
reactions. The effluent of OCM reactors are mostly un-reacted methane and
undesired gas product dioxide carbon and the main focus of OCM research should
be how to increase both C2 selectivity and methane conversion.
Using the benefits of fluidization is suggested in this work strongly because of
advantages of controlling the temperature and avoiding hot-spots. This work is
experimental work focused on two types of reactors, fluidized-bed reactor and
fluidized-bed membrane reactor. There were several objectives of this work which
introduced in the beginning of the work and the work process was designed to
meet those objectives.
Page 117
5.Conclusion and Outlook
S. Sadjadi - January 2016 97
5.1 Conclusion
The FrCrAlloy material was studied for its application on OCM and it showed a
good performance. Although it showed lower amounts of C2 yield and selectivity
(3% difference in yield) in compare with quartz glass reactor but the difference
was not significant and it is suspected to be even less in scaled-up reactors
because of less influence of reactor wall. The ratio of reactor’s wall surface
area/catalyst active surface area decreases as larger the reactor is.
The scale of the both fluidized-bed reactors (FeCrAlloy and quartz glass) reported
here is one of the biggest scales in available OCM literatures (the largest scale for
Na-W-Mn catalytic system), with 1100 ml volume and 56 mm diameter. Different
reaction conditions has been tested in this work and maximum C2 yield of 23% for
quartz glass reactor and 20% for FeCrAlloy reactor at C2 selectivity of around 45-
50 % was achieved in this study at 830 – 840 °C with low nitrogen dilution. This
result is the highest yield achieved from OCM fluidized-bed reactors in available
literatures. Rising the temperature from 775 ° C to 830 – 840 °C has a positive
effect on methane conversion and C2 yield of the reaction in the quartz glass and
FeCrAlloy reactors. Likewise, the importance of methane to oxygen ratio should
be considered as one of the main contributing factors. As oxygen concentration
increases in the feed gas, the yield and methane conversion increase as well. Both
reactors showed the same tendency in any change based on temperature and gas
composition, but higher C2 yield and selectivity was possible in the glass reactor
because of lower influence of the reactor material in reaction. It is important to
study the influence of the reactor material for future industrial applications
because quartz glass reactors can be used only in smaller scales and there have
been some studies with stainless steel which showed a really high reactivity in this
reaction.
Testing the gas dilution ratio and its influence on the reaction performance
showed an enhancement in yield and conversion because of faster reaction in
Page 118
5.Conclusion and Outlook
S. Sadjadi - January 2016 98
lower dilutions and this influence is important for future planning of industrial
scale plants which wouldn’t be feasible with high flow of inert gas due to
separation process afterwards. And elevated pressure till 4 bar showed slightly
enhancement in the performance from FeCrAlloy fluidized-bed reactor. The
catalyst used in these tests, 2.2%Na2WO4-2%Mn/SiO2, showed a high stability
and low tendency for agglomeration for fluidized-bed reactors.
It is also important to mention the improvement of the results of this work is in
compare with previous fluidized-bed reactor study in the same group (Jaso, 2012)
although the scale of the reactor is almost doubled (from 500 ml to 1100 ml). As
bigger scale fluidized-bed reactors are, the bubble size increases as well, therefore
gas phase reactions would get more important which should influence the
performance in a negative way, but on the other hand the effect of the reactor wall
on the hydrodynamic of the fluid get less and more homogenous circulation of
particles get achieved. In this level of scale-up the advantage of less effect of
reactor wall was stronger and better results were achieved.
In summary, fluidized-bed reactor can be a suitable option for OCM reaction
because of its advantages such as isothermal bed and preventing hot-spots
formation. And FeCrAlloy material can be a suitable material for scaled-up OCM
reactors, especially when elevated pressure test is needed which cannot be carried
out in glass reactors, although it is active in contact with oxygen.
Fluidized-bed membrane reactor novel concept was tested for OCM in this work.
The FeCrAlloy fluidized-bed reactor was modified by installing two membranes
inside for having OCM fluidized-bed membrane reactor. The Hastelloy X
membranes didn’t show a promising performance because of surface oxidation
and ceramic membranes showed an enhancement in compare with FeCrAlloy
fluidized-bed reactor performance. In this case fluidized-bed provides an
isothermal temperature profile along the reactor and membranes provide
distributed dosage of oxygen along the catalyst bed which is using the advantages
of both fluidized-bed reactor concept and membrane reactor.
Page 119
5.Conclusion and Outlook
S. Sadjadi - January 2016 99
The highest C2 yield achieved from this reactor, using 5500 ml/min total gas flow
containing 55% nitrogen at 830 °C with methane to oxygen ratio of 2, was 19.5%
which is 2% improvement of C2 yield in compare with result from FeCrAlloy
fluidized-bed reactor without membranes at the same condition (17.5% C2 yield).
The C2 selectivity is enhanced in this concept of reactor when less than half of the
total oxygen dosed through membranes and the rest entered the reactor with
fluidization gas from the bottom. Dosing more oxygen through membranes leaded
in drastically decrease of methane conversion and C2 yield because of gas
runaway beside the membranes and big gas bubbles between the membranes
which supposedly influenced the particles circulation in a negative way.
5.2 Outlook to Future Works
5.2.1 Fluidized-bed Reactor
One can claim that this work along with the previous work from Dr. Jaso presents
a comprehensive study on the application of fluidized-bed reactor concept for
OCM. It was concluded that 2%Mn–2.2%Na2WO4/SiO2 catalytic system can be a
proper stable catalyst for OCM fluidized-bed reactor. The scale-up from 40mm
quartz glass reactor (500 ml) to 56 mm quartz glass (1100 ml) didn’t have any
negative influence on the performance and it even showed an enhancement from
maximum 19.4% C2 yield to 23% C2 yield probably because of less affect from
reactor walls on hydrodynamic of the reactor. Further scale-up should be anyway
tested thoroughly because longer residence time and bigger bubbles in bigger
scales might change the trend. The reactor material is a question for OCM
industrial application because of contact with oxygen at higher temperatures and
FeCrAlloy material showed a good performance in this study and again scale-up
test is suggested for this part of the study because the reactor wall material affect
would be decreased in bigger scales.
Page 120
5.Conclusion and Outlook
S. Sadjadi - January 2016 100
The influence of catalyst bed height should be tested in future works because just
the minimum of 55 g was used in this work and it was fixed to let us to have a
overall comparison for different tests due to various other changing variables.
More than 100 g of catalyst is not suggested for the scale of these reactors because
of the higher possibility for slugging phase in hydrodynamic of the reactor.
5.2.2 Fluidized-bed Membrane Reactor
Further suggestions for future works would be concentrated on fluidized-bed
membrane reactor concept which was tested in this work for the first time for
OCM and there are many aspects needed to be considered detailed and tested
further.
During the course of this work, there were some difficulties to test the reactor
with 4 membranes because of short distances between membranes and
thermocouple and the reactor wall so just 2 membranes have been installed. If one
wants to get closer to the results achieved by CFD simulations of Jaso (Jaso et al.,
2011) a scale-up reactor for having 4 membranes is suggested. The reactor design
for future work is shown in Figure 5-1. The design is like the current FeCrAlloy
fluidized-bed membrane reactor but with different dimensions. Of course this
reactor scale-up comes with higher costs because of the material and dimension of
it, bigger furnace needed to be ordered respectively to its size and especially
higher amount of catalyst (120 - 200 g) needed but it is a necessary step to check
fluidized-bed reactor scale-up (without the membranes) and fluidized-bed
membrane reactor concept in pilot-plant scale for OCM with 4 membranes
installed and the higher length allows usage of more amount of catalyst to avoid
the gas runaway beside the membranes.
If the problem of gas runaway beside the membranes get solved then more
percentage or total amount of oxygen can be dosed through membrane to yield
better results.
Page 121
5.Conclusion and Outlook
S. Sadjadi - January 2016 101
Figure 5-1 Design of a FBMR reactor for future work.
Page 122
5.Conclusion and Outlook
S. Sadjadi - January 2016 102
The ceramic membranes can be ordered for this reactor from the same company
the current work ordered from. Hastelloy X material which was used in this work
didn’t show a promising oxidation resistance at higher temperatures (especially
higher than 750 °C) so FeCrAlloy porous filter material is also suggested to be
tested because metal material has a higher mechanical stability and less possibility
for damage therefore lower amount of nitrogen as dilution gas can be used in the
experiments. In the current work less than 55% nitrogen was not tested because if
the ceramic membranes crack would lead in serious safety issues.
For the case of metal membranes, the membranes can be also fixed to the bottom
of the reactor with the same position of the porous part.
In summary, it should be said that fluidized-bed membrane reactor concept has a
potential for further investigation and new ideas of where and in which height to
arrange membranes and how much of the catalyst should be tested further both
theoretically and experimentally.
Page 124
S. Sadjadi - January 2016 104
6 REFERENCES
Abashar, M., Alhabdan, F., & Elnashaie, S. (2008). Discrete injection of oxygen
enhanced hydrogen production in circulation fast fluidized bed membrane
reactors. International Journal of Hydrogen Energy, 33, pp. 2477-2488.
Adris, A., Elnashaie, S., & Hughes, R. (1991). A fluidized-bed membrane reactor
for the steam reforming of methane. Canadian Journal of Chemical
Engineering, 69, pp. 1061-1070.
Adris, A., Lim, C., & Grace, J. (1994). The fluidized bed membrane reactor
system: a pilot scale experimental study. Chemical Engineering Science, 49,
pp. 5833-5843.
Adris, A., Lim, C., & Grace, J. (1997). The fluidized-bed membrane reactor for
steam methane reforming model verification and parametric study. Chemical
Engineering Science, 52, pp. 1609-1622.
Ahari, J., Sadeghi, M., & Zarrinpashne, S. (2011). Effects of operating parameters
on oxidative coupling of methane over Na-W-Mn/SiO2 catalyst at elevated
pressures. Journal of Natural Gas Chemistry, 20, pp. 204-213.
Ahari, J., Sadeghi, M., Zarrinpashne, S., & Irandokht, A. (2013). Optimization of
OCM reactions over Na-W-Mn/SiO2 catalyst at elevated pressure using
artificial neural network and response surface methodology. Scientia Iranica,
20, pp. 617-625.
Page 125
S. Sadjadi - January 2016 105
Ahchieva, D., Peglow, M., Heinrich, S., Mörl, L., Wolff, T., & Klose, F. (2005).
Oxidative dehydrogenation of ethane in a fluidized bed membrane reactor.
Applied Catalysis A: General, 296, pp. 176-185.
Al-Sherehy, F., Grace, J., & Adris, A. (2005). The influence of distributed
reactant injection along the height of a fluidized bed reactor. Chemical
Engineering Science, 60, pp. 7121-7130.
Andorf, R., & Baerns, M. (1990). Oxidative coupling of methane in fluidized- and
packed-fluidized-bed reactors. Catalysis Today, 6, pp. 445-452.
Arndt, S., Otremba, T., Simon, U., Yildiz, M., Schubert, H., & Schomäcker, R.
(2012). Mn-Na2WO4/SiO2 as catalyst for the oxidative coupling of methane.
What is really known? Applied Catalysis A: General, 425-426, pp. 53-61.
Beck, B., Fleischer, V., Arndt, S., Hevia, M., Urakawa, A., Hugo, P., et al. (2014).
Oxidative coupling of methane-A complex surface/gas phase mechanism with
strong impact on the reaction engineering. Catalysis Today, 228, pp. 212-218.
Bennett, M., & Houton, M. (1978). Oxidation behavior of Fecralloy and 20/25/Nb
stainless steels and a nickel-based alloy, PE16, in argon containing 7 µatm
water vapour and 375 µatm hydrogen. Journal of Nuclear Materials, 71, pp.
333-344.
Bhasin, M. (1988). Feasibility of ethylene synthesis via oxidative coupling of
methane. Studies in Surface Science and Catalysis, 36, pp. 343-357.
Bhatia, S., Thien, C., & Mohamed, A. (2009). Oxidative coupling of methane
(OCM) in catalytic membrane reactor and comparison of its performance
with other catalytic reactors. Chemical Engineering Journal, 148, pp. 525-
532.
Bravo, J., & Sikkenk, J. (2002). Design and revamp of modern C2 splitters using
high capacity internals and fast installation techniques. ETRC Petrochemical
Meeting. Amsterdam: Shell Global Solutions International.
Chen, Z., Po, F., & Grace, J. (2008). Sorbent-enhanced/membrane-assisted
steam.methane reforming. Chemical Engineering Science, 63, pp. 170-182.
Chou, L., Cai, Y., Niu, J., Ji, S., & Li, S. (2004). Catalytic oxidation of methane to
C2-C4 hydrocarbons over CeO2 promoted W-Mn/SiO2 catalysts at higher
pressure. Journal of Chinese Chemical Society, 51, pp. 85-90.
Page 126
S. Sadjadi - January 2016 106
Chou, L., Cai, Y., Zhang, B., Niu, J., Ji, S., & Li, S. (2002a). Oxidative coupling
of methane over Na-W-Mn/SiO2 catalysts at elevated pressures. Journal of
Natural Gas Chemistry, 11, pp. 131-136.
Chou, L., Cai, Y., Zhang, B., Niu, J., Ji, S., & Li, S. (2002b). Oxidative coupling
of methane over Na-Mn-W/SiO2 catalyst at higher pressure. Reaction
Kinetics and Catalysis Letters, 76, pp. 311-315.
Chou, L., Cai, Y., Zhang, B., Niu, J., Ji, S., & Li, S. (2003). Influence of SnO2-
doped W-Mn/SiO2 for oxidative conversion of methane to high hydrocarbons
at elevated pressure. Applied Catalysis A: General, 238, pp. 185-191.
Conoras, J., Menendez, M., & Santamaria, J. (1994b). Development of ceramic
membrane reactors with a non-uniform permeation pattern. Application to
methane oxidative coupling. Chemical Engineering Science, 49, pp. 4749-
4757.
Coronas, J., Menendez, M., & Santamaria, J. (1994a). Methane oxidative coupling
using porous ceramic membrane reactors - II. Reaction studies. Chemical
Engineering Science, 49, pp. 2015-2025.
Dang, T., Gallucci, F., & van Sint Annaland, M. (2014). Micro-structured
fluidized bed membrane reactors: solids circulation and densified zones
distribution. Chemical Engineering Journal, 239, pp. 42-52.
De Jong, J., Dang, T., van Sint Annaland, M., & Kuipers, J. (2012a). Comparison
of a discrete particle model and a two-fluid model to experiments of a
fluidized bed with flat membranes. Powder Technology, 230, pp. 93-105.
De Jong, J., Odu, S., van Buijtenen, M., Deen, N., van Sint Annaland, M., &
Kuipers, J. (2012b). Development and validation of a novel digital image
analysis method for fluidized bed particle image velocimetry. Powder
Technology, 230, pp. 193-202.
De Jong, J., van Sint Annaland, M., & Kuipers, J. (2011). Experimental study on
the effects of gas permeation through flat membranes on the hydrodynamic in
membrane-assisted fluidized beds. Chemical Engineering Science, 66, pp.
2398-2408.
De Jong, J., van Sint Annaland, M., & Kuipers, J. (2012c). Membrane-assisted
fluidized beds - Part 1: development of an immersed boundry discrete particle
model. Chemical Engineering Science, 84, pp. 814-821.
De Jong, J., van Sint Annaland, M., & Kuipers, J. (2012d). Membrane-assisted
fluidized beds - Part 2: numerical study on the hydrodynamics around
Page 127
S. Sadjadi - January 2016 107
immersed gas-permeating membrane tubes. Chemical Engineering Science,
84, pp. 822-833.
De Jong, J., van Sint Annaland, M., & Kuipers, J. (2013). Experimental study on
the hydrodynamic effects of gas permeation through horizontal membrane
tubes in fluidized beds. Powder Technology, 241, pp. 74-84.
Deshmukh, S., Heinrich, S., Mörl, L., van Sint Annaland, M., & Kuipers, J.
(2007b). Membrane assisted fluidized bed reactors: potentials and hurdles.
Chemical Engineering Science, 62, pp. 416-436.
Deshmukh, S., Laverman, J., van Sint Annaland, M., & Kuipers, J. (2005b).
Development of a membrane-assisted fluidized bed reactor. 2. Experimental
demonstration and modeling for the partial oxidation of methanol. Industrial
& Engineering Chemistry Research, 44, pp. 5966-5976.
Deshmukh, S., Laverman, J., Vents, A., van Sint Annaland, M., & Juipers, J.
(2005a). Development of a membrane-assisted fluidized bed reactor. 1. Gas
phase back-mixing and bubble-to-emulsion phase mass transfer using tracer
injection and ultrasound experiments. Industrial and Engineering Chemistry
Research, 44, pp. 5955-5965.
Deshmukh, S., van Sint Annaland, M., & Kuipers, J. (2003). Effect of fluidization
conditions on the membrane permeation rate in a membrane assisted fluidized
bed. Chemical Engineering Journal, 96, pp. 125-131.
Deshmukh, S., van Sint Annaland, M., & Kuipers, J. (2007a). Gas back-mixing
studies in membrane assisted bubbling fluidized beds. Chemical Engineering
Science, 62, pp. 4095-4111.
Do, K., Edwards, J., & Tyler, R. (1995). The catalytic oxidative coupling of
methane: I. Comparison of experimental performance data from various types
of reactors. The Canadian Journal of Chemical Engineering, 73, pp. 327-336.
Edwards, J., & Tyler, R. (1989). The oxidative coupling of methane in a fluidized-
bed reactor. Catalysis Today, 4, pp. 345-354.
Edwards, J., Do, K., & Tyler, R. (1990a). Reaction engineering studies of
methane coupling in fluidized-bed reactors. Catalysis Today, 6, pp. 435-444.
Edwards, J., Do, K., & Tyler, R. (1991). The 'OXCO' process for natural gas
conversion via methane oxidative coupling. Studies in Surface Science and
Catalysis, 61, pp. 489-495.
Page 128
S. Sadjadi - January 2016 108
Edwards, J., Tyler, R., & White, S. (1990b). Oxidative coupling of methane over
lithium-promoted magnesium oxide catalysts in fixed-bed and fluidized-bed
reactors. Energy and Fuels, 4, pp. 85-93.
Ekstrom, A., Regtop, R., & Bhargava, S. (1990). effect of pressure on the
oxidative coupling of methane. Applied Catalysis, 62, pp. 253-269.
Eng, D., & Stoukides, M. (1991). Catalytic and electrocatalytic methane oxidative
with solid Gxide membranes. Catalysis Reviews, 8, pp. 357-412.
Ergun, S. (1952). Fluid flow through packed columns. Chemical Engineering
Progress, 48, pp. 89-94.
Fang, X., Li, S., Lin, J., & Chu, Y. (1992b). Oxidative coupling of methane on W-
Mn catalysts. Journal of Molecular Catalysis, 6, pp. 427-433.
Fang, X., Li, S., Lin, J., Gu, J., & Yan, J. (1992a). Preparation and
characterization of catalyst for oxidative coupling of methane. Journal of
Molecular Catalysis, 8, pp. 225-262.
Froment, G., & Bischoff, K. (1990). Chemical Reactor analysis and Design (2.
edition ed.). Canada: Wiley Series in Chemical Engineering.
Fujimoto, K., Asami, K., Omata, K., & Hashimoto, S. (1991). Selective oxidative
coupling of methane with membrane reactor. Studies in Surface Science and
Catalysis, 61, pp. 526-531.
Gallucci, F., van Sint Annaland, M., & Juipers, J. (2008). Autothermal reforming
of methane with integrated CO2 capture in a novel fluidized bed membrane
reactor. Part 1: experimental demonstration. Topics in Catalysis, 51, pp. 133-
145.
Geldart, D. (1973). Types of gas fluidization. Powder Technology, 7, pp. 285-292.
Gesser, H., & Hunter, N. (1998). A review of C-1 conversion chemistry. Catalysis
Today, 42(3), pp. 183-189.
Gholipour, Z., Malekzadeh, A., Hatami, R., Mortazavi, Y., & Khodadadi, A.
(2010). Oxidative coupling of methane over (Na2WO4+Mn or Ce)/SiO2
catalysts: In situ measurement of electrical conductivity. Journal of Natural
Gas Chemistry, 19, pp. 35-42.
Godini, H. (2014). Analysis of individual and integrated packe-bed membrane
reactors for oxidative coupling of methane. PhD Thesis: Technische
Universität Berlin.
Page 129
S. Sadjadi - January 2016 109
Godini, H., Xiao, S., Jaso, S., Stünkel, S., Salerno, D., Son, N., et al. (2013).
Techno-economic analysis of integrating the methane oxidative coupling and
methane reforming processes. Fuel Processing Technology, 106, pp. 684-694.
Grace, J., Elnashaie, S., & Lim, C. (2005). Hydrogen production in fluidized beds
with in-situ membranes. International Journal of Chemical Reactor
Engineering, 3, pp. A41 1-17.
Hinsen, W., & Baerns, M. (1983). Oxidative Kopplung von Methan zu C2-
Kohlenwasserstoffen in Gegenwart unterschiedlicher Katalysatoren.
Chemiker-Zeitung, 107, pp. 223-226.
Hinsen, W., Bytyn, W., & Baerns, M. (1984). Oxidative dehydrogenation and
coupling of methane. Proceeding of the 8th International Congress on
Catalysis, 3, p. 581.
Hou, S., Cao, Y., Xiong, W., Liu, H., & Kou, Y. (2006). Site requirements for the
oxidative coupling of methane on SiO2-supported Mn catalysts. Industrial &
Engineering Chemistry Research, 45, pp. 7077-7083.
IEA. (2014). Key World Energy Statistics. Retrieved from International Energy
Agency.
Jammaer, J., Aerts, A., D'Haen, J., Seo, J., & Martens, J. (2009). Convenient
synthesis of ordered mesoporous silica at room temperature and quasi-neutral
pH. Journal of Materials Chemistry, 19, pp. 8290-8293.
Jaso, S. (2012). Modeling and design of a fluidized-bed reactor for the oxidative
coupling of methane. PhD Thesis: Technische Universität Berlin.
Jaso, S., Garcia, H., & Wozny, G. (2011). Oxidative coupling of methane in a
fluidized bed reactor: influence of feeding policy, hydrodynamics and reactor
geometry. Chemical Engineering Journal, 171, pp. 255-271.
Ji, S., Xiao, T., Li, S., Chou, L., Zhang, B., Xu, C., et al. (2003). Surface WO4
tetrahedran: the essence of the oxidative coupling of methane over M-W-
Mn/SiO2 catalysts. Journal of Catalysis, 220, pp. 47-56.
Ji, S., Xiao, T., Li, S., Xu, C., Hou, R., Coleman, K., et al. (2002). The
relationship between the structure and the performance of NA-W-Mn/SiO2
catalysts for the oxidative coupling of methane. Applied Catalysis A:
General, 225, pp. 271-284.
Page 130
S. Sadjadi - January 2016 110
Kao, Y., Lei, L., & Lin, Y. (2003). Optimum operation of oxidative coupling of
methane in porous ceramic membrane reactors. Catalysis Today, 82, pp. 255-
273.
Kawabata, J., Yumiyama, M., Tazaki, Y., Honma, S., Chiba, T., Sumiya, T., et al.
(1981). Characteristics of gas fluidized beds unders pressure. Journal of
chemical Engineerng of Japan, 14, pp. 85-89.
Keller, G., & Bhasin, M. (1982). Sythesis of Ethylene via Oxidative Coupling of
MEthane: I. Determination of Active Catalysts. Journal of Catalysis, 73, pp.
9-19.
Kiatkitipong, W., Tagawa, T., Goto, S., Assabumrungrat, S., Silpasup, K., &
Praserthdam, P. (2005). Comparetive study of oxidative coupling of methane
modeling in various types of reactor. Chemical Engineering Journal, 115, pp.
63-71.
King, D., & Harrison, D. (1982). The dense phase of a fluidized bed at elevated
pressure. Transactions of the Institution of Chemical Engineers, 60, pp. 26-
30.
Kunii, D., & Levenspiel, O. (1991). Fluidization Engineering (2. edition ed.).
Boston: Butterworth-Heineman.
Lane, G., & Wolf, E. (1988). Methane utilization by oxidative coupling. I. A
study of reactions in the gas phase during the cofeeding of methane and
oxygen. Journal of Catalysis, 133, pp. 144-163.
Li, S. (2001). Oxidative coupling of methane over W-Mn/SiO2 catalyst. Chinese
Journal of Chemistry, 19, pp. 16-21.
Li, S. (2003). Reaction chemistry of W-Mn/SiO2 catalyst for the oxidative
coupling of methane. Journal of Natural Gas Chemistry, 12, pp. 1-9.
Lin, J., Gu, J., Yang, D., Zhang, C., Yang, Y., Chu, Y., et al. (1995). Stability test
of W-Mn/SiO2 catalyst for oxidative coupling of methane. Shiyou Huagong /
Petrochemical Technology (China), 24, pp. 293-298.
Liu, H., Wang, X., Yang, D., Gao, R., Wang, Z., & Yang, J. (2008). Scale up and
stability test for oxidative coupling of methane over Na2WO4-Mn/SiO2
catalyst in a 200 ml fixed bed reactor. Journal of Natural Gas Chemistry, 17,
pp. 59-63.
Liu, Y., Liu, X., Xue, J., Hou, R., Zhang, B., Yu, C., et al. (1998). Effect of
pressure on oxidative coupling of methane over MgO/BaCO3 catalyst -
Page 131
S. Sadjadi - January 2016 111
studies of its deactivation at elevated pressure. Applied Catalysis A: General,
168, pp. 139-149.
Lu, Y., Dixon, A., Moser, W., & Ma, Y. (2000). Oxidative coupling of methane in
a modified gamma-alumina membrane reactor. Chemical Engineering
Science, 55, pp. 4901-4912.
Lunsford, J. (2000). Catalytic conversion of methane to more useful chemicals
and fuels: a challenge for the 21st Century. Catalysis Today, 63, pp. 165-174.
Mahmoodi, S., Ehsan, M., & Ghoreishi, S. (2010). Effect of promoter in the
oxidative coupling of methane over synthesized Mn/SiO2 nanocatalysts via
incipient wetness impregnation. Journal of Industrial and Engineering
Chemistry, 16, pp. 923-928.
Maitry, A. (1993). Critical performance evaluation of catalysts and mechanistic
implications for oxidative coupling of methane. Applied Catalysis A:
General, 104, pp. 11-59.
Malekzadeh, A., Dalai, A., Khodadadi, A., & Mortazavi, Y. (2008). Structural
features of Na2WO4-MnOx/SiO2 catalysts in oxidative coupling of methane
reaction. Catalysis Communications, 9, pp. 960-965.
Malekzadeh, A., Khodadadi, K., Abedini, M., Amini, M., Bahramian, A., &
Dalai, A. (2001). Correlation of electrical properties and performance of
OCM MOx/Na2WO4/SiO2 catalysts. Catalysis Communications, 8, pp. 241-
247.
Mimoun, H., Robine, A., Bonnaudet, S., & Cameron, C. (1990). Oxypyrolysis of
natural gas. Applied Catalysis, 58, pp. 269-280.
Mleczko, L., Ostrowski, T., & Wurzel, T. (1996b). A fluidized-bed membrane
reactor for the catalytic partial oxidation of methane to synthesis gas.
Chemical Engineering Science, 51, pp. 3187-3192.
Mleczko, L., Pannek, U., Niemi, V., & Hiltunen, J. (1996a). Oxidative coupling of
methane in a fluidized-bed reactor over a highly active and selective catalyst.
Industrial & Engineering Chemistry Research, 35, pp. 54-61.
Mokhatab, S., Poe, W., & Mak, J. (2015). Handbook of Natural Gas Transmission
and Processing Principles and Practices. USA: Gulf Professional Publishing.
Natural Gas Supply Association. (2013). History of Natural Gas. Retrieved from
Natural Gas: http://www.ngsa.org/
Page 132
S. Sadjadi - January 2016 112
Nghiem, X. (2014). Ethylene production by oxidative coupling of methane: new
process flow diagram based on adsorptive separation. PhD Thesis:
Technische Universität Berlin.
Nozaki, T., Yamasaki, O., Omata, K., & Fujimoto, K. (1992). Selective oxidative
coupling of methane with membrane reactor. Chemical Engineering Science,
47, pp. 2945-2950.
Olivier, L., Haag, S., Mirodatos, C., & van Veen, A. (2008a). Oxidative coupling
of methane using catalysts modified dense perovskite membrane reactors.
Catalysis Today, 142, pp. 34-41.
Olivier, L., Haag, S., Pennemann, H., Hofmann, C., Mirodatos, C., & van Veen,
A. (2008b). High-temperature parallel screening of catalysts for the oxidative
coupling of methane. Catalysis Today, 137, pp. 80-89.
Omata, K., Hasimoto, S., Tominaga, H., & Fujimoto, K. (1989). Oxidative
coupling of methane using a membranes reactor. Applied Catalysis, 52, pp.
L1-L4.
Ostrowski, T., Mirodatos, C., Fendler, A., & Mleczko, L. (1997). Entwicklung
eines Membran-Wirbelischtreaktors für die katalytische partielle Oxidation
von Methan zu Synthesegas. Chemie Ingenieur Technik, 69, pp. 1624-1627.
Pak, S., & Lunsford, J. (1998b). Thermal effects during the oxidative coupling of
methane over Mn/Na2WO4/SiO2 and Mn/Na2WO4/MgO catalysts. Applied
Catalysis A: General, 168, pp. 131-137.
Pak, S., Qiu, P., & Lunsford, J. (1998a). Elementary reactions in the oxidative
coupling of methane over Mn/Na2WO4/SiO2 and Mn/Na2WO4/MgO
catalysts. Journal of Catalysis, 179, pp. 222-230.
Patil, C., van Sint Annaland, M., & Juipers, J. (2007). Fluidized bed membrane
reactor for ultrapure hydrogen production via methane steam reforming:
experimental demonstration and model validation. Chemical Engineering
Science, 62, pp. 2989-3007.
Roghair, I., Gallucci, F., & van Sint Annaland, M. (2014). Novel Developments in
Fluidized Bed Membrane Reactor Technology. In Advances in Chemical
Engineering (Vol. 45). Elsevier.
Ross, J., Keulen, A. v., Hegarty, M., & Seshan, K. (1996). The Catalytic
Conversion of Natural Gas to Useful Products. Catalysis Today, 30, pp. 193-
199.
Page 133
S. Sadjadi - January 2016 113
Sadjadi, S., Jaso, S., Godini, H., Arndt, S., Wollgarten, M., Blume, R., et al.
(2015). Feasibility study of the Mn-Na2WO4/SiO2 catalytic system for the
oxidative coupling of methane in a fluidized-bed reactor. Catalysis Science &
Technology, 5, pp. 942-952.
Sadjadi, S., Simon, U., Godini, H., Görke, O., Schomäcker, R., & Wozny, G.
(2015, 12 1). Reactor material and gas dilution effects on the performance of
miniplant-scale fluidized-bed reactors for oxidative coupling of methane.
Chemical Engineering Journal, pp. 678-687.
Santos, A., Santamaria, J., & Menendez, M. (1995). Oxidative coupling of
methane in a vibrofluidized bed at low fluidizing velocities. Industrial &
Engineering Chemistry Research, 34, pp. 1581-1587.
Schweer, D., Mleczko, L., & Baerns, M. (1994). OCM in a fixed-bed reactor:
limits and perspectives. Catalysis Today, 21, p. 357.
Shirai, T. (1958). Fluidized Beds. Kanazawa: Kagaku-Gijutsu-Sha.
Siluria Technologies. (2014). Marketwired Press Release. Retrieved from Press
Release from marketwired.
Simon, U. (2015). Prozesstechnik und Stabilität oxidischer Katalysatoren für die
oxidative Kopplung von Methan. PhD Thesis: Technische Universität Berlin.
Simon, U., Görke, O., Berthold, A., Arndt, S., Schomäcker, R., & Schubert, H.
(2011). Fluidized-bed processing of sodium tungsten manganese catalysts for
the oxidative coupling of methane. Chemical Engineering Journal, 168, pp.
1352-1359.
Talebizadeh, A., Mortazavi, Y., & Khodadadi, A. (2009). Comparative study of
the two-zone fluidized-bed reactor and the fluidized-bed reactor for oxidative
coupling of methane over Mn/Na2WO4/SiO2 catalyst. Fuel Processing
Technology, 90, pp. 1319-1325.
Tan, L., Roghair, I., & van Sint Annaland, M. (2014). Simulation study on the
effect of gas permeation on the hydrodynamic characteristics of membrane-
assisted micro fluidized beds. Applied Mathematical Modelling, 38, pp. 4291-
4307.
Thien, C., Mohamed, A., & Bhatia, S. (2008). Oxidative coupling of methane for
the production of ethylene over sodium-tungsten-manganese-supported-silica
catalyst (Na-W-Mn/SiO2). Applied Catalysis A: General, 343, pp. 142-148.
Page 134
S. Sadjadi - January 2016 114
Tonkovich, A., Jimenez, D., Zilka, J., & Roberts, G. (1996b). Inorganic
membrane reactor for the oxidative coupling of methane. Chemical
Engineering Science, 51, pp. 3051-3056.
Tonkovich, A., Zilka, J., Jimenez, D., Roberts, G., & Cox, J. (1996a).
Experimental investigations of inorganic membrane reactors: A distributed
feed approach for partial oxidation reactions. Chemical Engineering Science,
51, pp. 789-806.
US Energy Information Administration. (n.d.). Retrieved from EIA:
http://www.eia.gov/cfapps/ipdbproject/iedindex3.cfm?tid=5&pid=53&aid=1
&cid=regions&syid=1990&eyid=2014&unit=TBPD
Wang, D., Rosynek, M., & Lunsford, J. (1995). Oxidative coupling of methane
over oxide supported sodium manganese catalysts. Journal of Catalysis, 155,
pp. 390-402.
Wang, J., Chou, L., Zhang, B., Song, H., Zhao, J., Yang, J., et al. (2006).
Comparative study on oxidation of methane to ethane and ethylene over Mn-
Na2WO4/SiO2 catalysts prepared by different method. Journal of Molecular
Catalysis A-Chemical, 245, pp. 272-277.
Wang, X., Zhang, J., Yang, D., Zhang, C., Lin, J., & Li, S. (1997). Oxidative
coupling of methane over W-Mn/SiO2 catalyst in a bench-scale stainless steel
fluidized-bed reactor. Shiyou Huagong / Petrochemical Technology (China),
26, pp. 361-367.
Wiedenmann, M. (2014). Aufbau und Erprobung eines Wirbelbettbeschichters für
Herstellung hierarchisch strukturierter Katalysatorsystem. Bachelor Thesis:
Technische Universität Berlin.
Wolf, E. (1992). Methane Conversion by Oxidative Processes- Fundamental and
Engineering Aspects. Van Nostrand Reinhold.
Wu, J., & Li, S. (1995). The role of distorted WO4 in the oxidative coupling of
methane on Tungsten supported catalysts. Journal of Physical Chemistry, 99,
pp. 4566-4568.
Yang, W. (2003). Handbook of Fluidization and Fluid-particle Systems. New
York: Marcel Dekker.
Yildiz, M., Aksu, Y., Simon, U., Kailasam, K., Görke, O., Rosowski, F., et al.
(2014b). Enhanced catalytic performance of MnxOy-Na2WO4/SiO2 for the
oxidative coupling of methane using an ordered mesoporous silica support.
Chemical Communication, 50, pp. 14440-14442.
Page 135
S. Sadjadi - January 2016 115
Yildiz, M., Simon, U., Otremba, T., Aksu, Y., Kailasam, K., Thomas, A., et al.
(2014a). Support material variation for the MnxOy-Na2WO4/SiO2 catalyst.
Catalysis Today, 228, pp. 5-14.
Zaman, J. (1999, March). Oxidative processes in natural gas conversion. Fuel
Processing Technology, 58, pp. 61-81.
Page 136
S. Sadjadi - January 2016 116
7 APPENDICES
Page 137
S. Sadjadi - January 2016 117
7.1 Appendix A- P&ID of the Reactor System
Figure 7-1 P&ID of reactor set-up.
Page 138
S. Sadjadi - January 2016 118
7.2 Appendix B – Minimum Fluidization Velocity Calculation
The theoretical calculation of minimum fluidization velocity comes from Ergun’s equation
which was described in this work but sphericity of the particles (Øs) and bed voidage (εmƒ)
are two parameters in that equation which makes it difficult to have a precise calculation
which fits experimental set-ups. Many scientists tried to modify Ergun equation with their
experimental datas and Arquimedes, Froude and Reynolds numbers. For example Wen &
Yu4:
𝑈𝑚ƒ = 𝜇𝑔
𝝆𝒈. 𝒅𝒑(√33.72 + 0.0408𝐴𝑟 − 33.7
The equation above is one of the most accurate one but yet not completely. In this work the
experimental way was chosen for finding the minimum fluidization. The reactor containing
55 g of catalyst with particle size of 250-500µm at 700 °C was tested with different flow
rates of air (N2+O2) to check the pressure drop and using Mill’s graph5 for minimum
fluidization. The result is plotted blow in the graph. We considered the point A as
minimum fluidization which corresponds to almost 2500 ml/min of flow rate at this
temperature and between A and B it is a transition phase to fluidization. All the
experiments in this work have been in done after point B but close to it.
4 Wen, C.Y. and Yu, Y.H. Mechanics of Fluidization, Chemical Engineering Progress Symposium Series,
Vol. 62, pp. 100-11 (1966).
5 Mills, D. Pneumatic Conveying Design Guide, Butterworths, London, (1990).
Page 139
S. Sadjadi - January 2016 119
Figure 7-2 Experimental finding of minimum fluidization velocity.
Page 140
S. Sadjadi - January 2016 120
7.3 Appendix C – Infrared Gas Analyzer Calibration
The IR gas analyzer was calibrated with gas every few weeks of experiments but still in the
beginning of each day the validation of calibration was done for specifically methane and
oxygen gas with measurements of IR.
In this procedure, specific amounts of nitrogen and methane gases were carried out for two
points and sensitivity drift was measured. The measured values were corrected by linear
equation of:
𝐴 = 𝑥(𝐵 + 𝑦)
A typical calibration for methane is shown in the table below
Table 7-1 Gas analyzer IR calibration for methane.
Flow Actual Value Measured Value x y
4500 ml/min 0% 0,01% 1.08 -0.01
4500 ml/min 33% 30.56%
Page 141
S. Sadjadi - January 2016 121
7.4 Appendix D - Micro-GC Calibration
The peak identification of micro-GC was explained in the text above but here are more
details about this GC calibration.
The gas cylinders used for calibration of GC are:
Table D. 7-2 Test gases concentration used for micro-GC calibration.
Test gas 1 Test gas 2 Test gas 3 Test gas 4
C2H6 10% - - 24%
C2H4 10% - 24% -
CO2 10% 30% - -
CO 10% - -
CH4 - Rest - -
N2 Rest - Rest Rest
And the procedure of calibration is:
Table D. 7-3 Micro-GC calibration step by step.
Multilevel calibration There is no calibration gas which contains all the components
together so the calibration needs tob e done in 3 steps
(levels)
Opening the calibration
sequence
Opening sequence OCM_calibration_level_1.pseq or level 2
and level 3 (C:\PROstation\1110663\Sequence)
Transferring to GC CPU Transfering the changes to GC-CPU „Control-> Download“
The method and sequence being transfered.
Save the method Under „File-> Method-> Save“ save the method and wait till
„Ready“
Connecting test gas 1 Connect the proper test gas
Running the analyze Running an analyse for retention time of each component…
Page 142
S. Sadjadi - January 2016 122
Peak identification table
The table is at „Method-> Peak Identification“. The important
things are name, retention time and selection mode. For
example for level 1 the exact percentages of each component
of this test gas should be filled out. Linear coeff. can be left
blank.
Saving the method When the calibration is done, the method should be saved at
„File-> Method-> Save“
Transfering to GC The changed method and sequence should be transfered at
GC.
Running the calibration „Control-> Start > Execute Calibration Block only” the
calibration should get started
Saving the calibration After the calibration the method should be saved again!
Connecting test gas 2 The second test gas get connected
Running the analyze Running an analyse for retention time of each component…
Filling peak identification
table
Filling out the peak identification table for Level 3
Saving the method „File-> Method-> Save“ save the method and wait till „Ready“
Opening calibration
sequence
OCM_calibration_level_2.pseq
(C:\PROstation\1110663\Sequence)
Transferring to GC The changed method and sequence transferring to GC
Setting the calibration „Control-> Start > Execute Calibration Block only” the
calibration should get started
Saving the calibration
data
Saving the method again
Connecting test gas 3 Connecting the third test gas
Running an analyse Running an analyse for retention time…
Filling peak identification
table
Filling out the peak identification table for Level 3
Page 143
S. Sadjadi - January 2016 123
Saving the method „File-> Method-> Save“
Opening the calibration
sequence
Sequenz OCM_calibration_level_3.pseq
(C:\PROstation\1110663\Sequence)
Transferring to GC The changed method and sequence transferring to GC
Setting the calibration Control-> Start (Execute Calibration Block only)
Saving the calibration Saving the method again
Page 144
S. Sadjadi - January 2016 124
Declaration
This dissertation is the result of my own work and includes nothing, which is the outcome
of work done in collaboration except where specifically indicated in the text. It has not
been previously submitted, in part or whole, to any university of institution for any degree,
diploma, or other qualification.
Setarehalsadat Sadjadi
Date: 17.01.2016