DISCUSSION PAPER SERIES Forschungsinstitut zur Zukunft der Arbeit Institute for the Study of Labor Analysis of Gender Wage Differential in China’s Urban Labor Market IZA DP No. 6252 December 2011 Biwei Su Almas Heshmati
Transcript
DI
SC
US
SI
ON
P
AP
ER
S
ER
IE
S
Forschungsinstitut zur Zukunft der ArbeitInstitute for the Study of Labor
Analysis of Gender Wage Differentialin China’s Urban Labor Market
Any opinions expressed here are those of the author(s) and not those of IZA. Research published in this series may include views on policy, but the institute itself takes no institutional policy positions. The Institute for the Study of Labor (IZA) in Bonn is a local and virtual international research center and a place of communication between science, politics and business. IZA is an independent nonprofit organization supported by Deutsche Post Foundation. The center is associated with the University of Bonn and offers a stimulating research environment through its international network, workshops and conferences, data service, project support, research visits and doctoral program. IZA engages in (i) original and internationally competitive research in all fields of labor economics, (ii) development of policy concepts, and (iii) dissemination of research results and concepts to the interested public. IZA Discussion Papers often represent preliminary work and are circulated to encourage discussion. Citation of such a paper should account for its provisional character. A revised version may be available directly from the author.
Analysis of Gender Wage Differential in China’s Urban Labor Market This paper estimates the gender wage gap and its composition in China’s urban labor market using the 2009 survey data from the Chinese Family Panel Studies. Several estimation and decomposition methods have been used and compared. First, we examine the gender wage gap using ordinary least square regression method with a gender dummy variable. Then, we apply Oaxaca (1973) decomposition method with different weighting systems to analyze the logarithmic wage differential. To be more specific, we prove the existence of sample selection bias caused by the female’s labor force participation. We eliminate it by using the Heckman’s two-step procedure. Empirical results reveal that male workers generally receive a higher wage than female workers, and a great deal of this difference is unexplained. Meanwhile, this unexplained part, which is usually referred to as discrimination turns out to be higher when the adjustment is made for the selection bias. A further breakdown of the wage gap shows that among all the individual characteristics, occupations explain the largest share of the wage gap, followed by their working experience. On the other hand, education acts as a contributor for discrimination in the labor market. JEL Classification: J70, J31, J16, J78 Keywords: discrimination, wage gap, decomposition, gender, Chinese labor market Corresponding author: Almas Heshmati Department of Food and Resource Economics College of Life Science and Biotechnology Korea University, East Building Room#217 Anam-dong, Seongbuk-gu Seoul 136-713 Korea E-mail: [email protected]
China has one of the largest labor forces in the world with a population of about 1.37 billion. According to the China Statistical Yearbook 2011, more than half of them are in employed in 2011. Though the setting of employment has changed substantially over the past 3 decades, full-time employment for women in China has been the norm for the past five decades (Fang, 2005). The data of female labor participation from 1980 to 2009 is reported in Table 1. According to this data, around 70% of the females in China join the labor force. This is relatively high compared to many other countries around the globe. However, this apparent equality is quantitative rather than qualitative, with the majority of women clustered at the lower end of the job ladder. Along with the reformations in the labor market women encounter increasingly blatant discrimination in the stages of recruitment, payment, promotion and retirement.
Chinese social scientists have followed the changes of the women’s employment and their wages relative to men. Women’s Studies Institute of China indicates that women have lower average earnings than men. Ever since the economic transformation of China started, the average male-female earning differentials are widening. According to the data sorted out from the Chinese Family Panel Studies (CFPS), the average male wage is around 2,810 yuan1
The urban labor market in China has grown massively in the past 3 decades as a result of economic development and migration flows leading to an increased wage gap and inequality. Theoretically, the gender wage gap is due to the differences in individual endowments as well as gender discrimination. Most of the studies done on China’s urban labor market pointed out that gender wage differential and wage discrimination have risen from the 1990’s (Gustafsson and Li, 2000; Liu, Xin and Zhang, 2000; Zhang, 2004, among others). However, in recent decade, the general environment of the labor market is turning better for the females. The improvement is accompanied by the enforcement of the Labor Laws in China, agreement of International Labor
per month, while the average female wage is around 2,319 yuan per month. This is corresponds to only 82.5 percent of the male’s average earnings.
Wage differential has long been noted and debated. Many studies are in place to explain the causes of variations in wages and earnings among gender, race, and union membership, etc. Many factors have been identified as responsible for this state of earning differential affairs apart from the obvious difference in capability between the males and females. These include the employers’ objectives and their concerns for profit maximization/cost minimization, the absence of an effective enforcement mechanism for equal opportunity legislation, gender bias in employment policies and workplaces, unequal education and on-job training opportunities and promotion possibilities, male dominated networks and decision making, as well as traditional social values.
1On December 8, 2011, US$1 is valued 6.34 yuan.
3
Conventions related to the protection of women and equal opportunities in employment, and increasing concerns on female workers’ welfare. Therefore in this study, we are interested in the current state of the gender wage gap. Is the pay discrimination against the female workers getting smaller? To what extent can this differential be explained by the individual characteristics? These questions are of primary concern for both researchers as well as decision makers.
Our objective is to provide a more accurate and up-to-date estimation of the wage differential in urban China. In particular, we apply recent SFPS survey data and use different estimation and decomposition methods to analyze the wage gap. This paper improves our understanding on the extent of wage discrimination in the labor market in China. It also helps us to identify the most influential factors contributing to the wage differential. Information about wage gap is important for the government to formulate policies for eliminating gender inequality and promoting a more equalized labor market in China.
The following section provides a background of the labor market in China. In Section 3 we provide an overview of the literature on wage differential. Section 4 introduces the data that we used for the empirical analysis. Section 5 describes models and Section 6 provides analysis of the empirical results. Finally, conclusion and some policy suggestions are given in Section 7.
2. Labor Market and Gender Wage Differential in China
Central planning and labor market regulation over the past years, is marked by assigned jobs and equalized wages. Women in China enjoyed a greater degree of gender equality in the workplace, compared to their counterparts in the competitive market economies. The enhanced equality was although limited to low and middle rank levels of employment. While several changes have taken place in the labor market in the recent years aiming to revive China’s economy, women in China have begun to loss their previous better equality advantages. These major changes are described below.
Firstly, in the mid-1990s to the early 2000s, the amount of state-owned enterprises (SOE) has been acquisitioned by private companies. From Table 1, we can observe that the share of SOE fell sharply from 73.6% to 51.1% from 1995 to 2009. During this reform, millions of workers were laid-off or forced to an early retirement, many of them consequently became bewildered and unsuccessful job seekers. This radical downsizing of the state-owned corporations and public institutions were accompanied by a series of reforms in the human resource policies and practices in the state sector. These were introduced to cancel out the erosion of job security and welfare provision and it tightened the performance management as well as it eased the transformation process. Still, in the face of these changes, female laid-off workers find it hard to survive in the ever fierce competition against their male counterparts and other younger job seekers. Most of them have to accept a wage cut in order to get employed and they
4
crowd up in the low paid service sector. Some of them stay out of the labor market and rely on their husband’s income or the tiny government support and subsidies. And very few females after losing their employment, if they are financially capable try to run small private businesses.
The second major change has been the rapid growth of private sectors with the presence of diverse ownership forms, namely multinational corporations, international joint ventures, domestic private firms, self-employed businesses. We can see a stunning expansion of these units from 1980-2009 that within 3 decades they grew from zero to nearly a half share of the total urban employment units. The labor market is becoming more competitive and flexible. Majority of the workers are categorized by their gender, experience, residence-status2
These findings also imply that the enterprise behavior in the market environment also affects the wage structure. Enterprises aim to maximize profits and have the autonomy for hiring people and deciding the level of compensation; they value, for whatever reason, female workers less than male workers, and thus hire fewer women or pay them less. If the differences in education and other individual characteristics cannot explain
and market capability. The market economy gives rise to different treatments according to the employers, workers and consumers’ discriminatory taste. This places female workers and those with origin in rural in a unfavorable position.
Third, continuous urbanization and labor surplus in the agricultural sector has attracted an influx of migrant rural workers to the rapidly growing urban areas. Due to low skills and lack of education these migrants overcrowd in low-paid segments of the job market. Hence, they pose huge challenge against urban female workers, who are captured by an increase in the share of urban population (see Table 1). This is because most of the migrants are males, who are stronger and willing to accept lower wages than urban females. Moreover, they can spare employers’, the consideration of bearing child and early retirement policies if their employees are females. Thus an increasing trend in the migrant inflows from rural to urban places lowers the possibility for females to get a job in the first place and lowers the level of payment to females.
Several studies which started from the 1970s in China prove the level of impact of the economic reform and the development of wage differential. Maurer-Fazio et al. (1999) suggested that the higher the level of market-oriented reform in the work unit, the wider will be the gender wage gap in the urban labor market. Zhang (2004) found out similar results and he further identified sub-groups of employees who suffer from the growing wage gaps. These are among, the lower educated, over-forty-year old, non-sector workers, and blue-collar workers. On the other hand, Gustafsson and Li (2000) found out that young women and women with limited education have especially deteriorated during the transformation when compared to men having the same characteristics.
2 It depends on individual’s birthplace containing two types of status: one is rural and the other one is urban. One can tell the residence-status though a certification of the Chinese citizenship, so-called Hukou.
5
the entire wage differential between the genders, evidence of discrimination is said to be present in the labor market
The type of work unit is another contributor for the wage differentials.State-owned units behave differently from their non-state counterparts which operate in business environment with a closer resemblance to a competitive labor market. Meng (1998a) proved that one third of the gender earnings differentials are attributable in full to the discrimination for those employees whose jobs were assigned by the local governments, while two-thirds can be attributed to the discrimination on the part of workers who obtained jobs through individual job-searching efforts. Another reason for gender wage differential addressed by Meng (1998b) was gender occupational segregation suggesting that females usually crowded in lower paid jobs. Wang and Cai (2008) studied the gender wage differential in the inter-sectors and intra-sectors dimensions. By comparison they pointed out that the main source of lower earnings for females lied in the unequal pay within the sectors and the earnings gap due to the differences in the sectoral attainment was relatively small.
It is apparent that China’s reforms and opening up of its economy has had significant effects on the labor market. While some workers are facing a greater level of employment insecurity and worsening conditions, others are presented with wider occupational choices, job mobility and higher rewards for their skills and education. Employers in general are encountering increasing pressure for quality, adaptability, and performance enhancement. This calls for the need of equality in the labor market and more complete legislation to protect the labors’ rights in China.
3. Theoretical Background
Wage differential, this common phenomenon in the labor market around the world has spawned a rich literature on its development and sources. On one hand, it is important to specify the determinants of wage which can be used to narrow the gap. On the other hand, it is crucial to find the explanations to quantify significant wage differences between the groups which are not justified by differential productivity and human capital investment. This unexplained part is mainly referred to as discrimination. Thus it is important through various policies and regulatory measures to reduce the non-human capital and productivity related portion of the wage gap.
At the theoretical level there are three main economic genres regarding wage differential. One is the neoclassical theory stemming from the work of Becker (1957) which suggests that the prejudice is expressed in a discriminatory taste on the part of employers, workers and consumers. The second one is focused on the statistical theory of discrimination (Aigner and Cain, 1977). The premise of this one is that firms have limited information about the skills of the job applicants. This gives them an incentive to use easily observable characteristics such as race or gender, to infer the expected productivity of the applicants.The last one is the segmented labor market approach,
6
which can be traced back to the theory of non-competing groups in the work of Mill (1885). This approach moves away from the concept of competitive labor market and views the labor market as being split into sectors that are either dominated by male or female workers respectively. Examples of this approach are “job crowding” and “dual labor market”.
Theoretically whether it is better to view wage differential as an outcome of essentially competitive situations or as a product of non-competing groups at the labor market is a debatable point. Yet the segmented approach has an evident weakness in it. It cannot address the issues on how occupations are segregated and the reasons for discrimination still persist or be eroded over time.
The econometric investigation of discrimination started with Becker’s seminal study on economics of discrimination in 1957. Since then, the proliferation of the use of micro data enables economists to analyze the productivity of individuals. In particular, the decomposition technique which was pioneered by Blinder (1973) and Oaxaca (1973) has frequently been applied to data acquired from various countries and at time periods (For examples, see Wolf and Petrela, 2004; Smith, 2002; Boraas and Rodgers, 2003; Bhandari and Heshmati, 2008; Jung and Choi, 2004). This method determines how much wage differential between two groups is attributed to the differences in the characteristic of each group where wage regressions are estimated separately. For general reviews on the measurement of inequality and its decomposition see Heshmati (2004a) and (2004b). Weichselbaumer (2005) provides a meta-analysis of the international gender wage gap and Jone (1983) provides a critical comment on Blinder’s method.
Several changes have been made with respect to the original Blinder-Oaxaca method. For instance, Reimers (1983) developed this model by taking account of possible selectivity bias due to the distinction between the offered wages and the observed wages. He claimed that discrimination, if affected the wage rate largely, it would influence the individual’s decision on working participation. Therefore, the offered wage would be truncated and incidental as it depends on another variable, namely, labor participation as a conditional variable.
Cotton (1988) reformulated the Blinder-Oaxaca model by further breakdown of the unexplained part, so that both the disadvantage (discrimination) imposed on the minority and the advantage (benefit) bestowed on a majority can be estimated. A more complicated transformation of this model was driven by Neumark (1988), in which he considered the linkage of the Blinder-Oaxaca method to a theoretical model on the employers’ discriminatory behavior.
4. The Data
The data used in this paper is from a primary survey designed and conducted by the Peking University for the national program of Chinese Family Panel Studies (CFPS)
7
which started in the early 2007. In general, the basic idea of CFPS is to understand social and economic changes through data at an individual, family and community levels. CFPS has covered most of the questions in 4 panel surveys (PSID, CDS, HRS, and NYLS)3
Relatively, Beijing, Shanghai and Guangdong are economically developed regions when compared to other regions in China. With a higher demand for labor force, these three regions have more institutionalized urban labor markets. Whereas, of the total employment, their preferential type of economic activities varies resulting in different contribution of male and female work force. Beijing, with its tertiary industry accounting for 73.2% of its gross domestic product shows little difference in the male-female worker proportion. Shanghai, stands as the commercial and financial
in the U.S. with themes covering social, economic, education, health issues and so forth.
We use the data from the CFPS survey in 2009. The information is collected from the residents in Beijing, Shanghai, and Guangdong on the basis of a structured questionnaire. To focus on wage determination in the labor market, we restrict our sample to civilian wages and salaried employees. In accordance with the standard practice, we exclude the following from the analysis: self-employed individuals, retirees, students, agricultural workers, the disabled, retired employees who were rehired and temporary unemployed workers. We also excluded all persons aged 15 or less (China’s labor law sets the minimum employment age at 16 years) as well as respondents who provided incomplete information on wages, education, age, or other key variables. After the above mentioned exclusions, the sample comprised of 1,533 observations including 117 housewives and 1,416 working individuals between the ages of 16 (school-leaving age) and 55 (state retirement age for women) or 60 (state retirement age for men). For the working individuals, there are 844 men (59.6%) and 572 women (40.4%).
We have used a log of the average monthly wages earned from a main job, as a dependent variable including three regional dummies, five education level dummies and six occupation typed dummies. Working experience was not observed in the present data. Hence, we define the variable of experience as age minus the year of education minus 6 years. Additional variables include a set of dummy variables representing the type of household registration, child and marital status. A full list of variables and their definitions are presented in Table 2.
Table 3 presents the summary statistics of the sample data including the means and the categorical distribution of the individuals’ characteristics, for males, females and their differential, which are regarded as the determination for the wage rate. Here we briefly introduce several main factors based on the current available statistics.
Regional location
3PSID (Panel Study of Income Dynamics), CDS (Common Data Set), HRS (Health and Retirement Survey) and NYLS (New York Law School).
8
center of mainland China and it is attracting more females to become office workers. It is because gender distinction is less in offices than that in the factories where physical strength mattes more. In contrast, Guangdong has a higher need for male workers to work in the production and exports sectors. Guangdong owes its growth to the largest share of manufacturing industry and its volume of exports in China. It is interesting to look at the wage rate of these three areas which have relatively similar economic level but have different preferential in the type of industries.
Education level
Education is one of the traditional human capital theory variables, which acts as a proxy for individual competence. In this paper we define 5 ladder type sequentially increasing dummies for education. According to the conventional studies, education has a positive effect on wages, for it increases the earning capacity through its effect on an individual’s productivity. We also expect an increase in the wage rate along with a higher level of educational attainment. However, education has an ambiguous effect in terms of explaining the gender wage gap in China. Zhang (2004) found out that from 1986 to 1993, the power of education to explain wage gap increased from 2.3% to 5%, but there was a fall back to 2% in 1997. Xie and Yao (2005) argued education can explain a small amount of the gender wage gap in 2002. Chen and Hamori (2008a) also found education contributed to the discrimination in the labor market in 2005 (see also Li et al, 2005). From Table 3, we can see that females in China enjoy a higher education attainment than their male counterparts. The difference becomes evident in the attainment of the college diploma. The largest gap can be observed in the university education, showing that a larger proportion of the female workers achieved the Bachelor’s degree. Though it is meaningful for females in China to get equal or more education opportunities than males, given that females earn less than the males, we expect that education levels have negative effects on the explanation of the gender wage gap.
Work experience
Experience is the other traditional variable in the human capital theory, which is proved to have a non-linear relationship with wage in an earning equation. This is to an extent that work experience is an investment in an on-the-job training. Incentives for this form of human capital accumulation declines with age. The principal reason is that the present value of any returns-to-training investment declines as the residual work-life of the worker decreases. Thus, a positive sign on experience and a negative sign on squared-experience are expected. In our sample, in an average, males possess more than 4 years of experience when compared to females. This is attributed to longer schooling period for females, lower pension age and motherhood leaves. Most of the literatures found that experience can explain the gender wage differential to a certain degree (Zhang, 2004; Xie and Yao, 2005; Chen and Hamori, 2008a).
9
Type of occupation
The skill of an individual worker is assumed to play an important role for higher earning opportunity (Wang, 2005; Gustafsson and Li 2000; among others). We separate the observations into 6 categories of occupations including two types of workers in service industry, low/high-skilled workers in the manufacturing industry, and junior/senior professionals. A positive relationship between the monthly wage and the complexity of the job is expected. Generally, it is more common, that females work in the service industry than males. Moreover, manufacturing industry has a larger number of male workers than females. This is attributed to the physical difference between genders. However, it is surprising to find more men working as senior professionals than females despite females receiving more tertiary education than the males. We can see that the lower levels job in occupations with higher knowledge and higher social status (e.g. physicians, scientist, university professors, etc.) are usually filled by females who are already in the minority group in those occupations. This partially reflects the fact that females in China have lower status jobs after graduation. Even when they find the right track of professional career, they fail to be promoted as quickly or as frequently as their male counterparts (Fang, 2005).
Household Registration Type
China for about 40 years had isolated rural and urban economies from each other. One cause for segregation is the strict Household Registration System, which required individuals to register with the local authorities to gain residency and thereby, determined where people lived and worked. (Meng and Zhang, 2001) Even if the restrictions on rural-urban migration have been eased in the late 1980’s; this old system remains potent. It continues to serve as one of the key institutions perpetuating China’s rural-urban disparity. Discrimination against rural migrants in terms of occupational attainment and wages has been found in several literatures (e.g. Wang and Zuo, 1999; Wang and Cai, 2006; Zhao, 2000; Xin, 1995; Chi et al., 2007). In our sample the proportion of urban residents for both genders are nearly the same, reaching to around 62% of the total number of observations. As the total workforce comprises of a large share of migrants, it is important to capture the effect of workers’ residency on their monthly wages. Given an earning differential between these two groups, a positive sign on this dummy variable is expected when the urban residence is assigned as 1.
Marriage and Child status
Finally we consider the status of marriage and child for the worker assuming that getting married and having a child may have different effects on one’s earnings. We propose the hypothesis that couples usually have a larger expenditure than that of a single one’s. Thus the former ones may have incentive to earn higher wages. Previous studies have shown that, marriage had positive effects on a person’s wage rate in China (Chen and Hamori, 2008; Xie and Yao, 2005).
The relationship between the children and the workers’ wage rate has seldom been
10
addressed in the previously conducted wage differential studies. Previous studies, which mainly focused on females, found out that mothers earn lower hourly wages than do women without children due to less working experience and temporary part-time employment (Hill, 1979; Waldfogel, 1997). Here, we also consider a negative effect of children on males or females’ monthly wages as time and efforts are needed for parents to take care of their children.
5. Specification of the Model
In this section, we analyze how the various characteristics of individuals contribute to the gender wage differential through application and comparison of several alternative approaches. The first step involves the identification of whether the gender wage differential exists statistically and significantly or not. In doing, so we estimate the following Mincerianearning equation (see Heckman et al., 2003) with an additional gender dummy variable:
(1) iii MXW εγβ ++=ln
where, Wi is the monthly wage of the worker i, Xi is a vector of individual characteristics (see Table 2 for the list of the variables), Mis a dummy variable for male, β and γ are vectors of unknown coefficients to be estimated, and εi is a disturbance term which is assumed to satisfy the usual properties. The coefficient γ is the estimated coefficient of the gender dummy variable in this earning equation. It supposedly measures the wage penalty or the wage differential for the females after controlling several characteristics such as education, experience, occupation, marriage, child, and Hukou in the earnings determination.
As mentioned previously the main objective of this paper is to analyze the composition of the gender wage gap and investigate how individual characteristics can explain the gap. Therefore to begin with, we define the gross wage differential as:
(2) 1−=f
m
WW
D
where, Wm/Wf is the observed male-female wage ratio. Then, we introduce the standard Mincerian earning equation for males and females separately written as:
(3) igi
gi XW ε+=ln
where, the subscript g denotes worker’s gender, g=(male, female). The variables included in these equations are the same as those in the equation (1) but with the absence of the gender dummy, M.
Estimated wage equations for different sexes can be formulated based on the estimated
11
coefficients as follows:
(4) fffmmm XWandXW ββ ˆlnˆln ==
where, W is the geometric mean of the monthly wages, X is a vector of the mean
values of the regressors and β is the vector of the corresponding estimated
coefficients.
By taking the log form of equation (2) the monthly wage differential between males and females can be expressed as:
(5) ffmmfm XXWWD ββ ˆˆlnlnln −=−=
Following Oaxaca (1973), the above equation can be further transformed for decomposition purpose as:
where, I is an identity matrix and Ω is a diagonal matrix of weights. This states that the mean difference in log monthly wage is decomposed in to two parts. One part is of the differential which is due to their average endowments (the first term on the right-hand side), and the effects of discrimination and the other omitted factors, as revealed by the second term.
In general, we will get different measures to analyze the wage differential, depending on the choice of weights in the matrix Ω. If Ω=1, it suggests that discrimination penalizes the female by preventing them from earning according to the male’s wage-offer function. If Ω=0, it implies that the discrimination gives the male advantages. In another words, males are paid more than what they would get in a non-discriminatory world.
These two equations represent two extreme cases. The decomposition of differences in earning is the estimate of what a male worker receives if he faced the female wage structure or vice versa. It is most likely that the real values would fall in between the two extreme cases. Therefore, we add Reimers’s (1983) method as a comparison. In this model Ω=0.5I, shows the employers’ preference for males and their distaste for females, distort both groups’ wages. Therefore, neither group’s observed wage-offer function would be likely to exist in a non-discriminatory world. Following the Reimers’s method the wage differential in (6) is reduced to:
Moreover, Reimers pointed out that if participation in the labor market is not random,
12
then the estimation is subject to sample selection bias. In our case, this problem occurs when we take in to consideration the female worker’s population. Women with higher expected wage rate or those who prefer to be a housewife are reluctant to join the labor force. As a result, their wages may not be observed and this absence would affect the to-be-estimated wage structure. To encounter this kind of selective problem Reimers (1983) applies Heckman (1979) two-step selection correction estimation procedure (see also Wooldridge, 2006). The first step is to specify a labor force participation equation for women in the form of a probit function in order to get an inverse Mill’s ratio to correct the possible selection bias. Specifically, the dependent variable is a binomial variable assigned as 0 if the female is a housewife and as 1 if the female works. Explanatory variables include dummies for the region, education level, Hukou, Marriage and Child status. Experience and occupations are not considered for housewives who have no related information. The second step involves estimation of the wage equation by OLS with the inverse of the Mill’s ratio (MR), which is predicted from the probit function as an additional explanatory variable. Here the sample is limited to only females working. With the adjustment term, the equation (1) and (4) changes into the following forms:
(8) fiff
fi
fi RMXW εδ ++=ln
(9) fffff RMXW δβ ˆˆln +=
and the wage gap decomposition in equation (7) changes as:
here, δ is the estimation of the covariance between the errors in the probit and wage
equation and RM is the estimated inverse Mill’s ratio to correct for the selection bias resulting from the differences in females’ probability of working.
6. Empirical Results
6.1 Determinants of Monthly Wage
The results of regressions analyses have been shown in Table 4.1 and 4.2. These tables contain the results of the estimated earning equation for the total sample of workers with a gender dummy variable, and the results of the estimated earning equations for females and male workers separately. For females, there are two earning equations, one which adjusts for the sample selection bias, while the other does not.
From the first column of Table 4.1, we can identify the contribution of the worker’s characteristics and the effect of discrimination on the wage gap between the male and female workers. Overall, the model fits the data relatively well, and most of the
13
coefficients have expected signs and are significant at less than 5% to the level of significance. The coefficient of gender dummy shows that male workers on an average earn about 5.9% more than their female counterparts, keeping the other variables a constant. This result confirms the existence of wage discrimination in China.
Other characteristics have different effects on wages. Generally, workers from Beijing have the same wage rate as workers in Guangdong, as the coefficient is not significant at the 10% level of significance. However workers in Shanghai enjoy on an average a 4.5% higher wage rate than workers from other two regions. This is consistent with the report given by the Scientific Socialism Research Institution in China (2011) where it indicated that Beijing and Guangzhou have a lower average wage and consumption levels than that in Shanghai. It also reflects that wage varies in the dominated sectors if the samples are collected randomly. For example, in the case of Shanghai, larger share of workers are employed in finance and commerce sector which leads to a higher wage rate than the other two locations, whereas Guangzhou has more workers in manufacturing while Beijing has more workers in education and government sectors.
A positive association is obtained consistently between the successive higher levels of education. According to our results, if we set the junior/below junior graduates as the reference category, every upgrade in education attainment is accompanied with 5% increase in wage rate and with a 10% rise if one attains further studies after his undergraduate course. This result can be supported by Bargain et al. (2007) who proved the phenomenon that the average wage of the work force increased in return from the education level. This is due to the rapid improvement in educational attainment which has taken place in China.
Experience has an inverted-U shape relationship with wage. Such relations are illustrated in many previous literatures (Liu, Meng and Zhang, 2000; Zhang, 2004). The relation is characterized by an increase in wages at a worker’s early age then the wage is peaked at somewhere and followed by a decrease at the later stage. It can be explained that if a worker is in the labor market for a long time, the return of his experience is likely to fall as his skill might be out-of-date due to the rapid development of technology. On the other hand, his incentive for learning new skill is weaker than that for the younger ones. Hence, his expected returns are smaller due to the approaching of retirement.
Types of occupation are the greatest contributors to the difference of wage rates. Various types of occupation would entail a wide range of compensation due to the level of skill sets required. White-Collar workers earn 11.2% higher than people who take up low-paid service jobs. Nevertheless, coefficient for low-skilled workers in the industrial sector is small and is statistically insignificant showing a similar wage rate with low-paid service workers. Those with special skills such as trainings in machinery, driving etc. receive 14.1% more than the reference group. Larger gaps can be observed if a person works as a professional (physicians, professor, lawyer, etc.), with 25.2% higher wage for the juniors and a substantial amount of 55.3% higher wage for the
14
seniors.
As expected, urban residents get higher wage rates than rural residents. Several reasons can be addressed to explain this phenomenon. Firstly, the productivity difference between the urban and rural residents is because the former usually has an easier access to tertiary education and more job-training opportunities in order to get a higher-paid job. Second, the employer’s discrimination is another contributing factor for the earning difference between the urban and rural immigrants (Luo, 2008). Third, the two-tier labor market, or labor market segregation in China yields to the inequality (Knight et al., 1999; West and Zhao 2000; Goh et al., 2008). Moreover, urban residents enjoy other advantages like wider personal networks, accommodation, and information for jobs etc.
Marriage possesses an expected positive effect on the wage rate. A married worker has 4.2% higher wage than others who are single or divorced. This difference may be because the couples’ expenditure is usually higher than that for singles. This, in turn serves as a stimulator for couples to seek for promotion or higher paid job in order to maintain and further improve their living standard. Also, married workers tend to be older than singles thus they get higher wages with longer working experience. On the other hand, wage rate is shown to be 6.4% lower if a worker has a child, considering the amount of time and energy that will be distracted from working for child rearing.
The results of the earning function for only males are presented in the third column of Table 4.1, with the R-squared value of 0.5789. The coefficients of workers’ characteristics are similar to those attained from pooled earning function.
In Table 4.2, we can see the results of two estimated alternative equations for female workers. The first column shows the results from the equation with no consideration of sample selection bias. While the third column presents the results generated from the Heckman-two step procedure adding to the negative and significant inverse Mill’s ratio as an explanatory variable in the second wage equation to eliminate the possible selection bias. On comparison the results we note that, the coefficients, other than experience and occupation, have changed significantly suggesting that housewives do induce changes to the effects of determinants for females’ wage structure. The returns of education becomes smaller, so as experience and type of occupations. Children and marriage are not significantly related to the wage rate. This indicates that if we correct for the bias, the females’ wage structure will change less rapidly than in a biased estimation. According to Reimers, we explain this situation by saying that women who have high-wage opportunities, given their observed characteristics, have even better opportunities outside the wages and salary sector. Hence, they are less likely to be included in the labor market.
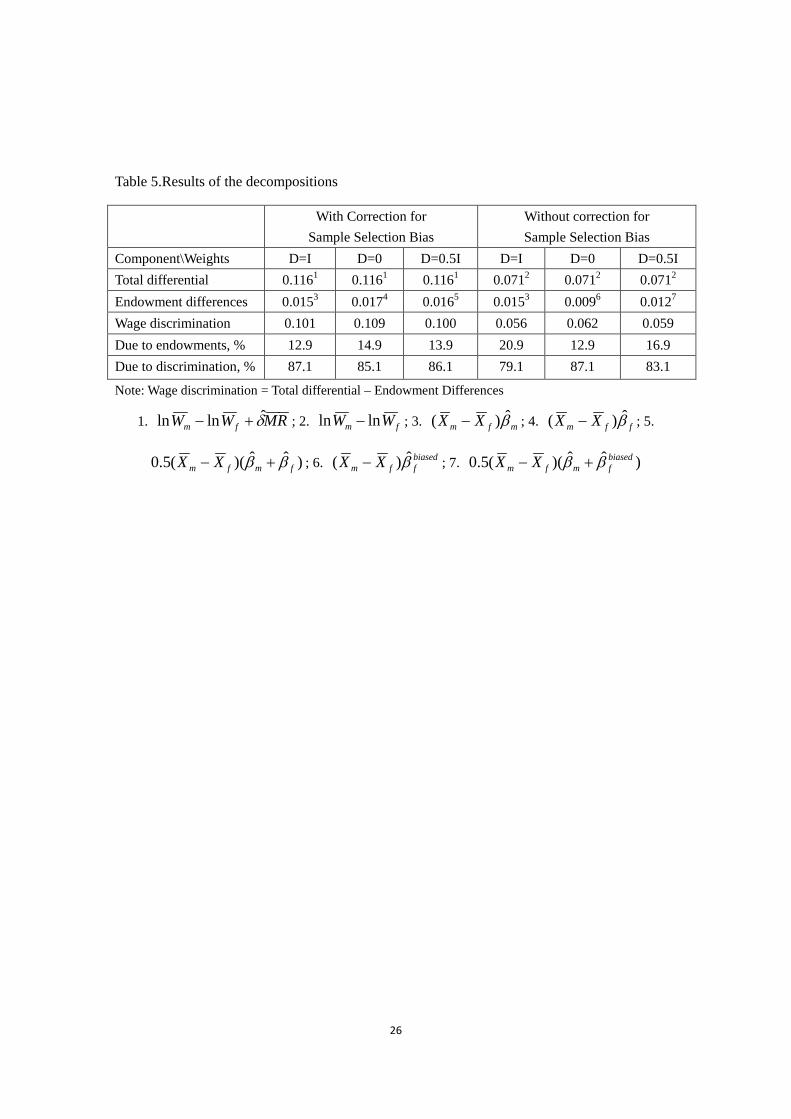
In the next step we present the result of the wage gap decomposition using the Oaxaca decomposition technique with different weights. The differences are then attributed to the relative endowments of human capital between the males and females and the labor market discrimination components.
15
6.2 Decomposition of the Wage Gap
Table 5 reports the result of decomposition of the estimated wage gap among genders. The total wage differential has been decomposed into two parts; the first part is due to the difference of genders’ endowments, and the second part is due to the differences in the parameters of the wage function which can be attributed to the labor-market discrimination and to other omitted variables. We show this measure of discrimination using three different sets of weights (Ω is equal to 0, 0.5 and 1.0) under two kinds of estimations (with and without correction for sample selection bias).
The mean log monthly wage difference in our sample is 0.071. Since selection bias term is negative and significant, OLS estimates would be downward biased too, as would a wage-differential decomposition based on the OLS results. The correction for selectivity in our sample widens the gender differential to 0.116. Thus, the degree of underestimation of bias due to differences in the probability of women working in the labor market is relatively large.
It is interesting to ask how serious is this problem of discrimination in producing these differences? The results from the adjusted earning function are more stable, indicating that discrimination accounts for around 86% percentage of the estimated wage differential. While the biased functions give the results that the discrimination ranges from 79% to 87% averaged at 83%. These results are generally similar with those of the previous studies of gender wage differentials in China: for instance Chen and Hamori (2008a) who proved that discrimination counted to about 70% using Oaxaca method, and 75% using the Reimers method of the wage differential in 2005; Liu et al. (2000) also showed that discrimination in Shanghai labor market was about 88% using the men-weighted value, 93% using the female-weighted value, and 90% using the Cotton method in 2000. A small variation may arise from using different datasets, assigned to weights and methods. However, it is safe to draw a conclusion that in the past decade, discrimination has been a main contributor for wage differential in China’s urban labor market. It is obvious that the three estimates of discrimination are quite similar for the adjusted function. However, fluctuations in percentage of discrimination can be found if they are derived from functions with sample selection bias. These changes could be attributed to large coefficients of education and other variables in the biased earning functions for females.
While discrimination remains large in China, we try to explain the causes of this phenomenon in light of analyzing the effects of the personal characteristics. Table 6 displays the effects of the individuals and the labor market characteristics on the explained and unexplained part of the wage differential. Though the weights are different the scale of the coefficients’ effects are nearly the same.
It is surprising to find that education only accounts for 6% of the wage gap with a negative sign, indicating that education enlarges the wage gap between females and males. While in the unexplained part, education shows a positive effect and explains 23% of the discrimination. This is because females have higher education attainments than
16
males while they are especially less paid on jobs. It is more obvious for high school graduates and Master or Ph.D. holders. Those two types of employees generally work in physical-work and senior professional areas respectively, whereas males receive higher wages than females. Same results have been found in Chen and Hamori (2008a). Another reason can be that, education acts more like a signal for an employer to identify a person’s ability in China’s labor market (Li et al., 2005). If a female wants to prove her ability, being aware of the existence of gender discrimination, she might resort to a higher education degree and accept a lower wage given for her educational attainment.
Among all the characteristics, occupation has the strongest power in the explained part. This explains 27% the wage gap. It is common to find that the gender pay gaps are small within the narrowly-defined occupations (Gunderson, 1989). The effects in relation with two types of workers are especially strong, namely the low-skilled workers and senior professionals. It is worth to note that, the shares of males are higher than the shares of females in these two types of occupations whereas males’ college and tertiary education attainments are less than the females. This happens when the discrimination of employment exists. It is reflected by preventing females from entering the high-wage sector in the labor market and eventually leads to the increased wage gap. Chen and Hamori(2008b) in the discrimination part, say that the effect is about 24%. Low-skilled workers and Junior professionals suffer from discrimination most. This can be mostly explained by males’ physical advantages and employers’ preferences.
Instead of explaining the gender wage gap; experience is more likely to contribute to the discrimination. For parameters of regions, Beijing and Shanghai generally have the same amount of effects, indicating discriminations against female workers. Marriage explains the wage gap to a certain degree. It may suggest that Chinese women, like many elsewhere, bear primary responsibility for household chores and childcare (Loscocco and Wang, 1992). Despite the significant differentials between the married females and males, (our results in Table 4.2) show that married women earn more than single ones. This result is similar to Hughes and Maurer-Fazio’s (2002) finding where they explained this “marriage premium” by mentioning that employers prefer married workers –perhaps they view married workers as more stable and less mobile-or that the wage system contains equity provisions and views married workers as more needy. But if the second reason stands, Child should also explain the wage gap rather contribute to more discrimination since females’ with children have higher needs than those without. Thus we consider that employers may prefer married females, but once if they had children, they might be considered not as competitive as their counterparts and thus receive a lower wage.
7. Conclusion and Policy Suggestions
This paper intends to analyze the gender wage differential in China’s urban labor
17
market. To attain this, first we identify the wage level and gender wage differential determinants using Mincerian earning function with gender dummy variable. Second we use Oaxaca methods with three different weighting systems to analyze the composition of wage differential and employ the Heckman-two-step procedure to eliminate the possible sample selection bias attributed to the differences in the probability of working.
In the last section we have seen how much of the total gender wage differential comes from sources such as discrimination and those due to the individual characteristics. The latter category is controllable and can be impacted by policy, such as education levels, geographic sector and occupation; while others comes from characteristics that are beyond direct influence, such as experience, marriage and child status. Discrimination apparently is an overwhelming reason for the low wages of females. After adjustment for selection bias, the estimated discrimination is around 85% of the gender wage gap. Occupation plays an important role to explain the wage gap while education, instead of explaining the wage gap, is a contributor to the gender discrimination in China’s urban labor market. Married women earn less than their married male counterparts but they earn more than the unmarried females, while having children has a small effect on discrimination.
It is important to note that the unexplained differential is not an exact measure of discrimination, as there is an absence of detailed controls for all possible relevant factors of job characteristics and person-specific skills. In Macpherson and Hirsch (1995), this differential is likely to overestimate the magnitude of discrimination. However, when the unexplained differential constitutes to a large percentage of the total differential, the possibility of gender discrimination cannot be completely ruled out (Blau, Ferber, and Winkles, 1998).
What do our findings mean for those including state, associations and civil society organizations who are concerned about improving the economic situation of females in China? Firstly, anti-discrimination efforts are in all its forms needed regardless of their wage gap effects. Government is encouraged to reinforce the implementation of laws to forbid gender discrimination in terms of wages, employment, opportunities and promote equality; promote gender equality through mass media and education system; and increase the number of female employees in the public sector. Second, in light of our analysis, we find discrimination to be severe foremost in the high-wage sector. With this respect, government could encourage the enterprises to employ more female workers by providing various incentives. Third, while maintaining equal opportunity for educational attainment for both the genders, government should strive to improve the quality of education as well. For education, is a time and money consuming investment it should act as a role to improve one’s productivity rather than simple signaling. Only through improved quality combined with necessary incentives and regulations can education narrow the gender wage gap rather than increasing it. Thus state intervention and incentive provision and regulations are among the measures to be
18
combined with education and general public awareness to tackle wage discrimination effectively.
References Aigner, D.J. and Cain, G.G. (1977).Statistical Theories of Discrimination in Labor
Markets.Industrial and Labor Relations Review 30(2), 175-187 Bargain, O., Bhaumik, S.K., Chakrabarty, M. and Zhong, Z. (2007).Returns to
Education and Earnings Differences between Chinese and Indian Wage Earners, IZA Discussion Paper.
Becker, G.S. (1957). The Economics of Discrimination. University of Chicago Press, Chicago.
Berndt, E.R. (1994) The Practice of Econometrics Classic and Contemporary.Addison-Wesley Publishing Company, U.S.
Bhandari A. and A. Heshmati (2008). Wage Inequality and Job Insecurity among Permanent and Contract Workers in India: Evidence from Organized Manufacturing Industries.ICFAI Journal of Applied Economics 7(1), 80-111.
Blau, F., Ferber, M. and Winkler, A. (1998).The Economics of Women, Men, and Work. Upper Saddle River, New Jersey: Prentice Hall.
Blinder, A.S. (1973). Wage Discrimination: Reduced Form and Structural Estimates, The Journal of Human Resources 8(4), 436-455.
Boraas, S. and Rodgers, W.M. (2003). How does gender play a role in the earnings gap? An update, Monthly Labor Review 126(10), 9-15.
Cai, F. and Wang, M.Y. (2008). Gender Earnings Differential in Urban China.Review of Development Economic 12(2), 442-454.
Chen,G.F. and Hamori, S. (2008a). An Empirical Analysis of Gender Wage Differentials in Urban China.Kobe University Economic Review 54, 25-34.
Chen, G.F. and Hamori, S. (2008b). Do Chinese Employers Discriminate Against Females When Hiring Employee? Economic Bulletin 10(14), 1-17.
Chi, Wei, Li, Bo, and Yu, Q.M. (2007). Decomposition of Changes in Earnings Inequality in China: A Distributional Approach. MPRA Paper No. 3807.
Cotton, J. (1988). On the Decomposition of Wage Differentials.The Review of Economics and Statistics 70(2), 236-249.
Fang, L.C. (2005). HRM, Work and Employment in China.Routledge, New York, U.S. Goh, C.C., Luo, X.B., and Zhu, N. (2008). Income Growth, Inequality and Poverty
Reduction: A Case Study of Eight Provinces in China.China Economic Review 20, 485-496.
Gunderson, M. (1989).Male-Famel Wage Differentials and Policy Responses.Journal of Economic Literature 27(1), 46-72.
Gustafsson, B. and Shi, L. (2000).Economic transformation and the gender earnings gap in urban China.Journal of Population Economics 13(2), 305-29.
Heckman, J.J. (1979). Sample selection bias as a specification error.Econometrica, 47: 153-161.
19
Heckman, J.J., Lochner, L., and Todd P.E. (2003). Fifty Years of Mincer Earnings Regressions. IZA Discussion Paper 2003:775.
Heshmati A. (2004a). A Review of Decomposition of Income Inequality.IZA Discussion Paper 2004:1221.
Heshmati A. (2004b). Inequalities and their Measurement.IZA Discussion Paper 2004:1219.
Hill, M. (1979). The Wage Effects of Marital Status and Children.Journal of Human Resources 14, 579-594.
Hughes, J. and Maurer-Fazio, M. (2002).Effects of Marriage, Education, and Occupation on the Female/Male Wage Gap in China.Pacific Economic Review 7(1), 137-156.
Jone, F.L. (1983). On Decomposing the Wage Gap: A Critical Comment on Blinder’s Method.The Journal of Human Resources 18(1), 126-130.
Jung, J.H. and Choi, K.S. (2004). Gender Wage Differentials and Discrimination in Korea: Comparison by Knowledge Intensity of Industries.International Economic Journal 18(4), 561-579.
Knight, J., Song, L. and Jia, H.B. (1999). Chinese Rural Migrants in Urban Enterprises: Three Perspectives.Journal of Development Studies 35(3), 75-104.
Li, H.B., Liu, P.W., Ma, N. and Zhang, J.S. (2005). Does Education Pay in Urban China? Estimating Returns to Education Using Twins.Research Paper, Chinese University of HongKong.
Liu, P.W., Xin, M. and Zhang, J. (2000).Sectoral Gender Wage Differentials and Discrimination in the Transitional Chinese Economy.Journal of Population Economics 13(2), 331-352.
Loscocco, K.A. and Wang, X. (1992).Gender Segregation in China.Sociology and Social Research 76(3), 118-126.
Luo, Y. (2008). Discrimination in China’s Urban Labor Market.Doctoral Dissertation, Jilin University.
Macpherson, D. and Hirsch, B. (1995) Wages and Gender Composition: Why Do Women’s Jobs Pay Less? Journal of Labor Economics 13(3), 84-89.
Maurer-Fazio, M., Raw, T. and Zhang, W. (1999). Inequality in the Rewards for Holding up Half the Sky: Gender Wage Gaps in China’s Urban Labor Market. 1988-1994. China Journal 41(1), 55-88.
Meng, X. (1998a). Male-female wage determination and gender wage discrimination in China’s rural industrial sector. Labor Economics 5(56), 67-89.
Meng, X. (1998b). Gender occupational segregation and its impact on the gender wage differential among rural-urban migrants: a Chinese case study.Applied Economics 30(6), 741-752.
Meng, X. and Zhang, J. (2001).The Two-Tier Labor Market in Urban China.Journal of Comparative Economics 29, 485-504.
Mill, J.S. (1885). Principles of Political Economy.The Colonial Press, New York. Neumark, D. (1998). Employers’ Discriminatory Behavior and the Estimation of Wage
20
Discrimination.Journal of the American Statistical Association 93(444), 1365-1375.
Oaxaca, R. (1973). Male-Female Wage Differentials in Urban Labor Markets.International Economic Review 14(3), 693-709.
Reimers, C.W. (1983). Labor Market Discrimination against Hispanic and Black Men.The Review of Economics and Statistics 65(4), 570-579.
Smith, D.M. (2002). Pay and Productivity Differences between Male and Female Veterinarians.Industrial and Labor Relations Review 55(3), 493-511.
Xie, S.S. and Yao, X.G. (2005).Appraisal of the Sexual Discrimination in Wage Earnings of Urban Workers in China.Collection of Women’s Studies 6(68), 10-24.
Xin, M. (1995).Male-female Wage Determination and Gender Wage Discrimination in China’s Rural Industry Sector.Labor Economics 5(1), 67-89.
Waldfogel, J. (1997). The Effect of Children on Women’s Wages.American Sociological Review 62(2), 209-217.
Wang, F. and Zuo, X. (1990). History’s Largest labor flow: understanding China’s rural migration inside China’s cities: Institutional Barriers and Opportunities for Urban Migrants.American Economic Review 89, 570-579.
Wang, M.Y. (2005). Gender Wage Differentials in China’s Urban Labor Market.Economic Research Journal 12(4), 35-44.
Wang, M.Y. and Cai, F. (2006). Gender Wage Differentials in China’s Urban Labor Market.UNU-WIDER, Research Paper No. 146.
Weichselbaumer, D. (2005). A Meta-Analysis of the International Gender Wage Gap.Journal of Economic Surveys 19(3), 479-480.
West, L. and Zhao, Y.H. (2000).Rural Labor Flows in China. Berkeley: University of California Press.
Wolf, M.M. and Petrela, E.Q. (2004).An Examination of Gender Wage Differences among Graduates of the Agribusiness Department, California Polytechnic State University.American Agricultural Economics Association Annual Meeting, Presentation Paper.
Wooldridge, J.M. (2006). Introductory Econometrics: A Modern Approach. South-Western Press, U.S.
Zhang, D.D. (2004). Marketization and Gender Wage Differentials.Chinese Journal of Population Science 1, 32-41.
Zhao, Y. (2000). Rural-to-urban Labor Migration in China: The Past and the Present, Rural Labor Flows in China. Berkeley, University of California Press.
21
Table 1.Economy and Labor Market Indicators for 1980-2009
Indicator Name 1980 1985 1990 1995 2000 2005 2009 GDP per Capita (current US$) 193.02 291.77 314.43 604.23 949.18 1731.13 3748.93 Population (billion) 0.98 1.05 1.14 1.20 1.26 1.30 1.33 Female Labor Participation Rate 71.00 71.60 73.00 72.30 70.90 68.50 67.40 Male Labor Participation Rate 87.50 85.90 85.00 84.90 83.60 80.90 79.70 Total Labor Participation Rate 79.50 79.00 79.20 78.80 77.40 74.80 73.70 Urban Population (% ) 19.60 23.00 27.40 31.40 35.80 40.40 44.00 Employment Composition in Urban Units (%) State-owned Units 76.80 72.70 73.60 73.60 69.80 56.90 51.10 Collective-owned Units 23.20 26.90 25.20 20.60 12.90 7.10 4.90 Other Owner-ship Units 0.00 0.40 1.20 5.80 17.30 36.00 44.00 Data Sources: World Bank and China Labor Statistical Yearbook
22
Table 2.Description of all the variables in the earnings equation
Variables Description LnWage Logarithm of the monthly wage Province P1 Guangzhou; Reference group P2 Takes the value of 1 if Beijing P3 Takes the value of 1 if Shanghai Education Edu1 Junior School or Below; Reference group Attainment Edu2 Takes the value of 1 if one graduates from High School Edu3 Takes the value of 1 if one achieves College Diploma (e.g. professional
training etc.) Edu4 Takes the value of 1 if one achieves Bachelor’s Degree Edu5 Takes the value of 1 if one achieves Master or Ph.D. Degree Occupation Occ.1 Low-wage worker in service industry (e.g waiter, babysitter, gate-man etc.);
Reference group Occ.2 Take the value of 1 if one is a staff (e.g. secretary, office staff etc.) Occ.3 Take the value of 1 if one is a Low-skilled Worker (e.g. worker in
construction site or factory etc.) Occ.4 Take the value of 1 if one is a High-skilled Worker (e.g. driver, Repairer,
Technician, Mechanic etc.) Occ.5 Take the value of 1 if one is a Junior professional (e.g. Junior manager,
Teacher, Accountant etc.) Occ.6 Take the value of 1 if one is a Senior professional (e.g. Professor, Doctor,
Manager, etc.) EX Experience of working, calculated as Age-Year of education-6 EXSQ Experience*Experience HuKou Take the value of 1 if urban, zero if rural Married Take the value of 1 if married Children Take the value of 1 if with child Female Take the value of 1 if male
23
Table 3.Means and Categorical Distribution of observations’ characteristics