Page 1
145 Jurnal Ekonomi Malaysia 51(2), 2017 145-157
Analysis of Glass Ceiling and Sticky Floor Effects for Gender Wage Gap in
Malaysian Labour Market
(Analisis Kesan Kekangan Di Atas dan Kesan Kekangan Di Bawah bagi Jurang
Upah Jantina dalam Pasaran Buruh di Malaysia)
RAHMAH ISMAIL
CHUNG-KHAIN WYE
NUR SABRINA MOHD PALEL
Universiti Kebangsaan Malaysia
ABSTRACT
Most past studies of gender wage differentials estimate wage models using the entire sample for different gender
groups. The estimated coefficients are then used in wage decomposition formula to identify the contribution of
variables to the wage gap. However, quantile regression is preferred nowadays as it allows the regressors to be
associated with the shape of wage distribution, whereby the glass ceiling and sticky floor effects can be identified.
This paper attempts to examine the extent to which the glass ceiling and sticky floor effects exist across wage
distribution in the Malaysian labour market. The analysis is based on 1263 workers data in the services and
manufacturing sectors surveyed in 2015. The results demonstrate that the gender wage gaps are larger towards
the lowest wage distribution, a finding that is consistent with the existence of sticky floor effect. Besides, the gender
earnings gap is lower between 25th and 50th percentiles, but increases at the 75th percentile and reaches the highest
at the 90th percentile reflecting the existence of glass ceiling effect.
Keywords: Glass ceiling; sticky floor; gender wage gap; wage distribution; quantile regression.
ABSTRAK
Kebanyakan kajian lepas tentang perbezaan upah jantina menganggar model upah dengan menggunakan
keseluruhan sampel bagi jantina yang berbeza. Nilai koefisien yang dianggar ini kemudiannya digunakan dalam
formula penguraian upah bagi mengenalpasti sumbangan pemboleh ubah terhadap perbezaan upah. Walau
bagaimanapun, kini kaedah regresi kuantil lebih diutamakan kerana penganggar-penganggarnya diukur
mengikut bentuk agihan upah, di mana kesan kekangan di atas dan kesan kekangan di bawah dapat dikenalpasti.
Kajian ini bertujuan untuk mengenalpasti tahap kewujudan kesan kekangan di atas dan kesan kekangan di bawah
merentasi agihan upah dalam pasaran buruh di Malaysia. Analisis dilakukan berdasarkan kepada data 1263
pekerja dalam sektor perkhidmatan dan sektor pembuatan yang telah dikutip pada 2015. Kajian mendapati
bahawa jurang upah jantina adalah lebih besar di bahagian terbawah agihan upah, dan ianya selari dengan
kewujudan kesan kekangan di bawah. Selain itu, jurang upah jantina adalah lebih kecil di antara persentil ke-25
dan ke-50, tetapi meningkat pada persentil ke-75 dan seterusnya mencapai tahap tertinggi pada persentil ke-90
yang menggambarkan kewujudan kesan kekangan di atas.
Kata Kunci : Kekangan di atas; kekangan di bawah; jurang upah jantina; agihan upah; regresi kuantil.
INTRODUCTION
Over the last few decades, rapid economic transition has led to an increase in the participation of women in
economic activity. This phenomenon also gives significant impact on the labour market as both men and women
have an equal opportunity to enter the labour market. Although the ability and the participation of women are
acknowledged, the issues of gender wage gap still remain to be of interest among scholars all around the world.
To analyse the issue of gender wage differentials, one should employ the approach from the perspective of income
distribution since the disadvantaged women may be largely crowded into the lower quantile of income distribution
due to their greater role in performing household responsibility, and their association with the workplace at which
they are segregated into lower-pay occupation following job market discrimination. On the same ground of
Page 2
146 Jurnal Ekonomi Malaysia 51(2), 2017 145-157
reasoning, female workers may be granted the access to high-pay occupational category following their increasing
level of educational attainment, and the declining discrimination effect practised on them when they manage to
secure a stereotypically female-suited job dominated by females. Such a speculation renders rationale for
analysing gender wage gap along income distribution. Meanwhile, Smith (2012) examined a wide range of
theories about glass ceilings and found that the the majority of explanations for glass ceilings cite stereotypes and
discrimination against women. Quantile regression allows researchers to examine the gender wage gap across the
wage distribution and hence, the wage gap could be analysed at selected points of the conditional wage
distribution. The gender wage gap shows a glass ceiling effect and sticky floor effect in different countries with
different economic systems, occupations and enterprise ownership. For example, Newell and Reilly (2001)
discovered that the gender pay gap has risen across the wage distribution in former communist countries of Eastern
Europe and the Soviet Union. Similarly, Albrecht et al. (2003) showed that in Sweden, the gender wage gap
increased across the wage distribution and was larger in the upper tail of the distribution. This can be explained
as the glass ceiling effect. Machado and Mata (2001) found that the gender wage gap was wider for high-paid jobs
in the Portugese labour market. Albrecht et al. (2003) showed that strong glass ceiling effect existed in the Swedish
labour market. Hiau (2006) compared the gender wage gap within public and private sectors in Australia and he
detected strong glass ceiling effect only in the private sector. Besides that, Arulampalam et al. (2007) also found
that for most countries in Europe, glass ceiling effect was more prevalent than sticky floors in explaining the
gender wage gap.
In the developing countries, there are studies that deal with the gender wage gap and find mixed results.
For example, Hyder and Reily (2005) found that in the Pakistan labour market the private sector had a larger
gender wage gap than the public sector. Meanwhile, study in Sri Lanka by Gunawardena (2006) showed the
existence of a sticky floor effect in both private and public sectors. This finding is supported by a study by Sabir
and Aftab (2007) showing the existence of sticky floor effect in the Pakistan labour market, whereby the gender
wage gaps were observed at the lower wage distribution. Other studies also provide evidence of sticky floor effect
in their respected countries, such as Sakellariou (2004), Gunawardena (2006) and Fang and Sakellariou (2011)
for Singapore, Sri Lanka and Thailand, respectively.
In Malaysia, statistics from the Ministry of Human Resources [MOHR] (2016) show that the proportions
of females (i.e. 27.2 percent) employed in the high-pay skilled occupational category as managers, professionals,
technicians and associate professionals, are slightly higher than that of the males (i.e. 24.4 percent). This scenario
is somewhat consistent with the females’ outperformance in terms of highest educational qualification attainment
over the males. There are 34.4 percent of female workers who have possessed at least the STPM or A-level
equivalence certificates, while only 22.6 percent of male workers have possessed these qualifications.
However, higher proportions of female (i.e. 46.1 percent) have also been crowded into the lower-pay
semi-skilled occupational category as clerical support workers, and service and sales workers, compared to only
22.5 percent of males holding these positions. This scenario is somewhat inconsistent with females’ educational
outperformance over the males, and it gives rise to the concern if females had been adequately rewarded according
to their educational attainment. Perhaps, it is the females’ choice for entering these jobs since they are mainly
feminine in nature and more female-suited. In a nutshell, whether the over representation of female (male) workers
in the female (male)-dominated feminine (masculine) jobs in Malaysia is a matter of personal choice or job market
discrimination, it is certainly explicit that gender occupational segregation does exist in Malaysian labour market.
This scenario may create anxiety over the possibility of inflicting gender wage differentials.
The existence of sticky floor or glass ceiling phenomenon may affect income distribution as a whole. For
example, female workers in Malaysia are still unfairly treated, causing them to earn less than their male
counterparts. Salaries and wages survey report from the Department of Statistics [DOS] (2016) further shows that
the mean monthly salaries in 2015 for male workers (i.e. MYR2,345) are still higher than female workers (i.e.
MYR2,254), despite the fact that higher annual growth rate in salaries is registered among the females (i.e. 5.9%)
than it is among the males (i.e. 4.9%). The gender wage gap may influence income inequality in Malaysia which
shows an unstable trend. For example, the Gini coefficient fluctuated between 1970 and 2014. Even though
Malaysia experienced a drop in Gini coefficient from 0.513 in 1970 to 0.401 in 2014, it is still considered high.
In Malaysia many previous studies prove that women consistently earn less than men (see Chua 1984;
Chapman & Harding 1986; Lee & Nagaraj 1995; Low & Goy 2006 & Fernandez 2006; Rahmah & Idris 2012).
However, these studies adopt wage decomposition method in looking at determinants of gender wage differentials
including discrimination. Studies looking at the gender wage gap using quantile regression are rarely found in
Malaysia, with the exception for Wan Liyana et al. (2016). Their findings show the existence of the sticky floor
and glass ceiling effects in the Malaysian labour market. However, their analysis was based on the labour market
scenario in 2009 and 2012 before the compliance with the Minimum Wages Order 2012 was officially made
legitimate starting from Jan 1, 2014. Gender wage gap could have been narrowed since then. Therefore, this study
tries to fill up the gap in the literature by looking at gender wage ga using quantile regression based on the labour
market outcomes in 2015.
Page 3
147 Jurnal Ekonomi Malaysia 51(2), 2017 145-157
This paper attempts to analyse the extent to which the gender wage differentials exists in Malaysia and
the extent to which the sticky floor and glass ceiling effects influence the differences. The paper is organised into
five sections. The next section discusses the literature review followed by the methodology in the subsequent
section. The last two sections include the discussion on the results and the conclusion.
LITERATURE REVIEW
Basically, Becker (1971) taste of discrimination and Mincer (1974) human capital model have been used as
benchmark for researchers to study the gender wage differentials. Most of the past studies used Ordinary Least
Square (OLS) procedure to run regression models to analyse the gap. However, recent development on these
issues have used quantile regression approach developed by Koenker and Bassett (1978). Following these studies,
it is noticed that an enormous number of literature has adopted quantile regression methodology and extended the
discussion of the glass ceiling and sticky floor effects for various countries. For instance, studies by Buchinsky
(1998, 2001) have proven the relevance and appropriateness of using the quantile regression method to study
various issues of the labour market in the United States. Meanwhile, de la Rica et al. (2008) also found the
occurrence of sticky floor effect in the less educated group, while the glass ceiling effect was more prevalent at
tertiary education level. This is consistent with the wage distribution whereby the less educated workers are more
likely to be at the lower wage distribution and the more educated group will be earning at the upper wage
distribution. Beside the cross section studies, there have been studies that investigate the wage distribution across
time. Amongst those studies are Nestic (2007) and Chi and Li (2008). Based on 1987, 1996 and 2004 data, it has
been shown that the gender pay gap in Chinese labour market has increased along the wage distribution over time
and the increase was greater at the lower quantiles, reflecting the sticky floor effect (Chi & Li 2008).
Fang and Sakellariou (2015) investigated the pattern of gender wage differentials in Asian and Latin
American countries. They found that in Latin American countries glass ceilings are prevalent, but no clear
evidence of glass ceilings has been found in the group of Asian countries where, generally, sticky floors or a
mixed pattern are the norm. The findings are robust with as well as without occupation controls. In addition,
analysis by sector points to glass ceilings in the public sector in most countries, while in the private sector the
patterns vary. A study in a less developed country was conducted by Thundrayan and Pydayya (2015) in the
Mauritian labour market. The results revealed that sticky floors were more pronounced than glass ceilings over
the years 2006-2013. Further, for the years 2008, 2010 and 2012, it is noted that at the 75th quantiles, the gender
wage differentials started to rise showing glass ceiling effects.
Based on the responses from working women in different industries of Riyadh, Saudi Arabia,
Abdulrahman (2016) examined if organisational injustice and work/life balance issues considerably affect career
advancement among women in the form of glass ceiling effect. Besides, he also studied if both organisational
injustice and work/life balance issues lead to an increase in the turnover intention among women due to managerial
pressure for the specific job tasks in the form of glass cliff. The results of binary-logit regression for glass cliff
effect confirmed that work/life balance issues, marital status, women job experience, and income are the main
contributing factors that affect career advancement among women.
In the Malaysian context, the existing literature about the gender earnings differentials are quite limited.
A pioneer study examining this issue is by Chua (1984) in which the findings suggested the existence of
discrimination against Malay and non-Malay female workers in rural areas. However, Chapman and Harding
(1985) failed to investigate the existence of discrimination within the gender wage gap, although they found that
women earned considerably less than men due to differences in skills, causing women to be usually employed in
low-paying occupations. Other studies which found the existence of discrimination are Lee and Nagaraj (1995),
Latifah (1998, 2000), Rahmah and Idris (2012), and Seshan (2013). On the contrary, Rahmah and Zulridah (2005)
concluded that, instead of discrimination, demographic factors and human capital variables were the main causes
of gender wage differentials in the manufacturing sector in Malaysia. In the case of Malaysia, Nagaraj et al. (2002)
reported that the full-time employed male workers earned 1.3 times higher than their female counterparts.
The existence of glass ceiling effect and sticky floor effect in Malaysia has also been debated among
researchers. However, most of the studies provide evidence from the management perspective only. For example,
Norma et al. (1991), Koshal et al. (1998), Zubaidah et al. (2009), and Dimovski et al. (2010) concluded that
women managers in Malaysia experienced glass ceiling effect in their working environment as they faced
difficulties to be promoted to the upper level. They also concluded that, gender discrimination, lack of recognition,
insufficient organisational support (networking and mentoring) and limited opportunities were the major
determinants which triggered the glass ceiling effect. Subsequently, Wan Liyana et al. (2016) also found both
glass ceiling and sticky floor effects in the Malaysian labour market. However, the impact of sticky floor was said
to be greater than the glass ceiling. In addition, Sieh and Ong (1995) stated that quality differences between men
and women should be fairly recognised to increase the organisation productivity and they also concluded that
organisational supports were indeed important for women to advance themselves towards higher positions.
Page 4
148 Jurnal Ekonomi Malaysia 51(2), 2017 145-157
METHODOLOGY
In achieving the objective of this paper, two underlying theoretical frameworks are employed; statistical
discrimination theory (Phelps 1972; Arrow 1973) and taste-based discrimination theory (Becker 1971). The
statistical discrimination theory postulates that employers are unable to observe workers’ real productivity due to
insufficient information. Hence, they are paid according to the conditional expectation on certain observable
characteristics, such as gender, race and so on. It depicts that, regardless of men and women, they experience
similar distribution of productive characteristics. Nonetheless, skilled men would earn more than identically
skilled women due to discrimination.
On the other hand, taste-based discrimination signifies the employer’s distaste for the minority workers,
causing them to receive lower wage for an equivalent productivity (Becker 1971). Therefore, the greater the
employers’ distaste for female workers, the wider will be the wage gap. This could lead to prejudice to exist during
hiring process and promotion procedures (Baron & Cobb-Clark 2011; Booth et al. 2003). Sticky floor exists at the
hiring process when women receive relatively low starting wage as compared to men. It is defined as a situation
where women workers remain at the low-level positions without adequate wages (Nestic 2007). On the other hand,
the glass ceiling occurs at the promotion procedures whereby men are likely to secure a high-paid job as compared
to women (Fang 2012). Both situations are related to discrimination theory.
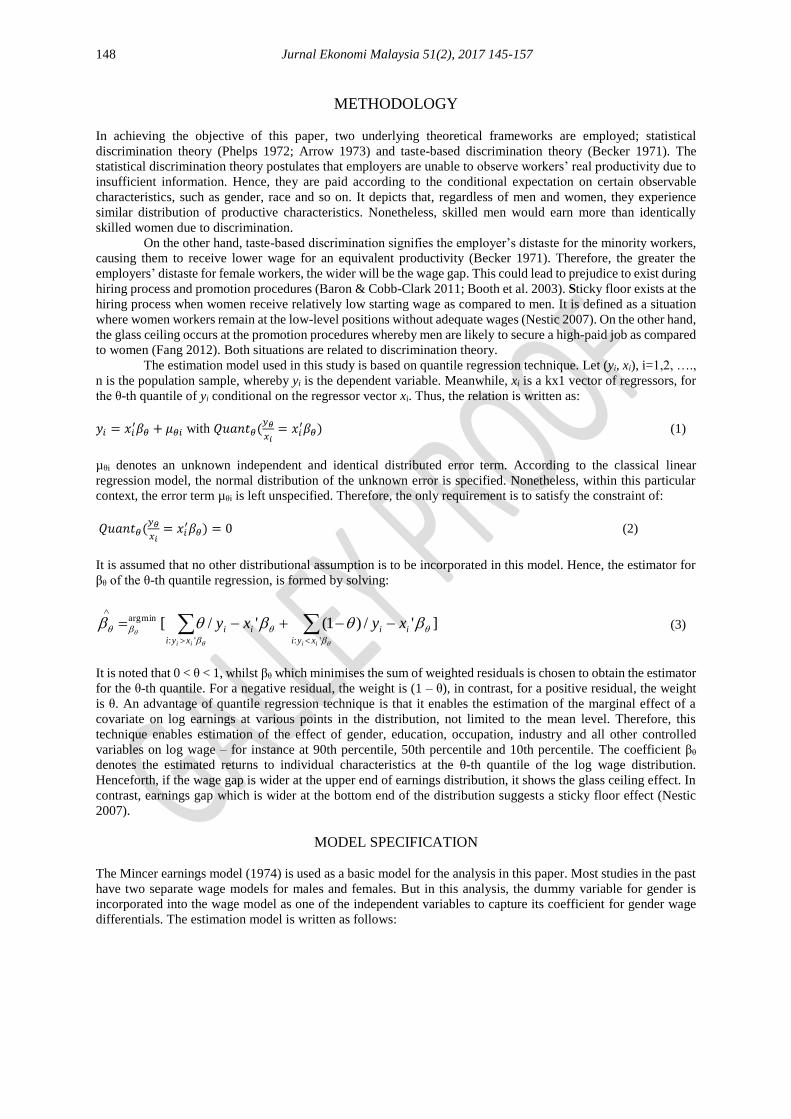
The estimation model used in this study is based on quantile regression technique. Let (yi, xi), i=1,2, ….,
n is the population sample, whereby yi is the dependent variable. Meanwhile, xi is a kx1 vector of regressors, for
the θ-th quantile of yi conditional on the regressor vector xi. Thus, the relation is written as:
𝑦𝑖 = 𝑥𝑖′𝛽𝜃 + 𝜇𝜃𝑖 with 𝑄𝑢𝑎𝑛𝑡𝜃(
𝑦𝜃
𝑥𝑖= 𝑥𝑖
′𝛽𝜃) (1)
µθi denotes an unknown independent and identical distributed error term. According to the classical linear
regression model, the normal distribution of the unknown error is specified. Nonetheless, within this particular
context, the error term µθi is left unspecified. Therefore, the only requirement is to satisfy the constraint of:
𝑄𝑢𝑎𝑛𝑡𝜃(𝑦𝜃
𝑥𝑖= 𝑥𝑖
′𝛽𝜃) = 0 (2)
It is assumed that no other distributional assumption is to be incorporated in this model. Hence, the estimator for
βθ of the θ-th quantile regression, is formed by solving:
':':
minarg ]'/)1('/[iiii xyi
ii
xyi
ii xyxy (3)
It is noted that 0 < θ < 1, whilst βθ which minimises the sum of weighted residuals is chosen to obtain the estimator
for the θ-th quantile. For a negative residual, the weight is (1 – θ), in contrast, for a positive residual, the weight
is θ. An advantage of quantile regression technique is that it enables the estimation of the marginal effect of a
covariate on log earnings at various points in the distribution, not limited to the mean level. Therefore, this
technique enables estimation of the effect of gender, education, occupation, industry and all other controlled
variables on log wage – for instance at 90th percentile, 50th percentile and 10th percentile. The coefficient βθ
denotes the estimated returns to individual characteristics at the θ-th quantile of the log wage distribution.
Henceforth, if the wage gap is wider at the upper end of earnings distribution, it shows the glass ceiling effect. In
contrast, earnings gap which is wider at the bottom end of the distribution suggests a sticky floor effect (Nestic
2007).
MODEL SPECIFICATION
The Mincer earnings model (1974) is used as a basic model for the analysis in this paper. Most studies in the past
have two separate wage models for males and females. But in this analysis, the dummy variable for gender is
incorporated into the wage model as one of the independent variables to capture its coefficient for gender wage
differentials. The estimation model is written as follows:
Page 5
149 Jurnal Ekonomi Malaysia 51(2), 2017 145-157
iiiii
iiiii
iiiiiiiii
PPKLPRKPHG
MELJORSELMRKTRNMANTRAN
TECHTRNGENSECJMJSEXPEXPEDUW
17161514
131211109
87654
2
3210ln
(4)
Where lnW is logarithm of monthly wage rate, EDU is years of schooling, EXP is years of working experience,
EXP2 is years of working experience squared, JS is the dummy variable for job status (permenant=1, contract=0),
JM is the dummy variable for job mode (full-time=1, part time=0), SEC is the dummy variable for sector
(service=1, manufacturing=0), GEN is the dummy variable for gender (males=1, females=0), TECHTRN is the
dummy variable for technical training attendance (attended technical training=1, otherwise=0), MANTRN is the
dummy variable for management training attendance (attended management training=1, otherwise=0), MRKTRN
is the dummy variable for marketing training attendance (attended marketing training=1, otherwise=0). In this
study otherwise training is production training and other kinds of training. SEL is the dummy variable for Selangor
state (Selangor=1, otherwise=0), JOR is the dummy variable for Johor state (Johor=1, otherwise=0), MEL is the
dummy variable for Melaka state (Melaka=1, otherwise=0), PHG is the dummy variable for Pahang state
(Pahang=1, otherwise=0), PRK is the dummy variable for Perak state (Perak=1, otherwise=0), KL is the dummy
variable for Federal Territory of Kuala Lumpur (Federal Territory of Kuala Lumpur=1, otherwise=0), PP is
dummy variable for Penang state (Penang=1, otherwise=0). In this study the otherwise state is Terengganu. i is
the ith individual.
SOURCE OF DATA
The analysis in this paper is based on the data obtained from a field survey using a set of structured questionnaire.
In choosing the minimum sample size, method introduced by Israel (1992) was utilised. The information on the
sampling frame was provided by the Labour Force Survey Report, Department of Statistics Malaysia, 2013. The
respondents were chosen using proportionate stratified sampling technique. The study covers eight states in
Peninsular Malaysia; North (Penang and Perak), East (Pahang and Terengganu), West (Selangor, Federal Territory
of Kuala Lumpur and Melaka) and South (Johor). The reasons for choosing these states are based on the notion
where their households percapita income are quite similar that they represent variations in four zones, which is
commonly used in other studies in Malaysia. The study covers only two sectors – services and manufacturing
sectors. These sectors are chosen based on their high contribution towards generating Malaysian national income
and creating employment. Only five prominent services subsectors were chosen, which are education, information
and communication technology (ICT), tourism, finance and health. The sample covers 612 workers in the services
sector, which comprise of 116 in education, 124 in health, 108 in finance, 78 in ICT and 186 in tourism; while
651 workers were sourced from the manufacturing sector. Data collection was carried out from February to June
2015 with the help of enumerators. A pilot test on 20 respondents in Selangor and Federal Territory of Kuala
Lumpur was performed to test the validity of instrument used in the study. Based on the results of reliability test,
the Cronbach’s Alpha for all constructs are at least 0.7, which reflect that instruments used in the questionnaire
have high value of reliability and are fit to be used in the study.
RESULTS
PROFILE OF RESPONDENTS
Table 1 presents profile of respondents. The distribution of respondents by gender is almost the same and majority
of them have tertiary level of education. The state of Selangor consists of the highest percentage of respondents,
followed by Johor, Perak and Pulau Pinang. Even though respondents with tertiary level of education are at highest
percentage, majority of them receive monthly wage of less than RM3000. Less than 20 percent receive more than
RM3000 per month. Therefore by definition, most of them receive wage level resembling that earned by the
bottom 40 percent (B40) household in Malaysia (B40 household earns RM3800 and below according to EPU,
2014). This scenario may be associated with their lacking in working experience, where half of them have working
experience of less than 5 years. Most of them work as permanent and full-time workers and about 51 percent are
in the manufacturing sector. The management and technical trainings are shown to be more frequently attended
by the respondents compared to the production and marketing trainings.
Page 6
150 Jurnal Ekonomi Malaysia 51(2), 2017 145-157
TABLE 1. Profile of Respondent
Profile Frequency Percent(%)
Gender
Male
Female
Jumlah
570
693
1263
45.1
54.9
100.0
Level education
Primary
Secondary
Tertiary
Total
11
412
837
1263
1.1
32.6
66.3
100.0
State
Selangor
Pulau Pinang
Johor
Federal Territory of Kuala Lumpur
Perak
Terengganu
Melaka
Pahang
Total
335
164
278
54
208
42
118
64
1263
26.5
13.0
22.0
4.3
16.5
3.3
9.3
5.1
100.0
Monthly salary
1000 ke bawah
1001 – 2000
2001 – 3000
3001 – 4000
4001 – 5000
5001 – 6000
6000 an above
Total
244
562
238
98
54
19
48
1263
19.3
44.5
18.8
7.8
4.3
1.5
3.8
100.0
Work experience
< 5 years
6 – 10 years
11 – 15 years
16 – 20 years
21 – 25 years
26 – 30 years
31 – 35 years
35 years an above
Total
628
323
143
84
44
21
12
9
1263
49.7
25.6
11.3
6.6
3.5
1.7
0.9
0.7
100
Job status
Permanent
Contract
Total
1094
169
1263
86.6
13.4
100
Job Mode
Full time
Partime
Total
1216
47
1263
96.3
3.7
100
Sector
Services :
Education
Communication
Health
Finance
Tourism
Manufacturing
Total
116
78
124
108
186
651
1263
9.2
6.2
9.8
8.6
14.7
51.5
100
Attended Training*
Technical
Production
Marketing
Management
Total
351
72
159
365
947
37.1
7.6
16.8
38.5
100
Source: Field Survey 2015
Note:* the total represents number of respondents who had ever attended training and types of training is the first training
attended.
Page 7
151 Jurnal Ekonomi Malaysia 51(2), 2017 145-157
It has always been perceived that wage received by workers is closely associated with their level of
education and occupational categories, which is supported by the human capital theory (Shultz, 1963; Becker,
1964). Thus, wage distribution by these two characteristics is worth studied. In Table 2, it is shown that the
percentage of females with tertiary level of education is slightly higher than the males. In contrast, the percentages
of females with secondary and primary level of education are lower than the males. In Table 3, the percentage of
females holding the managerial and professional jobs is also higher than the males. However, the percentage is
lower at the technical and supervisory jobs for females. Based on these two tables, we do perceive that the females
will receive higher wages than the males. However, our data shows that, on average, males receive higher monthly
wage compared to females (RM2,495 compared to RM 2,347). This implies the existence of discrimination in the
wage paid.
TABLE 2. Education Attainment by Gender
Level of
Education
Gender
Male Female
Primary 25
(4.4)
21
(3.0)
Secondary 238
(41.9)
267
(38.4)
Tertiary 305
(53.7)
407
(58.6)
Total 568
(100.0)
695
(100.0)
Source: Field Survey 2015
TABLE 3. Occupational Category by Gender
Occupational Category Gender
Male Female
Manager
And Professional
151
(26.6)
222
(31.9)
Technical And
Supervisory
265
(46.7)
191
(27.6)
Clerical
Support Workers
99
(17.4)
197
(28.3)
Service And
Sales Workers
53
(9.3)
85
(12.2)
Total 568
(100.0)
695
(100.0)
Source: Field Survey 2015
Note: Job category based on Malaysia Standard Classification on Occupation, MSCO 2008
Table 4 shows descriptive statistics of the variables used in the model. On average, the respondents have
13.6 years of schooling and 7 years of working experience. About 87 percent of the respondents are permanent
workers and 96 percent work as full timer. About 48 percent are involved in the services sector and the remaining
52 percent are in the manufacturing sector. About 45 percent of them are males and 55 percent are females.
Majority of the respondents (75 percent) had attended training that consists of various types, such as technical,
production, marketing and management. About 26.6 percent of the respondents reside in Selangor, 22 percent in
Johor, 9.6 percent in Melaka, 4.8 percent in Pahang, 16.5 percent in Perak, 4.2 percent in Wilayah Persekutuan
Kuala Lumpur and 13.0 percent in Penang, the remaining 3.3 percent live in Terengganu.
Page 8
152 Jurnal Ekonomi Malaysia 51(2), 2017 145-157
TABLE 4. Descriptive Statistic
Variable N Mean Std. Deviation
Sch 1263 13.591 2.477
Exp 1263 7.997 7.151
Exp2 1263 115.050 215.315
JS 1263 0.867 0.340
JM 1263 0.964 0.185
Sec 1263 0.484 0.500
Gen 1263 0.450 0.498
TechTran 1263 0.370 0.483
MarkTran 1263 0.168 0.374
MangTran 1263 0.385 0.486
SEL 1263 0.266 0.442
JOR 1263 0.220 0.414
MEL 1263 0.096 0.294
PHG 1263 0.048 0.214
PRK 1263 0.165 0.371
KL 1263 0.042 0.200
PP 1263 0.130 0.336
lnW 1263 7.540 0.600
Source: Field Survey 2015
ESTIMATION RESULTS
Table 5 presents the estimation results. As a benchmark for our quantile regression results, an OLS estimation has
also been presented. The effects of all covariates on wage distribution are assumed to have only location shifts
when the wage model is estimated using OLS, while quantile regression assumes location shifts as well as the
change in scale and shape of the conditional wage distribution (Liew & Zulridah 2015). The Pseudo R2 are around
0.235 to 0.388 for the quantile regression estimation and 0.533 for the OLS estimation, which imply a good fit for
the cross section data. The values of Variance Inflation Factor (VIF) test are less than 10 which indicate the non-
existence of multicolinearity problem. The White-test is used to check for heteroscedasticity problem. The
statistically insignificant Chi-square implies non-existence of heteroscedasticity problem.
OLS ESTIMATIONS
The second column of Table 5 reports the least-squares estimates of monthly wage. We find that all variables
except job status are significant at 1% and 5% significance levels. The OLS estimations show that years of
schooling affects the monthly wages positively and significantly. This reflects that an increase in years of
schooling, ceteris paribus, will increase monthly wages for about 14.9 percent. Years of working experience is
also a significant determinant for monthly wage but the monthly wage will increase at a decreasing rate as shown
by the negative sign of experience squared, Exp2.
Page 9
153 Jurnal Ekonomi Malaysia 51(2), 2017 145-157
TABLE 5. Result for OLS and Quantiles Regression Estimates
Variable OLS Estimates VIF
test
Quantiles Regression Estimates
0.1 0.25 0.5 0.75 0.9
Constant 4.509
(36.84)***
4.632
(35.51)***
4.548
(56.54)***
4.767
( 46.01 )***
4.674
(34.81)***
5.108
(18.04)***
EDU 0.139
(24.87)***
1.44 0.098
(16.13)***
0.122
(30.90)***
0.139
(29.37 )***
0.151
(23.76)***
0.147
(10.31)***
EXP 0.047
(10.12)***
8.15 0.037
(6.07)***
0.037
(11.30)***
0.038
(7.78)***
0.054
(11.23)***
0.067
(6.27)***
EXP2 -0.0056
(-3.64)***
8.18 -0.0004
(-2.69)***
-0.0004
(-4.06)***
-0.00027
(-1.74)*
-0.0006
(-3.93)***
-0.0009
(-2.62)**
JS 0.042
(1.12)
1.19 0.003
(0.01)
0.023
(0.85)
0.096
(2.54)***
0.094
(2.46)**
0-0.031
(-0.41)
JM 0.356
(5.34)***
1.13 0.327
( 3.72)***
0.296
(6.13)***
0.225
(3.31)***
0.233
(3.47)***
0.232
(1.98)**
SEC 0.079
(2.95)***
1.41 0.001
( 0.01 )
0.056
(2.89)***
0.111
(4.02)***
0.140
(4.76)***
0.157
(2.67)***
GEN 0.102
(4.16)***
1.12 0.127
(3.86)***
0.103
(5.65)***
0.078
(3.10)***
0.094
(3.60)***
0.133
(2.55)**
TECHTRAN 0.058
(2.29)**
1.13 0.063
(1.78)*
0.078
(4.11)***
0.065
(2.52)***
0.051
(1.90)*
0.010
(1.87)*
MANGTRAN 0.094
(3.53)***
1.25 0.065
(1.95)**
0.102
(5.06)***
0.120
(4.41)***
0.093
(3.32)***
0.135
(2.30)**
MARKTRAN 0.092
(2.82)**
1.12 0.021
(0.54)
0.062
(2.58)**
0.067
(2.00)**
0.110
(3.01)***
0.070
(0.99)
SEL 0.363
(5.19)***
7.16 0.551
( 6.20)***
0.456
(8.99)***
0.163
(2.28)***
0.267
(3.56)***
0.091
(0.64)***
JOR 0.190
(2.63)***
6.43 0.454
(4.94)***
0.349
(6.70)***
0.025
(0.35)
0.052
(0.70)
-0.120
(-0.82)
MEL 0.514
(6.54)***
4.01 0.394
(3.85)***
0.418
(7.24)***
0.265
(3.30)***
0.470
(5.61)***
0.727
(4.48)***
PHG 0.501
(5.87)***
2.51 0.568
(5.00)***
0.529
(8.46)***
0.327
(3.75)***
0.433
(4.93)***
0.333
(2.06**
PRK 0.130
(1.81)**
5.35 0.282
(2.99)***
0.179
(3.32)***
-0.067
(-0.92)
0.062
(0.83)
-0.010
(-0.07)
KL 0.325
(3.75)***
2.27 0.627
(5.99)***
0.432
(6.71)***
0.121
(1.36)
0.101
(1.13)
-0.026
(-0.14)
PP 0.302
(4.11)***
4.58 0.588
(6.11)***
0.466
(8.58)***
0.151
(2.02)**
0.150
(1.92)**
-0.016
(-0.11)
R2 0.5330
Pseudo R2 0.235 0.326 0.376 0.388 0.380
Heteroscedasti
city White test
43.80011
Prob. Chi-
Square
0.6455
N 1263 1263 1263 1263 1263 1263
Note: ***, **, and * denotes significance at 1% , 5%, and 10% level. Upper value is the coefficient value, while the value in
bracket is the t-statistics.
Interpretation of the coefficients takes the exponential values of coefficients since the model is in semilog. The formula used
is written as (𝑒𝛽 − 1)100 where β is the coefficient.
Comparing between two categories of job mode, it is noticed that a full-time worker receives higher
wages than a part-time worker. Analysis by job sectors shows that the wages of workers in services sector, i.e,
education, communication, health, finance and tourism, are significantly higher compared to the manufacturing
sector. Moreover, the significance of the coefficient for gender dummy also shows that monthly wages of male
workers are always higher than female workers by 10.7 percent. This finding gives view that wage discrimination
against female workers may exist in Malaysia. On the other hand, workers who attended technical training,
management training and marketing training seem to receive higher wages for about 6.0 percent, 9.8 percent and
9.6 percent respectively compared to workers who attended production training and others. This reflects that
production training is a less important determinant of workers wage. However, the insignificant coefficient for
job mode indicates that, regardless of whether the job is permanent or contract, it simply does not significantly
affect the monthly wages received by the workers. Furthermore, the results also show that workers in Terengganu
receive a significantly lower wage compared to those who work in other states covered under study.
Page 10
154 Jurnal Ekonomi Malaysia 51(2), 2017 145-157
Although most of the estimated coefficients are highly significant following the expected signs, the
results only provide an estimate of the monthly wage at the mean value which may not be representative of the
entire distribution. Hence, quantile regression is more appropriate in analysing the conditional distribution of the
dependent variable and therefore, further information about the wage equation in all different levels of wage
groups can be determined.
QUANTILE REGRESSION ESTIMATIONS
Table 5 also presents the regression estimates for five different quantiles, which are 0.10, 0.25, 0.50, 0.75 and
0.90, of the monthly wage distributions. As stated earlier, the purpose of this study is to investigate gender wage
gap across the conditional wage distribution. From Table 5, we can observe that the coefficients for gender
variable are significant across the distribution, which show that the male workers receive a higher wage than
female workers. In other word, female workers are at the disadvantaged position as compared to their male
counterpart across the five quantiles. The results also show that male workers in the lower income group (0.10)
receive 13.5 percent higher wages than the female workers. The gender wage gap are larger at the lowest quantile
and at the highest quantile of wage distribution compared to the middle quantiles. In other word, there exists the
sticky floor and glass ceiling effects. In fact, the glass ceiling effect is slightly higher than the sticky floor effect.
Our findings are consistent with Wan Liyana et al. (2016), who also found the existence of sticky floor
and glass celing effects in the Malaysian labour market in 2009 and 2012. Concurrently, the wage gap seems to
be decreasing starting from 0.25 to 0.5 quantile. This could be due to lower extent of discrimination occurred at
the middle level of education, while workers are facing quite similar job characteristics. Nevertheless, the gender
wage gap starts to increase from the 0.75 quantile and reaches its highest at the 0.9 quantile. This may be due to
different treatment by gender at the upper level of skills and level of education. For example, females are less
preferred to be promoted or holding higher level posts. Subsequently, this also could be due to a large wage
increase when males have been promoted.
On the whole, all the variables seem to have significant impact on determining wage level across the
distribution, which is also consistent with the OLS results obtained earlier. However, job status is not considered
as an important factor in determining the wage except for the middle quantiles of 0.5 and 0.75 whereby workers
who work as permanent staff receive higher wage than those who work on contract basis. Meanwhile, for job
mode, the full-time workers receive higher wages at each quantile compared to part-time workers. Workers in the
services sector receive a higher wage than workers in manufacturing sectors except for the lowest quantile.
Workers who attended technical training, management training and marketing training also receive a higher wage
compared to those who attended production training and others. Furthermore, analysis by states shows that for the
lower quantiles of 0.1 and 0.25, all states pay their workers a significantly higher wage than Terengganu. However,
for the other wage quantiles, the wage effect of states are rather mixed and some of them are not significant. For
example, for 0.5 and 0.75 quantiles, workers in Johor, Kuala Lumpur and Perak do not receive a significantly
different wage compared to workers in Terengganu. For the highest quantile, most states do not pay a significantly
higher wage than Terengganu except for Melaka, Pahang and Selangor. These results imply that wages received
by workers do not depend on the status of the states – whether they are less developed or more developed. Rather,
they depend on competition in getting jobs in line with the supply and demand factors for each job characteristics
in each wage distribution.
CONCLUSION
Findings in this paper show that gender wage gap does exist in the Malaysian labour market as males receive
higher monthly wage compared to females. Analysis by wage quantile supports the OLS estimation and signifies
that the wage gap occurs more obviously at the lower and upper quantiles compared to the middle quantiles of the
wage distribution. This finding supports the existence of sticky floor and glass ceiling effects of the gender wage
gap that may be due to overcrowding of the female workers at the lower job rank and more prevalent
discrimination practised against the female workers among the employers at the upper job rank. The difficulty in
getting promotion at the higher job rank is one of the reasons for glass ceiling effect.
The results from the study is related to the income distribution scenario facing Malaysia. The Gini
coefficient in Malaysia is still considered higher even though it follows a decreasing trend from 1970-2014. In
1970 the Gini coefficient was 0.466 and reduced to 0.401 in 2014. A very small reduction in the Gini coefficient
reflects a sticky income distribution, where gender wage gap may contribute to this scenario. Apart from
discrimination against women, government policy that benefits the high-income population more, for example,
those with higher endowment and who work in the private sector, is also a relevant factor that contributes to the
pattern of income inequality in Malaysia.
The results from this analysis can be associated with several policy implications. First, the issue of
discrimination still prevails in the Malaysian labour market and is supported by many past studies. Nonetheless,
Page 11
155 Jurnal Ekonomi Malaysia 51(2), 2017 145-157
it is clearly shown by this study that a more serious gender wage gap occurs at the lower and upper quantiles of
wage distribution. Therefore, after identifying the root of the problem, policy makers have to give greater attention
to this segment of the labour market. For example, when dealing with employers discrimination, the law and
regulation must address this group and be clearly stated in the wage policy. As the private sector covers a large
portion of the Malaysian labour market, the wage setting policy in this sector must be transparent and recognised
by the government. There must be a clear and standard salary and promotion scheme for both male and female
workers.
ACKNOWLEDGEMENTS
The authors would like to thank the Ministry of Higher Education, Malaysia for the financial support given to
conduct this research. The research was funded by the Ministry of Higher Education in Malaysia. Project Code:
FRGS/1/2014/SS07/UKM/01/2
REFERENCES
Abdulrahman Abdullah Alshammari. 2016. Glass ceiling and glass cliff effects on women career advancement
in Saudi Arabia. International Review of Management and Business Research 5(3):1124-1134.
Albrecht, J., Bjorklund, A., & Vroman, S. 2003. Is there a glass ceiling in Sweden? Journal of Labor Economics
21(1): 145 – 177.
Arrow, K. 1973. The Theory of Discrimination. In Discrimination in Labor Markets, eds O. Ashenfelter, & A.
Rees .3-33. Princeton, N.J.: Princeton University Press.
Arulampalam, W., Booth, A. L., & Bryan, M. L. 2007. Is There a Glass Ceiling over Europe? Exploring them
Gender Pay Gap across the Wage Distribution. Industrial & Labor Relations Review, 60 (2), 163-186.
Baron, D. J., & Cobb-Clark, A. D. 2011. Occupational Segregation and the Gender Wage Gap in Private and
Public Sector Employment: A Distributional Analysis. The Economic Record 82: 227-246.
http://dx.doi.org/ 10.1111/j.1475-4932.2009.00600.x
Becker, G.S. 1971. The economics of discrimination (2nd. Edition). Chicago: University of Chicago Press.
Booth, A. L., Francesconi, M., & Frank, J .2003. A Sticky Floors Model of Promotion, Pay and Gender. European
Economic Review 47(2): 295-322.http://dx.doi.org/10.1016/ /S0014-2921(01)00197-0
Buchinsky, M. 1998. Recent advances in quantile regression models: a practical guideline for empirical approach.
Journal of Human Resources 33 (1): 88-126.
Buchinsky, M. 2001. Quantile regression with sample selection: Estimating women’s return to education in the
U.S. http://econpapers.repec.org/RePEc:spr.empeco:v:26:y:2001:i
Chapman, B.J., & Harding, J.R. 1986. Sex differences in earnings: an analysis of Malaysian wage data. Journal
of Development Studies. 21 (3): 362-376.
Chi, W., & Li, B. 2008. Glass Ceiling or Sticky Floor? Examining the Gender Pay Gap Across the Wage
Distribution in Urban China, 1987-2004. Journal of Comparative Economics 36(2): 243-263.
http://dx.doi.org/10.1016/j.jce.2007.12.001
Chua, Y. T. 1984. Wage Differential in Peninsular Malaysia. Unpublished PhD Dissertation, University of
California, Santa Barbara, USA.
de la Rica, S., Dolado, J. J., & Llorens, V. 2008. Ceilings or floors: Gender Wage Gaps by Education in Spain.
Journal of Population Economics 21(3): 751-776.
Department of Statistics [DOS]. 2016. Salaries & wages survey report, Malaysia, 2015. Retrieved January 11,
2017 from
https://www.dosm.gov.my/v1/index.php?r=column/ctwoByCat&parent_id=123&menu_id=U3VPMldo
YUxzVzFaYmNkWXZteGduZz09
Dimovski, V., Skerlavaj, M., & Mok, K. M. 2010. Comparative Analysis of Mid-Level Women Managers’
Perception of the Existence of ‘Glass Ceiling’ in Singaporean and Malaysian Organizations.
International Business & Economic Research Journal 9 (8): 61-78.
Economic Planning Unit [EPU]. 2015. http://epu.gov.my/en/content/table-6-gini-coefficient-ethnic-group-strata-
and-state-malaysia-1970-2014
Economic Planning Unit [EPU]. 2015. Eleventh Malaysia Plan, 2016 – 2020. Kuala Lumpur: Percetakan Nasional
Malaysia Berhad.
Fang, Z. 2012. Gender Wage Differentials: Glass Ceilings vs Sticky Floors. Singapore: Lambert Academic
Publishing.
Fang, Z., & Sakellariou, C. 2011. A Case of Sticky Floors: Gender Wage Differentials in Thailand. Asian
Economic Journal 25(1): 35-54.
Fang, Z . & Sakellariou, C. 2015. Glass ceilings versus sticky floors: evidence from Southeast Asia and an
international update. Asian Economic Journal 29(3):215-242·
Page 12
156 Jurnal Ekonomi Malaysia 51(2), 2017 145-157
Fernandez, J. L. 2006. Gender Earnings Differentials in Malaysia. A PhD. Thesis Submitted to the Faculty of
Economics and Administration, University of Malaya, Kuala Lumpur.
Goy, S. C., & Johnes, G. 2012. Revisiting the impact of occupational segregation on the gender earnings gap in
Malaysia. Jurnal Ekonomi Malaysia 46(1):13 – 25.
Gunawardena, D. 2006. Exploring Gender Wage Gaps in Sri Lanka: A Quantile Regression Approach. PMMA
Network Session Paper.
Hiau, J. K. 2006. Glass Ceiling or Sticky Floor? Exploring the Australian Gender Pay Gap.The Economic Record
82(259) : 408-442. doi10.1111/J.1475-4932.2006.00356.X
Hyder, A., & Reilly, B .2005. The Public Sector Pay Gap in Pakistan: A Quantile Regression Analysis. PRUS
Working Paper No. 33.
Koenker, R., & Bassett, G. 1982. Robust tests for heteroscedasticity based on regression quantiles. Econometrica.
50 (1): 43-62.
Koshal, M., Gupta A.K. & Koshal, R. 1998. Women in Management: A Malaysian Perspective. Women in
Management Review. 13 (1): 11-18.
Latifah, M. N. 1998. An Overview of Gender Earnings Differentials in Peninsular Malaysia. IIUM Journal of
Economics and Management 6 (1): 23-49.
Latifah, M.N. 2000. Occupational sex segregation and discrimination in peninsular Malaysia. Jurnal Pengurusan
19: 89-107.
Lee, K.H., & Nagaraj, S. 1995. Male-female earning differentials in Malaysia. The Journal of Development
Studies 31 (3): 467-480.
Liew, C.S., & Zulridah, M.N. 2015. The impact of training on the conditional wage distribution in selected service
subsectors in Malaysia. Jurnal Ekonomi Malaysia 49 (1): 37-48.
Low, K. L. & Goy, S. C. 2006. Male-female earnings differentials in Sarawak, Malaysia. International Journal
of the Humanities. 3(8): 171-180.
Machado, J., & Mata, J. 2001. Earning functions in Portugal 1982-1994: Evidence from quantile regression.
Empirical Economics 26: 115-134.
Mincer, J. 1974. Schooling, Experience, and Earnings. National Bureau of Economic Research, New York:
Columbia University Press.
Ministry of Human Resources [MoHR]. (2016). Statistik pekerjaan dan perburuhan (siri 10, bil. 4/2016, Disember)
[English translation: “Statistics for employment and labour (series 10, no. 4/2016, December)”].
Retrieved January 10, 2017 from http://myhos.mohr.gov.my/ebook/istatistik4_2016/index.html#p=12
Nagaraj, S., Fernandez, J., & Loh, W.L. 2002. Notes on Gender Equality and Employment: Issues for Malaysia.
Proceedings of the National Seminar on Gender Equality at Work, Putrajaya: ILO and Ministry of Human
Resources, Malaysia.
Nestic, D. 2007. Differing Characteristics or Differing Rewards: What is Behind the Gender Wage Gap in
Croatia? The Institute of Economics, Zagrab Working Paper No. 704.
Newell, A., & Reilly, B. 2001. The Gender Pay Gap in the Transition from Communism: Some Empirical
Evidence. Economic System 25 (4): 287-304.
Norma, M., Sieh, M. L., Lang, C. Y., & Phang, S. N. 1991. Women Managers in Malaysia. Faculty of Economics
and Administration, University of Malaya, Kuala Lumpur.
Phelps, E. S. 1972. The Statistical Theory of Racism and Sexism. American Economic Review 62(4): 659-
661.Retrieved from http://www.jstor.org/stable/1806107.
Rahmah, I., & Idris, J. 2012. Gender wage differentials and discrimination in Malaysian labour market. World
Applied Science Journal. 19 (5): 719-728.
Rahmah, I., & Zulridah, M. N. 2005. Gender Wage Differentials in the Malaysian Manufacturing Sector. IIUM
Journal of Economics and Management. 13 (2): 119-137.
Sabir, M., & Aftab, Z. 2007. Dynamism in the Gender Wage Gap: Evidence from Pakistan. The Pakistan
Development Review 46(4): 865-882.
Sakellariou, C. 2004. Gender-Earnings Differentials Using Quantile Regressions. Journal of Labor Research
25(3): 458-468.
Seshan, G.K. 2013. Public-private sector employment decisions and wage differentials in Peninsular Malaysia.
Emerging Markets Finanace & Trade 49 (5): 163-179.
Shultz, T.W. 1961. Investment in Human Capital. American Economic Review 161:1-17.
Sieh, L.M.L., & Ong, F.S. 1995. Gender balance in management: case of Malaysia. Jurnal Pengurusan 14 (1):
27-42.
Smith, P., Caputi, P. & Crittenden, N. 2012. A maze of metaphors around glass ceilings. Gender in Management:
An International Journal 27 (7): 436-448.
Thundrayan, V. & Pydayya, R. 2015.Equality, Diversity and Inclusion: An International Journal 34(5):452-466·
Wan, L.M.W.Z.A., Zaleha, M.N., & Wan, A.S.W.N. 2016. Exploring the glass ceiling and sticky floor in
Malaysia. Asian Social Science 12 (6): 203-216.
Page 13
157 Jurnal Ekonomi Malaysia 51(2), 2017 145-157
Zubaidah, Z. A., Azwan, A. A., & Kamaruzaman, J. 2009. The ‘Glass Ceiling’ Phenomenon for Malaysian
Accountants. Journal of Asian Culture History 1 (1):38-44.
Rahmah Ismail*
Fakulti Ekonomi dan Pengurusan
Universiti Kebangsaan Malaysia
43600 UKM Bangi Selangor
MALAYSIA
E-mail : [email protected]
Chung-Khain Wye
Fakulti Ekonomi dan Pengurusan
Universiti Kebangsaan Malaysia
43600 UKM Bangi Selangor
MALAYSIA
E-mail : [email protected]
Nur Sabrina Mohd Palel
Fakulti Ekonomi dan Pengurusan
Universiti Kebangsaan Malaysia
43600 UKM Bangi Selangor
MALAYSIA
E-mail: [email protected]
*Corresponding author