September2017 CH 4 CH 4 CO 2 CO 2 NO 2 NO 2 ENERGY INDUSTRY* AFOLU** WASTE GHG Platform India is a collective civil society initiative providing an independent estimation and analysis of India's Greenhouse Gas (GHG) emissions across key sectors, namely, Energy, Industry*, AFOLU** and Waste. The platform seeks to add value to the various ongoing GHG estimation efforts by helping address existing data gaps and data accessibility issues, extending beyond the scope of national inventories, and by increasing the volume of analytics and policy dialogue on India's Greenhouse Gas emissions sources, prole, and related policies. TrendAnalysisof GHGEmissionsinIndia TheStudyEstimatesandAssessesGreenhouseGasEmissionsandRemovalsfrom thefollowingsectors: Analysis of Greenhouse Gas Emission Trends from 2005 to 2013 TheGreenhouseGasesCovered UnderthisExerciseare: Methane CH 4 CO 2 Carbon Dioxide Nitrous Oxide NO 2 * Industry emissions include Industrial Process and Product Use (IPPU) and Industrial Fuel Combustion (Fuel combusted for captive electricity generation has been reported under energy sector) ** AFOLU - Agriculture, Forestry & Other Land Use
Transcript
September�2017
CH4 CH4
CO2
CO2N O2
N O2
ENERGY INDUSTRY* AFOLU** WASTE
GHG Platform India is a collective civil society initiative providing an independent estimation and analysis of India's Greenhouse Gas (GHG) emissions across key sectors, namely, Energy, Industry*, AFOLU** and Waste.
The platform seeks to add value to the various ongoing GHG estimation efforts by helping address existing data gaps and data accessibility issues, extending beyond the scope of national inventories, and by increasing the volume of analytics and policy dialogue on India's Greenhouse Gas emissions sources, prole, and related policies.
* Industry emissions include Industrial Process and Product Use (IPPU) and Industrial Fuel Combustion (Fuel combusted for captive electricity generation has been reported under energy sector)
** AFOLU - Agriculture, Forestry & Other Land Use
Economy�-�Wide��
62%
21%
13%4%
2005
Industry
Energy
WasteAFOLU
63%
26%
7% 4%
2013
Industry
Energy
WasteAFOLU
Sectoral�Share�of�Emissions
India's emissions have grown at the rate of
(compounded annually)from 2005 to 2013
5.74%
Energy Sector
is the Largest contributor to GHG Emissions in India
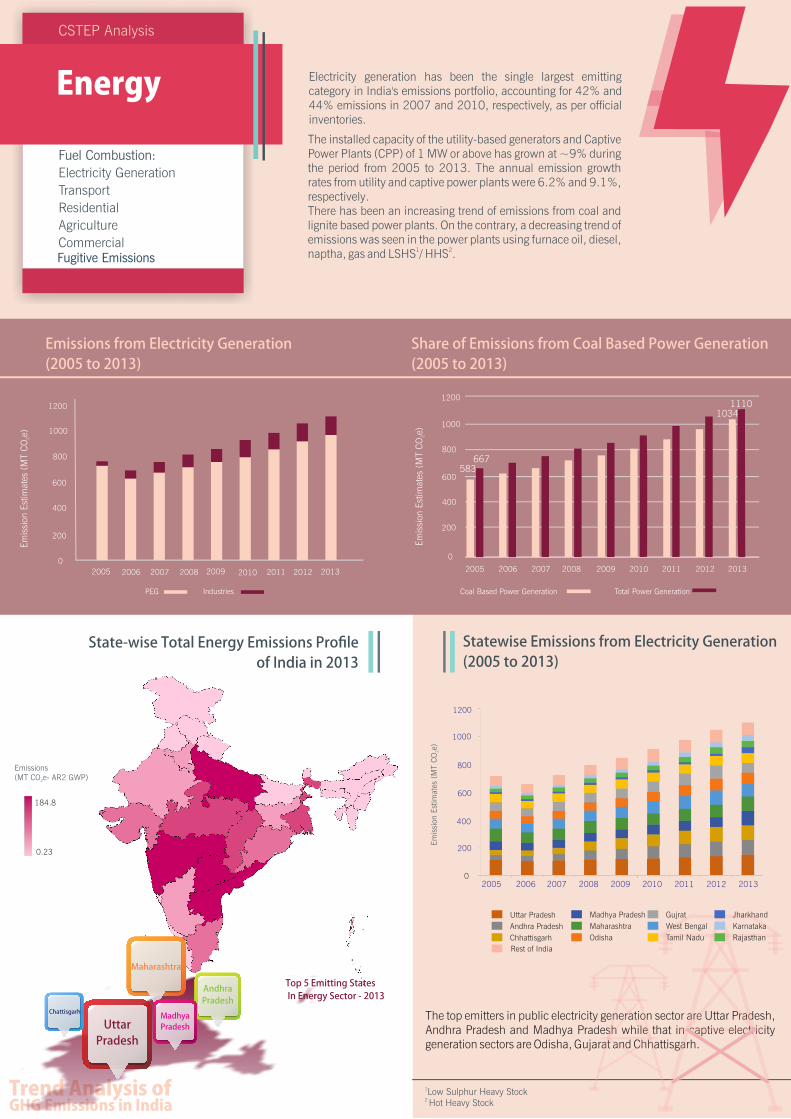
The installed capacity of the utility-based generators and Captive Power Plants (CPP) of 1 MW or above has grown at ~9% during the period from 2005 to 2013. The annual emission growth rates from utility and captive power plants were 6.2% and 9.1%, respectively.There has been an increasing trend of emissions from coal and lignite based power plants. On the contrary, a decreasing trend of emissions was seen in the power plants using furnace oil, diesel,
1 2naptha, gas and LSHS / HHS .
Top�5�Emitting�States�In�Energy�Sector�-�2013
Emissions (MT CO e- AR2 GWP)2
184.8
0.23
Fugitive Emissions
Fuel Combustion:
Electricity Generation
Transport
Residential
Agriculture
Commercial
Electricity generation has been the single largest emitting category in India's emissions portfolio, accounting for 42% and 44% emissions in 2007 and 2010, respectively, as per ofcial inventories.
The top emitters in public electricity generation sector are Uttar Pradesh, Andhra Pradesh and Madhya Pradesh while that in captive electricity generation sectors are Odisha, Gujarat and Chhattisgarh.
PEG Industries
2007 2008 2009 2010 2011 2012 201320062005
0
200
400
600
800
1000
1200
Em
issi
on E
stim
ates
(M
T C
Oe)
2
Total Power GenerationCoal Based Power Generation
0
200
400
600
800
1000
1200
2007 2008 2009 2010 2011 2012 201320062005
583667
10341110
Em
issi
on E
stim
ates
(M
T C
Oe)
2
0
200
400
600
800
1000
1200
2007 2008 2009 2010 2011 2012 201320062005
Em
issi
on E
stim
ates
(M
T C
Oe)
2
Uttar Pradesh
Andhra Pradesh
Chhattisgarh
Madhya Pradesh
Maharashtra
Odisha
Gujrat
West Bengal
Tamil Nadu
Jharkhand
Karnataka
Rajasthan
Rest of India
Trend�Analysis�of�GHG�Emissions�in�India
UttarPradesh
Maharashtra
Andhra�Pradesh
Chattisgarh Madhya�Pradesh
In 2013, out of 34 states and union territories considered for this evaluation, 10 states accounted for ~80% of GHG emissions from industry sub-sectors, viz. - Gujarat (14%), Odisha (13%), Chhattisgarh (10%), Jharkhand (9%), Karnataka (8%), Maharashtra (8%), Andhra Pradesh (7%), Tamil Nadu (6%), Rajasthan (5%), and West-Bengal (5%).
Industry sector represents ~25% of the overall national estimates for the greenhouse gas emissions. As per our estimates, GHG emissions from industries grew at a compound rate of 9% – rising from ~315 Million Tonnes (MT) of Carbon-dioxide equivalent (CO e) in 2005, to 2
~623 MT CO e in 2013.2
In 2013, manufacturing of iron and steel represented the largest share of emissions (38%), followed by non-metallic minerals (predominantly, cement) with a share of 29% in overall industrial emissions. Coal consumption is the prime driver behind their overall emissions.
GHG emission due to industry energy use has grown upwards at a rate of 10%, rising from ~217 MT in 2005, to ~ 467 MT in 2013. Also, its share in the total industrial emissions has increased from 65% to 76% in the same period. IPPU emissions grew at a lower annual growth rate of 6% increasing from ~ 102 MT in 2005, to ~156 MT in 2013.
3 Fuel combusted for captive electricity generation has been reported under energy sector4 Emissions for Mizoram and Lakshwadeep have not been calculated for industry sector
Gujarat
Chattisgarh
Odisha
JharkhandAndhra Pradesh
Karnataka
Tamil Nadu
Maharashtra
West Bengal
Rajasthan
Other States
2007 2008 2009 2010 2011 2012 201320062005
0
100
200
300
400
500
600
700
Em
issi
on E
stim
ates
(M
T C
Oe)
2
Em
issi
on E
stim
ates
(M
T C
Oe)
2
90
0
20112007 20092008 2010 2012 201320062005
0%0%
10%
20%
30%
40%
50%
60%
70%
80%
90%
100%
0
100
150
250
300
400
500
50
450
200
350
In 2013 AFOLU sector contributed to ~7% of India’s overall GHG emissions. The emissions decreased from ~201 MT CO e 2
in 2005 to ~172 MT Co e in 2013. This marginal decline is 2
primarily due to increased removal of CO by land, mainly forests 2
which acts as a carbon sink.
States with maximum emissions from AFOLU sector in 2013 were Uttar Pradesh, Andhra Pradesh, Rajasthan, Bihar and West Bengal. These states together accounted for ~88% of India's total AFOLU emissions.
There are, however, many states that have negative emissions from this sector, primarily because of a large forest area within their territories. The top 5 states/UT with negative emissions in 2013 were Kerala, Tamil Nadu, Arunachal Pradesh, Jammu & Kashmir, and Andaman & Nicobar Islands.
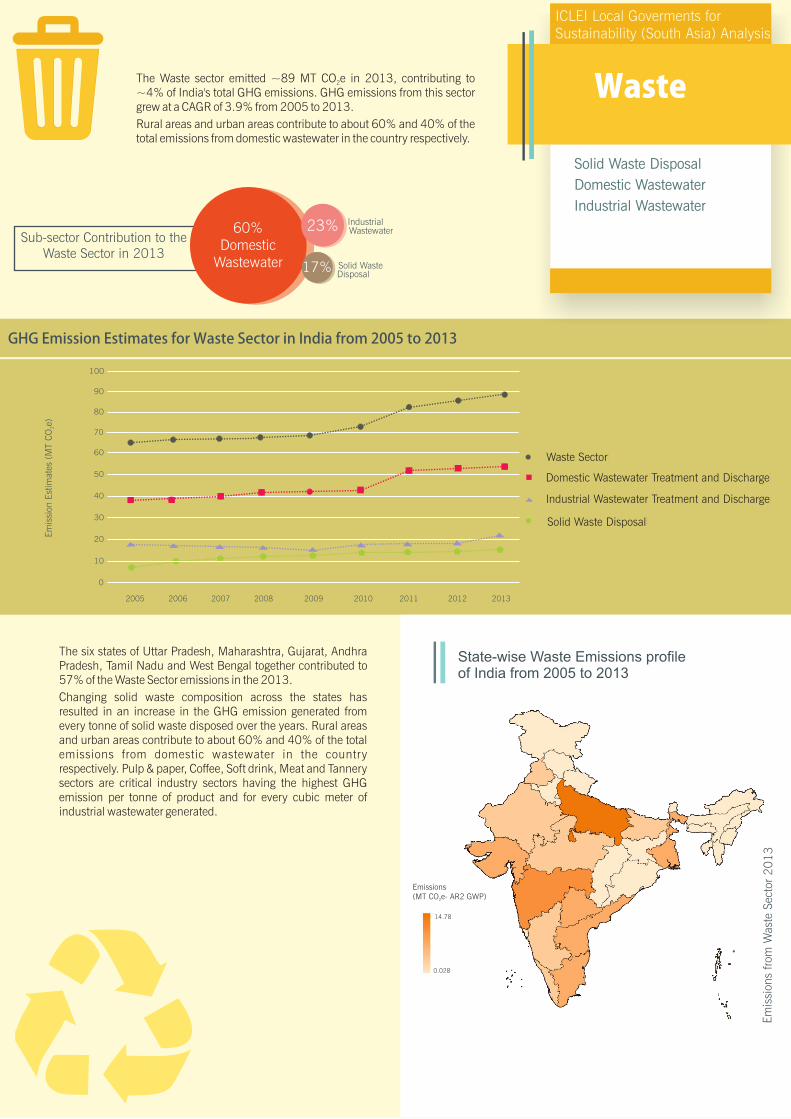
The Waste sector emitted ~89 MT CO e in 2013, contributing to 2
~4% of India's total GHG emissions. GHG emissions from this sector grew at a CAGR of 3.9% from 2005 to 2013.
Rural areas and urban areas contribute to about 60% and 40% of the total emissions from domestic wastewater in the country respectively.
The six states of Uttar Pradesh, Maharashtra, Gujarat, Andhra Pradesh, Tamil Nadu and West Bengal together contributed to 57% of the Waste Sector emissions in the 2013.
Changing solid waste composition across the states has resulted in an increase in the GHG emission generated from every tonne of solid waste disposed over the years. Rural areas and urban areas contribute to about 60% and 40% of the total emissions from domestic wastewater in the country respectively. Pulp & paper, Coffee, Soft drink, Meat and Tannery sectors are critical industry sectors having the highest GHG emission per tonne of product and for every cubic meter of industrial wastewater generated.
Waste
ICLEI Local Goverments for Sustainability (South Asia) Analysis
Solid Waste Disposal
Domestic Wastewater
Industrial Wastewater
Sub-sector Contribution to the Waste Sector in 2013
14.78
0.028
Em
issi
ons
from
Was
te S
ecto
r 2013
State-wise Waste Emissions profile of India from 2005 to 2013
All information mentioned in this document is sourced from GHG Platform India. To download this document and to know more about the Platform,
please visit www.ghgplatform-india.org or write to [email protected]
The GHG Platform India is a collective civil society initiative providing an independent estimation and analysis of India's Greenhouse Gas (GHG) emissions across key sectors, namely, Energy, Industry, AFOLU and Waste.
The platform comprises civil society groups as under:
In collaboration with
Council on Energy, Environment and Water (CEEW) is one of South Asia’s leading not for prot policy research institutions.
The International Maize and Wheat Improvement Center (CIMMYT) is the global leader in agricultural research for development in wheat and maize based farming systems.
Center for Study of Science, Technology and Policy (CSTEP) is a not for prot research organisation incorporated in 2005 u/s 25 of The Companies Act, 1956.
ICLEI - Local Governments for Sustainability is a leading association of more than 1000 metropolises, cities, urban regions and towns across the world.
Shakti Sustainable Energy Foundation works to strengthen the energy security of the country by aiding the design and implementation of policies that encourage energy efciency, renewable energy and sustainable transport solutions.
Vasudha Foundation, set up in 2010, is a not for prot organization, working in the clean energy and climate policy space.
WRI- India is a global research organization that spans more than 50 countries, with ofces in the United States, China, India, Brazil, Indonesia and more.