6
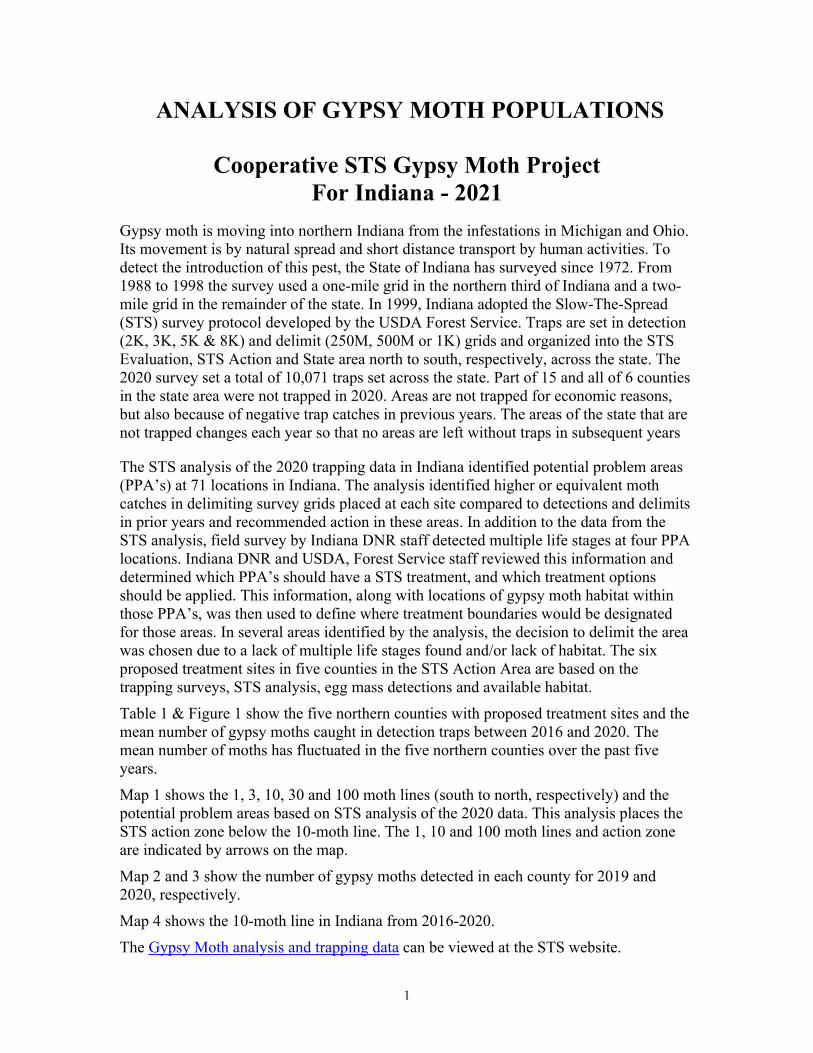
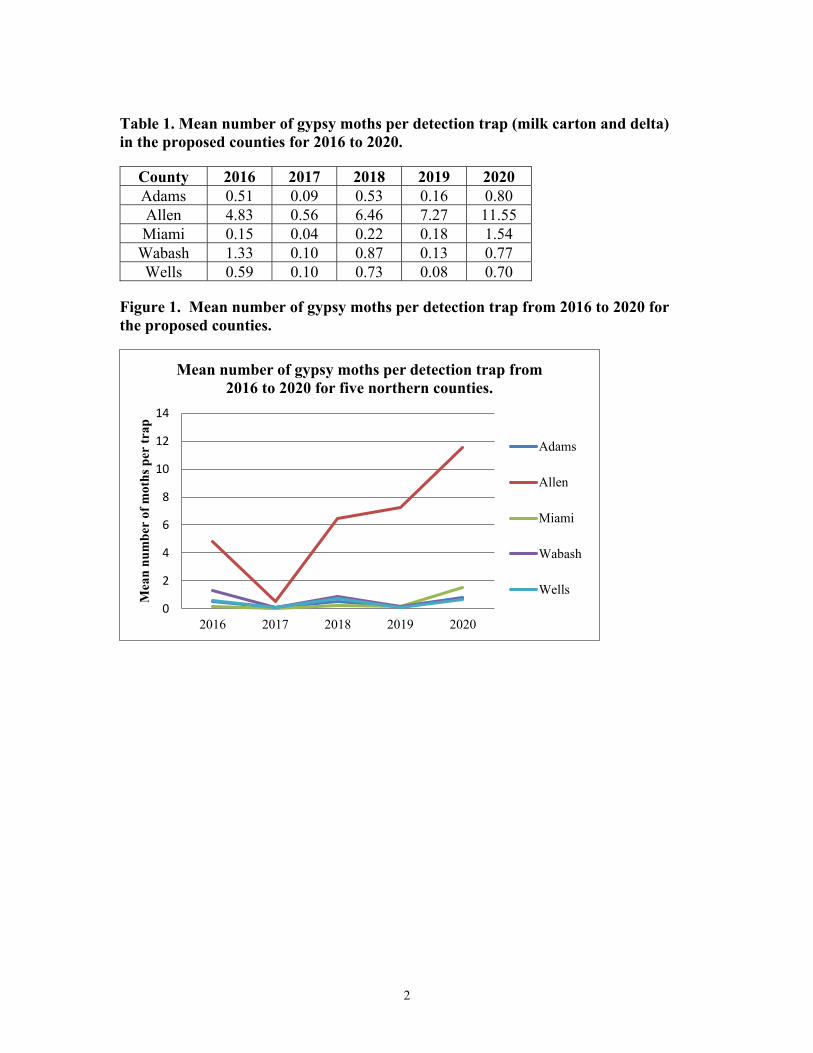
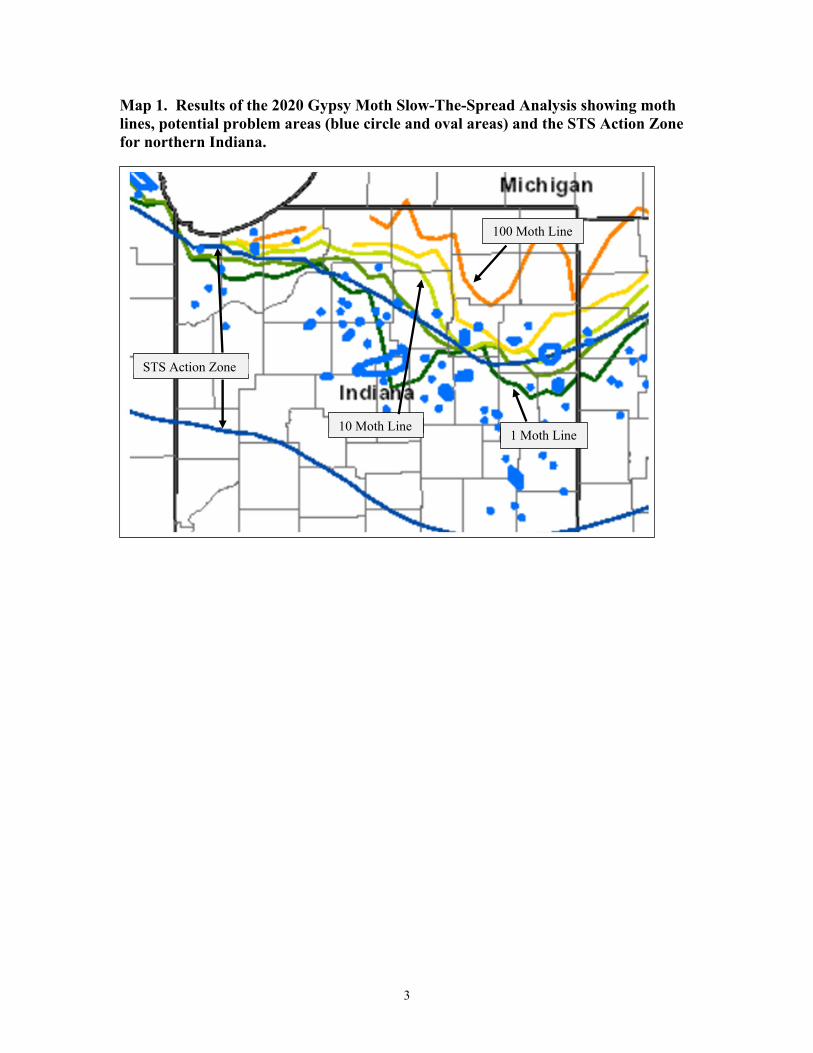
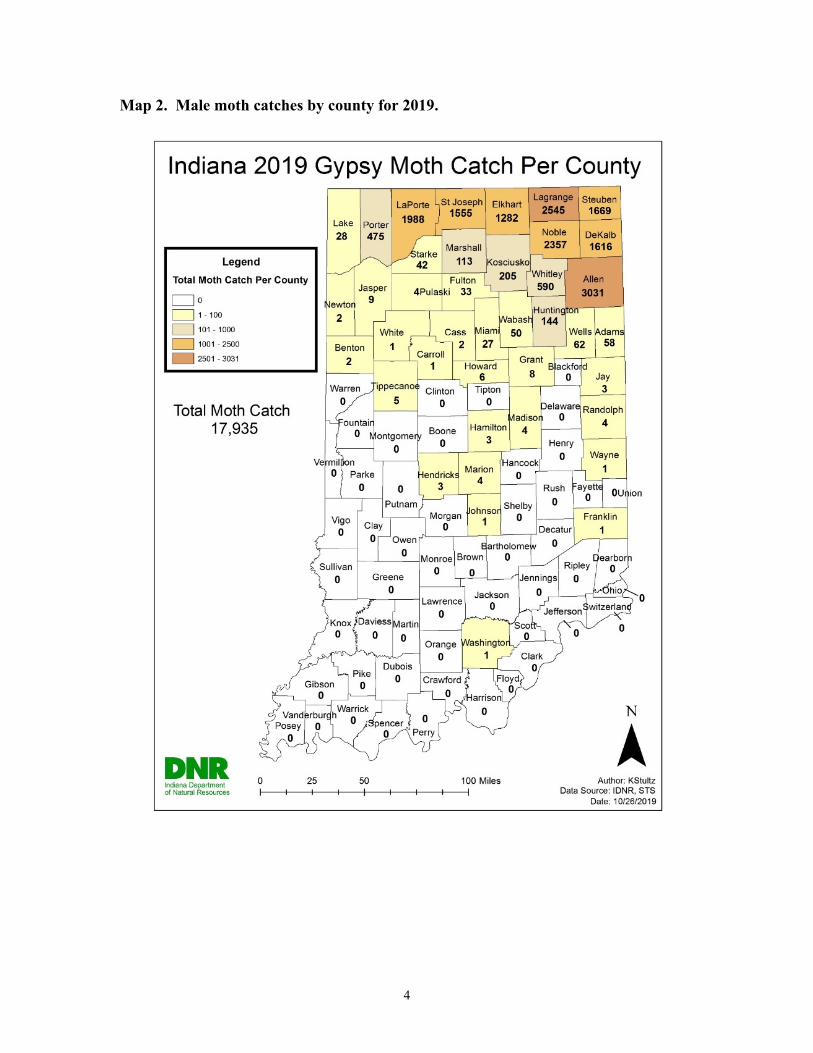
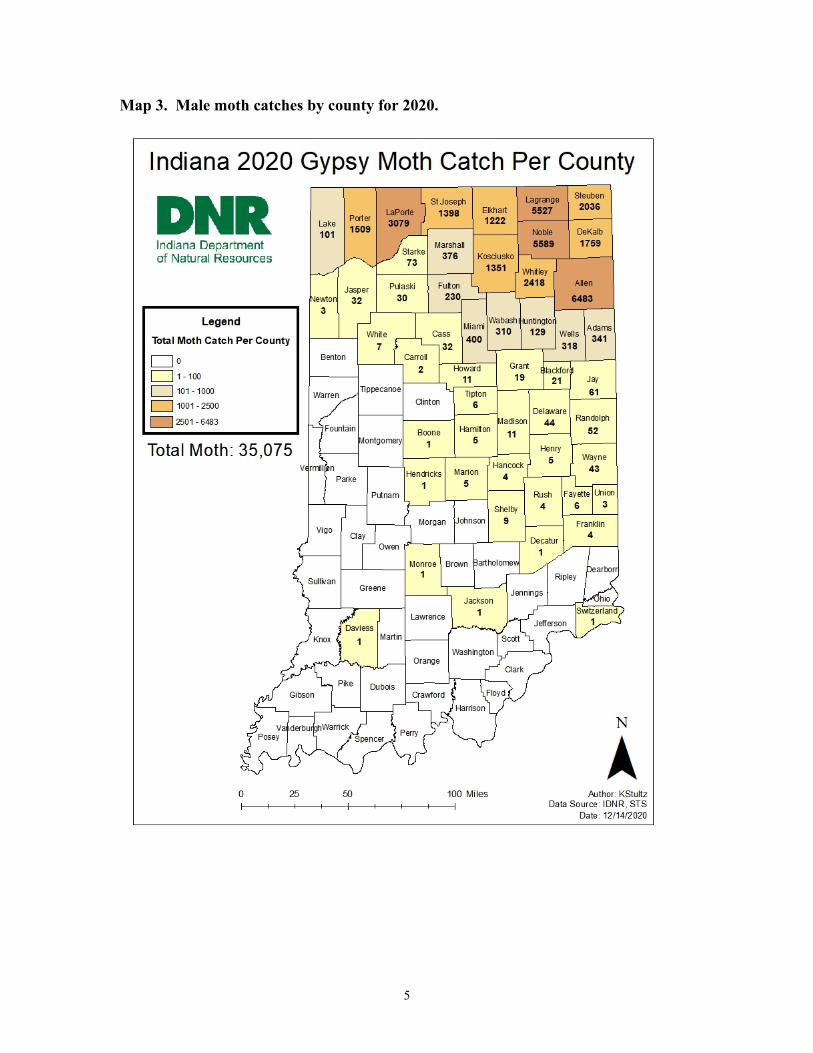
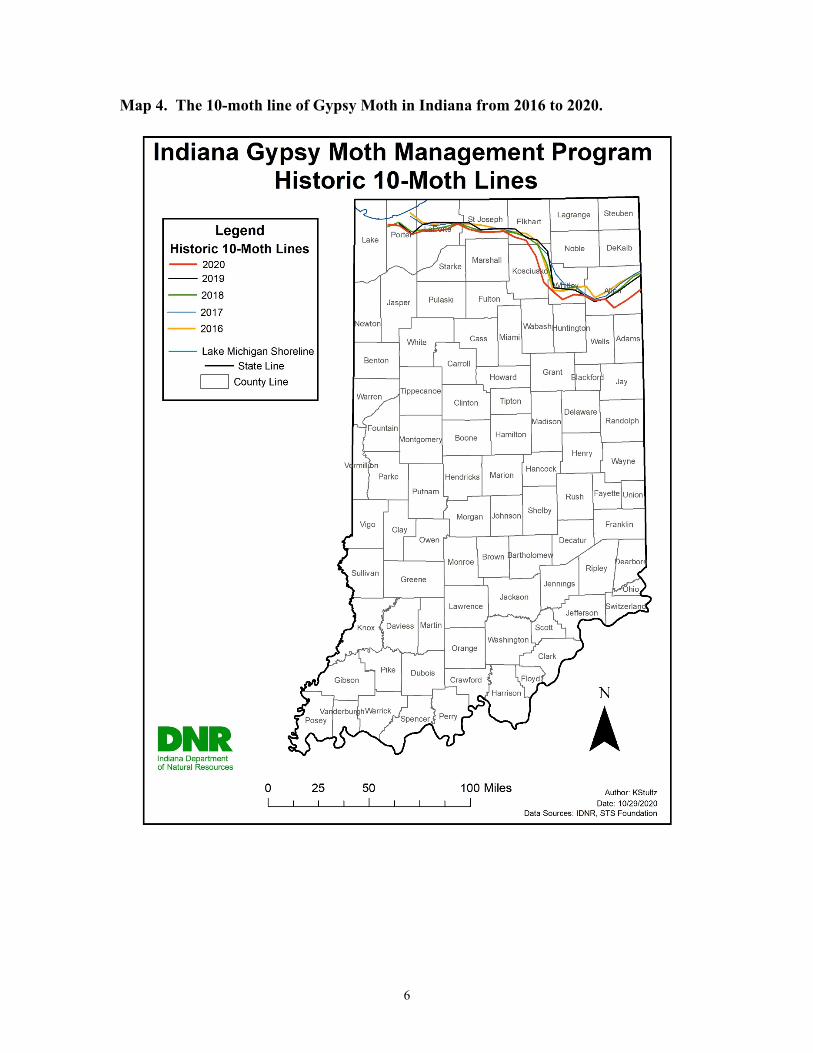
ANALYSIS OF GYPSY MOTH POPULATIONS Cooperative STS Gypsy Moth Project For Indiana - 2021 Gypsy moth is moving into northern Indiana from the infestations in Michigan and Ohio. Its movement is by natural spread and short distance transport by human activities. To detect the introduction of this pest, the State of Indiana has surveyed since 1972. From 1988 to 1998 the survey used a one-mile grid in the northern third of Indiana and a two- mile grid in the remainder of the state. In 1999, Indiana adopted the Slow-The-Spread (STS) survey protocol developed by the USDA Forest Service. Traps are set in detection (2K, 3K, 5K & 8K) and delimit (250M, 500M or 1K) grids and organized into the STS Evaluation, STS Action and State area north to south, respectively, across the state. The 2020 survey set a total of 10,071 traps set across the state. Part of 15 and all of 6 counties in the state area were not trapped in 2020. Areas are not trapped for economic reasons, but also because of negative trap catches in previous years. The areas of the state that are not trapped changes each year so that no areas are left without traps in subsequent years The STS analysis of the 2020 trapping data in Indiana identified potential problem areas (PPA’s) at 71 locations in Indiana. The analysis identified higher or equivalent moth catches in delimiting survey grids placed at each site compared to detections and delimits in prior years and recommended action in these areas. In addition to the data from the STS analysis, field survey by Indiana DNR staff detected multiple life stages at four PPA locations. Indiana DNR and USDA, Forest Service staff reviewed this information and determined which PPA’s should have a STS treatment, and which treatment options should be applied. This information, along with locations of gypsy moth habitat within those PPA’s, was then used to define where treatment boundaries would be designated for those areas. In several areas identified by the analysis, the decision to delimit the area was chosen due to a lack of multiple life stages found and/or lack of habitat. The six proposed treatment sites in five counties in the STS Action Area are based on the trapping surveys, STS analysis, egg mass detections and available habitat. Table 1 & Figure 1 show the five northern counties with proposed treatment sites and the mean number of gypsy moths caught in detection traps between 2016 and 2020. The mean number of moths has fluctuated in the five northern counties over the past five years. Map 1 shows the 1, 3, 10, 30 and 100 moth lines (south to north, respectively) and the potential problem areas based on STS analysis of the 2020 data. This analysis places the STS action zone below the 10-moth line. The 1, 10 and 100 moth lines and action zone are indicated by arrows on the map. Map 2 and 3 show the number of gypsy moths detected in each county for 2019 and 2020, respectively. Map 4 shows the 10-moth line in Indiana from 2016-2020. The Gypsy Moth analysis and trapping data can be viewed at the STS website. 1