Analysis of Impediments to Fair Housing Choice St. Louis County, Missouri Cities of Florissant and O’Fallon, Missouri December, 2014 Prepared for St. Louis County and the Cities of Florissant and O’Fallon By
Transcript
Analysis of Impediments to Fair Housing Choice
St. Louis County, Missouri Cities of Florissant and O’Fallon, Missouri
December, 2014
Prepared for St. Louis County and the
Cities of Florissant and O’Fallon
By
2
3
Table of Contents
Executive Summary: St. Louis County ....................................................................................................... 4
Executive Summary: City of Florissant .................................................................................................. 14
Executive Summary: City of O’Fallon ...................................................................................................... 23
Definitions & Data Sources .......................................................................................................................... 32
Limitations of this Analysis ......................................................................................................................... 37
Protected Class Analysis .................................................................................................................................. 57
Public Investment, Infrastructure and Education ................................................................................. 96
Access to Areas of Opportunity .................................................................................................................. 127
Land Use & Zoning ........................................................................................................................................... 135
Hate Crime Data ................................................................................................................................................ 200
Title VIII of the Civil Rights Act of 1968, more commonly known as the Fair Housing Act, ensures
protection of housing opportunity by prohibiting discrimination in the sale or rental of housing on
the basis of race, color, religion, sex, and national origin, and was amended in 1988 to include
familial status and disability. HUD grantees receiving funds under the Community Development
Block Grant (CDBG) program are required to complete a fair housing study, known as an Analysis
of Impediments to Fair Housing Choice (AI) to ensure that housing and urban development
programs are being administered in a way that furthers fair housing for these protected classes. St.
Louis County, the City of Florissant, and the City of O’Fallon participate together in a Consortium for
the purpose of accessing federal affordable housing funds under HUD’s Home Investment
Partnerships Act (HOME) program. Because of the collaborative affordable housing planning
undertaken by the Consortium, the members sought to jointly conduct this AI to provide a
streamlined regional approach to fair housing and to identify and address impediments to fair
housing choice that often do not strictly follow jurisdictional boundaries.
Historical Overview
St. Louis County was formed on October 1, 1812 as one of the counties organized by Governor
William Clark out of the five administrative districts of the Upper Louisiana Territory. While it
originally included the City of St. Louis, the two were separated in 1876, leaving the County
predominately rural, with a few small urban centers. At present, the County has 91 municipalities
and an unincorporated area that includes nearly one-third of the population. St. Louis County made
up 16.7% percent of the state’s 2010 population, 48% of the jobs in the St. Louis Metropolitan Area,
and 23% of the jobs in the State of Missouri.
Demographic Overview
As of the 2010 Census, St. Louis County was home to 998,954 people, a loss of 1.7% since 2000. The
majority of its population was non-Hispanic Whites (68.9%). Black residents made up about one-
quarter of the population (23.2%) and no other race or ethnicity constituted more than 4% of the
population.
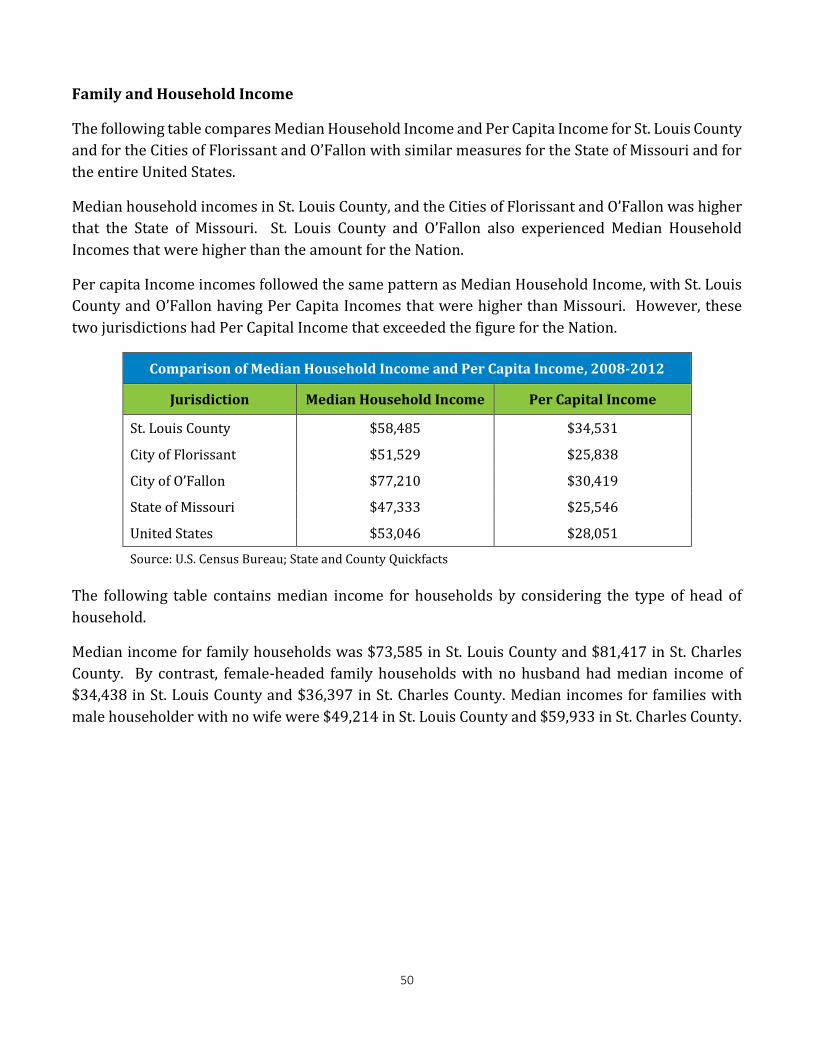
Median household income in St. Louis County ($58,385) was higher than that of the State of Missouri
($47,333) according to the 2008-2012 American Community Survey. The County had
unemployment rates under 5% prior to the national recession, but unemployment climbed to about
9% by 2009. By 2013, the rate fell to just above 6%, still over pre-recession levels. According to
2012 estimates, educational services, health care and social assistance employees represent the
largest shares of workers in St. Louis County (25.6% of the total).
5
Protected Class Analysis
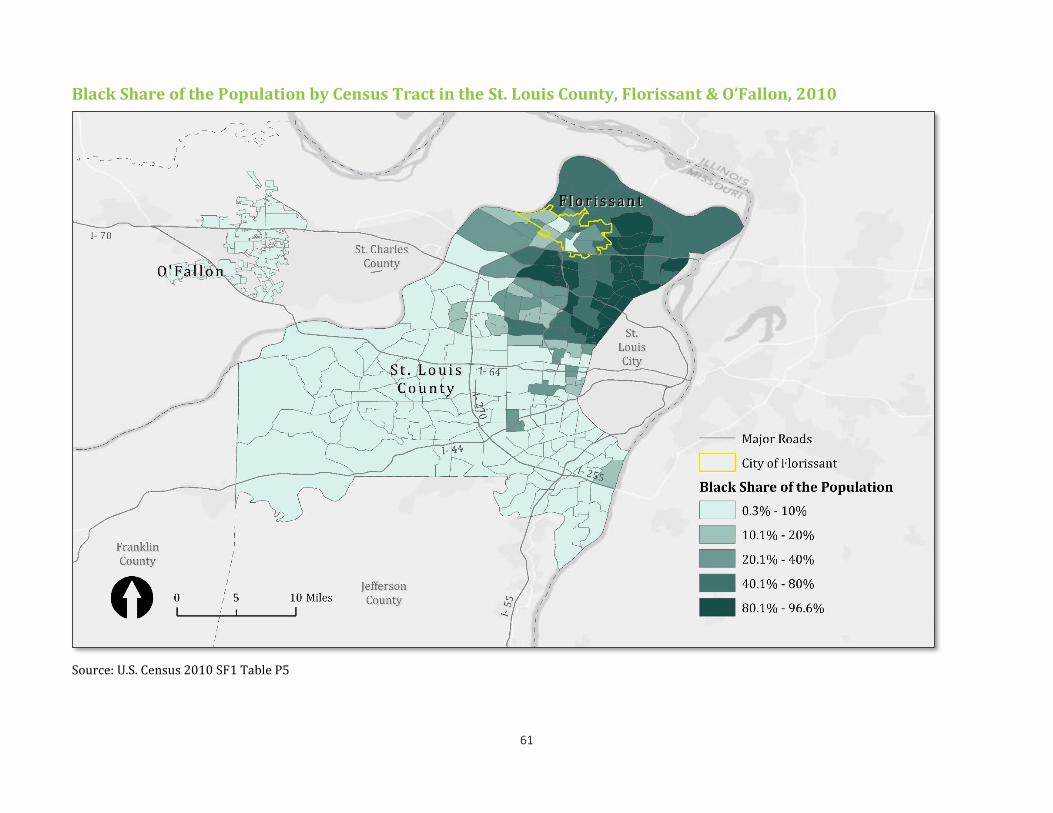
The majority of St. Louis County’s Black population lives in north St. Louis County, where 26 census
tracts had Black populations of 80% or higher in 2010. Only 7 tracts south of I-64 had Black
populations over 10%. Hispanic residents constituted 2.5% of the County’s 2010 population; the
largest concentration of Latino population (17.4% of the county’s total) was in ten tracts that cover
Breckinridge Hills, Woodson Terrace, St. Ann, Overland, Charlack, Edmundson, and St. John.
According to the 2008-2012 American Community Survey, 6.8% of St. Louis County residents were
not native to the United States, well below the national foreign-born population rate of 12.8%. The
largest share of foreign-born County residents were from Asia (44.6%), followed by Europe
(30.0%).
As of the 2010 Census, nearly two-thirds of St. Louis County households were families. About half
of families and one-third of total households (31.0%) included children, down from 33.9% in 2000.
Female householders made up 34.6% of total households, an increase of 8.0% from the previous
Census.
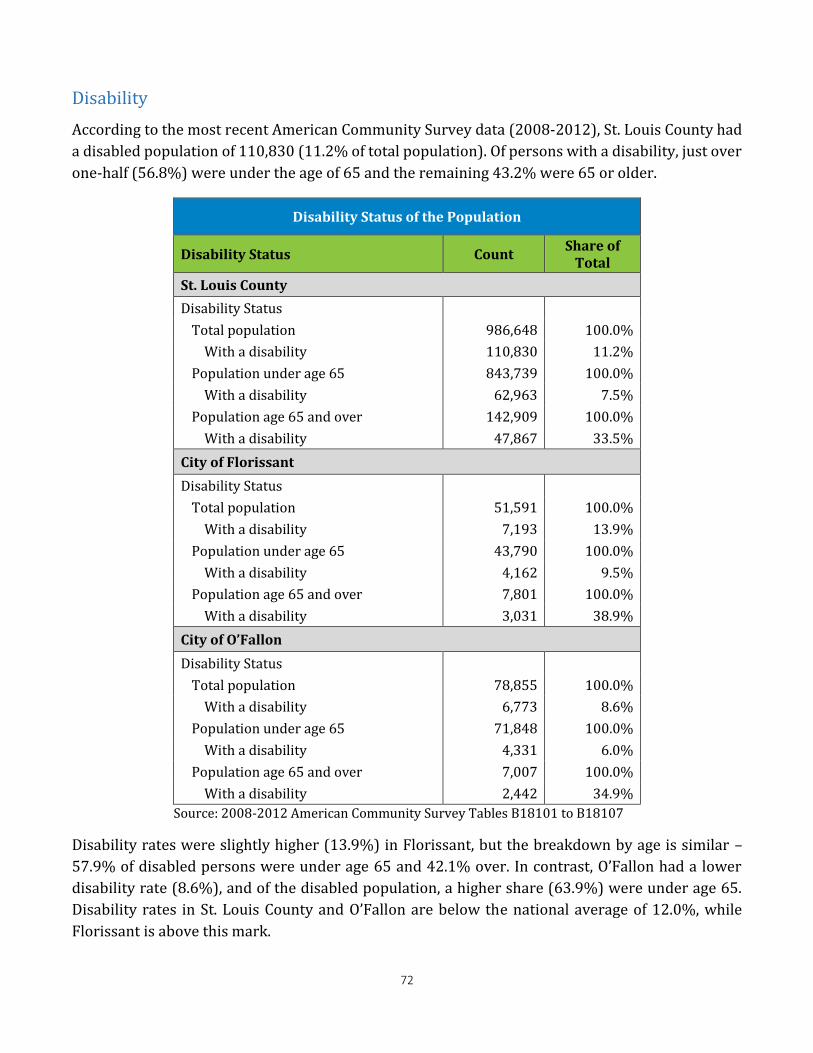
The 2008-2012 ACS data shows that 11.2% of the County’s population has a disability. Just over half
(56.8%) of that group are under age 65.
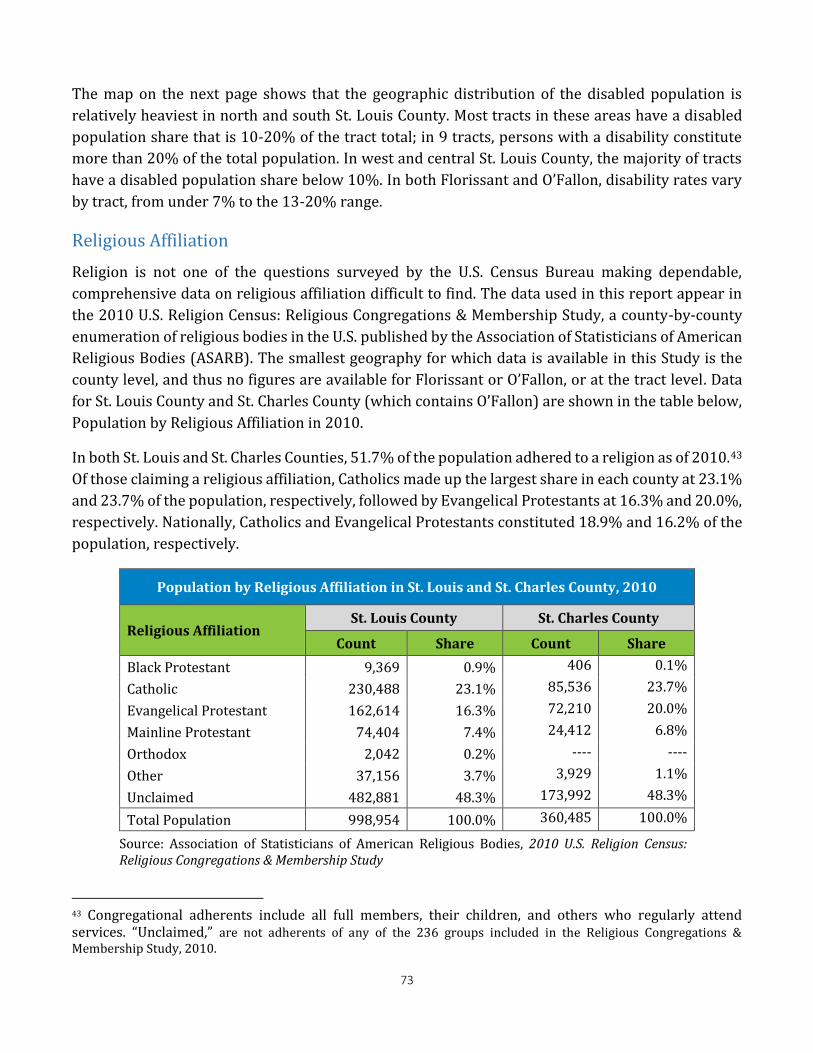
The 2010 U.S. Religion Census: Religious Congregations & Membership Study indicates that 51.7%
of St. Louis County’s population adhere to a religion. Catholics make up the largest share of the
population at 23.1%, followed by Evangelical Protestants (16.3%).
Segregation Analysis
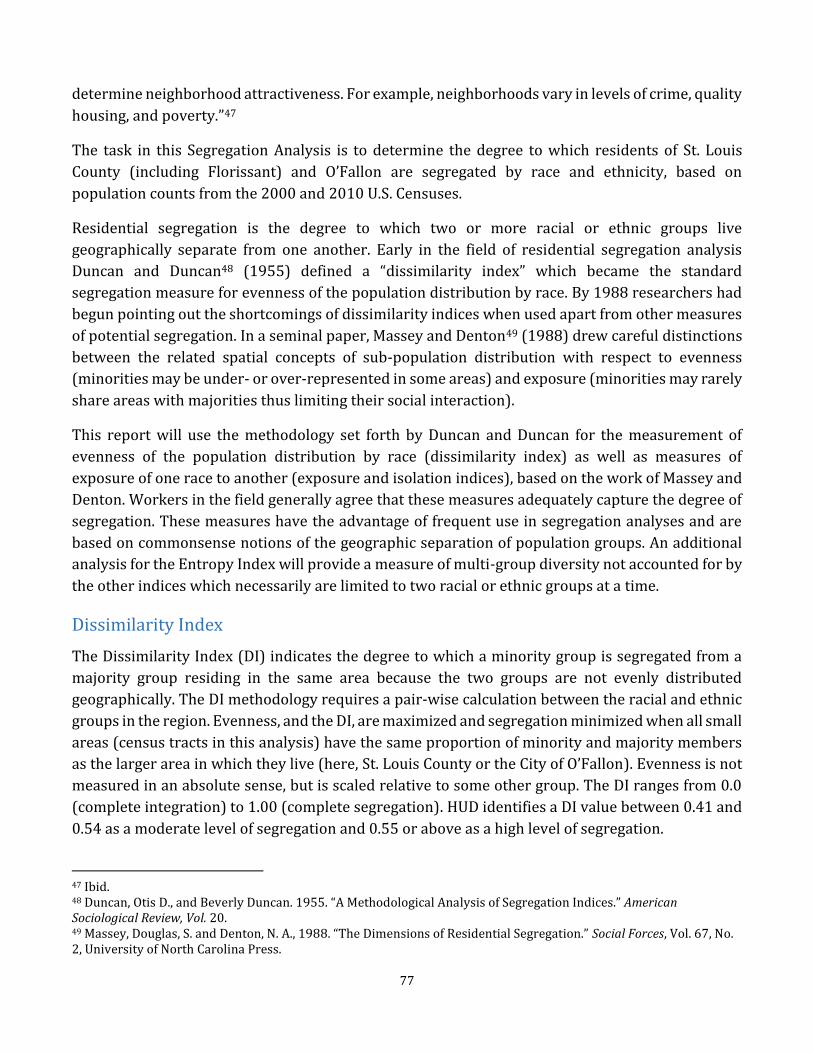
Four methodologies (Dissimilarity, Exposure, Isolation, and Entropy indices) for analyzing
segregation were used in this study. A reconciliation of the four indices has shown that, on the whole
in St. Louis County, segregation between Blacks and Whites is high and persistent, with little change
from 2000 to 2010. Whites tend to be isolated with only limited exposure to Blacks and other
minority groups.
Public Investment & Infrastructure
Several interstate highways serve the St. Louis region and St. Louis County. Public transit (known
as “Metro”) includes a fleet of buses, light rail and paratransit vehicles that serves portions of St.
Louis County. Limited transit access in some parts of the County was mentioned frequently among
stakeholders and survey respondents as an issue for some protected class members, and increasing
regional connectivity was identified as a key theme for the East-West Gateway Council of
Government’s OneSTL plan.
The quality of public schools within a community can also be a primary driver of housing choice. St.
Louis County has 23 public school districts, of which 17 had graduation rates above the statewide
6
rate in 2013. Two of those in the County with lower graduation rates are currently unaccredited
(Normandy and Riverview Gardens), reducing access to education for school-aged children in north
St. Louis County.
Access to Areas of Opportunity
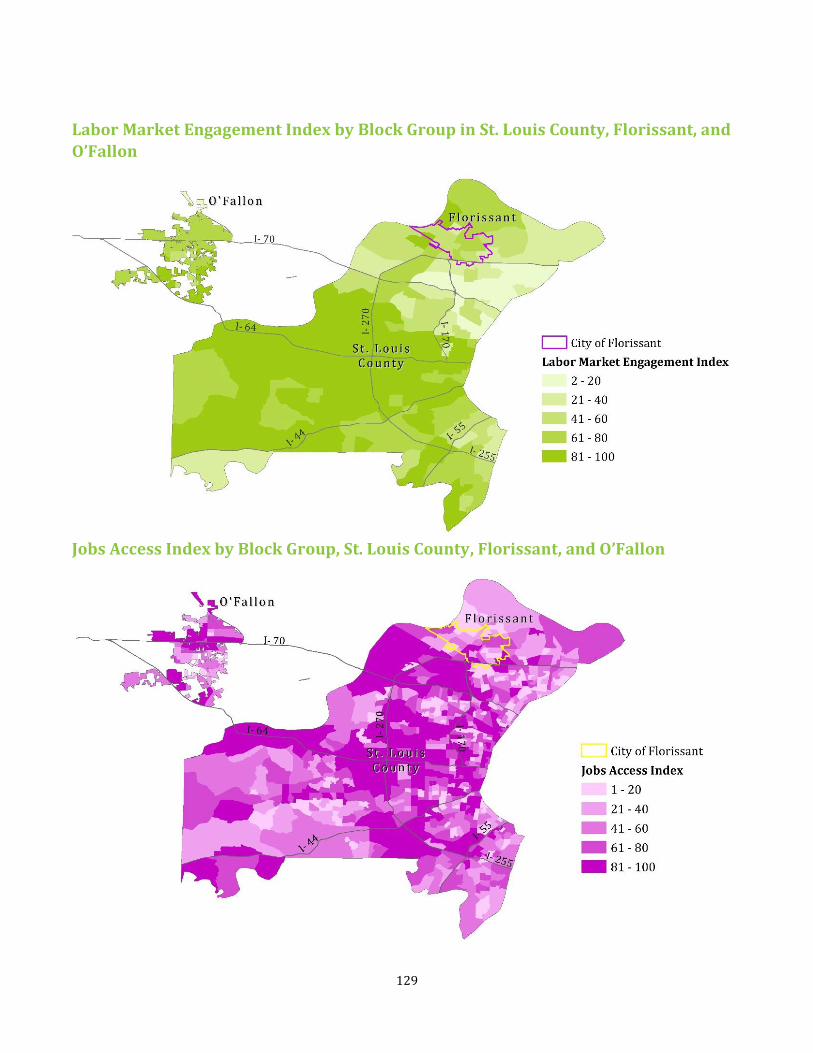
This analysis uses HUD-provided data to evaluate relative opportunity levels on six neighborhood
dimensions (poverty, school proficiency, labor market engagement, jobs access, transit access, and
health hazards exposure). In St. Louis County, Black residents face large opportunity gaps relative
to White residents in that they are more likely to live in neighborhoods with higher poverty, lower
school proficiency, and less labor market engagement. These disparities persist regardless of
poverty status. For jobs access and exposure to environmental health hazards, values were
relatively consistent across all races and ethnicities, suggesting a somewhat even distribution of
these dimensions across the region. Transit access was uniformly better for minority residents
compared to Whites and for persons in poverty compared to those not in poverty.
Land Use & Zoning
Zoning codes for St. Louis County and five St. Louis County municipalities (selected by the St. Louis
County Office of Community Development) were individually reviewed against a set of fair housing
criteria and assigned a risk score (1=low risk; 3=high risk) indicative of the codes’ potential to result
in housing discrimination.
Overall risk scores ranged from a low of 1.44 in University City and Chesterfield to a high of 1.83 in
Sunset Hills. St. Louis County scored 1.61, indicating a moderate risk of contributing to
discriminatory housing treatment. Codes with a greater risk for housing discrimination are those
that limit residential uses such as substance abuse treatment facilities to non-residential areas, have
restrictive definitions of “family,” and have restrictive regulations regarding home modifications to
accommodate persons with a disability.
Housing Profile
According to the 2008-2012 ACS estimates, St. Louis County contained a total of 437,803 housing
units, the majority of which were single-family detached (72.3%). The homeownership rate was
71.4%; vacancy rates were substantially lower for ownership units (2.2%) than for rental units
(6.7%). The vast majority of the County’s housing stock was built between 1950 and 1979.
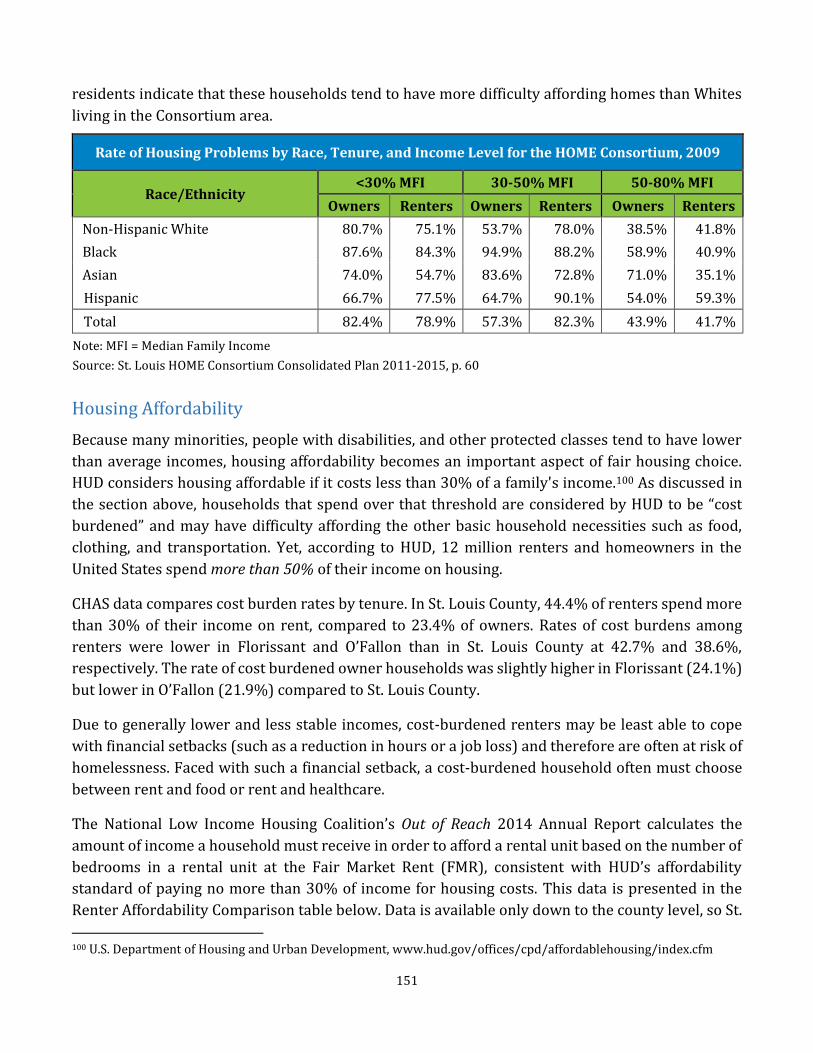
Because many protected classes tend to have lower than average incomes, housing affordability
becomes an important aspect of fair housing choice. HUD considers housing affordable if it costs
less than 30% of a family's income. In St. Louis County, 44.4% of renters have a cost burden,
compared to 23.4% of owners. The National Low Income Housing Coalition’s Out of Reach 2014
Annual Report calculates the amount of income a household must receive in order to afford a rental
unit at the Fair Market Rent (FMR) without spending over 30% of income. A renter at the mean
7
renter income in St. Louis County would need to keep rent costs at or below $748 to avoid a cost
burden.
Fair Housing Organizations & Activities
St. Louis County is served by several local fair housing, affordable housing, and homeless service
organizations, among them the Equal Housing Opportunity Council (EHOC), Beyond Housing, Legal
Services of Eastern Missouri, Community Action Agency of St. Louis County, the Lemay Housing
Partnership, and Catholic Charities. Activities include fair housing testing, complaint investigation,
fair housing education, transitional housing, rent and mortgage assistance, and other housing-
related assistance. Survey responses indicate that additional fair housing education may be needed
in the study area, as less than half of participants (43.1%) indicated knowing their fair housing
rights. Few respondents (9) experienced housing discrimination, but of those that did only 20%
reported it.
Housing Discrimination Complaints
Based on responses from fair housing agencies for the 2009-2014 reporting period, 280
discrimination complaints were received for St. Louis County by EHOC and the Missouri
Commission on Human Rights. Allegations of discrimination based on color/race were the most
common (101 complaints). Of the 79 complaints where a transaction area was identified, the
majority were for rental housing (43 complaints), followed by lending (23 complaints), and
discriminatory advertising (11 complaints).
Housing Discrimination Lawsuits
A review of the nature, extent, and disposition of significant housing discrimination lawsuits filed
and/or adjudicated between 2005 and May 2014 within St. Louis County revealed 5 lawsuits with
substantial bearing on the availability of fair housing choice. The cases reviewed tend to involve
three fair housing issues: (1) discriminatory lending practices that targeted a protected class; (2)
occupancy limits and restrictive definitions of “family”; and (3) prohibiting residential occupancy
permits for persons who cannot provide proof of citizenship or legal residency.
Hate Crimes
As defined by the Hate Crime Statistics Act of 1990 (28 U.S.C. § 534), hate crimes are “crimes that
manifest evidence of prejudice based on race, gender or gender identity, religion, disability, sexual
orientation, or ethnicity.” Because these protected classes significantly overlap those classes
protected under the Fair Housing Act, an examination of data on hate crimes is conducted as part of
this Analysis of Impediments. The FBI’s Uniform Crime Reporting Program data shows that 34
incidences of hate crimes were reported in St. Louis County from 2008 to 2012, the majority of
which were motivated by race (24 incidences).
8
Impediments and Recommendations
Impediments identified through this research are summarized below with supporting examples
noted. Each impediment listed is followed by recommendations, the implementation of which will
correct, or begin the process of correcting, the related impediment. It should be noted that these
barriers are largely systemic and will require effort from both private sector and public sector
actors to correct.
Impediment: Affordable Housing Options Concentrated in Areas of Low Opportunity
In St. Louis County, affordable housing options, both subsidized and non-subsidized, tend to be
concentrated in urban areas of low opportunity,1 particularly in the North County region which
includes the City of Florissant. This impediment is similar to the OneSTL FHEA’s finding that the
“(l)ocation of affordable housing perpetuates segregation and limits access to opportunity.” In
North County and in the Lemay area, affordable housing exists, sometimes with housing quality
issues, but the ability of area residents to improve economically is challenging. This report’s analysis
of access to areas of opportunity revealed that areas with low opportunity in terms of poverty,
school, proficiency, and labor market engagement are overwhelmingly concentrated in North
County communities. Public input reinforced this finding, with residents commenting that suburban
areas outside St. Louis County tended to have higher performing schools, lower crime rates, and
better housing conditions. Residents of the study area interviewed for this report further cited a
general shortage of Section 8 units available in the County outside the North County area. Still others
named the low quality and deteriorating condition of existing affordable housing units as problems.
Taken together, the relative concentration of housing options affordable to people of low- and
moderate-income (who are disproportionately minorities) in high poverty areas without access to
quality schools and with low rates of labor market participation is an inherent restriction on
housing choice.
Recommendations
Local governments in the study area should partner with the private sector to create more mixed
income housing using available public resources such as the HOME Program, Low Income Housing
Tax Credits, and state or local housings bonds. Equally important could be the creation of a Mixed
Income Housing Investment Program, capitalized by lenders, which would provide incentive
financing to developers who construct sustainable mixed income housing in these regions of the
study area.
For affordable housing developments receiving public subsidy or incentives from a local
government entity (e.g. St. Louis County, Florissant, or other municipalities) the source of public
1 This Analysis of Impediments looks at neighborhood opportunity on six dimensions as defined by HUD, including poverty, school proficiency, labor market engagement, access to jobs, access to transit, and exposure to environmental health hazards. The County may choose to use these factors or develop an alternate definition of opportunity based on similar measures of community health.
9
funds should prioritize projects located in high opportunity areas of the county, especially those
with transit access. To the extent these local government entities can influence the award of tax
credits by the Missouri Housing Development Commission to developers for new affordable
housing projects either through letters of endorsement or the investment of CDBG funds, such
measures should be reserved for those projects in high opportunity areas.
The efforts of groups like Beyond Housing, which focuses on comprehensive community
investments, stand as an example of how improving institutions that generate economic activity
should accompany affordable housing rehabilitation and preservation. If an area and its residents
do not have access to adequate income, rehabilitated housing will become subject to deferred
maintenance and the unit may again contribute to poorer housing quality in that area.
Other existing organizations such as SLEHCRA (St. Louis Equal Housing and Community
Reinvestment Alliance) are already working to improve opportunity in North County areas and
their work should be supported by St. Louis County and Florissant. New bank branches have opened
in low opportunity North County areas (Ferguson, Overland, and Pagedale) with record numbers of
deposits in their first weeks. Positive results like these should be promoted to encourage further
investment in these communities. In areas like North County that are economically distressed, the
types of employment opportunities available can perpetuate the cycle of unemployment and
underemployment. Public and private sector job training programs should be crafted that are
designed to raise the skill levels of area residents to match employment opportunities with better
pay in that area.
Expansion of the Section 8 program to include more units accepting the vouchers throughout St.
Louis County would increase affordable housing options in areas of greater opportunity and is
consistent with one of the recommendations of the 2012 St. Louis County Housing Study. The
County should encourage rental property owners in high opportunity areas to accept Section 8
vouchers through an education program that describes how the vouchers work and includes
testimonials from other local landlords who have had success with the Section 8 program. St. Louis
County and the City of Florissant should also explore the option of offering discounted occupancy
permits and/or expedited inspections for Section 8 landlords, and work with other jurisdictions in
the county who may be willing to offer similar incentives. The St. Louis County Housing Study also
recommended the creation of Voucher Counseling Centers where voucher recipients could be
assisted in locating housing units in locations that might not be concentrated in high poverty areas.
Impediment: NIMBY/Prejudiced Attitudes
Segregation between Black and White residents of the study area is high (dissimilarity index value
of 0.71) and remained unchanged between 2000 and 2010. Whereas studies of other communities
outside the St. Louis region tend to reveal declining levels of racial and ethnic segregation, the issue
in this study area appears to be persistent. Public input and comments received through the Fair
Housing Survey conducted in conjunction with this AI reveal that some residents of the study area
10
hold strong “Not In My Back Yard” (NIMBY) sentiments as well as attitudes prejudiced against
people of low-income, those residing in subsidized housing, and racial/ethnic minorities.
Recommendations:
Education and awareness is imperative to alleviating NIMBYism and prejudiced attitudes.
Segregatory living patterns and prejudiced personal beliefs and attitudes create negative impacts
on social conditions and discourse and can take many years to overcome. In the near term,
education and awareness of the value of diversity and integration is especially important (this was
also recommendation 1.1 in the OneSTL FHEA). The local governments within the study area should
continue to support and work with organizations (such as InvestSTL) dedicated to promoting
diversity throughout metro St. Louis and St. Louis County.
Collaborating with the assigned HUD Office of Fair Housing and Equal Opportunity and/or with local
fair housing advocacy organizations, the entitlement communities should develop an appropriate
diversity and sensitivity awareness curriculum and then make it a mandatory requirement for staff,
subrecipients, and any other entities the County may contract with under its CDBG program. Over
time, the training program should be expanded and offered to the public, by holding workshops or
by sending speakers to club meetings and other gatherings.
A separate campaign to educate local leaders and elected officials in St. Louis County jurisdictions
and in O’Fallon regarding the economic benefits of diversity should be developed, and they should
be encouraged to participate in countywide or regional initiatives. The campaign should identify
and publicize local examples of success, such as that of the Brentwood School District which has
taken a deliberate approach of embracing diversity.
Impediment: Unreasonably Restrictive Definitions of “Family” and Related Occupancy
Permitting Requirements
In the sample of municipal zoning codes reviewed in conjunction with this AI, many were found to
have restrictive definitions of “family,” unreasonably restricting the number of unrelated people
permitted to live together in a housing unit. For example, in 2006, the City of Black Jack settled a
suit (Loving v. City of Black Jack) that arose out of the denial of an occupancy permit for a household
that, under the city’s code, exceeded the limit of three unrelated members.
The impact of these restrictive definitions found in local zoning codes is amplified by occupancy
permitting requirements. In Florissant, O’Fallon, and in many other communities in the study area,
a permit must be obtained from the municipal government for the number of persons occupying a
housing unit. Changes in the household composition (i.e. the number of occupants) require a new
permit. In addition, some municipalities require proof of legal residency in order to obtain an
occupancy permit. In this way, communities are able to control, by approval or denial of a permit,
who may live in their jurisdiction, expressly limiting fair housing choice. It should be noted that St.
11
Louis County’s zoning code affects only unincorporated areas of the county and that the county
government has no control over municipal ordinances.
Recommendations:
The entitlement communities should explore the opportunity to partner with a local university for
a review of occupancy permit requirements, family definitions, and zoning ordinances (including
regulations regarding group homes and residential treatment centers) in all St. Louis County
jurisdictions and in O’Fallon. This work could be led by a professor with research support from
public policy or planning graduate students. When the review is complete, the results should be
presented to a panel of community representatives, representing various stakeholder groups
(including planners, zoning officials, fair housing advocates, and advocates for immigrants) who
should then advocate ordinance revisions where appropriate.
Impediment: Limited Housing Options for People with Disabilities
In both the sample set of municipal zoning codes reviewed as part of this AI and in the review of fair
housing-related lawsuits for jurisdictions in the study area, ordinance and policy provisions often
restricted housing choice for people with disabilities. In half of the zoning codes reviewed, a spacing
requirement was imposed between group homes for people with disabilities. Such requirements,
when applied to housing for people with disabilities but not to housing types occupied by others,
has potential to violate the Fair Housing Act. Of the zoning codes reviewed none provided a clear
and objective process by which persons with disabilities may request a reasonable accommodation
to zoning, land use, and other regulatory requirements. Further, the codes in the sample set also
restricted residential treatment facilities only to non-residential zones. Under federal law, it is
discriminatory to deny an individual or entity the right to site a treatment program in a residential
zone because it will serve individuals with alcohol or other drug problems. Particularly in Florissant
and St. Louis County, the age of the housing stock also may limit the availability of housing units
accessible to people with disabilities, as older housing units are less likely to have been built to
modern accessibility or visitability standards.
Recommendations:
It is recommended that St. Louis County, Florissant, and O’Fallon meet with disability advocates to
better understand types and locations of units missing from the current accessible housing stock
and to identify best practices for or examples of design of accessible units. For housing
developments with public funding, prioritize those that meet these identified needs. For other
private/market-rate projects, educate developers about and encourage them to consider these
needs.
Density bonuses or other incentives for projects built according to universal design principles such
that all units are handicap accessible would open up new housing options and increase housing
choice. For residential developments competing for public funding, those that offer universal
12
design, or that otherwise exceed FHA minimum accessibility requirements (either in number of
accessible units provided and/or in the design of these units) should be prioritized.
Regarding reasonable accommodation standards, model ordinances are available that have been
approved by HUD or the DOJ as part of fair housing settlement or conciliation agreements. These
models should be compiled by a regional organization and advocated to local municipalities.
Impediment: Private Sector Lending Discrimination
Since 2005, two significant lawsuits have been filed against banks operating in or headquartered in
St. Louis County alleging discrimination on the basis of race and color in lending. Specifically, banks
in these two cases were said to have intentionally declined to provide loans to African Americans
or within predominantly African American communities. In both of these lawsuits, the banks
involved denied wrongdoing and settled the suits to avoid litigation. However, the similarities
between the two cases, the specific racial group denied loans, and the unwillingness to make loans
within specific communities raises important issues of fair housing choice.
Recommendations:
The Metropolitan St. Louis Equal Housing Opportunity Council (EHOC) and SLEHCRA have been
working to pressure lenders to stop disinvestment in areas with majority-minority populations and
reinvest in these regions. In fact, EHOC was involved in both of the cited lawsuits, as a plaintiff in
one and an informant in the other. This investigative and advocacy work should be supported by
the entitlement communities. Additionally, these or other local organizations should be funded and
charged with fair housing education and testing efforts as well as periodic review and analysis of
lending data provided by banks and other lenders under the Home Mortgage Disclosure Act.
Publicly praise or otherwise recognize financial institutions with a record of supporting fair housing
initiatives. For County and City financial business, give banks that have not supported fair housing
goals a low priority.
Impediment: Difficulties with Fair Housing Compliance from Small-Scale Landlords
Some stakeholders interviewed in the course of this analysis noted that acts of housing
discrimination are more prevalent in the study area from small-scale landlords who own or manage
very limited numbers of housing units. Survey results, while quite limited, provide some anecdotal
support for this perspective: of the four respondents who reported having faced housing
discrimination, all of them named a landlord or property manager as the perpetrator of the
discrimination.
Recommendations:
As recommended in the 2012 St. Louis County Housing Study, more outreach and training is needed
to educate rental property owners and managers on the requirements of the Fair Housing Act, the
definitions of protected classes, discriminatory practices, and potential consequences for non-
compliance. The St. Louis Apartment Association (SLAA) offers education opportunities and could
13
play a coordinating role in the outreach and education of small-scale landlords in the study area.
Support for continued testing by EHOC or a similar organization is also recommended, with capacity
for subsequent legal action if necessary.
14
Executive Summary: City of Florissant
Introduction
Title VIII of the Civil Rights Act of 1968, more commonly known as the Fair Housing Act, ensures
protection of housing opportunity by prohibiting discrimination in the sale or rental of housing on
the basis of race, color, religion, sex, and national origin, and was amended in 1988 to include
familial status and disability. HUD grantees receiving funds under the Community Development
Block Grant (CDBG) program are required to complete a fair housing study, known as an Analysis
of Impediments to Fair Housing Choice (AI) to ensure that housing and urban development
programs are being administered in a way that furthers fair housing for these protected classes. St.
Louis County, the City of Florissant, and the City of O’Fallon participate together in a Consortium for
the purpose of accessing federal affordable housing funds under HUD’s Home Investment
Partnerships Act (HOME) program. Because of the collaborative affordable housing planning
undertaken by the Consortium, the members sought to jointly conduct this AI to provide a
streamlined regional approach to fair housing and to identify and address impediments to fair
housing choice that often do not strictly follow jurisdictional boundaries.
Historical Overview
Florissant was first organized as a civil government in 1786 (then called the Village of San
Fernando), and incorporated as a municipality in 1829. It has been closely associated with religious
activities throughout its history. Blessed Mother Philippine Duchesne was an early settler, founding
a novitiate and an Indian school, and the St. Stanislaus Seminary opened in 1823. As of 2010,
Florissant was the 12th largest city in Missouri with a population of 52,158. It ranked 73 on Money
Magazine’s list of the top 100 Best Places to live in 2012.
Demographic Overview
As of the 2010 Census, Florissant was home to 52,158 people, a gain of 3.3% since 2000. The
majority of the population was White (68.2% as of 2010) and over one-quarter was Black (26.2%).
No other minority group made up more than 3% of the city’s population. Median household income
in Florissant ($51,529) was higher than that of the State of Missouri ($47,333) according to the
2008-2012 American Community Survey.
Florissant had an unemployment rate at about 5% prior to the national recession, climbing to as
high as 10.0% by 2009. By 2013, the rate fell to about 7%, still above the pre-recession level.
Protected Class Analysis
Racial diversity increased substantially in Florissant from 2000 to 2010 as the Black population
grew by 140.5%. Other minority groups also saw strong population growth, although they remained
a low overall share of the city’s population. Looking at racial composition by census tract, the share
15
of African American residents ranges from below 10% in the center of the city, to 40-56% in several
tracts along its northern and eastern borders. No tracts were more than 4% Hispanic.
According to the 2008-2012 American Community Survey, 2.2% of Florissant residents were not
native to the United States, well below the national foreign born population rate of 12.8%. No tract
showed a concentration of foreign-born residents.
As of the 2010 Census, nearly two-thirds of Florissant households were families (65.0%) and 31.8%
had children, down slightly from 32.9% in 2000. Female householders made up 37.7% of total
households, an increase of 18.4% from the previous Census. Households with children and female
householders were not concentrated in any census tracts within Florissant.
The 2008-2012 ACS data shows that 13.9% of the County’s population has a disability. Just over half
(57.9%) of that group are under age 65.
The 2010 U.S. Religion Census: Religious Congregations & Membership Study indicates that 51.7%
of St. Louis County’s population adhere to a religion. Catholics make up the largest share of the
population at 23.1%, followed by Evangelical Protestants (16.3%). Data is not available below the
county level.
Segregation Analysis
Four methodologies (Dissimilarity, Exposure, Isolation, and Entropy indices) for analyzing
segregation were used in this study. A reconciliation of the four indices has shown that, on the whole
in St. Louis County, segregation between Blacks and Whites is high and persistent and Whites tend
to be isolated with only limited exposure to Blacks and other minority groups. Because Florissant
is part of the larger St. Louis County area and levels of segregation, exposure, and isolation within
the city are heavily affected by residential patterns within the County, separate indices were not
calculated for the city itself.
Public Investment & Infrastructure
Several interstate highways connect the St. Louis region, and I-270 passes through Florissant’s
southern edge. Public transit (known as “Metro”) includes a fleet of buses, light rail and paratransit
vehicles that serve Florissant and other parts of St. Louis County.
The quality of public schools within a community can also be a primary driver of housing choice.
Florissant is served by the Ferguson-Florissant and Hazelwood school districts, both of which had
graduation rates relatively in line with the state rate as of the 2013 school year (79.4%, 89.4%, and
85.6%, respectively).
16
Access to Areas of Opportunity
This analysis uses HUD-provided data to evaluate relative opportunity levels on six neighborhood
dimensions (poverty, school proficiency, labor market engagement, jobs access, transit access, and
health hazards exposure). In terms of poverty, school proficiency, and labor market engagement,
opportunity levels in Florissant tend to be above those of many areas in north St. Louis County, but
behind those of the central and southern portions of the county. Florissant has superior transit
access when compared with much of St. Louis County, especially areas outside of I-270. Jobs access
varies throughout the city, but tends to be slightly better in its eastern portion. Health hazards
exposure is uniform throughout Florissant and most of St. Louis County.
Land Use & Zoning
Florissant’s zoning code was reviewed against a set of fair housing criteria and assigned a risk score
(1=low risk; 3=high risk) indicative of its potential to result in housing discrimination. The city’s
overall risk score was 1.61, indicating a moderate risk of its zoning and land use regulations
contributing to discriminatory housing treatment or impeding fair housing choice. Among the
provisions with greatest risk for restricting housing choice are those concerning the means by
which persons with disabilities may make modifications to their homes and provisions restricting
the placement of alcohol and/or drug abuse treatment centers.
Housing Profile
According to the 2008-2012 ACS estimates, Florissant contained a total of 23,793 housing units, of
which the majority were single-family detached units (78.9%); the homeownership rate was 74.0%.
Vacancy rates in the city were substantially lower for ownership units (1.6%) than for rental units
(10.8%). The vast majority of Florissant’s housing stock was built between 1950 and 1979.
Because many protected classes tend to have lower than average incomes, housing affordability
becomes an important aspect of fair housing choice. HUD considers housing affordable if it costs
less than 30% of a family's income. In Florissant, 42.7% of renters have a cost burden, compared to
24.1% of owners. The National Low Income Housing Coalition’s Out of Reach 2014 Annual Report
calculates the amount of income a household must receive in order to afford a rental unit at the Fair
Market Rent (FMR) without spending over 30% of income. A renter at the mean renter income in
St. Louis County would need to keep rent costs at or below $748 to avoid a cost burden. Data is not
available for geographies below the county level.
Fair Housing Organizations & Activities
Florissant is served by several local fair housing, affordable housing, and homeless service
organizations, among them the Equal Housing Opportunity Council (EHOC), Legal Services of
Eastern Missouri, Community Action Agency of St. Louis County, and Catholic Charities. Activities
rent and mortgage assistance, and other housing-related assistance. Survey responses indicate that
additional fair housing education may be needed in the study area, as less than half of participants
(43.1%) indicated knowing their fair housing rights. Few respondents (9) experienced housing
discrimination, but of those that did only 20% reported it.
Housing Discrimination Complaints
Based on responses from fair housing agencies for the 2009-2014 reporting period, 280
discrimination complaints were received for St. Louis County by EHOC and the Missouri
Commission on Human Rights. Allegations of discrimination based on color/race were the most
common (101 complaints). Of the 79 complaints where a transaction area was identified, the
majority were for rental housing (43 complaints), followed by lending (23 complaints), and
discriminatory advertising (11 complaints). The organizations providing this complaint data did
not break down the complaints received by municipality. Accordingly, the number of complaints
filed specifically in the City of Florissant was not available.
Housing Discrimination Lawsuits
A review of the nature, extent, and disposition of significant housing discrimination lawsuits filed
and/or adjudicated between 2005 and May 2014 revealed 5 lawsuits within St. Louis County with
substantial bearing on the availability of fair housing choice. The cases reviewed tend to involve
three fair housing issues: (1) discriminatory lending practices that targeted a protected class; (2)
occupancy limits and restrictive definitions of “family”; and (3) prohibiting residential occupancy
permits for persons who cannot provide proof of citizenship or legal residency. None of these cases
were filed in or against the City of Florissant.
Hate Crimes
As defined by the Hate Crime Statistics Act of 1990 (28 U.S.C. § 534), hate crimes are “crimes that
manifest evidence of prejudice based on race, gender or gender identity, religion, disability, sexual
orientation, or ethnicity.” Because these protected classes significantly overlap those classes
protected under the Fair Housing Act, an examination of data on hate crimes is conducted as part of
this Analysis of Impediments. The FBI’s Uniform Crime Reporting Program data shows that 34
incidences of hate crimes were reported in St. Louis County from 2008 to 2012, but that none of
these reported crimes occurred within Florissant.
Impediments and Recommendations
Impediments identified through this research are summarized below with supporting examples
noted. Each impediment listed is followed by recommendations, the implementation of which will
correct, or begin the process of correcting, the related impediment. It should be noted that these
barriers are largely systemic and will require effort from both private sector and public sector
actors to correct.
18
Impediment: Affordable Housing Options Concentrated in Areas of Low Opportunity
In St. Louis County, affordable housing options, both subsidized and non-subsidized, tend to be
concentrated in urban areas of low opportunity,2 particularly in the North County region which
includes the City of Florissant. This impediment is similar to the OneSTL FHEA’s finding that the
“(l)ocation of affordable housing perpetuates segregation and limits access to opportunity.” In
North County and in the Lemay area, affordable housing exists, sometimes with housing quality
issues, but the ability of area residents to improve economically is challenging. This report’s analysis
of access to areas of opportunity revealed that areas with low opportunity in terms of poverty,
school, proficiency, and labor market engagement are overwhelmingly concentrated in North
County communities. Public input reinforced this finding, with residents commenting that suburban
areas outside St. Louis County tended to have higher performing schools, lower crime rates, and
better housing conditions. Residents of the study area interviewed for this report further cited a
general shortage of Section 8 units available in the County outside the North County area. Still others
named the low quality and deteriorating condition of existing affordable housing units as problems.
Taken together, the relative concentration of housing options affordable to people of low- and
moderate-income (who are disproportionately minorities) in high poverty areas without access to
quality schools and with low rates of labor market participation is an inherent restriction on
housing choice.
Recommendations
Local governments in the study area should partner with the private sector to create more mixed
income housing using available public resources such as the HOME Program, Low Income Housing
Tax Credits, and state or local housings bonds. Equally important could be the creation of a Mixed
Income Housing Investment Program, capitalized by lenders, which would provide incentive
financing to developers who construct sustainable mixed income housing in these regions of the
study area.
For affordable housing developments receiving public subsidy or incentives from a local
government entity (e.g. St. Louis County, Florissant, or other municipalities) the source of public
funds should prioritize projects located in high opportunity areas of the county, especially those
with transit access. To the extent these local government entities can influence the award of tax
credits by the Missouri Housing Development Commission to developers for new affordable
housing projects either through letters of endorsement or the investment of CDBG funds, such
measures should be reserved for those projects in high opportunity areas.
2 This Analysis of Impediments looks at neighborhood opportunity on six dimensions as defined by HUD, including poverty, school proficiency, labor market engagement, access to jobs, access to transit, and exposure to environmental health hazards. The County may choose to use these factors or develop an alternate definition of opportunity based on similar measures of community health.
19
The efforts of groups like Beyond Housing, which focuses on comprehensive community
investments, stand as an example of how improving institutions that generate economic activity
should accompany affordable housing rehabilitation and preservation. If an area and its residents
do not have access to adequate income, rehabilitated housing will become subject to deferred
maintenance and the unit may again contribute to poorer housing quality in that area.
Other existing organizations such as SLEHCRA (St. Louis Equal Housing and Community
Reinvestment Alliance) are already working to improve opportunity in North County areas and
their work should be supported by St. Louis County and Florissant. New bank branches have opened
in low opportunity North County areas (Ferguson, Overland, and Pagedale) with record numbers of
deposits in their first weeks. Positive results like these should be promoted to encourage further
investment in these communities. In areas like North County that are economically distressed, the
types of employment opportunities available can perpetuate the cycle of unemployment and
underemployment. Public and private sector job training programs should be crafted that are
designed to raise the skill levels of area residents to match employment opportunities with better
pay in that area.
Expansion of the Section 8 program to include more units accepting the vouchers throughout St.
Louis County would increase affordable housing options in areas of greater opportunity and is
consistent with one of the recommendations of the 2012 St. Louis County Housing Study. The
County should encourage rental property owners in high opportunity areas to accept Section 8
vouchers through an education program that describes how the vouchers work and includes
testimonials from other local landlords who have had success with the Section 8 program. St. Louis
County and the City of Florissant should also explore the option of offering discounted occupancy
permits and/or expedited inspections for Section 8 landlords, and work with other jurisdictions in
the county who may be willing to offer similar incentives. The St. Louis County Housing Study also
recommended the creation of Voucher Counseling Centers where voucher recipients could be
assisted in locating housing units in locations that might not be concentrated in high poverty areas.
Impediment: NIMBY/Prejudiced Attitudes
Segregation between Black and White residents of the study area is high (dissimilarity index value
of 0.71) and remained unchanged between 2000 and 2010. Whereas studies of other communities
outside the St. Louis region tend to reveal declining levels of racial and ethnic segregation, the issue
in this study area appears to be persistent. Public input and comments received through the Fair
Housing Survey conducted in conjunction with this AI reveal that some residents of the study area
hold strong “Not In My Back Yard” (NIMBY) sentiments as well as attitudes prejudiced against
people of low-income, those residing in subsidized housing, and racial/ethnic minorities.
Recommendations:
Education and awareness is imperative to alleviating NIMBYism and prejudiced attitudes.
Segregatory living patterns and prejudiced personal beliefs and attitudes create negative impacts
20
on social conditions and discourse and can take many years to overcome. In the near term,
education and awareness of the value of diversity and integration is especially important (this was
also recommendation 1.1 in the OneSTL FHEA). The local governments within the study area should
continue to support and work with organizations (such as InvestSTL) dedicated to promoting
diversity throughout metro St. Louis and St. Louis County.
Collaborating with the assigned HUD Office of Fair Housing and Equal Opportunity and/or with local
fair housing advocacy organizations, the entitlement communities should develop an appropriate
diversity and sensitivity awareness curriculum and then make it a mandatory requirement for staff,
subrecipients, and any other entities the County may contract with under its CDBG program. Over
time, the training program should be expanded and offered to the public, by holding workshops or
by sending speakers to club meetings and other gatherings.
A separate campaign to educate local leaders and elected officials in St. Louis County jurisdictions
and in O’Fallon regarding the economic benefits of diversity should be developed, and they should
be encouraged to participate in countywide or regional initiatives. The campaign should identify
and publicize local examples of success, such as that of the Brentwood School District which has
taken a deliberate approach of embracing diversity.
Impediment: Unreasonably Restrictive Definitions of “Family” and Related Occupancy
Permitting Requirements
In the sample of municipal zoning codes reviewed in conjunction with this AI, many were found to
have restrictive definitions of “family,” unreasonably restricting the number of unrelated people
permitted to live together in a housing unit. For example, in 2006, the City of Black Jack settled a
suit (Loving v. City of Black Jack) that arose out of the denial of an occupancy permit for a household
that, under the city’s code, exceeded the limit of three unrelated members.
The impact of these restrictive definitions found in local zoning codes is amplified by occupancy
permitting requirements. In Florissant, O’Fallon, and in many other communities in the study area,
a permit must be obtained from the municipal government for the number of persons occupying a
housing unit. Changes in the household composition (i.e. the number of occupants) require a new
permit. In addition, some municipalities require proof of legal residency in order to obtain an
occupancy permit. In this way, communities are able to control, by approval or denial of a permit,
who may live in their jurisdiction, expressly limiting fair housing choice.
Recommendations:
The entitlement communities should explore the opportunity to partner with a local university for
a review of occupancy permit requirements, family definitions, and zoning ordinances (including
regulations regarding group homes and residential treatment centers) in all St. Louis County
jurisdictions and in O’Fallon. This work could be led by a professor with research support from
public policy or planning graduate students. When the review is complete, the results should be
21
presented to a panel of community representatives, representing various stakeholder groups
(including planners, zoning officials, fair housing advocates, and advocates for immigrants) who
should then advocate ordinance revisions where appropriate.
Impediment: Limited Housing Options for People with Disabilities
In both the sample set of municipal zoning codes reviewed as part of this AI and in the review of fair
housing-related lawsuits for jurisdictions in the study area, ordinance and policy provisions often
restricted housing choice for people with disabilities. In half of the zoning codes reviewed, a spacing
requirement was imposed between group homes for people with disabilities. Such requirements,
when applied to housing for people with disabilities but not to housing types occupied by others,
has potential to violate the Fair Housing Act. Of the zoning codes reviewed none provided a clear
and objective process by which persons with disabilities may request a reasonable accommodation
to zoning, land use, and other regulatory requirements. Further, the codes in the sample set also
restricted residential treatment facilities only to non-residential zones. Under federal law, it is
discriminatory to deny an individual or entity the right to site a treatment program in a residential
zone because it will serve individuals with alcohol or other drug problems. Particularly in Florissant
and St. Louis County, the age of the housing stock also may limit the availability of housing units
accessible to people with disabilities, as older housing units are less likely to have been built to
modern accessibility or visitability standards.
Recommendations:
It is recommended that St. Louis County, Florissant, and O’Fallon meet with disability advocates to
better understand types and locations of units missing from the current accessible housing stock
and to identify best practices for or examples of design of accessible units. For housing
developments with public funding, prioritize those that meet these identified needs. For other
private/market-rate projects, educate developers about and encourage them to consider these
needs.
Density bonuses or other incentives for projects built according to universal design principles such
that all units are handicap accessible would open up new housing options and increase housing
choice. For residential developments competing for public funding, those that offer universal
design, or that otherwise exceed FHA minimum accessibility requirements (either in number of
accessible units provided and/or in the design of these units) should be prioritized.
Regarding reasonable accommodation standards, model ordinances are available that have been
approved by HUD or the DOJ as part of fair housing settlement or conciliation agreements. These
models should be compiled by a regional organization and advocated to local municipalities.
Impediment: Private Sector Lending Discrimination
Since 2005, two significant lawsuits have been filed against banks operating in or headquartered in
St. Louis County alleging discrimination on the basis of race and color in lending. Specifically, banks
22
in these two cases were said to have intentionally declined to provide loans to African Americans
or within predominantly African American communities. In both of these lawsuits, the banks
involved denied wrongdoing and settled the suits to avoid litigation. However, the similarities
between the two cases, the specific racial group denied loans, and the unwillingness to make loans
within specific communities raises important issues of fair housing choice.
Recommendations:
The Metropolitan St. Louis Equal Housing Opportunity Council (EHOC) and SLEHCRA have been
working to pressure lenders to stop disinvestment in areas with majority-minority populations and
reinvest in these regions. In fact, EHOC was involved in both of the cited lawsuits, as a plaintiff in
one and an informant in the other. This investigative and advocacy work should be supported by
the entitlement communities. Additionally, these or other local organizations should be funded and
charged with fair housing education and testing efforts as well as periodic review and analysis of
lending data provided by banks and other lenders under the Home Mortgage Disclosure Act.
Publicly praise or otherwise recognize financial institutions with a record of supporting fair housing
initiatives. For County and City financial business, give banks that have not supported fair housing
goals a low priority.
Impediment: Difficulties with Fair Housing Compliance from Small-Scale Landlords
Some stakeholders interviewed in the course of this analysis noted that acts of housing
discrimination are more prevalent in the study area from small-scale landlords who own or manage
very limited numbers of housing units. Survey results, while quite limited, provide some anecdotal
support for this perspective: of the four respondents who reported having faced housing
discrimination, all of them named a landlord or property manager as the perpetrator of the
discrimination.
Recommendations:
As recommended in the 2012 St. Louis County Housing Study, more outreach and training is needed
to educate rental property owners and managers on the requirements of the Fair Housing Act, the
definitions of protected classes, discriminatory practices, and potential consequences for non-
compliance. The St. Louis Apartment Association (SLAA) offers education opportunities and could
play a coordinating role in the outreach and education of small-scale landlords in the study area.
Support for continued testing by EHOC or a similar organization is also recommended, with capacity
for subsequent legal action if necessary.
23
Executive Summary: City of O’Fallon
Introduction
Title VIII of the Civil Rights Act of 1968, more commonly known as the Fair Housing Act, ensures
protection of housing opportunity by prohibiting discrimination in the sale or rental of housing on
the basis of race, color, religion, sex, and national origin, and was amended in 1988 to include
familial status and disability. HUD grantees receiving funds under the Community Development
Block Grant (CDBG) program are required to complete a fair housing study, known as an Analysis
of Impediments to Fair Housing Choice (AI) to ensure that housing and urban development
programs are being administered in a way that furthers fair housing for these protected classes. St.
Louis County, the City of Florissant, and the City of O’Fallon participate together in a Consortium for
the purpose of accessing federal affordable housing funds under HUD’s Home Investment
Partnerships Act (HOME) program. Because of the collaborative affordable housing planning
undertaken by the Consortium, the members sought to jointly conduct this AI to provide a
streamlined regional approach to fair housing and to identify and address impediments to fair
housing choice that often do not strictly follow jurisdictional boundaries.
Historical Overview
The City of O’Fallon is located in St. Charles County in eastern Missouri, approximately 35 miles
west of downtown St. Louis. It was founded in 1856 by German immigrants and incorporated in
1912. By 2010, its population reached 79,329, and in 2012 it was ranked 39 in Money Magazine’s
top 100 places to live.
Demographic Overview
O’Fallon’s 2010 population of 79,329 residents represented a 71.8% expansion since 2000. The vast
majority of the city’s population is non-Hispanic White (88.2%). Black residents make up 4.0% of
the population, Asians make up 3.1%, and no other minority group constitutes more than 3% of
total residents.
Median household income in O’Fallon is high at $77,210, well above the State of Missouri median of
$47,333, according to the 2008-2012 American Community Survey. Unemployment in O’Fallon has
typically been below that of St. Louis County. The city’s unemployment rate was at about 4% prior
to the recession, and grew to over 7% by 2009, then dropped to around 5% by 2013. According to
2012 estimates, educational services, health care, and social assistance employees represent the
largest shares of workers (21.7% of the total) in St. Charles County, which includes the City of
O’Fallon.
24
Protected Class Analysis
The City of O’Fallon is, and has historically been, considerably less diverse than St. Louis County.
Black residents made up 4.0% of the population as of 2010, Asians made up 3.1%, and Hispanics
constituted 2.7%. At the tract level, no racial or ethnic concentrations exist in O’Fallon. No tract is
more than 10% African American or 6% Hispanic. According to the 2008-2012 American
Community Survey, 3.9% of O’Fallon residents were not native to the United States, well below the
national foreign born population rate of 12.8%. No tract had a concentration of non U.S. native
residents.
As of the 2010 Census, 44.2% of O’Fallon households included children, down from 52.3% in 2000.
Female householders made up 23.3% of total households, an increase of 150.4% from the previous
Census.
The 2008-2012 ACS data shows that 8.6% of the County’s population has a disability. The majority
(63.9%) of that group are under age 65.
The 2010 U.S. Religion Census: Religious Congregations & Membership Study indicates that 51.7%
of St. Charles County’s population adheres to a religion. Catholics make up the largest share of the
population at 23.7%, followed by Evangelical Protestants (20.0%). Religious composition is not
available below the county level.
Segregation Analysis
Four methodologies (Dissimilarity, Exposure, Isolation, and Entropy indices) for analyzing
segregation were used in this study. A reconciliation of the four indices has shown that, in O’Fallon,
the low level of diversity citywide (88.2% of the population is non-Hispanic White) means that
minority residents tend to have high exposure to Whites, while Whites have low exposure to
minorities. Residential patterns within O’Fallon are similar regardless of race or ethnicity, resulting
in low levels of segregation. At the tract-level, diversity is low but shows little variation throughout
the city.
Public Investment & Infrastructure
Several interstate highways connect the St. Louis region, and I-70 and I-64 run through O’Fallon.
Public transit does not serve O’Fallon, and lack of transit accessibility was mentioned frequently
among stakeholders and survey respondents as an issue for some protected class members.
Increasing regional connectivity was also identified as a key theme for the East-West Gateway
Council of Government’s OneSTL plan.
The quality of public schools within a community can also be a primary driver of housing choice.
O’Fallon is served by three public school districts; for all three, graduation rates were above the
statewide rate as of 2013.
25
Access to Areas of Opportunity
This analysis uses HUD-provided data to evaluate relative opportunity levels on six neighborhood
dimensions (poverty, school proficiency, labor market engagement, jobs access, transit access, and
health hazards exposure). Comparisons are also made between opportunity level for residents by
race and ethnicity. In O’Fallon, access to opportunity is not related to race/ethnicity – White, Black,
and Hispanic residents tend to live in areas with similar levels of opportunity. Labor market
engagement, health hazards exposure, and transit access are even throughout O’Fallon, while school
proficiency is slightly higher in southern parts of the city. Jobs access and poverty levels vary
citywide.
Land Use & Zoning
O’Fallon’s zoning code was reviewed against a set of fair housing criteria and assigned a risk score
(1=low risk; 3=high risk) indicative of its potential to result in housing discrimination. The city’s
overall risk score was 1.61, indicating a moderate risk of its zoning and land use regulations
contributing to discriminatory housing treatment or impeding fair housing choice. Among the
provisions with greatest risk for restricting housing choice are those concerning the means by
which persons with disabilities may make modifications to their homes and provisions restricting
the placement of substance abuse facilities.
Housing Profile
According to the 2008-2012 ACS estimates, O’Fallon contained a total of 29,261 housing units, of
which the majority were single-family detached units (75.4%); the homeownership rate was 82.9%.
Vacancy rates in the city were substantially lower for ownership units (2.1%) than for rental units
(9.0%). The vast majority of O’Fallon’s housing stock was constructed since 1979, reflecting the
rather recent growth of this suburban area.
Because many protected classes tend to have lower than average incomes, housing affordability
becomes an important aspect of fair housing choice. HUD considers housing affordable if it costs
less than 30% of a family's income. In O’Fallon, 38.6% of renters have a cost burden, compared to
21.9% of owners. The National Low Income Housing Coalition’s Out of Reach 2014 Annual Report
calculates the amount of income a household must receive in order to afford a rental unit at the Fair
Market Rent (FMR) without spending over 30% of income. A renter at the mean renter income in
St. Charles County (the smallest geography for which data is available) would need to keep rent
costs at or below $542 to avoid a cost burden.
Fair Housing Organizations & Activities
O’Fallon is served by several local fair housing, affordable housing, and homeless service
organizations, among them the Equal Housing Opportunity Council (EHOC), Legal Services of
Eastern Missouri, and Catholic Charities. Activities include fair housing testing, complaint
26
investigation, fair housing education, transitional housing, rent and mortgage assistance, and other
housing-related assistance. Survey responses indicate that additional fair housing education may
be needed in the study area, as less than half of participants (43.1%) indicated knowing their fair
housing rights. Few respondents (9) experienced housing discrimination, but of those that did only
20% reported it.
Housing Discrimination Complaints
Based on responses from fair housing agencies for the 2009-2014 reporting period, 31
discrimination complaints were received in O’Fallon. Among the complaints received by the
Missouri Commission on Human Rights (MCHR), allegations of discrimination based on color/race
were the most common (15 complaints), although a basis was not listed for all complaints. A “no
cause” finding was issued in 10 of the 27 complaints received by MCHR; two were settled with
benefits and one resulted in successful conciliation.
Housing Discrimination Lawsuits
A review of the nature, extent, and disposition of significant housing discrimination lawsuits filed
and/or adjudicated between 2005 and May 2014 within O’Fallon revealed no suits filed in or against
the city. In nearby St. Louis County, there were 5 lawsuits with substantial bearing on the availability
of fair housing choice. The cases reviewed tend to involve three fair housing issues: (1)
discriminatory lending practices that targeted a protected class; (2) occupancy limits and restrictive
definitions of “family”; and (3) prohibiting residential occupancy permits for persons who cannot
provide proof of citizenship or legal residency.
Impediments and Recommendations
Impediments identified through this research are summarized below with supporting examples
noted. Each impediment listed is followed by recommendations, the implementation of which will
correct, or begin the process of correcting, the related impediment. It should be noted that these
barriers are largely systemic and will require effort from both private sector and public sector
actors to correct.
Impediment: Imbalance Between Job Centers and Affordable Housing Options
Compared to other communities in the study area, in O’Fallon, there is relatively little available
affordable housing. The rapid growth of O’Fallon and St. Charles County has occurred at the same
time that North St. Louis County has declined in population and economic prosperity. Much of the
economic expansion in O’Fallon has been as a result of the construction of higher cost housing and
the retail infrastructure that supports households with higher incomes. As a result, the City contains
many service-sector jobs, but the lack of affordable housing makes it difficult for people holding
these jobs to live in proximity to them. Because there isn’t adequate affordable housing for the City’s
workforce, the housing options for lower-wage workers tend to be limited.
27
Recommendations:
The construction of new affordable and/or mixed-income housing would accomplish the goal of
increased economic opportunity and greater standard housing available for a more diverse
population. A Housing Market Analysis should be prepared for O’Fallon to provide reliable
information to guide public policymakers and private investors in determining whether and where
affordable and/or mixed-income housing projects are feasible, what types of public and private
financing would be needed, and a potential timeline for development.
Density bonuses, fee waivers or other incentives for development of workforce or mixed-income
housing could spur investment and development. Finally, education for city council members and
other local leaders on the benefits of providing a range of housing options, including housing for the
local workforce could result in additional support for these initiatives.
Impediment: NIMBY/Prejudiced Attitudes
Segregation between Black and White residents of the study area is high (dissimilarity index value
of 0.71) and remained unchanged between 2000 and 2010. Whereas studies of other communities
outside the St. Louis region tend to reveal declining levels of racial and ethnic segregation, the issue
in this study area appears to be persistent. Public input and comments received through the Fair
Housing Survey conducted in conjunction with this AI reveal that some residents of the study area
hold strong “Not In My Back Yard” (NIMBY) sentiments as well as attitudes prejudiced against
people of low-income, those residing in subsidized housing, and racial/ethnic minorities.
Recommendations:
Education and awareness is imperative to alleviating NIMBYism and prejudiced attitudes.
Segregatory living patterns and prejudiced personal beliefs and attitudes create negative impacts
on social conditions and discourse and can take many years to overcome. In the near term,
education and awareness of the value of diversity and integration is especially important (this was
also recommendation 1.1 in the OneSTL FHEA). The local governments within the study area should
continue to support and work with organizations (such as InvestSTL) dedicated to promoting
diversity throughout metro St. Louis and St. Louis County.
Collaborating with the assigned HUD Office of Fair Housing and Equal Opportunity and/or with local
fair housing advocacy organizations, the entitlement communities should develop an appropriate
diversity and sensitivity awareness curriculum and then make it a mandatory requirement for staff,
subrecipients, and any other entities the County may contract with under its CDBG program. Over
time, the training program should be expanded and offered to the public, by holding workshops or
by sending speakers to club meetings and other gatherings.
A separate campaign to educate local leaders and elected officials in St. Louis County jurisdictions
and in O’Fallon regarding the economic benefits of diversity should be developed, and they should
be encouraged to participate in countywide or regional initiatives. The campaign should identify
28
and publicize local examples of success, such as that of the Brentwood School District which has
taken a deliberate approach of embracing diversity.
Impediment: Unreasonably Restrictive Definitions of “Family” and Related Occupancy
Permitting Requirements
While O’Fallon’s zoning code was not determined to be restrictive relative to its “family” definition,
many other municipalities in the study area were found to have definitions that unreasonably
restrict the number of unrelated people permitted to live together in a housing unit. In these
jurisdictions, the impact of the restrictive definitions found in local zoning codes is amplified by
occupancy permitting requirements. Communities in the study area commonly require that a
permit be obtained from the municipal government for the number of persons occupying a housing
unit. O’Fallon requires an occupancy permit and inspection for rental housing units, but the permit
is not based on the number of people occupying a housing unit. While the occupancy permitting
policy is intended to ensure the quality of the city’s rental housing stock, it also gives the city the
ability to control, by approval or denial of a permit, who may live in their jurisdiction, expressly
limiting fair housing choice.
Recommendations:
The entitlement communities should explore the opportunity to partner with a local university for
a review of occupancy permit requirements, family definitions, and zoning ordinances (including
regulations regarding group homes and residential treatment centers) in all St. Louis County
jurisdictions and in O’Fallon. This work could be led by a professor with research support from
public policy or planning graduate students. When the review is complete, the results should be
presented to a panel of community representatives, representing various stakeholder groups
(including planners, zoning officials, fair housing advocates, and advocates for immigrants) who
should then advocate ordinance revisions where appropriate.
Impediment: Limited Housing Options for People with Disabilities
In both the sample set of municipal zoning codes reviewed as part of this AI and in the review of fair
housing-related lawsuits for jurisdictions in the study area, ordinance and policy provisions often
restricted housing choice for people with disabilities. In half of the zoning codes reviewed, a spacing
requirement was imposed between group homes for people with disabilities. Such requirements,
when applied to housing for people with disabilities but not to housing types occupied by others,
has potential to violate the Fair Housing Act. Of the zoning codes reviewed none provided a clear
and objective process by which persons with disabilities may request a reasonable accommodation
to zoning, land use, and other regulatory requirements. Further, the codes in the sample set also
restricted residential treatment facilities only to non-residential zones. Under federal law, it is
discriminatory to deny an individual or entity the right to site a treatment program in a residential
zone because it will serve individuals with alcohol or other drug problems. Particularly in Florissant
and St. Louis County, the age of the housing stock also may limit the availability of housing units
29
accessible to people with disabilities, as older housing units are less likely to have been built to
modern accessibility or visitability standards.
Recommendations:
It is recommended that St. Louis County, Florissant, and O’Fallon meet with disability advocates to
better understand types and locations of units missing from the current accessible housing stock
and to identify best practices for or examples of design of accessible units. For housing
developments with public funding, prioritize those that meet these identified needs. For other
private/market-rate projects, educate developers about and encourage them to consider these
needs.
Density bonuses or other incentives for projects built according to universal design principles such
that all units are handicap accessible would open up new housing options and increase housing
choice. For residential developments competing for public funding, those that offer universal
design, or that otherwise exceed FHA minimum accessibility requirements (either in number of
accessible units provided and/or in the design of these units) should be prioritized.
Regarding reasonable accommodation standards, model ordinances are available that have been
approved by HUD or the DOJ as part of fair housing settlement or conciliation agreements. These
models should be compiled by a regional organization and advocated to local municipalities.
Impediment: Need for Alternative Transportation Options
Transportation links are essential components to successful fair housing. The issue at hand
regarding transportation and fair housing choice revolves around the ease with which a resident
can travel from home to work if he or she lives in a lower income area or an area of minority
concentration. Residents who do not have access to commercial areas are limited in where they can
shop for goods and services, as well as seek employment. The reverse is true as well. A lack of
transportation options limits the selection of housing to neighborhoods within walking or biking
distance of employers and disproportionately affects low-income, disabled, and elderly residents.
There is no system of public transportation serving O’Fallon or greater St. Charles County. Public
input received in the process of developing this AI repeatedly cited the lack of transportation
alternatives as an important factor limiting the housing choices of people either living or working
in O’Fallon. It was not uncommon for participants to share the view that, for people without a
personal vehicle, living in O’Fallon simply was not a viable choice.
Recommendations:
The City’s Public Assistance Department should routinely review transportation planning efforts
carried out by other City departments, the regional council of governments, and other planning
bodies for opportunities to advocate public infrastructure improvements that align with the goal of
expanding housing choice.
30
It is recommended that the City convene a group of service providers, Planning & Development staff,
business leaders, and other local stakeholders to identify top transit needs (e.g. connections to the
City of St. Louis, to St. Louis County, to job centers in general, or simply transit within O’Fallon, etc.),
level of need, and locations of transit dependent populations in O’Fallon. If improved connectivity
with St. Louis is identified as a need, the City is advised to meet with a Metro representative to
determine what role it may play.
Given the size of O’Fallon, a full-scale public transit system is unlikely to be feasible, however there
are intermediate options (such as demand-response systems, vanpools, and transit management
organizations) that could provide needed connections for the City’s residents and workforce. A
survey of similarly-sized suburban cities should be conducted to identify successful transit
programs in comparable jurisdictions.
31
Introduction
Equal access to housing choice is a cornerstone principle of America’s commitment to equality and
opportunity for all. Title VIII of the Civil Rights Act of 1968, more commonly known as the Fair
Housing Act, ensures protection of housing opportunity by prohibiting discrimination in the sale or
rental of housing on the basis of race, color, religion, sex, and national origin. The Act was amended
in 1988 to provide stiffer penalties, establish an administrative enforcement mechanism and to
expand its coverage to prohibit discrimination on the basis of familial status and disability. The U.S.
Department of Housing and Urban Development (HUD), and specifically HUD’s Office of Fair
Housing and Equal Opportunity (FHEO), is responsible for the administration and enforcement of
the Fair Housing Act and other civil rights laws.
Provisions to affirmatively further fair housing (AFFH) are principal and long-standing components
of HUD’s housing and community development programs. These provisions flow from the mandate
of Section 808(e)(5) of the Fair Housing Act which requires the Secretary of HUD to administer the
Department’s housing and urban development programs in a manner to affirmatively further fair
housing.3 A fair housing study, known as an Analysis of Impediments to Fair Housing Choice (AI), is
required of HUD grantees, such as St. Louis County and the Cities of Florissant and O’Fallon,
receiving funds under the Community Development Block Grant (CDBG) program. To perform this
Analysis of Impediments, the grantees contracted with WFN Consulting.
St. Louis County (consisting of unincorporated County and 78 municipalities participating in the
CDBG program), the City of Florissant, and the City of O’Fallon (in neighboring St. Charles County)
participate together in a Consortium for the purpose of accessing federal affordable housing funds
under HUD’s Home Investment Partnerships Act (HOME) program. Because of the collaborative
affordable housing planning undertaken by the Consortium, the members sought to jointly conduct
this AI to provide a streamlined regional approach to fair housing and to identify and address
impediments to fair housing choice that often do not strictly follow jurisdictional boundaries.
The regional approach to fair housing planning embodied in this AI makes smart use of limited
resources and results in an analysis of fair housing policy for governments and organizations
throughout the region. By conducting a regional analysis, the communities represented by the
Consortium will have the informational basis from which to promote fair housing choices for all
persons, provide opportunities for racially and ethnically inclusive patterns of housing occupancy,
identify structural and systemic barriers to fair housing choice, and promote housing that is
physically accessible and usable by persons with disabilities. By analyzing and taking actions to
address identified impediments, the members of the Consortium can meet their obligations and
certifications to HUD to affirmatively further fair housing.
3 U.S. Department of Housing and Urban Development Office of Fair Housing and Equal Opportunity. Fair Housing Planning Guide: Volume 1 (Chapter 1: Fair Housing Planning Historical Overview, Page 13). March 1996.
32
Definitions & Data Sources
Definitions
Affirmatively Further Fair Housing – In keeping with the latest proposed guidance from HUD, to
Affirmatively Further Fair Housing Choice (AFFH) is to comply with “the 1968 Fair Housing Act’s
obligation for state and local governments to improve and achieve more meaningful outcomes from
fair housing policies, so that every American has the right to fair housing, regardless of their race,
color, national origin, religion, sex, disability or familial status.”4
Fair Housing Choice - In carrying out its Analysis of Impediments to Fair Housing Choice, the
Consortium utilized the following definition of “Fair Housing Choice”:
The ability of persons of similar income levels to have available to them the same housing
choices regardless of race, color, religion, sex, national origin, familial status, or handicap.
Impediments to Fair Housing Choice - As adapted from the Fair Housing Planning Guide,
impediments to fair housing choice are understood to include: 5
Any actions, omissions, or decisions taken because of race, color, religion, sex, disability,
familial status, or national origin which restrict housing choices or the availability of housing
choices.
Any actions, omissions, or decisions which have the effect of restricting housing choices or
the availability of housing choices on the basis of race, color, religion, sex, disability, familial
status, or national origin.
Protected Classes - In carrying out its Analysis of Impediments to Fair Housing Choice, the
Consortium utilized the following definition of Protected Classes:
Title VIII of the Civil Rights Act of 1968 prohibits housing discrimination based on race, color,
national origin or ancestry, sex, or religion. The 1988 Fair Housing Amendments Act added
familial status and mental and physical handicap as protected classes.
Affordable - Though local definitions of the term may vary, the definition used throughout this
analysis is congruent with HUD’s definition:
HUD defines as "affordable" housing that costs no more than 30% of a household's total
monthly gross income. For rental housing, the 30% amount would be inclusive of any tenant-
paid utility costs.
For homeowners, the 30% amount would include the mortgage payment, property taxes,
homeowners insurance, and any homeowners’ association fees.
4 U.S. Department of Housing and Urban Development. “HUD Publishes New Proposed Rule on Affirmatively Furthering Fair Housing Choice.” Press Release No. 13-110. July 19, 2013.. 5 U.S. Department of Housing and Urban Development Office of Fair Housing and Equal Opportunity. Fair Housing Planning Guide: Volume 1 (Chapter 2: Preparing for Fair Housing Planning, Page 2-17). March 1996.
33
Housing affordable to a low-income family of four (income up to 80% of the area median
income) residing in the study area would carry a total monthly cost not exceeding $1,384 as
reported by the National Low Income Housing Coalition’s 2013 Out of Reach data.
Data Sources Used in This Analysis
Decennial Census Data – Data collected by the Decennial Census for 2010 and 2000 is used in
this Assessment (older Census data is only used in conjunction with more recent data in order to
illustrate trends). The Decennial Census data is used by the U.S. Census Bureau to create several
different datasets:
2010 and 2000 Census Summary File 1 (SF 1) – This dataset contains what is known as “100
percent data”, meaning that it contains the data collected from every household that
participated in the 2010 Census and is not based on a representative sample of the
population. Though this dataset is very broad in terms of coverage of the total population, it
is limited in the depth of the information collected. Basic characteristics such as age, sex, and
race are collected, but not more detailed information such as disability status, occupation,
and income. The statistics are available for a variety of geographic levels with most tables
obtainable down to the census tract or block level.
2000 Census Summary File 3 (SF 3) – Containing sample data from approximately one in
every six U.S. households, this dataset is compiled from respondents who received the “long
form” Census survey. This comprehensive and highly detailed dataset contains information
on such topics as ancestry, level of education, occupation, commute time to work, and home
value. The SF 3 dataset was discontinued for the 2010 Census; therefore, SF 3 data from the
2000 Census was the only tract-level data source available for some variables.
American Community Survey (ACS) – The American Community Survey is an ongoing statistical
survey that samples a small percentage of the U.S. population every year, thus providing
communities with more current population and housing data throughout the 10 years between
censuses. This approach trades the accuracy of the Decennial Census Data for the relative
immediacy of continuously polled data from every year. ACS data is compiled from an annual sample
of approximately 3 million addresses rather than an actual count (like the Decennial Census’s SF 1
data) and therefore is susceptible to sampling errors. This data is released in two different formats:
single-year estimates and multi-year estimates.
2012 ACS 1-Year Estimates – Based on data collected between January 2012 and December
2012, these single-year estimates represent the most current information available from the
U.S. Census Bureau, however; these estimates are only published for geographic areas with
populations of 65,000 or greater.
ACS Multi-Year Estimates – More current than Census 2010 data and available for more
geographic areas than the ACS 1-Year Estimates, this dataset is one of the most frequently
34
used. Because sampling error is reduced when estimates are collected over a longer period
of time, 5-year estimates will be more accurate (but less recent) than 3-year estimates. ACS
datasets are published for geographic areas with populations of 20,000 or greater. The 2008-
2012 ACS 5-year estimates are used most often in this assessment.
Previous Works of Research – This AI is supported by, and in some cases builds upon, previous
works of significant local research conducted for or within the St. Louis region. These include the
following:
Analysis of Impediments to Fair Housing Choice in St. Louis County, Unincorporated Areas
of St. Louis County, Florissant, St. Charles County, O’Fallon, and St. Peters – This 2009
document was prepared by the RegionWise Research Center in the Department of Public
Policy and the Law Clinic of St. Louis University. The study is the immediate predecessor to
this AI and assesses fair access to housing throughout each geography, and identifies
impediments to housing choice. Elements include demographic and economic analyses,
assessments of mortgage lending, housing complaints and fair housing resources, an
identification of impediments, and recommendations for overcoming these impediments.
St. Louis County Housing Study – This May 2012 study was prepared by Development
Strategies for the St. Louis County Office of Community Development and the East-West
Gateway Council of Governments. The study focuses on affordable housing in St. Louis
County and its role in countering poverty. Foreclosures as well as the condition and quality
of the county’s rental housing stock are specifically analyzed.
OneSTL – Many Communities. One Future. – Coordinated by the East-West Gateway Council
of Governments, this collaborative December 2013 report is the outcome of the region’s $4.7
million award under HUD’s Sustainable Communities Regional Planning Grant program. The
plan outlines a vision for a prosperous, healthy, and vibrant St. Louis region and identifies
resources for achieving the vision.
OneSTL Fair Housing Equity Assessment – Prepared by the Metropolitan St. Louis Equal
Housing Opportunity Council, this July 2013 assessment addresses issues of racial
disparities and access to opportunities throughout the St. Louis region. The study involves
data analysis, evaluation, and engagement of data so as to inform strategy development and
planning for more inclusive and sustainable communities.
Stakeholder Engagement
Fair Housing Survey – This survey was designed to collect input from a broad spectrum of the
community and received responses from residents across the study area. The survey consisted of
32 distinct questions, allowing a mixture of both multiple choice and open-ended responses. In all,
there were 57 responses to this survey, though not every question was answered by every
respondent. As a result, where a percentage of survey respondents is cited in this assessment, it
35
refers only to the percentage of respondents to the particular question being discussed and may not
be a percentage of the full 57 survey respondents. Surveys were received over a 43-day period,
from April 7, 2014 to May 19, 2014. Paper surveys received were manually entered by the Survey
Administrator into SurveyMonkey for tabulation and analysis. To prevent “ballot stuffing,” the
SurveyMonkey software bars the submission of multiple surveys from a single IP address. The link
to the online survey was distributed through various email distribution lists and posted on the
websites of Consortium members and at www.stlouisfairhousing.com, a site designed for the AI
project. A Spanish translation of the same survey was also made available in hard copy and online.
The Spanish version of the survey did not receive any responses.
Project Website - To promote the Analysis of Impediments process with local residents and other
stakeholders, WFN Consulting prepared a website dedicated to the project
(www.stlouisfairhousing.com). The site included an overview of the project, the public meeting
schedule, links to English and Spanish versions of the fair housing survey, an opportunity to provide
comments, and links to more information about fair housing. The site was included in public
meeting notices, advertised at public meetings, and provided in email correspondence with
stakeholder interview participants. The site had 294 unique visitors during the project period, and
one comment was received through it.
Stakeholder Interviews – Key community stakeholders were identified, contacted, and
interviewed either individually or in small groups as part of this Analysis. These stakeholders
included elected officials, representatives of nonprofit organizations, municipal and county staff,
fair housing advocates, lenders, and real estate agents. Other stakeholders not belonging to any of
these groups were occasionally interviewed as dictated by the course of research carried out for
this Analysis. More than 30 stakeholder interviews were conducted.
Public Meetings – Five public meetings were held in order to provide forums for residents of the
study area and other interested parties to contribute to this AI. Meeting dates, times, and locations
are listed below. Meetings were held both during the day and in the evenings in various locations
across the region, providing a variety of options for residents to attend. These meetings were
advertised via flyers and emails distributed by the Consortium members using their various email
distribution lists. The format of these meetings ranged from small-group roundtable discussions to
moderated forums. In several cases, AI education and input opportunities were added to the
agendas of existing community meetings and workshops. Notes were taken of the public comments
at all meetings.
Public Kickoff Meeting
(St. Louis County & Florissant)
St. Louis County Building
Clayton, MO
Tuesday, April 8, 2014
2:00 p.m.
36
Florissant Neighborhood Meeting
(in conjunction with the City’s annual Home Improvement Program Seminar)
Florissant Government Building
Florissant, MO
Tuesday, April 8, 2014
6:00 p.m.
O’Fallon Neighborhood Meeting
O’Fallon City Hall Gymnasium
O’Fallon, MO
Tuesday, April 8, 2014
6:00 p.m.
Public Kickoff Meeting
(O’Fallon)
O’Fallon City Council Chambers
O’Fallon, MO
Wednesday, April 9, 2014
2:00 p.m.
Lemay Neighborhood Meeting
(in conjunction with the Broadway & Ripa Public Input Meeting)
Maria Center at the School Sisters of Notre Dame
Lemay, MO
Wednesday, April 9, 2014
6:00 p.m.
37
Limitations of this Analysis
This Analysis of Impediments to Fair Housing Choice was prepared by WFN Consulting for St. Louis
County, the City of Florissant, and the City of O’Fallon. This report seeks to analyze the current fair
housing climate in the region, identify impediments to fair housing choice and equity, and set forth
recommended strategies for overcoming the identified impediments. Some of the impediments
identified in this report will require additional research and on-going analysis by entities within the
region. This report does not constitute a fair housing action plan or any other type of community
plan, however, it should be a key resource to inform such plans as they are developed.
HUD’s primary guidance for developing Analyses of Impediments is found in the Fair Housing
Planning Guide, published in 1996. Since that time, HUD’s approach to fair housing has greatly
evolved and formal guidance has largely yet to catch up. In 2013, HUD released a new proposed rule
titled “Affirmatively Furthering Fair Housing” that outlines significant changes to the development
of local fair housing studies. Because this proposed rule has yet to be finalized, the methodology and
components of this AI, to the greatest extent possible, meet both the revised criteria of the proposed
rule as well as the traditional AI requirements found in the Fair Housing Planning Guide.
Large portions of this analysis rely upon Census data reported at the census tract level. Census tracts
do not follow municipal boundaries, meaning the tracts used may include both residents and non-
residents of the subject municipality. Erring on the side of inclusivity, this research considered data
from all census tracts containing even a portion of the subject municipality. By this approach, every
resident of the municipality is represented, along with some who reside outside the city limits. The
authors found this preferable to methodologies that would have excluded non-residents at the
expense of also excluding some residents of the subject municipality.
Though licensed attorneys with land use and fair housing experience have participated in the
research contained herein, no portion of this Analysis shall constitute or be relied upon as legal
advice or as a legal opinion.
Throughout this analysis, the authors have made careful decisions regarding which datasets to use.
The choice of a dataset often involves tradeoffs between criteria. For example, more recent datasets
often have a limited number of data variables available for analysis. Additionally, there is the
unavoidable tradeoff between geographic and socio-economic detail (less detailed data for smaller
geographies) that sometimes restricts the availability of data. Also, the detailed definitions of data
variables can change over time limiting their comparability.
Finally, all source data used in the preparation of this analysis, whether from national sources (e.g.
the U.S. Census Bureau), local sources (e.g. the OneSTL plan), or from proprietary sources (e.g. the
National Low Income Housing Coalition’s Out of Reach report) is assumed to be accurate.
38
Historical Overview
An Introduction to St. Louis County, Missouri
St. Louis County covers an area of 524 square miles, had a 2000 Census population of 1,016,300 and
a 2010 population of 998,954 and the U.S. Bureau of Census estimated the 2012 population at
1,000,473.6 The County is an integral part of the St. Louis Metropolitan Statistical Area (MSA), which
was redefined in June 2003 to consist of eight counties in Missouri and eight counties in Illinois.7
St. Louis County had 16.7% percent of the state’s 2010 population, 48 percent of the jobs in the St.
Louis Metropolitan Area, and 23 percent of the jobs in the State of Missouri.8
St. Louis County contains 91 municipalities which have primary responsibility within their
jurisdictions for such services as public safety, planning and zoning, local street maintenance and
building code enforcement. The unincorporated area, which contains nearly a third of the County’s
population and a third of its area, comes under the direct jurisdiction of County government. The
City of St. Louis has been totally separated from St. Louis County since 1876 under a revision to the
Constitution of the State of Missouri.9
The County’s has 24 independent public school districts, 23 fire protection districts, which share
fire protection responsibilities with the 20 municipal fire departments. Special service districts
provide sewer, library, junior college and cultural facilities within the County. Privately owned
utilities provide electrical, natural gas, water and telephone service.10
St. Louis County History: Early History/Formation of the County11
The City of St. Louis was founded by French settlers from New Orleans in 1764 in what was then
nominally Spanish territory, having been transferred from France to Spain by the Treaty of Paris at
the end of the French and Indian War. The area that is now the City of Florissant became the first
permanent European settlement in the area that is today’s St. Louis County.
The United States purchased the land that is now St. Louis County from France as part of the
Louisiana Purchase in 1803. This action by President Thomas Jefferson represented one of the most
important steps in the formation of the Nation.
6 U.S. Bureau of Census, http://quickfacts.census.gov/qfd/states/29/29189.html 7 St. Louis County Department of Planning, Research and Statistics Division, “St. Louis County, Missouri 2007-2012 Fact Book,” 2012, Pages i, iv. 8 St. Louis County Department of Planning, Research and Statistics Division, Page i. 9 St. Louis County Department of Planning, Research and Statistics Division, Pages i, iv. 10 St. Louis County Department of Planning, Research and Statistics Division, Pages i, iv. 11 St. Louis County Genealogical Society, “History of Saint Louis County,”
St. Louis County was formed on October 1, 1812 as one of the counties organized by Governor
William Clark out of the five administrative districts of the Upper Louisiana Territory. As originally
formed, St. Louis County included the area that is now St. Louis City, St. Louis County, Jefferson
County and Franklin County. Franklin and Jefferson Counties were created from parts of the original
St. Louis County in 1818.
Missouri became the 24th state on August 10, 1821 after Congress passed the “Missouri
Compromise” in 1820, admitting Missouri as a slave state and Maine as a free state. The agreement
also prohibited slavery in the Louisiana Territory north of Missouri’s southern border, except in the
proposed State of Missouri.12
St. Louis County History: City/County Separation or “The Great Divorce”13
In 1872, a Taxpayers’ League was formed by city leaders who were displeased with the County’s
taxation policies. At a time when the City had large expenses in extending urban infrastructure to
its rapidly growing population, they felt that the non-urban parts of the County were an undue
burden on City taxpayers.
The State of Missouri revised its Constitution in 1875 to give the City of St. Louis the right to
formulate its own home rule charter and extend its city limits. The revised Constitution also
authorized the formation of a Board of Freeholders, which served as the mechanism that was used
to separate the City from the rest of St. Louis County.
The separation of St. Louis City from St. Louis County occurred in 1876, increased the size of the
City from 17.98 square miles to 61.37 square miles, leaving St. Louis County at its present size of
524 square miles. The newly separated County had a population of 31,888, and while including a
few small urban centers, was predominantly rural. Clayton was selected as the County seat in 1877.
St. Louis County Geography
St. Louis County is located on the eastern side of the State of Missouri with a portion of its eastern
border shared with the City of St. Louis.
Rivers define much of the County’s borders, with the Missouri River dividing St. Louis County from
St. Charles County on the north; and, the Mississippi River separating parts of eastern St. Louis
County from the following Illinois counties; Madison, St. Clair, and Monroe.
St. Louis County shares a southern border with Jefferson County, Missouri and a western border
with Franklin Border.
12 The Library of Congress, “Today in History, August 10,” http://memory.loc.gov/ammen/today/aug10.html 13 St. Louis County Department of Planning, Research and Statistics Division, “St. Louis County, Missouri 2007-2012 Fact Book,” 2012, Page 148.
40
Residents of St. Louis County had median household income of $58,485 in 2012 which was higher
than the $47,333 figure for the State of Missouri.14
City of Florissant
The City of Florissant is located in northern St. Louis County and consists of 12.56 square miles of
land area. Florissant had an estimated 2012 population of 52,252, which is slightly higher than the
Census 2010 population of 52,158. In 2010, Florissant was the 12th largest city in the State of
Missouri.15
Paleo-Indian people, the earliest known inhabitants of the Florissant area, arrived in the Florissant
area near the end of the last ice age in the period 9500-8900 BCE. These people lived a nomadic
settlement lifestyle subsisting on hunting of animals and gathering edible plants. From that period
until the period that Europeans moved into the area, various Native American cultures populated
the Florissant region.16
The exact date that the first European settlers came to the place now known as the City of Florissant
is not known. It is known that Florissant was organized as a civil government in 1786 as the Village
of San Fernando (Saint Ferdinand) by Francois Dunegant and a group of French settlers.17
At the time of settlement by the French, the territory was still under Spanish rule. Originally, the
village was known as “Fleurissant” or “Blooming’’ by the French and ’St. Ferdinand’ by its Spanish
rulers.
The town was incorporated as a municipality in 1829 and has been closely associated with religious
activities throughout its history. Blessed Mother Philippine Duchesne was an early settler, founding
a novitiate and an Indian school. The St. Stanislaus Seminary also opened in Florissant in 1823.
The City of Florissant residents had estimated 2012 median household income of $51,52918,
compared with $58,48519 for St. Louis County and $47,33320 for the State of Missouri.
Money Magazine ranked the City of Florissant in the top 100 Best Places to live in 2012, listing the
city at number 73.21
14 U.S. Bureau of Census, http://quickfacts.census.gov/qfd/states/29/29189.html 15 U.S. Bureau of Census, QuickFacts, http://quickfacts.census.gov/qfd/states/29/2924778.html 16 City of Florissant, http://www.florissantmo.com/egov/documents/51f3731a_a173_098a_72c4_311420909e5f.pdf 17 Missouri History Museum, “Florissant, Missouri Collection, 1790-1971,”
http://collections.mohistory.org/resource/103021.html 18 U.S. Bureau of Census, QuickFacts, http://quickfacts.census.gov/qfd/states/29/2924778.html 19 U.S. Bureau of Census, QuickFacts, http://quickfacts.census.gov/qfd/states/29/29189.html 20 U.S. Bureau of Census, QuickFacts, http://quickfacts.census.gov/qfd/states/29000.html 21 Money Magazine, September 2012, http://money.cnn.com/magazines/moneymag/best-places/2012/top100/index3.html
41
City of O’Fallon
The City of O’Fallon is located in St. Charles County in eastern Missouri approximately 35 miles west
of downtown St. Louis. The city occupies 29.19 square miles of land area.22
The town began when Arnold Krekel, a German immigrant, invested in property now located in
what became downtown O’Fallon and which would become a depot stop for the North Missouri
Railroad. Arnold Krekel never moved to O’Fallon.23
Arnold Krekel’s younger brother Nicholas came to what is now the City of O’Fallon in 1856, when
he became the first resident and retailer. Mr. Krekel operated a store from his home, which was the
first house constructed in O’Fallon. One year later Mr. Krekel became the first postmaster and
railroad agent.24
The City of O’Fallon was incorporated in 1912 with a population of approximately 600 residents. By
2000 the City had grown to 46,169 residents, which increased to 79,329 in Census 2010 and to an
estimated 81,979 in 2012.25
O’Fallon is a municipality with residents having median household income of $77,210 in 201226,
while the same measure for St. Charles County was $71,41627 and $47,33328 for the State of
Missouri.
Money Magazine listed the City of O’Fallon in the top 100 Best Places to live in 2012, ranking the
city number 39.29
The maps which follow show counties in the State of Missouri on one map, followed by a map
highlighting the boundaries for St. Louis County and the City of Florissant; and, St. Charles County
and the City of O’Fallon.
22 U.S. Bureau of Census, QuickFacts, http://quickfacts.census.gov/qfd/states/29/2954074.html 23 City of O’Fallon, 2008 Comprehensive Plan, Page 7. 24 City of O’Fallon, 2008 Comprehensive Plan, Page 7 25 U.S. Bureau of Census, QuickFacts, http://quickfacts.census.gov/qfd/states/29/2954074.html 26 U.S. Bureau of Census, QuickFacts, http://quickfacts.census.gov/qfd/states/29/2954074.html 27 U.S. Bureau of Census, QuickFacts, http://quickfacts.census.gov/qfd/states/29/29183.html 28 U.S. Bureau of Census, QuickFacts, http://quickfacts.census.gov/qfd/states/29000.html 29 Money Magazine, September 2012, http://money.cnn.com/magazines/moneymag/best-places/2012/top100/index3.html
42
St. Louis County
St. Charles County
Source: U.S. Census Bureau
43
History of Segregation – St. Louis Region
To understand patterns of segregation in the St. Louis region, one must look at how segregation
began in the City of St. Louis, and its influence on political jurisdictions located in St. Louis County.
Much has been written by scholars and journalists about the segregation of races in the St. Louis
area, tracing the present patterns of segregation to the creation of the State of Missouri. At that
time, the St. Louis region was located in a border state that permitted slavery but was also a state
which harbored deep disagreements over the practice of slavery. The disagreement among
residents of Missouri over permitting or prohibiting slavery made the state a battleground in words
and actions during the Civil War.
The United States Congress sought to preserve the balance of power between Free states and slave
states by passing the Missouri compromise in 1820, which admitted Missouri to the Union as a slave
state and Maine as a Free state. With the exception of Missouri, the law prohibited slavery in the
Louisiana territory north of the 36° 30” latitude line. The Missouri compromise was repealed by the
Kansas-Nebraska Act of 1854. Only three years later, the Supreme Court declared the Missouri
compromise unconstitutional in its Dred Scott decision which ruled that Congress had no authority
to prohibit slavery in the territories.30
With the end of Reconstruction in 1877 and with the rise of the Ku Klux Klan in the South, many
southern Blacks migrated north to cities such as St. Louis. Some of these individuals were known as
“Exodusters,” who arrived in 1879, and who received that name as a result of their exodus to what
many believe to be a “promised land.”31 These individuals feared that the end of Reconstruction
and the removal of the protection from the United States Army might result in them losing their
newly found rights or worse, being returned to slavery. While many “Exodusters” moved to the
plains of western Kansas, eastern Colorado, and southern Utah, others stopped in St. Louis to make
their homes.
In the “Preservation Plan for the City of St. Louis,” the patterns of racial segregation and segregation
and housing were described in a section entitled “The African-American Experience.” The plan
notes that segregated housing patterns were not a result of “coincidence or happenstance.” In St.
Louis, like many other urban areas, African-Americans lived in separate areas that tended to contain
substandard housing and which were frequently overcrowded and unsanitary.32
The Preservation Plan explained that the boundaries of areas populated largely by African-
Americans were legally established under a segregation ordinance approved by voters in 1916
30 ”Preservation Plan for St. Louis, Part I: Historic Context; 8 – The African-American Experience, https://www.stlouis-
mo.gov/government/departments/planning/cultural-resources/preservation-plan/Part-I-African-American-Experience.cfm 31 ”Preservation Plan for St. Louis, Part I: Historic Context; 8 – The African-American Experience, https://www.stlouis-
mo.gov/government/departments/planning/cultural-resources/preservation-plan/Part-I-African-American-Experience.cfm 32 ”Preservation Plan for St. Louis, Part I: Historic Context; 8 – The African-American Experience, https://www.stlouis-
which held that no individual could move to a block on which more than 75% of the residents were
hot and of the race. The ordinance was nullified as result of legal actions brought by the NAACP.
Responding to the nullification of the segregation ordinance, whites created associations of whites
living in neighborhoods near black residential areas. One example is the Marcus Avenue
Improvement Association where he each property had attached to it a fifty-year covenant that
prohibited the sale of the house to “persons not of Caucasian race.” In 1948, the United States
Supreme Court ruled in Shelley v. Kramer, a St. Louis case, that such covenants which limited access
to or ownership of property due to race violated the 14th Amendment to the Constitution.33
The City of St. Louis Preservation Plan also notes that segregated housing was reinforced by urban
renewal practices in the construction of public housing. Urban renewal projects in the city were
undertaken in several areas which contained concentrations of African-Americans. Mill Creek Valley
was an African-American district from the mid-1800s through the end of the 19th century.
Approximately ninety-five percent of the 20,000 people who lived in this area were African-
American. Under a city urban renewal project which began in 1959, public works improvements
were constructed in this area and residents were displaced.34
To accommodate the poorest displaced residents, the St. Louis Housing Authority continued its
construction of public housing on the Northside, which reinforced racial segregation. The NAACP
described the demolition of structures in Mill Creek Valley as the “Negro removal project.”35
Dr. Colin Gordon, a history professor at the University of Iowa wrote a book in 2008 entitled
Mapping Decline: St. Louis and the Fate of the American City. Interviewed on August 26, 2014 by
Robert Siegel on the National Public Radio program “All Things Considered,” Dr. Gordon addressed
recent racial tensions in the City of Ferguson, which is located in St. Louis County.36
In the interview, Dr. Gordon remarked that many northern industrial cities such as St. Louis,
Chicago, and Detroit, for example, are much more segregated than cities in the South. He explained
that these patterns of racial separation were partly a reaction to in-migration of African-Americans,
notably during the first and second world wars.
Dr. Gordon explained that in a setting like the St. Louis area, in-migration that took place in this
manner has resulted in an African-American Northside and a largely white Southside.
33 ”Preservation Plan for St. Louis, Part I: Historic Context; 8 – The African-American Experience, https://www.stlouis-
mo.gov/government/departments/planning/cultural-resources/preservation-plan/Part-I-African-American-Experience.cfm 34 ”Preservation Plan for St. Louis, Part I: Historic Context; 8 – The African-American Experience, https://www.stlouis-
Experience.cfm 35 ”Preservation Plan for St. Louis, Part I: Historic Context; 8 – The African-American Experience, https://www.stlouis-
mo.gov/government/departments/planning/cultural-resources/preservation-plan/Part-I-African-American-Experience.cfm 36 Interview with Dr. Colin Gordon, "All Things Considered," National Public Radio, August 26, 2014
45
Municipalities began to be incorporated in St. Louis County in 1843 when Bridgeton was created.
Other municipalities incorporated during the 19th century included Florissant and Pacific in 1857,
Kirkwood in 1865, Fenton in 1874, Ferguson in 1894, and Webster Groves in 1896. The remainder
of the 90 municipalities were created from 1900 and through 1970.
Some of the municipalities were created through the incorporation of neighborhoods or
subdivisions. Documentation does not always exist that describes the reasons for the creation of
these municipalities, but at the time of their incorporation, some of the cities may have been created
as points of civic pride, to provide services at a level closer to their residents, or to avoid annexation
by other cities.
The new cities consisted predominantly of white residents who had previously lived in the City of
St. Louis. At the time of the creation of many of these jurisdictions, legal barriers (especially
exclusionary zoning ordinances requiring larger and more expensive housing), sometimes resulted
in African-Americans who had lower incomes than whites being excluded from purchasing real
estate in these municipalities. Other acts that occurred through the years that prohibited African-
Americans from successfully purchasing housing in suburban cities included discrimination in real
estate sales and the approval of real estate loans.
While the legal barriers to residency have been removed many years ago, other tools were used to
continue the practice of segregated housing in the region. St. Louis has the sad distinction of being
the location where the practice of “redlining” was born.
Redlining involved lenders and real estate companies identifying areas of minority concentrations
(African-Americans) where they would not sell or finance properties. These areas were marked on
maps with red borders, which gave the practice its name. Redlining made it more difficult for
African-Americans to obtain mortgages or business loans in these areas. Because loans were denied
to African-Americans, redlining restricted their ability to own or improve properties already owned.
As a result of redlining, many black residents remained locked in their communities unable to gain
wealth by owning homes.
BusinessWeek magazine published an article authored by Peter Coy on its website on August 15,
2014, in which it examined racial issues in St. Louis County, and particularly in the city of Ferguson.
The article notes that the fragmentation caused by so many municipalities has resulted in small
towns that are highly stratified by race and income. According to BusinessWeek, “as African-
Americans move into town, whites move out.” These circumstances may result in a shrinking of the
city tax base and the resultant reduction in the amenities that were previously available. The article
highlights how small municipalities compete with each other for revenues and with shrunken tax
bases it is becoming increasingly difficult for these jurisdictions to survive.37 The debate over
consolidation of governments continues as a way to reduce the number of municipalities the
37 BusinessWeek, August 15, 2014; http://www.businessweek.com/articles/2014-08-15/how-st-dot-louis-countys-map-
explains-fergusons-racial-discord
46
simplify governance and as a possible avenue to help reduce segregation. However, at this time no
proposal has been offered to voters for a decision.
Another volatile political issue that has arisen in some suburban St. Louis County municipalities is
the rapid change in demographics. Some cities which were predominantly white have transitioned
to predominantly African-American, as former white residents have moved away, but the elected
leadership and professional staff in these communities have not changed to reflect the new
demographics. This phenomenon, while not limited to the St. Louis area, can be a source of friction
in the cities, as experienced by the City of Ferguson in August 2014.
While this discussion has sought to describe the historical evolution of segregation in the A.I. study
area, it is also appropriate to summarize the status of racial segregation in the St. Louis area. U.S.
News and World Report published an article on August 22, 2014, which cited a 2011 Brown
University study which determined that St. Louis is the ninth most segregated metropolitan area in
the country. Other metropolitan area that are more segregated and their national rankings are:
Metropolitan Area Rank
Detroit 1
Milwaukee 2
New York 3
Newark 4
Chicago 5
Philadelphia 6
Miami 7
Cleveland 838
As if to punctuate the continuing issues caused by racial segregation, the St. Louis region was
described in an August 15, 2014 article in the Los Angeles Times, which quoted Dr. Clarissa Hayward,
Associate Professor of Political Science at Washington University. Dr. Hayward noted that “the St.
Louis metropolitan area has been an extreme example of racial segregation for 100 years. St. Louis
is the beginning of the West, the nexus to the Midwest and at the border of the South.”39
38 U.S. News and World Report, August 22, 2014; http://www.usnews.com/news/articles/2014/08/22/fergusons-racial-
problems-are-not-unique-to-ferguson; and, Logan, John R. and Stults, Brian J., “The Persistence of Segregation in the
Metropolis: New Findings from the 2010 Census,” Brown University, March 24 2011; Census Brief prepared for Project
US2010; http://www.s4.brown.edu/us2010/Data/Report/report2.pdf 39 Los Angeles Times, August 15, 2014; http://www.latimes.com/nation/nationnow/la-na-nn-ferguson-racial-history-
Other services, except public administration 25,061 5.2% 8,721 4.5%
Public administration 14,527 3.0% 5,627 2.9%
Source: U.S. Census Bureau: American FactFinder; American Community Survey – One-Year Estimate, 2012; S2405 Industry by Occupation for the Civilian Population 16 Years and Over
55
Local economic development organizations collected the data presented in the following table that lists the ten largest employers in St. Louis and St. Charles Counties. The areas where these employers are located are included on the maps which follow.
Major Employers in St. Louis and St. Charles Counties
Rank Company Location Employment
St. Louis County
1 Boeing Defense, Space & Security Hazelwood 15,129
2 Washington University in St. Louis St. Louis 14,248
3 Mercy Health St. Louis 12,489
4 SSM Health Care St. Louis 11,898
5 Wall-Mart Stores Inc. St. Louis 11,600
6 Schnuck Markets, Inc. St. Louis 10,919
7 Enterprise Holdings Clayton 5,770
8 Special School District of St. Louis County Town & Country 5,672
9 Imo’s Pizza St. Louis 5,400
10 Edward Jones Des Peres 4,754
St. Charles County
1 Citi O’Fallon 4,100
2 MasterCard Worldwide O’Fallon 1,953
3 True Manufacturing O’Fallon Withheld
4 Verizon Weldon Spring 1,400
5 General Motors Wentzville 1,321
6 MEMC Electronic Materials O’Fallon 1,000
7 The Boeing Company St. Charles 1,000
8 Ameristar Casino St. Charles 973
9 Client Services St. Charles 838
10 Enterprise Holdings Weldon Springs 722
Sources: St. Louis Regional Chamber, Major Employers – St. Louis MO-IL MSA, 9/18/2013, St. Charles County Economic Development Center, Major Employers, 2012; http://edcscc.com/dbh_major-employers.htm
56
Source: St. Louis Home Consortium Consolidated Plan 2011-2014, page 370
Source: St. Louis Home Consortium Consolidated Plan 2011-2014, page 372
57
Protected Class Analysis
The Fair Housing Act and similar state or local fair housing laws list seven prohibited bases for
housing discrimination:40 race, color, national origin, gender, familial status, disability, and religion.
This protected class analysis addresses each of these population groups and their geographic
distribution in St. Louis County, the City of Florissant, and the City of O’Fallon.
Race and Ethnicity
As of 2010, the majority of St. Louis County’s population was non-Hispanic White (68.9%) and about
one-fifth (23.2%) was non-Hispanic Black. Taken together, Blacks and Whites made up 92.1% of the
County’s total population. Other minority segments included Asians (3.5%), Hispanics (2.5%), and
persons of two or more races (1.7%). American Indians, Alaskan Natives, Native Hawaiians, Pacific
Islanders, and persons of other races together made up only 0.3% of St. Louis County. Although most
minority population shares remain low, the County has diversified since 2000, when 76.0% of its
population was White. The biggest increases were in Hispanic and Asian residents, which grew by
71.7% and 53.2%, respectively.
Racial and ethnic composition of the population in Florissant is quite similar to that of the County.
The most notable difference is that Asians make up 3.5% of St. Louis County but only 0.8% of
Florissant. Florissant’s racial and ethnic diversification over the 2000-2010 period surpassed that
of the County – in the earlier year, Whites made up 84.8% of total population; by 2010, they made
up 68.2%. The Black population grew most significantly over the ten-year period, by 8,114 persons,
or 140.5%.
The City of O’Fallon is, and has historically been, considerably less diverse than St. Louis County. In
2010, 88.2% of O’Fallon’s population was White. Largest minority populations included Blacks
(4.0%), Asians (3.1%), and Hispanics (2.7%). Minority population growth rates in O’Fallon were
high over the 2000-2010 period, due in large part to the very small populations in 2000. While both
Florissant and St. Louis County lost White residents from 2000 to 2010, the White population in
O’Fallon grew by 60.6%, just a bit below overall population growth.
40 Live Free: Annual Report on Fair Housing FY 2010, U.S. Department of Housing and Urban Development.
58
Population by Race and Ethnicity in St. Louis County, Florissant and O’Fallon
Race by Ethnicity 2000 2010 2000-2010
% Change Count Share Count Share
St. Louis County
Non-Hispanic 1,001,738 98.6% 973,930 97.5% -2.8%
White 772,041 76.0% 687,984 68.9% -10.9%
Black or African American 192,544 18.9% 231,801 23.2% 20.4%
American Indian/Alaska Native 1,557 0.2% 1,632 0.2% 4.8%
Total Households 404,312 100.0% 404,765 100.0% 0.1%
Total female householders 129,713 32.1% 140,055 34.6% 8.0%
Total households with children 136,940 33.9% 125,613 31.0% -8.3%
Sources: U.S. Census 2000 SF1 Tables P027 and P035 and 2010 SF1 Tables P29 and P39
41 The Census defines a family household as a household with two or more people (one of whom is the householder) related by birth, marriage, or adoption residing together. A family household also includes any unrelated people who may be residing with the family.
67
Like St. Louis County, Florissant’s 21,247 households were approximately two-thirds families
(65.0%) and one-third (35.0%) nonfamily as of 2010. These shares are quite similar to the
breakdown nationwide of 66.4% family and 33.6% nonfamily households.
Also like the County, Florissant lost married couple households, both with and without children,
since 2000. Growth rates for other family types – male and female householders with or without
children – ranged from 31.5% to 38.2%, again showing a trend toward more diversity in terms of
household type. By 2010, female householders made up 37.7% of Florissant’s households, up from
33.2% in 2000. The total number of households with children remained relatively constant, with
gains in other families with children offsetting losses of married couples with children.
Familial Status and Sex of Householder in Florissant
Household Type 2000 2010 2000-2010
% Change Count Share Count Share
Family Households
Married couple householders 10,168 49.8% 9,002 42.4% -11.5%
With related children under 18 4,555 22.3% 3,808 17.9% -16.4%
No related children under 18 5,613 27.5% 5,194 24.4% -7.5%
Male householder, no wife 822 4.0% 1,084 5.1% 31.9%
With related children under 18 467 2.3% 614 2.9% 31.5%
No related children under 18 355 1.7% 470 2.2% 32.4%
Female householder, no husband 2,697 13.2% 3,714 17.5% 37.7%
With related children under 18 1,694 8.3% 2,341 11.0% 38.2%
No related children under 18 1,003 4.9% 1,373 6.5% 36.9%
Nonfamily Households
Male householders 2,640 12.9% 3,148 14.8% 19.2%
Female householders 4,072 20.0% 4,299 20.2% 5.6%
Total Households 20,399 100.0% 21,247 100.0% 4.2%
Total female householders 6,769 33.2% 8,013 37.7% 18.4%
Total households with children 6,716 32.9% 6,763 31.8% 0.7%
Sources: U.S. Census 2000 SF1 Tables P027 and P035 and 2010 SF1 Tables P29 and P39
In O’Fallon in 2010, families made up three-quarters of the City’s 28,234 households and
nonfamilies constituted one-quarter. Compared to St. Louis County, Florissant and the U.S., O’Fallon
had a higher share of households with children (44.2%) and a lower share of female householders
(23.3%).
While household type did diversify in O’Fallon over the last decade, the city did not have the drop
in married couple households that occurred in St. Louis County or Florissant. In contrast, O’Fallon
68
saw growth in all household types, contributing to an overall household growth rate of 83.5%. One
factor fueling this growth, especially among households with children, is likely the strong reputation
of O’Fallon’s schools.
Familial Status and Sex of Householder in O’Fallon
Household Type 2000 2010 2000-2010
% Change Count Share Count Share
Family Households
Married couple householders 10,749 69.8% 17,401 61.6% 61.9%
With related children under 18 6,677 43.4% 9,738 34.5% 45.8%
No related children under 18 4,072 26.5% 7,663 27.1% 88.2%
Male householder, no wife 534 3.5% 1,206 4.3% 125.8%
With related children under 18 369 2.4% 768 2.7% 108.1%
No related children under 18 165 1.1% 438 1.6% 165.5%
Female householder, no husband 1,325 8.6% 2,829 10.0% 113.5%
With related children under 18 1,005 6.5% 1,980 7.0% 97.0%
No related children under 18 320 2.1% 849 3.0% 165.3%
Nonfamily Households
Male householders 1,482 9.6% 3,056 10.8% 106.2%
Female householders 1,299 8.4% 3,742 13.3% 188.1%
Total Households 15,389 100.0% 28,234 100.0% 83.5%
Total female householders 2,624 17.1% 6,571 23.3% 150.4%
Total households with children 8,051 52.3% 12,486 44.2% 55.1%
Sources: U.S. Census 2000 SF1 Tables P027 and P035 and 2010 SF1 Tables P29 and P39
The maps on the following pages identify concentrations of households with children and of female
householders. The greatest concentration of households with children is in west St. Louis County,
including Wildwood, Clarkson Valley, and parts of Chesterfield and Ellisville. Areas in north St. Louis
County with a concentration of households with children (40% or more) include Berkeley, Kinloch,
Pagedale, Wellston, Country Club Hills, Castle Point, Glasgow Village, and Moline Acres.
Households with children make up between 20 and 40% of all tracts in Florissant. In each O’Fallon
tract, 30% or more of households have children.
69
Share of Households with Children by Census Tract in St. Louis County, Florissant and O’Fallon: 2010
Source: U.S. Census 2010 SF1 Table P39
70
Looking at female householders, the greatest concentrations are in north St. Louis County,42 where
22 tracts have shares of 50% or more. Each of these census tracts has an African American
population share of over 70%, indicating that these areas represent concentrations of multiple
protected classes. West St. Louis County has the lowest representation of female householders –
less than 20% in most tracts in that area.
Most tracts in Florissant have female householder shares from 30-40% of total households,
although two tracts partially in the city fall in the 40-50% range.
In most O’Fallon tracts, households with female householders make up 20-30% of the total. Female
householders constitute less than 20% of the total in the remaining tracts.
42 Jurisdictions in this area include Bel-Ridge, Berkeley, Beverly Hills, Castle Point, Country Club Hills, Dellwood, Flordell Hills, Glasgow Village, Hanley Hills, Jennings, Kinloch, Moline Acres, Northwoods, Pagedale, Uplands Park, Velda City, Velda Village Hills, and Wellston.
71
Share of Female Householders by Census Tract in St. Louis County, Florissant and O’Fallon: 2010
Source: U.S. Census 2010 SF1 Tables P29 and P39
72
Disability
According to the most recent American Community Survey data (2008-2012), St. Louis County had
a disabled population of 110,830 (11.2% of total population). Of persons with a disability, just over
one-half (56.8%) were under the age of 65 and the remaining 43.2% were 65 or older.
Disability Status of the Population
Disability Status Count Share of
Total
St. Louis County
Disability Status
Total population 986,648 100.0%
With a disability 110,830 11.2%
Population under age 65 843,739 100.0%
With a disability 62,963 7.5%
Population age 65 and over 142,909 100.0%
With a disability 47,867 33.5%
City of Florissant
Disability Status
Total population 51,591 100.0%
With a disability 7,193 13.9%
Population under age 65 43,790 100.0%
With a disability 4,162 9.5%
Population age 65 and over 7,801 100.0%
With a disability 3,031 38.9%
City of O’Fallon
Disability Status
Total population 78,855 100.0%
With a disability 6,773 8.6%
Population under age 65 71,848 100.0%
With a disability 4,331 6.0%
Population age 65 and over 7,007 100.0%
With a disability 2,442 34.9%
Source: 2008-2012 American Community Survey Tables B18101 to B18107
Disability rates were slightly higher (13.9%) in Florissant, but the breakdown by age is similar –
57.9% of disabled persons were under age 65 and 42.1% over. In contrast, O’Fallon had a lower
disability rate (8.6%), and of the disabled population, a higher share (63.9%) were under age 65.
Disability rates in St. Louis County and O’Fallon are below the national average of 12.0%, while
Florissant is above this mark.
73
The map on the next page shows that the geographic distribution of the disabled population is
relatively heaviest in north and south St. Louis County. Most tracts in these areas have a disabled
population share that is 10-20% of the tract total; in 9 tracts, persons with a disability constitute
more than 20% of the total population. In west and central St. Louis County, the majority of tracts
have a disabled population share below 10%. In both Florissant and O’Fallon, disability rates vary
by tract, from under 7% to the 13-20% range.
Religious Affiliation
Religion is not one of the questions surveyed by the U.S. Census Bureau making dependable,
comprehensive data on religious affiliation difficult to find. The data used in this report appear in
the 2010 U.S. Religion Census: Religious Congregations & Membership Study, a county-by-county
enumeration of religious bodies in the U.S. published by the Association of Statisticians of American
Religious Bodies (ASARB). The smallest geography for which data is available in this Study is the
county level, and thus no figures are available for Florissant or O’Fallon, or at the tract level. Data
for St. Louis County and St. Charles County (which contains O’Fallon) are shown in the table below,
Population by Religious Affiliation in 2010.
In both St. Louis and St. Charles Counties, 51.7% of the population adhered to a religion as of 2010.43
Of those claiming a religious affiliation, Catholics made up the largest share in each county at 23.1%
and 23.7% of the population, respectively, followed by Evangelical Protestants at 16.3% and 20.0%,
respectively. Nationally, Catholics and Evangelical Protestants constituted 18.9% and 16.2% of the
population, respectively.
Population by Religious Affiliation in St. Louis and St. Charles County, 2010
Religious Affiliation St. Louis County St. Charles County
Count Share Count Share
Black Protestant 9,369 0.9% 406 0.1%
Catholic 230,488 23.1% 85,536 23.7%
Evangelical Protestant 162,614 16.3% 72,210 20.0%
Mainline Protestant 74,404 7.4% 24,412 6.8%
Orthodox 2,042 0.2% ---- ----
Other 37,156 3.7% 3,929 1.1%
Unclaimed 482,881 48.3% 173,992 48.3%
Total Population 998,954 100.0% 360,485 100.0%
Source: Association of Statisticians of American Religious Bodies, 2010 U.S. Religion Census: Religious Congregations & Membership Study
43 Congregational adherents include all full members, their children, and others who regularly attend services. “Unclaimed,” are not adherents of any of the 236 groups included in the Religious Congregations & Membership Study, 2010.
Share of Population with a Disability by Census Tract in St. Louis County, Florissant and O’Fallon: 2008-2012
Source: 2008-2012 American Community Survey Table B18101
75
Summary of Findings
Racial/ethnic composition in St. Louis County and Florissant is similar – both are about two-thirds White and one-quarter Black. O’Fallon is considerably less diverse, with a White population of 88.2% and a Black population of only 4.0%.
The majority of St. Louis County’s Black population is concentrated in the north, where 26 tracts have a Black population share of over 80%. In comparison, only seven tracts located south of I-64 have Black population shares of over 10%.
Hispanic residents make up only 2.5% of the County’s population and tend to live in a more dispersed pattern than do Blacks. The largest concentration of Hispanic residents is southwest of the I-70 and I-170 interchange, and makes up 17.4% of the County total.
Seven percent of the County’s population is foreign-born, and non-U.S. natives are most heavily concentrated in central St. Louis County, extending southwest but not to the Franklin or Jefferson County borders.
Given its low level of diversity, O’Fallon does not have significant concentrations of Black, Hispanic, or foreign-born populations, and these groups tend to reside relatively evenly throughout the city.
Just under one-third of households in St. Louis County and Florissant have children (31.0 and 38.0%, respectively). Tracts in west St. Louis County have the highest shares of households with children (40% or more), along with a few areas in the north (including Berkeley, Glasgow Village, and Castle Point).
Households with children are more common in O’Fallon at 44.2% of total households, and at least 30% of households in each census tract.
Female householders make up 34.6% of St. Louis County, 37.7% of Florissant, and 23.3% of O’Fallon. The greatest concentration is in north St. Louis County, where 22 tracts have shares of 50% or more.
Most tracts in Florissant have female householder shares from 30-40% of total households, while all tracts in O’Fallon have shares below 30%.
Persons with a disability constitute 11.2% of the St. Louis County population, 13.9% of Florissant, and 86% of O’Fallon. Disability rates are uniformly higher for the population age 65 and over, ranging from 33.5% in St. Louis County to 38.9% in Florissant. Geographic concentrations of the disabled population are relatively heaviest in north and south St. Louis County and lowest in the west and center.
Of persons in St. Louis County claiming a religion, the largest shares are Catholics and Evangelical Protestants, who make up 23.1% and 16.3% of the total population, respectively. Religion data is not available at the city level.
76
Segregation Analysis
Segregation, or the degree to which two or more racial or ethnic groups live geographically separate
from one another, can directly affect the quality of life in cities and neighborhoods. As new people
settle in an area, their race or ethnicity is likely to have an effect on the dynamics of the community
where they live.44 A study by the Federal Reserve Bank of Cleveland compared the economic growth
of more than 100 areas in the U.S. between 1994 and 2004 and concluded that racial diversity and
inclusion was “positively associated with a host of economic growth measures, including
employment, output, productivity, and per capita income.”45 In general, diverse communities have
been found to benefit from greater innovation arising out of the varied perspectives within the
community. Additionally, multilingual and multicultural regions are best positioned for success in
the global marketplace.
Despite the economic and other advantages of diversity, patterns of racial and ethnic segregation
remain prevalent in many regions and cities. Segregation is typically perceived of negatively, but it
is important to note that it is not always due to overt housing discrimination. In fact, there could be
at least three reasons why patterns of segregation exist:
personal preferences cause individuals to want to live in neighborhoods with others of a
particular race and ethnicity;
income differences across race and ethnic groups limit the selection of neighborhoods
where persons of a particular race and ethnicity can live; and,
illegal discrimination in the housing market limits the selection of neighborhoods where
persons of a particular race and ethnicity can live.
However, even when the causes of segregation are benign, its effects can be detrimental. ”Numerous
studies have focused on the possible effects of residential neighborhoods on social and economic
outcomes. Persistent economic and racial residential segregation is implicated in enduring racial
and ethnic inequality.”46 For example, research demonstrates that African American homeowners
earn less equity in their non-rental homes because their incomes are lower and they reside in areas
that are more segregated. “Individuals take account of the race-ethnic composition of
neighborhoods when deciding if and where to move. These patterns may result from a number of
underlying social processes. While race-ethnic prejudice may govern residential choices to some
degree, the ethnic composition of a neighborhood is also correlated with other factors that
44 Sawyer, N. and Tatian, P. (2003, October). Segregation Patterns in the District of Columbia: 1980 to 2000. Washington, DC: The Urban Institute. 45 PolicyLink. 2011. “America’s Tomorrow: Equity is the Superior Growth Model.”
46 Bruch, E. (2005) Residential Mobility, Income, Inequality, and Race/Ethnic Segregation in Los Angeles. Princeton, NJ: Princeton, University.
77
determine neighborhood attractiveness. For example, neighborhoods vary in levels of crime, quality
housing, and poverty.”47
The task in this Segregation Analysis is to determine the degree to which residents of St. Louis
County (including Florissant) and O’Fallon are segregated by race and ethnicity, based on
population counts from the 2000 and 2010 U.S. Censuses.
Residential segregation is the degree to which two or more racial or ethnic groups live
geographically separate from one another. Early in the field of residential segregation analysis
Duncan and Duncan48 (1955) defined a “dissimilarity index” which became the standard
segregation measure for evenness of the population distribution by race. By 1988 researchers had
begun pointing out the shortcomings of dissimilarity indices when used apart from other measures
of potential segregation. In a seminal paper, Massey and Denton49 (1988) drew careful distinctions
between the related spatial concepts of sub-population distribution with respect to evenness
(minorities may be under- or over-represented in some areas) and exposure (minorities may rarely
share areas with majorities thus limiting their social interaction).
This report will use the methodology set forth by Duncan and Duncan for the measurement of
evenness of the population distribution by race (dissimilarity index) as well as measures of
exposure of one race to another (exposure and isolation indices), based on the work of Massey and
Denton. Workers in the field generally agree that these measures adequately capture the degree of
segregation. These measures have the advantage of frequent use in segregation analyses and are
based on commonsense notions of the geographic separation of population groups. An additional
analysis for the Entropy Index will provide a measure of multi-group diversity not accounted for by
the other indices which necessarily are limited to two racial or ethnic groups at a time.
Dissimilarity Index
The Dissimilarity Index (DI) indicates the degree to which a minority group is segregated from a
majority group residing in the same area because the two groups are not evenly distributed
geographically. The DI methodology requires a pair-wise calculation between the racial and ethnic
groups in the region. Evenness, and the DI, are maximized and segregation minimized when all small
areas (census tracts in this analysis) have the same proportion of minority and majority members
as the larger area in which they live (here, St. Louis County or the City of O’Fallon). Evenness is not
measured in an absolute sense, but is scaled relative to some other group. The DI ranges from 0.0
(complete integration) to 1.00 (complete segregation). HUD identifies a DI value between 0.41 and
0.54 as a moderate level of segregation and 0.55 or above as a high level of segregation.
47 Ibid. 48 Duncan, Otis D., and Beverly Duncan. 1955. “A Methodological Analysis of Segregation Indices.” American Sociological Review, Vol. 20. 49 Massey, Douglas, S. and Denton, N. A., 1988. “The Dimensions of Residential Segregation.” Social Forces, Vol. 67, No. 2, University of North Carolina Press.
78
The regional proportion of the minority population can be small and still not be segregated if evenly
spread among tracts. Segregation is maximized when no minority and majority members occupy a
common area. When calculated from population data broken down by race or ethnicity, the DI
represents the proportion of minority members that would have to change their area of residence
to achieve a distribution matching that of the majority (or vice versa).
Although the literature provides several similar equations for the calculation of the DI, the one
below is the most commonly used. This equation differences the magnitude of the weighted
deviation of each census tract’s minority share with the tract’s majority share which is then summed
over all the tracts in the region:50
where:
D = Dissimilarity Index
Mini = Minority group population of census tract i
MinT = Minority group regional population
Maji = Majority group population of census tract i
MajT = Majority group regional population
n = Total number of census tracts in the region.
The table below presents the results of these calculations between non-Hispanic Whites, non-
Hispanic Blacks, non-Hispanic Asians, and Hispanics in St. Louis County and O’Fallon.51 The graphs
that follows presents the same data in a visual format so that trends can be more readily identified.
The DI calculations for St. Louis County reveal a high degree of segregation between Whites and
Blacks (0.71) that has not diminished since 2000. This finding can be interpreted to mean that in
2010, 71% of Black residents or 71% of White residents would have to move in order for the two
groups to be identically distributed throughout the County, thus eliminating Black and White
segregation. A high degree of segregation also exists between Asians and Blacks (0.78) and
Hispanics and Blacks (0.63), while remaining pairs (Hispanic-White, Asian-White, and Hispanic-
Asian) have low levels of segregation. Taken together, these indices mean that the County’s Black
50 Calculation after Desegregation Court Cases and School Demographics Data, Brown University, Providence, Rhode
Island. Source: http://www.s4.brown.edu/schoolsegregation/desegregationdata.htm. Accessed February 27, 2013. 51 The DI methodology requires that each group be distinct from each other. Each racial or ethnicity (Hispanic) group cannot overlap. This study focuses primarily on four groups: Hispanics, Non-Hispanic Whites, Non-Hispanic Blacks, and Non-Hispanic Asians (to be called “Whites,” “Blacks,” and “Asians” for simplicity).
79
population tends to be highly segregated from persons of other races/ethnicities, while those
persons of other races/ethnicities are more likely to live amongst one another.
The graphs on the following page illustrate trends between 2000 and 2010, showing that
racial/ethnic segregation in St. Louis County has strengthened over the ten year period, increasing
for five of the six comparisons and remaining constant in the sixth.
Segregation levels in Florissant in 2010 were low for all paired subgroups, from a low of DI = 0.16
for Hispanics and Whites to a high of DI = 0.35 for Blacks and Whites, suggesting that residential
patterns were relatively similar for most subpopulations in the City. A comparison with 2000
figures, however, shows an increase in segregation for three of the pairings (Hispanic-White, Asian-
White, and Hispanic-Asian). These increases are likely due to both a loss of White population in the
City, along with growth and altered residential patterns of the Hispanic and Asian populations.
In O’Fallon, segregation was low amongst all population subgroups, ranging from 0.11 for Black-
White populations to 0.25 for Asian-White populations. These figures suggest that O’Fallon’s low
number of minority residents (only 11.8% of the City’s total population) tend to follow relatively
similar patterns residential patterns as one another and the majority population. Highest DIs are
for Asian residents relative to all other subpopulations, indicating that they are the most segregated.
DIs in O’Fallon show greater variability from 2000 to 2010 than in St. Louis County. Hispanic-Asian,
Asian-White, and Hispanic-White values increased, while each pairing including Black residents
(Black-White, Asian-Black, and Hispanic-Black) declined. This variability is likely a result of the
large increase in minority populations from 2000 to 2010, which ranged from 204.7% for Blacks to
630.9% for Hispanics.
Dissimilarity Index
Group Exposure 2000 2010 Change
St. Louis County
Black-White 0.70 0.71 +0.01
Hispanic-White 0.20 0.28 +0.08
Asian-White 0.33 0.34 +0.01
Asian-Black 0.76 0.78 +0.02
Hispanic-Asian 0.33 0.37 +0.04
Hispanic-Black 0.63 0.63 -----
80
Dissimilarity Index (continued)
Group Exposure 2000 2010 Change
City of Florissant
Black-White 0.41 0.35 -0.06
Hispanic-White 0.10 0.16 +0.06
Asian-White 0.12 0.24 +0.12
Asian-Black 0.38 0.34 -0.04
Hispanic-Asian 0.10 0.23 +0.13
Hispanic-Black 0.39 0.27 -0.12
City of O’Fallon
Black-White 0.23 0.11 -0.12
Hispanic-White 0.10 0.12 +0.02
Asian-White 0.15 0.25 +0.10
Asian-Black 0.32 0.24 -0.08
Hispanic-Asian 0.15 0.30 +0.15
Hispanic-Black 0.28 0.13 -0.15
Sources: U.S. Census 2000 SF1 Table P008 and 2010 SF1 Table P5
0.700.71
0.20
0.28
0.34
0.76 0.78
0.330.37
0.63 0.63
0.10
0.20
0.30
0.40
0.50
0.60
0.70
0.80
0.90
2000 2010
Dis
sim
ila
rity
In
de
x
Dissimilarity Index by Race and Ethnicity for St. Louis County
Black-White Hispanic-White Asian-White
Asian-Black Hispanic-Asian Hispanic-Black
81
Sources: U.S. Census 2000 SF1 Table P008 and 2010 SF1 Table P5
0.23
0.110.10
0.12
0.15
0.25
0.32
0.24
0.30
0.28
0.13
0.05
0.10
0.15
0.20
0.25
0.30
0.35
2000 2010
Dis
sim
ila
rity
In
de
x
Dissimilarity Index by Race and Ethnicity for the City of O'Fallon
Black-White Hispanic-White Asian-White
Asian-Black Hispanic-Asian Hispanic-Black
0.41
0.35
0.16
0.12
0.24
0.38
0.34
0.10
0.23
0.39
0.27
0.10
0.20
0.30
0.40
0.50
2000 2010
Dis
sim
ila
rity
In
de
xDissimilarity Index by Race and Ethnicity for City of Florissant
Black-White Hispanic-White Asian-White
Asian-Black Hispanic-Asian Hispanic-Black
82
Exposure Index
Two basic, and related, measures of racial and ethnic interaction are exposure (this section) and
isolation (next section). These two indices, respectively, reflect the possibility that a minority
person shares a census tract with a majority person (Exposure Index, EI, this section) or with
another minority person (Isolation Index, II, next section).
“Exposure measures the degree of potential contact between minority and majority group
members” (Massey and Denton 1988). Exposure is a measure of the extent two groups share
common residential areas and so it reflects the degree to which the average minority group member
experiences segregation. The EI can be interpreted as the probability that a minority resident will
come in contact with a majority resident, and ranges in value from 0.0 to 1.0, where higher values
represent lower segregation.
As with the Dissimilarity Index, each calculation of EI involves two mutually exclusive racial or
ethnic groups. The EI measures the exposure of minority group members to members of the
majority group as the minority-weighted average (the first term in the equation below) of the
majority proportion (the second term) of the population in each census tract, which can be written
as:
where:
Prob = Probability that minority group members interact with majority group members
Mini = Minority group population of census tract i
MinT = Minority group regional population
Maji = Majority group population of census tract i
Toti = Total population of census tract i
n = Total number of census tracts in the region.
The EI is not “symmetrical” so the probability of a typical Black person meeting a White person in a
tract is not the same as the probability of a typical White person meeting a Black person in that tract.
An illustrative example of this asymmetry is to imagine a census tract with many White residents
and a single Black resident. The Black person would see all White people, but the White residents
would see only one Black person. Each would see a much different world with respect to group
identification.
83
The maximum value of the EI depends both on the distribution of racial and ethnic groups and on
the proportion of minorities in the area studied. Generally, the value of this index will be highest
when the two groups have equal numbers and are spread evenly among tracts (low segregation). If
a minority is a small proportion of a region’s population, that group tends to experience high levels
of exposure to the majority regardless of the level of evenness.52
The “Exposure Index” table shows that in St. Louis County in 2010 the typical probability of a Black
person interacting with a White person was 32%, and that the probability of a White person
interacting with a Black person was lower at 11%. This probability can also be interpreted to mean
that on average 32 of every 100 people a Black person met were White and 11 of every 100 people
a White person met were Black. Asians and Hispanics had higher likelihoods of meeting Whites
(78% and 71%, respectively), but a much smaller chance of Whites meeting them (4% and 3%).
In Florissant in 2010, exposure indices were highest for minority populations’ exposure to Whites
– from 0.48 for Blacks to 0.60 for Hispanics and Asians. Other subpopulation pairings with relatively
higher levels of exposure to one another include Whites, Asians, Hispanics to Blacks. Whites had
very limited levels of exposure to other minority groups.
In O’Fallon, 2010 exposure indices were high for each measure of minority exposure to Whites,
ranging from 0.88 to 0.89. In contrast, every other pairing showed very low levels of exposure (all
under 0.05). These findings indicate that minority residents are highly likely to meet White
residents within their census tract, but unlikely to meet another minority; Whites, meanwhile, are
unlikely to meet a minority resident.
In each geography, exposure increased from 2000 to 2010 for every pairing except those involving
minority exposure to White residents. The following graphs “Exposure Index by Race and Ethnicity”
show slight increases (upward sloping lines) for exposure to every minority subpopulation for both
each other and for Whites. The three downward sloping lines in each graph illustrate the decline in
exposure of each minority group (Black, Asian and Hispanic) to Whites.
52 John Iceland, Weinberg D.H., and Steinmetz, E. 2002. “Racial and Ethnic Residential Segregation in the United States:
1980-2000.” U.S. Census Bureau. Paper presented at the annual meetings of the Population Association of America,
Atlanta, Georgia.
84
Exposure Index
Interacting Groups 2000 2010 Change
St. Louis County
Black-White 0.38 0.32 -0.06
White-Black 0.09 0.11 +0.02
Hispanic-White 0.79 0.71 -0.08
White-Hispanic 0.01 0.03 +0.02
Asian-White 0.84 0.78 -0.06
White-Asian 0.02 0.04 +0.02
Asian-Black 0.09 0.10 +0.01
Black-Asian 0.01 0.01 -----
Hispanic-Asian 0.03 0.04 +0.01
Asian-Hispanic 0.02 0.03 +0.01
Hispanic-Black 0.15 0.18 +0.03
Black-Hispanic 0.01 0.02 +0.01
City of Florissant
Black-White 0.54 0.48 -0.06
White-Black 0.18 0.30 +0.12
Hispanic-White 0.76 0.60 -0.16
White-Hispanic 0.01 0.02 +0.01
Asian-White 0.75 0.60 -0.15
White-Asian 0.01 0.01 -----
Asian-Black 0.21 0.34 +0.13
Black-Asian 0.01 0.01 -----
Hispanic-Asian 0.01 0.01 -----
Asian-Hispanic 0.01 0.02 +0.01
Hispanic-Black 0.20 0.34 +0.14
Black-Hispanic 0.01 0.02 +0.01
85
Exposure Index (continued)
Interacting Groups 2000 2010 Change
City of O’Fallon
Black-White 0.91 0.89 -0.02
White-Black 0.02 0.04 +0.02
Hispanic-White 0.94 0.89 -0.05
White-Hispanic 0.01 0.03 +0.02
Asian-White 0.94 0.88 -0.06
White-Asian 0.01 0.03 +0.02
Asian-Black 0.02 0.04 +0.02
Black-Asian 0.01 0.03 +0.02
Hispanic-Asian 0.01 0.03 +0.02
Asian-Hispanic 0.02 0.03 +0.01
Hispanic-Black 0.02 0.04 +0.02
Black-Hispanic 0.01 0.03 +0.02
Sources: U.S. Census 2000 SF1 Table P008 and 2010 SF1 Table P5
0.38
0.32
0.090.11
0.79
0.71
0.84
0.78
0.10
0.01
0.03 0.040.02 0.03
0.150.18
0.01 0.020.0
0.1
0.2
0.3
0.4
0.5
0.6
0.7
0.8
0.9
2000 2010
Ex
po
sure
In
de
x
Exposure Index by Race and Ethnicity for St. Louis County
Black-White
White-Black
Hispanic-White
White-Hispanic
Asian-White
White-Asian
Asian-Black
Black-Asian
Hispanic-Asian
Asian-Hispanic
Hispanic-Black
Black-Hispanic
86
Sources: U.S. Census 2000 SF1 Table P008 and 2010 SF1 Table P5
0.91
0.02 0.04
0.940.89
0.01
0.88
0.030.0
0.1
0.2
0.3
0.4
0.5
0.6
0.7
0.8
0.9
1.0
2000 2010
Ex
po
sure
In
de
x
Exposure Index by Race and Ethnicity for the City of O'Fallon
Black-White
White-Black
Hispanic-White
White-Hispanic
Asian-White
White-Asian
Asian-Black
Black-Asian
Hispanic-Asian
Asian-Hispanic
Hispanic-Black
Black-Hispanic
0.54
0.48
0.18
0.30
0.760.75
0.60
0.21
0.01 0.01
0.20
0.34
0.02
0.0
0.1
0.2
0.3
0.4
0.5
0.6
0.7
0.8
2000 2010
Ex
po
sure
In
de
xExposure Index by Race and Ethnicity for the City of Florissant
Black-White
White-Black
Hispanic-White
White-Hispanic
Asian-White
White-Asian
Asian-Black
Black-Asian
Hispanic-Asian
Asian-Hispanic
Hispanic-Black
Black-Hispanic
87
Isolation Index
The Isolation Index (II) measures “the extent to which minority members are exposed only to one
another” (Massey and Denton, p. 288). Not a measure of segregation in a strict sense, the II is a
measure of the probability that a member of one group will meet or interact with a member of the
same group. The II can be viewed more as a measure of sociological isolation.
A simple change in notation from the Exposure Index equation yields the formula for the Isolation
Index given below. This measure is calculated for one racial or ethnic group at a time so unlike the
DI or EI, it does not compare the distribution of two groups. Instead, each calculation measures the
isolation of a single group.
Similar to the EI, this index describes the average neighborhood for racial and ethnic groups. It
differs in measuring social interaction with others of the same group instead of other groups. The II
is the minority weighted average (the first term of the equation) of each tract’s minority population
(the second term) and can be defined as:
where:
Prob = Probability that minority group members share an area with each other
Mini = Minority group population of census tract i
MinT = Minority group regional population
Toti = Total population of census tract i
n = Total number of census tracts in the region.
The II is a region-level measure for each race/ethnicity summed up from tracts within the region.
The II can be interpreted as a probability that has a lower bound of 0.0 (low segregation
corresponding to a small dispersed group) to 1.0 (high segregation implying that group members
are entirely isolated from other groups).
The Isolation Index values for St. Louis County (see the table and graph on the following pages)
show that Whites are considerably isolated from other racial and ethnic groups (index value of
0.81), Blacks are moderately isolated (II of 0.63), and Asians and Hispanics are not isolated (IIs of
0.07 and 0.04, respectively). These numbers mean that in 2010, on average, White residents lived
in tracts that were 81% White and Blacks lived in tracts that were 63% Black. 53
53 The Isolation Index methodology implicitly assumes that the tract populations are evenly distributed within a census tract so that the frequency of social interactions is based on the relative population counts by tract for each race or
88
Florissant followed similar patterns as St. Louis County in terms of isolation indices. White residents
were the most isolated in 2010 with an index value of 0.64, followed by Blacks with a value of 0.46.
Asian and Hispanic residents were not isolated, which is not surprising given their lower population
shares.
In O’Fallon, isolation for Whites in 2010 was quite high at 0.89, while isolation for minority groups
was low (all under 0.05). Again, these figures reflect O’Fallon’s low level of minority population –
being that they make up the vast majority of the population, Whites are more likely to reside near
other Whites, and minority residents are likely to live in tracts with large White populations and
little exposure to other minorities or to other residents of the same race/ethnicity.
As the graphs show, White isolation decreased from 2000 to 2010 in St. Louis County, Florissant,
and O’Fallon. In St. Louis County, isolation increased for each minority group examined. In
Florissant, it increased for Blacks and Hispanics, while remaining constant for Asian residents. In
O’Fallon Black isolation decreased and Asian and Hispanic isolation increased. Most changes were
small, with none above 0.05, with the exception of White isolation in Florissant (decrease of 0.14).
Isolation Index
Group 2000 2010 Change
St. Louis County
White 0.85 0.81 -0.04
Black 0.58 0.63 +0.05
Asian 0.05 0.07 +0.02
Hispanic 0.02 0.04 +0.02
City of Florissant
White 0.78 0.64 -0.14
Black 0.43 0.46 +0.03
Asian 0.01 0.01 -----
Hispanic 0.01 0.02 +0.01
City of O’Fallon
White 0.94 0.89 -0.05
Black 0.05 0.04 -0.01
Asian 0.01 0.04 +0.03
Hispanic 0.02 0.03 +0.01
Sources: U.S. Census 2000 SF1 Table P008 and 2010 SF1 Table P5
ethnicity. Within actual neighborhoods racial and ethnic groups are not homogenous (e.g., families or small area enclaves) so that the chances of one group meeting another of the same group may be different than an even distribution might imply.
89
0.850.81
0.58
0.63
0.05 0.07
0.02 0.040
0.1
0.2
0.3
0.4
0.5
0.6
0.7
0.8
0.9
2000 2010
Iso
lato
n I
nd
ex
Isolation Index by Race and Ethnicity for St. Louis County
White Black Asian Hispanic
0.78
0.64
0.43 0.46
0.01 0.010.02
0
0.1
0.2
0.3
0.4
0.5
0.6
0.7
0.8
0.9
2000 2010
Iso
lato
n I
nd
ex
Isolation Index by Race and Ethnicity for the City of Florissant
White Black Asian Hispanic
90
Entropy Index
Entropy, a mathematical concept based on the spatial evenness of the distribution of population
groups, can be used to calculate diversity among racial and ethnic groups in a geographical area.54
Both the Dissimilarity Index and Exposure Index can only measure the segregation of two groups
relative to each other, but the Entropy Index has the advantage of being able to measure the spatial
distribution of multiple racial and ethnic groups simultaneously.
The Entropy Score (h) for a census tract is given by:
where:
k = Number of groups
pij = Proportion of population of jth group in census tract i (= nij/ni)
nij = Number of population of jth group in tract i
ni = Total population in tract i.
54 Iceland, John. 2004. “The Multigroup Entropy Index (Also Known as Theil’s H or the Information Theory Index).” University of Maryland.
0.940.89
0.05 0.04
0.010.02
0.030
0.1
0.2
0.3
0.4
0.5
0.6
0.7
0.8
0.9
1
2000 2010
Iso
lato
n I
nd
ex
Isolation Index by Race and Ethnicity for the City of O'Fallon
White Black Asian Hispanic
91
The higher the calculated value for h, the more racially and/or ethnically diverse the tract. The
maximum possible level of entropy is given by the natural logarithm (ln) of the number of groups
used in the calculations (Iceland 2004). The maximum score occurs when all groups have equal
representation in the geographic area. In this case k = 3 (non-Hispanic Whites, non-Hispanic Blacks,
and other minority groups taken together55) so the maximum value for h is ln(3) = 1.10. A tract with
h = 1.10 would have equal proportions of all groups (high diversity) and a tract with h = 0.0 would
contain only a single group (low diversity).
The Diversity Index map on the following page shows the results of the tract-level calculations of
the Entropy Score as a measure of diversity in 2010. Visually, it can be seen that high diversity
census tracts (those with highest h values) are located primarily in north and central St. Louis
County. Areas of greatest diversity include St. Ann, Breckenridge Hills, Overland, St. John,
Edmundson, Ferguson, Bellerive, Bel Nor, Normandy, and unincorporated north St. Louis County.
Diversity was lowest in south St. Louis County including the Wildwood, Mehlville, Oakville, Fenton,
Sunset Hills, and unincorporated south St. Louis County areas. Most areas in O’Fallon had relatively
low diversity, with entropy scores in the 0.36 to 0.50 range, although levels of diversity in O’Fallon
were not as limited as in south St. Louis County.
The Entropy Score is not a true measure of segregation because it does not assess the distribution
of racial and ethnic groups across a region. A region can be very diverse if all minority groups are
present but also highly segregated if all groups live entirely in their own neighborhoods (or census
tracts). However, Entropy Scores, measures of tract-level diversity, can be used to calculate the
Entropy Index56 (EI) which measures the distribution of multi-group diversity across tracts and an
entire region.
The EI measures unevenness in the distribution of multiple racial and ethnic groups in a region by
calculating the difference in entropy between census tracts and the larger region as a whole. The
Entropy Index (H) for a region is the weighted average variation of each tract’s entropy score
differenced with the region-wide entropy as a fraction of the region’s total entropy (Iceland 2004):
where:
= Entropy for the region’s tracts as a whole
= Average of the individual census tracts’ values of h weighted by the population
= Entropy Index for the region.
55 Including Hispanics and non-Hispanic Asians, American Indians/Alaska Natives, Native Hawaiians/Pacific Islanders, other races and persons of two or more races. 56 Iceland, John. “Beyond Black and White: Metropolitan Residential Segregation in Multi-Ethnic America,” U.S. Census Bureau, Housing and Household Economic Statistics Division, paper presented at the American Sociological Association meetings, Chicago, Illinois, August 2002.
92
The EI ranges between H = 0.0 when all tracts have the same composition as the entire region
(minimum segregation) to a maximum of H = 1.0 when all tracts contain one group only (maximum
segregation).57 Regions with higher values of H have less uniform racial distributions and regions
with lower values of H have more uniform racial distributions.
57 White, Michael J. 1986. ”Predicted Ethnic Diversity Measures for 318 U.S. Metropolitan Areas by Census Region, 1980.” Population Index, Vol. 52.
93
Diversity Index by Census Tract in St. Louis County, Florissant & O’Fallon: 2010
Source: U.S. Census 2010 SF1 Table P5
94
The below table gives the result of entropy calculations for St. Louis County, Florissant, and O’Fallon.
The Entropy Index in St. Louis County remained at 0.34 from 2000 to 2010, reflecting differing levels
of diversity in tracts throughout the County. In contrast, the Entropy Indices of 0.10 and 0.01 in
Florissant and O’Fallon indicate that levels of diversity are similar in each census tract, and have
remained so even as the cities (especially O’Fallon) added minority population from 2000 to 2010.
Note that this finding does not indicate a high level of diversity, but rather that the racial/ethnic
compositions within each census tract are similar.
Entropy Index
2000 2010 Change
St. Louis County
0.34 0.34 -----
City of Florissant
0.16 0.10 -0.06
City of O’Fallon
0.03 0.01 -0.02
Sources: U.S. Census 2000 SF1 Table P008 and 2010 SF1 Table P5
Reconciliation of the Four Segregation Indices
One important question concerns whether overall racial and ethnic segregation in St. Louis County
and O’Fallon has worsened, improved, or remained about the same between 2000 and 2010. The
four methodologies (Dissimilarity, Exposure, Isolation, and Entropy indices) for analyzing
segregation used in this analysis allow for a possible consensus answer.
The analyses for St. Louis County show that segregation between Blacks and Whites is high and
persistent (with a DI of 0.71 in 2010, up from 0.70 in 2000), and that Whites tend to be isolated with
only limited exposure to Blacks and other minority groups. Black St. Louis County residents also
tend to be isolated from other racial/ethnic groups, although less so than Whites. Tract-level
diversity varies, with most areas of high diversity in north St. Louis County and areas of low
diversity dominating the southern portion of the County.
In O’Fallon, the low level of diversity citywide (88.2% of the population is non-Hispanic White)
means that minority residents tend to have high exposure to Whites, while Whites have low
exposure to minorities, as do minorities residents to one another. All Dissimilarity Index values are
low (0.30 or less), indicating that residential patterns within O’Fallon are relatively similar
regardless of race or ethnicity. The tract-level diversity index scores and citywide Entropy Index
echo these findings – diversity is low throughout O’Fallon but quite similar in each tract.
Stakeholder Input
95
In general, meeting participants and stakeholders think that historical discrimination by whites
against minorities, particularly African Americans, is less of a problem than in the past. However a
number of African Americans who reside in the study area continue to report that discrimination
continues in other forms, particularly what they describe as economic discrimination.
If a meeting participant or stakeholder lived outside the St. Louis County, their perception is that
discrimination and equity are generally not major problems. In contrast, participants who were St.
Louis County residents who were African American were more likely to feel that discrimination and
unequal distribution of public facilities and public services continue to persist.
“White flight” from the City of St. Louis and from St. Louis County was mentioned as a continuing
result of racial discrimination. Homes in these jurisdictions that were previously occupied and
maintained by whites that left often fell into disrepair when they are purchased and some have been
converted into rental properties which become occupied by lower income households. The result
is that these areas become segregated, again.
Some commenters felt that race and financial status are still the major factors causing
discrimination in the area. If you are a poor resident of the study area and live in northern portion
of St. Louis County, you are more likely to be non-white and African-American.
Few commenters cited specific instances of housing discrimination, but others stated that they
believe that housing discrimination continues to occur. As in many regions of the USA, participants
commented that housing discrimination has become more subtle.
Stakeholders’ suggestions on ways to overcome discrimination, reduce segregation, and make
access to housing more equitable included:
improve income for low-income households and households in poverty; balance the mixture of owner and renter occupied properties and add mixed income units; improved education levels; better cooperation between cities and counties; more cross-cultural exchanges and education; more education about ways to break the discrimination cycle; increased focus on discrimination toward Hispanics and other immigrant nationalities and
ethnicities and increase fair housing counseling to these groups; renewal of efforts to educate housing consumers on housing options and about protections
available to combat housing discrimination; and more housing counseling for homeowners, renters, and especially for landlords.
96
Public Investment, Infrastructure and Education
Housing availability and affordability in the study areas are linked to public resources being
expended for essential services. This section addresses transportation services and the availability
of safe and accessible water and sanitary sewer systems that collect, treat, and discharge
wastewater.
Transportation
The St. Louis region has been a transportation crossroads since the earliest days of occupancy by
Native Americans and subsequently by settlers of European origin. Today the region is connected
to the other parts of the nation through interstate highways conjoined in St. Louis, serving east-west
(I-70, I-64 and I-44) and north-south (I-55) travel. Interstates I-170, I-270, and I-255, plus an
extensive network of Federal, State and local highways and roads provide additional connectivity.
Public Transportation (known as “Metro”) is provided by the Bi- State Development Agency through
a fleet of buses, light rail and paratransit vehicles that provided 47 million tips to its patrons during
2013.58 Metro serves the City of St. Louis County, St. Louis County (including the City of Florissant),
and St. Clair County, Illinois, but does not provide service to the City of O’Fallon.59
The Port of Metropolitan St. Louis is the northernmost location on the Mississippi River that
remains open year-round and is the location that is the southernmost lock-free location for travel
to the Gulf of Mexico. The study area is also served by barge service at terminals operated by the St.
Louis County Port Authority. Other terminals in the St. Louis area are owned by the City of St. Louis
Port District, the Jefferson County Port Authority, and the Tri-City Port Authority.60
Air service is available in the study area from three airports located in St. Louis County61 and one
located in St. Charles County62:
Lambert-St. Louis International
Creve Coeur
Spirit of St. Louis
St. Charles County Smartt
The St. Louis region mirrors many other parts of the nation where investments for transportation
have been primarily directed to highway system development, which is used by most residents to
58 East-West Gateway Council of Governments, “OneSTL - Many Communities, One Future,” December 2013, Page 46. 59 St. Louis County, Department of Planning, “Fact Book 2008-2012,” Page 63 60 St. Louis County, Department of Planning, “Fact Book 2008-2012,” Page 72 61 St. Louis County, Missouri, Department of Planning, “Fact Book 2008-2012,” Page 61 62 St. Charles County, Missouri, Source:
satisfy their transportation needs. On an average day a resident of the region drives 24.9 miles.
When compared with other similar regions, the area ranks 7 of 35, in terms of vehicle miles traveled
(VMT) per capita (see the following tables and maps). While the current highway system works well
with relatively low congestion levels and per-mile travel times compared to other similar regions,
reliance on highways and single-occupancy automobile travel limits the mobility of households who
do not own or have access to private automobiles or who are looking for alternative modes of
transportation.63
The U.S. Bureau of Census, American Community Survey (ACS) 2008-2012, reported that the longest
mean commute times were from residents of O’Fallon (26.3 minutes), with Florissant residents
spending 23.9 minutes and commuters from St. Louis County traveling 23.5 minutes. By
comparison, the mean commute time for other residents of Missouri was 23.2 minutes, while the
mean travel time for residents of the other 49 states was 25.4 minutes.64
Workers who used public transit, as recorded by the ACS 2008-2012, were 2.4% from St. Louis
County, 1.5% from Florissant, and 0.2% from O’Fallon. The percentages from Missouri and from
the USA were 1.5% and 5.0%, respectively.65
63 East-West Gateway Council of Governments, “OneSTL - Many Communities, One Future,” December 2013, Pages 23-24 64 U.S. Bureau of Census, American Factfinder, American Community Survey 2008-2013, DP03 – Selected Economic
Characteristics 65 U.S. Bureau of Census, American Factfinder, American Community Survey 2008-2013, DP03 – Selected Economic
Characteristics
98
Workers 16 and Older Commuting to Work in St. Louis County, Florissant and O’Fallon, 2008-2013
Method Number of
Commuters Share of
Commuters
St. Louis County
Workers 16 and Older 478,292 100%
Car, Truck or Van and Driving Alone 398,934 83.4%
Car, Truck or Van and Carpooling 33,755 7.1%
Public Transportation (excluding taxis) 11,358 2.4%
Walked 7,592 1.6%
Other Means 5,305 1.1%
Worked at Home 21,348 4.5%
Mean Travel Time to Work (minutes) 23.5 n/a
City of Florissant
Workers 16 and Older 25,558 100%
Car, Truck or Van and Driving Alone 22,137 86.6%
Car, Truck or Van and Carpooling 1,839 7.2%
Public Transportation (excluding taxis) 375 1.5%
Walked 235 0.9%
Other Means 280 1.1%
Worked at Home 692 2.7%
Mean Travel Time to Work (minutes) 23.9 n/a
City of O’Fallon
Workers 16 and Older 40,794 100%
Car, Truck or Van and Driving Alone 36,236 88.8%
Car, Truck or Van and Carpooling 2,306 5.7%
Public Transportation (excluding taxis) 99 0.2%
Walked 239 0.6%
Other Means 324 0.8%
Worked at Home 1,590 3.9%
Mean Travel Time to Work (minutes) 26.3 n/a
Source: U.S. Bureau of Census, American Factfinder, American Community Survey 2008-2013, DP03 – Selected Economic Characteristics
99
100
One of the major themes of the St. Louis Region’s sustainability plan completed in December 2013
by the East-West Gateway Council of Governments was to be “Connected.” Implementation of this
segment of the OneSTL plan is intended to ”(d)evelop and maintain a safe, accessible, multi-model
transportation system that connects local communities and links the region to the nation.”66
The goals adopted for the OneSTL “Connect” theme are:
Goal 1: Utilize transportation assets to stimulate economic development.
o Objective: Facilitate efficient freight movement.
o Objective: Support Transit Oriented Development (TOD).
o Objective: Expand complete streets and Great Streets throughout the region.
Goal 2: Integrate transportation and land use planning.
o Objective: Prioritize projects for regional transportation investments that integrate land-
use planning, economic, environmental and equity considerations.
o Objective: Develop a Long Range Transportation plan that is consistent with OneSTL and
national sustainability standards.
o Objective: Review and revise local Transportation Improvement Program to be consistent
with OneSTL and national sustainability standards.
Goal 3: Expand public transit accessibility and utilization.
o Objective: Increase transit ridership.
o Objective: Increase access to transit.
Goal 4: Advance active transportation initiatives.
o Objective: Improve bicycle and pedestrian accessibility and safety through the “5 e’s”:
education, engineering, encouragement, enforcement and evaluation.
o Objective: Increase bicycle and pedestrian mode share.
Goal 5: Effectively manage and maximize the efficiency of existing transportation
assets.
o Objective: Prioritize limited resources on rehabilitating and replacing aging infrastructure
over system expansion.
o Objective: Utilize transportation demand management strategies to reduce regional
vehicle miles traveled (VMT).
Goal 6: Provide a safe and secure transportation system.
o Objective: Reduce annual fatalities and serious injuries for all transportation modes.
o Objective: Improve transportation security.
66 East-West Gateway Council of Governments, “OneSTL - Many Communities, One Future,” December 2013, Page 104.
101
The member governments in the study area can make jobs and housing more accessible to their
residents if they would implement those goals and objectives from OneSTL that are financially
feasible and that contribute to a more sustainable future for the region.
The following maps reflect the current Metro transit bus routes and the MetroLink rail lines. Moving
forward, particular attention should be devoted to increasing transit ridership and access to transit
in unserved and underserved areas, as recommended in Goal 3 of the OneSTL plan. The objective
to support Transit-Oriented Development under Goal 1 would also increase access to jobs services,
and housing for the residents of the study area.
Another important goal of OneSTL that is pertinent to the AI is Goal 4, with emphasis on increasing
pedestrian access. Persons who must or choose to use transit often must walk for a portion of their
transit trip. Attention should be directed toward ensuring that such walking routes are accessible
to persons with disabilities.
The lack of transit accessibility in O’Fallon was mentioned frequently among stakeholders and
survey respondents. Policy makers in O’Fallon should reexamine this need in response to the
comments received and in light of the OneSTL goals and objectives dealing with transit accessibility.
Funding for Transportation
Transportation Improvement Program67
The Transportation Improvement Program (TIP) is a listing of transportation improvements
planned by various agencies in the St. Louis metropolitan area. The Federal Government requires
that the TIP must be developed and approved by an entity known as the Metropolitan Planning
Organization (MPO). The East-West Gateway Council of Governments (EWGCOG), a voluntary
association of local governments, has been designated by the governors of Missouri and Illinois and
the U.S. Department of Transportation as the MPO for the St. Louis region.
The Council, formed in 1965, consists of more than 200 villages, cities, and counties and is the only
organization of local governments that spans the entire Missouri-Illinois St. Louis region. The
agency’s 24-member Board of Directors consists of the area’s chief local elected officials and
selected citizens. Representatives of the two state transportation agencies, the Missouri
Department of Transportation (MoDOT), the Illinois Department of Transportation (IDOT),
Missouri Office of Administration, the Illinois Department of Commerce and Economic Opportunity,
and the chairman of the Bi-State Development Agency (doing business as Metro), are non-voting
members of the Board.
In the St. Louis region, the projects identified in the TIP are given priorities based on, and consistent
with, the region’s current long-range transportation plan developed by the EWGCOG.
67 East-West Gateway Council of Governments, “Transportation Improvement Program 2014-2017,” July 21, 2013, Page 1
102
The counties included in the St. Louis metropolitan planning area and in the TIP include Franklin,
Jefferson, St. Charles, and St. Louis counties and the City of St. Louis in Missouri and Madison,
Monroe, and St. Clair counties in Illinois.
TIP Projects - FY 2014-201768
The FY 2014-2017 TIP contains 822 projects (239 new and 583 reprogrammed) at a total cost of
approximately $2.08 billion in federal, state, local, and private funding. The TIP continues the
region’s emphasis on preserving the existing infrastructure, committing 40.7% of the total program
($846.5 million over the next four years) to resurface and reconstruct roads, repair/replace bridges,
and replace other aging transportation systems and facilities.
Nearly ten percent of the total program ($213.4 million) is allocated to adding capacity in the form
of new roads, new bridges, and new lanes on existing roads. Projects to improve the operations
and/or safety of the region’s transportation facilities account for $218.2 million (10.5% of the total
program). The transit category consists of $591.7 million or 28.4 % of the total program. This
category contains projects such as fixed rail expansion, MetroLink Improvements, service vehicles,
operations and for providing upgrades and maintenance for non-MetroLink equipment and
facilities.
Approximately $121 million or 5.8% is dedicated to paybacks, including $54 million to payback
bonds issued for the I-64 reconstruction project. The remaining $89.2 million or 4.3% falls under
the “Other” category. This includes such projects as bike trails, sidewalk improvements,
landscaping, education programs, and system enhancements.
When combined, Transit and Other (including investments for sidewalks) represent 32.7% of total
programmed funds for this TIP 4-year period.
The cost of housing, when combined with the cost of transportation, represent a significant portion
of the total household income for persons whom HUD classifies as very low-income (50% of Area
Median Income). Attention should be given by policy-makers in the study area to allocate
sufficiency funding to transit options that will help make public transportation available and
affordable for these residents of the St. Louis region. This consideration is particularly important
for areas that are not currently served by transit.
Stakeholder Input
A number of meeting participants stated, in various ways, that the key to a household’s ability to
obtain suitable and affordable housing is income and the key to adequate income is obtaining and
holding a good job and having suitable, affordable, and reliable transportation to that job.
68 East-West Gateway Council of Governments, “Transportation Improvement Program 2014-2017,” July 21, 2013, Page 15
103
Some stakeholders from O’Fallon noted that no public transit is available in that portion of the St.
Louis region and this is an impediment to obtaining suitable employment near their residence for
persons in poverty and those with low incomes. Few comments were received citing transit
deficiencies in St. Louis County.
Conclusion
While the study area has an extensively developed highway system, continuing reconstruction is
needed due to the age of many of these highways and road.
Residents of O’Fallon need improved access to public transit. Currently they must rely on private
automobiles to reach affordable housing, employment, and services; and the commute times from
O’Fallon average 26.3 minutes, the longest time for residents of St. Louis County, and the cities of
Florissant and O’Fallon.
104
105
Water Supply and Wastewater Treatment
Water Supply
The American Society of Civil Engineers developed a “2013 Report Card” that evaluated the
infrastructure located in the State of Missouri. Overall, Missouri received a grade of C-.69
One part of The ASCE report looked at drinking water systems in the state and gave the state a C-.
The Report Card summarized the state’s water supply systems as follows:
”Missouri’s public drinking water systems will require significant investment to maintain current
service levels to its citizens in the future. According to the 2007 Needs Survey, which sampled about
14 percent of Missouri’s community systems, over $7.1 billion of financial need for maintaining the
same level of service was reported by its public drinking water systems.”
The majority of the need was for transmission and distribution at approximately 68 percent ($4.8
billion) while only 18 percent ($1.3 billion) was for treatment facilities. The problem is evident in
Missouri’s two largest cities, as seen in the growing number of water main breaks in recent years.
At over 1,500 water main breaks in 2011, Kansas City broke its previous record of 1,430 in 2000.
Similarly, St. Louis is seeing significant issues with its water distribution system with the average
age of 55 to 65 years old for its distribution mains. This aging has created a $680 million funding
69American Society of Civil Engineers, “2013 Report Card for Missouri’s Infrastructure”
gap for water systems in St. Louis based on a private report by CDM Smith. The required
replacement, in addition to an annual one percent water main replacement in St. Louis, is 34 miles.”
Drinking water systems in the study area are operated by a combination of public and private
operators, with Missouri American Water identified as the supplier to approximately 1.2 million
residents of St. Louis, St. Charles, and Jefferson counties with an average daily usage of 180 million
gallons.70,71
As the largest water supplier
Missouri American Water is a part of
the larger American Water Works
Company that serves approximately
14 million people in 40 states and
parts of Canada.72
Residents of the City of O’Fallon
receive water from the city, from 2
other water districts and from
Missouri American Water (see the
following map).
70 Metro Water Infrastructure Partnership, Source: http://www.adaywithoutwater.net 71 American Water, Source: http://www.amwater.com/moaw/water-quality-and-stewardship/water-quality-reports.html and “Fact Sheet 2014.” 72 American Water Works Company, Inc., Source: http://ir.amwaater.com; “2013 Annual Water Quality Report: St. Louis County/St. Charles County”
107
Research conducted for this study did not reveal any consistent and/or recurring problems with
the delivery of an adequate supply of safe drinking water in the study area. However, as the water
systems are aging, long-term investments for systems updates must occur to ensure that these
systems can provide safe drinking water to their customers.
Wastewater Treatment
Wastewater treatment is provided to most of the
study area by the Metropolitan St. Louis Sewer
District (MSD) which has a service area of 525 square
miles including 62 square miles in the City of St. Louis
and 462 square miles (90%) of St. Louis County. The
network operated by the MSD contained 9,578 miles
of collection and trunk sewers and force mains, as of
October 16, 2013. Approximately 311 miles of the
MSD sewers are more than 120 years old and
approximately 524 miles are more than 80 years old.
The MSD operates seven wastewater treatment
plants that treated an average of 356 million gallons
of wastewater per day from 2009-2012.73
The City of O’Fallon provides sewer service to its
residents and to other areas outside the city (see the
following map).
The MSD is a party to a 2011 settlement agreement
with the U.S. Environmental Protection Agency as a result of illegal sewage overflows of untreated
sewage, including basement backups, and to reduce pollution into waterways. Under the
agreement, the MSD is making $4.7 billion in system improvements over 23 years, including
spending $100 million in a green infrastructure program targeted to low-income and minority
communities that been disproportionately impacted by air water and land pollution.74,75
The MSD is using a $945 million bond issue passed by the voters of the City of St. Louis and St. Louis
County in 2012 to finance work on projects that are required under the agreement with EPA.76
Major parts of the construction include constructing large underground storage tunnels with the
73 Metropolitan St. Louis Sewer District, Source: http://www.stlmsd.com/aboutmsd 74 The Metropolitan St. Louis Housing and Opportunity Council, “Fair Housing Equity Assessment” for “OneSTL: Many Communities. One Future,” Page 110 75 St. Louis Business Journal, Source: http://www.bizjournals.com/stlouis/news/2011/08/04/st-louis-msd-epa-file-47-billion.html ; http://www.bizjournals.com/stlouis/print-edition/2011/11/04/epa-msd-47-billion-decree-must.html ; http://www.bizjournals.com/stlouis/news/2013/03/27/msds-board-approves-hoelscher-as-new.html 76 The Metropolitan St. Louis Housing and Opportunity Council, “Fair Housing Equity Assessment” for “OneSTL: Many Communities. One Future,” Page 110
108
longest being 9 miles in length and 28 feet in diameter, expanding sewage treatment plant capacity,
and repair on sewer pipes throughout the MSD service territory, including the City of St. Louis and
approximately 80% of St. Louis County.77
The St. Louis Business Journal reported that Jack Strauss, Director of the Simon Center for Regional
Economics at Saint Louis University, projected that the total project will create 25,500 jobs and
boost the local economy equaling $3.5 billion.78
While carrying out the $4.7 billion construction, the MSD has also increased its goal for minority-
owned contractors to 25% and 5% for women-owned contractors. It also requires that construction
contracts of $500,000 or more must have at least 25% of its workforce who are minorities and 6.9%
who are women.79
Jobs created by the MSD construction project are providing employment opportunities for low-
income and minority residents of the study area and increased contracting possibilities for minority
and women-owned businesses.
One negative impact of the project for MSD customers who are on fixed incomes or who are very
low-income will be the projected increase in sewer rates necessary to retire the bond financing for
the $4.7 billion construction project. The MSD announced in June 2012 that typical household sewer
bills would increase from approximately $29 per month to about $44 per month.80
Conclusion
Jobs created by the MSD construction project are providing employment opportunities for low-
income and minority residents of the study area and the increased contracting possibilities for
minority and women-owned businesses. The construction product will be a positive benefit who
members of protected classes who are employed by the MSD construction improvements.
The projected increase in sewer rates necessary to retire the bond financing for the $4.7 billion
construction project will create a negative impacts on the budgets of MSD customers who have low
incomes and/or live on fixed incomes, many of whom may be members of protected classes under
the Fair Housing Act of 1968.
77 St. Louis Business Journal, Source: http://www.bizjournals.com/stlouis/print-edition/2013/01/18/work-in-the-st-louis-
pipeline.html 78 St. Louis Business Journal, Source: http://www.bizjournals.com/stlouis/print-edition/2013/01/18/work-in-the-st-louis-
pipeline.html 79 St. Louis Business Journal, Source: http://www.bizjournals.com/stlouis/print-edition/2013/01/18/work-in-the-st-louis-
pipeline.html 80 St. Louis Public Radio, June 14, 2012, Source: http://news.stlpublicradio.org/post/msd-board-expected-finalize-series-rate-
increases
109
Education and Schools Analysis
The presence of high quality education systems and facilities is closely connected with decision-
making by individuals and families on where they choose to live. This section reports on the
performance of public schools serving the residents of St. Louis County and the cities of Florissant
and O’Fallon. Also explored are the relationships among educational attainment, education
resources and housing choices.
Educational Attainment Levels
Total enrollment in schools located in St. Louis County (including the City of Florissant) decreased
by 3.7% from 281,608 in 2000 to 270,943 in 2012.81 During the same period, persons 25 years of
age and older with some college, but no degree increased from 15.1% in 2000 to 22.1% in 2012.
Residents who were 25 and older who had earned Bachelor’s Degrees increased from 22% in 2000
to 23.5% in 2012.82
For schools serving the City of O’Fallon, total enrollment increased by 74.7% from 13,698 in 2000
to 23,934 in 2012. Persons 25 years of age and older with some college, but no degree increased
from 16.1% in 2000 to 22.7% in 2012. The percentage of O’Fallon residents who had earned
Bachelor’s degrees increased from 20.2% in 2000 to 26.0% in 2012.83
For the State of Missouri, persons in the same age group who had some college, but no degree
represented 14% of the population in 2000 and 22.8% in 2012, while the percentages for the United
States were 14% in 2000 and 21.3% in 2012.84
Missouri residents who had earned Bachelor’s degrees were 14.0% of the population in 2000 and
16.2% in 2012, while the percentages for the United States were 15.5% in 2000 and 17.9% in
2012.85
Compared with the State of Missouri and the United States in 2012, persons who were 25 years of
age and had some college but no degree or who had earned Bachelor’s degrees represented larger
percentages of such individuals in St. Louis County and in O’Fallon.
81 U.S. Census Bureau, American Factfinder, Census 2000, QT-P19; American Community Survey, 2008-2012, S1401. 82 U.S. Census Bureau, American Factfinder, Census 2000, QT-P20; American Community Survey, 2008-2012, S1501. 83 U.S. Census Bureau, American Factfinder, Census 2000, QT-P20; American Community Survey, 2008-2012, S1501 84 U.S. Census Bureau, American Factfinder, Census 2000, QT-P20; American Community Survey, 2008-2012, S1501 85 U.S. Census Bureau, American Factfinder, Census 2000, QT-P20; American Community Survey, 2008-2012, S1501
110
State of Missouri – Oversight of Local School Districts86
The Department of Elementary and Secondary Education (DESE) is the administrative arm of the
State Board of Education of Missouri. It is primarily a service agency that works with educators,
legislators, government agencies, community leaders and citizens to maintain a strong public
education system. Through its statewide school-improvement activities and regulatory functions,
the Department strives to assure that all citizens have access to high-quality public education. DESE
does not regulate, monitor or accredit private, parochial or home schools.
The Department’s responsibilities range from early childhood to adult education services. The
Department employs about 1,700 people throughout the state and has a total budget of about $5.4
billion. About 96 percent of the budget consists of state and federal funds that are distributed to
local school districts and other agencies.
Local School Districts in St. Louis County/City of Florissant and Serving the City of O’Fallon87
St. Louis County has 23 separate public school districts that are described here using organizational
and performance information about each district.
The City of O’Fallon is served by three public school districts. Data similar to that presented for St.
Louis County and the City of Florissant is depicted for the O’Fallon area of St Charles County.
Local School Boards, School District Descriptions, Facilities and Enrollments88
Governing Boards
The public school districts in St. Louis County and those in St. Charles County serving the City of
O’Fallon are governed by 7-member Boards of Education elected by voters in their respective
districts. Education professionals provide the daily operational and instructional staff for the
districts.
St. Louis County/City of Florissant School District Descriptions, Facilities and Enrollments
Twenty-three public school districts serve the residents of St. Louis County and the City of
Florissant. While 22 of the 23 school districts are provide general purpose academic programs, the
Special School District of St. Louis County (SSD) is a unique entity created in December 1957 to
support the educational needs of children with disabilities. The SSD’s role was expanded in 1966
when the district added technical education to its mission. In addition to its elected Board of
86 Missouri Department of Elementary and Secondary, http://www.mo.gov/government/guide-to-missouris-government/department-of-elementary-and-secondary-education http://www.mo.gov/government/guide-to-missouris-government/department-of-elementary-and-secondary-education 87 Missouri Department of Elementary and Secondary, http://www.mo.gov/government/guide-to-missouris-government/department-of-elementary-and-secondary-education http://www.mo.gov/government/guide-to-missouris-government/department-of-elementary-and-secondary-education 88 Missouri Department of Elementary and Secondary Education, School District and School Information: http://mcds.dese.mo.gov/guidedinquiry/Pages/District-and-School-Information.aspx
111
Education, the SSD has a 22-member Governing Council created by the Missouri legislature in 1996.
Each of other districts has a representative on the Council.89
The 23 separate school districts have 7-member elected Boards of Education that are the governing
bodies for the respective districts.90 A St. Louis County map with the school districts identified is
provided at the end of this section.
The table on the following page includes all 23 school districts in St. Louis County with the number
of school facilities in each district, and current year (2014) enrollments compared with the State of
Missouri.
The 23 school systems have 353 school facilities with the SSD having the most facilities (106) and
the fewest are in Bayless, Hancock Place, and Valley Park, each having the 3 facilities.
The Rockwood District has the highest enrollment (21,612) and Brentwood had the lowest
enrollment (810) of districts located in St. Louis County. The Rockwood District had the 3rd largest
enrollment of all school districts in Missouri and Hazelwood ranked 6th. While not in St. Louis
County, the adjacent City of St. Louis district had the 2nd largest enrollment (24,869) in Missouri.
89 Special School District of St. Louis County, website; www.ssd.k12.mo.us 90St. Louis County Planning Department, “2007-2012 Fact Book, Page 72 – Website links for 23 school districts
112
St. Louis County Public School Facilities and Enrollment, 2014
School District Number of
School Facilities
2014 Total Enrollment
% of State
Enrollment
Statewide Enrollment
Ranking
Current Accreditation
Status
Affton 4 2,376 0.3% 88 Accredited
Bayless 3 1,618 0.2% 120 Accredited
Brentwood 4 810 0.1% 208 Accredited
Clayton 5 2,587 0.3% 80 Accredited
Ferguson-Florissant 24 11,636 1.3% 15 Accredited
Hancock Place 3 1,444 0.2% 132 Accredited
Hazelwood 32 17,968 2.0% 6 Accredited
Jennings 8 2,537 0.3% 82 Provisional
Kirkwood 9 5,608 0.6% 33 Accredited
Ladue 6 4,094 0.5% 52 Accredited
Lindbergh 8 6,041 0.7% 28 Accredited
Maplewood-Richmond Heights
4 1,200 0.1% 151 Accredited
Mehlville 17 10,757 1.2% 19 Accredited
Normandy 9 2,939 0.3% 76 Unaccredited
Parkway 28 17,157 1.9% 10 Accredited
Pattonville 11 5,650 0.6% 32 Accredited
Ritenour 9 6,369 0.7% 25 Accredited
Riverview Gardens 13 4,871 0.6% 38 Unaccredited
Rockwood 30 21,612 2.4% 3 Accredited
Special School Dist. of St. Louis County
106 3,921 0.4% 56 Accredited
University City 7 3,030 0.3% 71 Accredited
Valley Park 3 4,409 0.5% 47 Accredited
Webster Groves 10 2,376 0.3% 88 Accredited
Total 353 141,01
0 15.9% N/A N/A
Source: Missouri Department of Elementary and Secondary Education, School District and School Information, http://mcds.dese.mo.gov/guidedinquiry/Pages/District-and-School-Information.aspx
The following table lists the most currently available (2013) demographics of student enrollment
Special School District of St. Louis County 53.5% 41.3% 1.6% 1.5% 0.2%
University City 12.6% 82.5% 2.3% 1.4% 0.2%
Valley Park 61.9% 22.7% 5.9% 5.1% 0.2%
Webster Groves 74.3% 18.7% 2.1% 2.3% 0.4%
Source: Missouri Department of Elementary and Secondary Education, School District and School Information, http://mcds.dese.mo.gov/guidedinquiry/Pages/District-and-School-Information.aspx
City of O’Fallon School District Descriptions, Facilities and Enrollments
The next table lists all 3 school districts in St. Charles County that serve the City of O’Fallon, the
number of school facilities in each district, and current year (2014) enrollments compared with the
State of Missouri. A map at the end of this section identifies the location of the districts.
The 3 school districts have 61 school facilities – 24 facilities in Ft. Zumwalt, 21 in Francis Howell
and 16 in Wentzville.
The Ft. Zumwalt District has the highest enrollment (18,382), followed by Francis Howell (17,462)
and Wentzville (14,223). The total enrollments of these districts rank numbers 5, 8, and 11,
114
respectively in the State of Missouri. All three school districts are currently accredited by the
Missouri Department of Elementary and Secondary Education.
The following table lists the most current (2013) demographics of student enrollment in school
districts serving the City of O’Fallon.
Demographics of Enrollment in O’Fallon Public School Districts, 2013
School District Name Student Race/Ethnicity
White % Black % Hispanic % Asian % Indian %
Ft. Zumwalt 85.1% 7.2% 2.7% 3.4% 0.1%
Francis Howell 84.2% 5.5% 3.8% 3.1% 0.2%
Wentzville 85.7% 7.8% 3.1% 2.0% 0.4%
Source: Missouri Department of Elementary and Secondary Education, School District and School Information, http://mcds.dese.mo.gov/guidedinquiry/Pages/District-and-School-Information.aspx
School District/School/Student Performance
School and school district performance data is used in the accreditation process across the nation.
Standard measures used include graduation rates, dropout rates, Annual Yearly Progress under the
Federal “No Child Left Behind” requirements, and other measures applied from state-to-state.
Selected performance data for the school districts located in St. Louis County and those serving
O’Fallon are presented in the following tables, compared with the State of Missouri, and the United
States.
Graduation Rates – 2013
The State of Missouri average graduation rate for public school districts in 2013 was 85.6%.
Seventeen of the 23 districts in St. Louis County exceeded the state average and 19 surpassed the
O’Fallon Public School Facilities and Enrollment, 2014
School District Name Number of
School Facilities
Total Enrollment
Share of State
Enrollment
Statewide Enrollment
Ranking
Current Accreditation
Status
Ft. Zumwalt 24 18,382 2.1% 5 Accredited
Francis Howell 21 17,462 2.0% 8 Accredited
Wentzville 16 14,223 1.6% 11 Accredited
Total 61 50,067 5.6% N/A N/A
Source: Missouri Department of Elementary and Secondary Education, School District and School Information, http://mcds.dese.mo.gov/guidedinquiry/Pages/District-and-School-Information.aspx
115
latest national average (80.0%). The highest graduation rate among school districts in St. Louis
County was Clayton (99.5%) and the lowest rate was Normandy (45.4%).
All three of the school districts serving the City of O’Fallon exceeded the state average and national
averages with graduation rates of 91.3% in Ft. Zumwalt, 97.1% in Francis Howell, and 95.5% in
Wentzville.
Dropout Rates – 2013
High School dropout rates in St. Louis County ranged from 0.0% in the Hancock Place district to
24.7% in Normandy. When looking at all districts in St. Louis County except Normandy, the highest
rates were Riverview (6.6%) and Ferguson-Florissant (5.9%). Eighteen of the districts were ranged
from 0.0% to 3.7%, with 17 districts having dropout rates less than the 2.9% state average.
Nineteen districts had dropout rates lower than the 3.3% national average.
High School dropout rates for the districts serving O’Fallon were very low for all three districts at
1.8% in Ft. Zumwalt, 0.7% in Francis Howell, and 1.0% in Wentzville.
Adequate Yearly Progress (AYP) – 2011
The most recent data posted by the State of Missouri for this measure is from 2011. The data show
that only one St. Louis County school district (Brentwood) was in compliance with AYP. The data
also showed that 18 districts had received AYP sanctions for at least 8 years. While not making
progress for one specific year is somewhat troubling for a district, a greater concern occurs when
districts are under multi-year sanctions for non-compliance with AYP. Non-compliance can
ultimately affect the receipt of Federal funding and the knowledge of the loss of funding for schools
may affect where people choose to live.
The data show that none of the three districts serving O’Fallon were in compliance with AYP. The
data also showed that all 3 districts had received AYP sanctions for at least 8 years.
While not making progress for one specific year is troubling for a district, a greater concern occurs
when districts are under multi-year sanctions for non-compliance with AYP. Non-compliance can
ultimately affect the receipt of Federal funding and the knowledge of the loss of funding for schools
may affect where people choose to remain in the current housing or to purchase or rent housing.
ACT Scores – 2013
The State of Missouri tracks composite ACT scores for all students, schools, and districts. The
standardized test is used, in part, as a tool in college admission decisions and in the award of
scholarships. The following tables present the ACT scores for school districts in St. Louis County
and for the districts serving the City of O’Fallon.
In St. Louis County, 2013 composite school district ACT scores ranged from 15.7 (Riverview
Gardens) to 25.3 (Clayton). Eleven (47.8%) of the 23 districts had scores that exceeded the State of
Missouri average score (21.60) and 13 districts (56.5%) exceeded the national average score (20.9).
116
All three districts serving O’Fallon exceeded the state and national averages with composite scores
of 22.4 in Ft. Zumwalt, 22.7 in Francis Howell, and 22.7 in Wentzville.
Homebuyers and renters often consult standardized national tests scores like ACT as a reference on
how well schools and districts perform. With only 47.8% of the districts in St. Louis County
exceeding the State average ACT score in 2013, this performance factor could limit where persons
may choose to live or may serve as a factor in their choosing where to live. High test score in school
districts serving O’Fallon are a positive factor in influencing housing choices in those locations.
St. Louis County Public School Performance Indicators, 2013
School District 2013
Graduation Rate
2013 Dropout
Rate
2011 AYP* Status
Years Receiving
AYP Sanctions
2013 Composite ACT Score
Affton 94.1% 1.6% Not Met 5 21.4
Bayless 91.0% 2.9% Not Met 8 21.0
Brentwood 98.4% 0.4% Met 4 23.7
Clayton 99.5% 0.0% Not Met 4 25.3
Ferguson-Florissant 79.4% 5.9% Not Met 9 18.1
Hancock Place 97.3% 0.0% Not Met 8 20.0
Hazelwood 89.4% 2.2% Not Met 8 18.0
Jennings 84.7% 2.6% Not Met 8 16.7
Kirkwood 98.4% 0.4% Not Met 8 23.9
Ladue 97.9% 0.5% Not Met 8 25.1
Lindbergh 96.1% 1.1% Not Met 4 24.0
Maplewood-Richmond Heights 93.3% 0.6% Not Met 8 19.6
Mehlville 95.1% 1.1% Not Met 8 22.6
Normandy 45.5% 24.7% Not Met 8 16.8
Parkway 95.7% 1.1% Not Met 8 22.8
Pattonville 90.3% 2.5% Not Met 6 22.1
Ritenour 84.6% 3.7% Not Met 8 18.7
Riverview Gardens 64.0% 6.6% Not Met 8 15.7
Rockwood 96.4% 1.0% Not Met 8 23.5
Special School Dist. of St. Louis County 94.7% 0.8% Not Met 8 16.6
University City 67.3% 4.8% Not Met 8 18.1
Valley Park 95.1% 0.7% Not Met 8 22.1
Webster Groves 97.0% 0.8% Not Met 8 23.4
State of Missouri 85.6% 2.9%** N/A N/A 21.6
United States 80.0% 3.3%** N/A N/A 20.9
*AYP = Adequate Yearly Progress **2011-2012
Sources: Missouri Department of Elementary and Secondary Education, School District and School Information,
http://mcds.dese.mo.gov/guidedinquiry/Pages/District-and-School-Information.aspx; United States Department of
Education, National Center for Educational Statistics, “Digest of Education Statistics, 2013,
http://nces.ed.gov/programs/digest/d13/tables/dt13_219.70.asp; ACT (Formerly American College Testing),
City of O’Fallon Public School Performance Indicators, 2013
School District Name
2013 Graduation
Rate
2013 Dropout
Rate
2011 AYP* Status
Years Receiving
AYP Sanctions
2013 Composite ACT Scores
Ft. Zumwalt 91.3% 1.8% Not Met 8 22.4
Francis Howell 97.1% 0.7% Not Met 8 22.7
Wentzville 95.5% 1.0% Not Met 8 22.7
State of Missouri 85.6% 2.9%** N/A N/A 21.6
United States 80.0% 3.3%** N/A N/A 20.9
*AYP = Adequate Yearly Progress **2011-2012
Sources: Missouri Department of Elementary and Secondary Education, School District and School Information, http://mcds.dese.mo.gov/guidedinquiry/Pages/District-and-School-Information.aspx; United States Department of Education, National Center for Educational Statistics, “Digest of Education Statistics, 2013, http://nces.ed.gov/programs/digest/d13/tables/dt13_219.70.asp; ACT (Formerly American College Testing), http://www.act.org/newsroom/data/2013/states.html
Missouri School Improvement Program (MSIP)
The state of Missouri created the Missouri School Improvement Program (MSIP) in 1990 to serve
as the state’s school accountability system that is used to review and accredit public school districts.
Annual Performance Reports (APRs) are produced by MSIP for every public school and district, with
the State Board of Education making the final classification determinations for schools district.
Twenty-one of the 23 school districts in St. Louis County are currently accredited under MSIP. Only
2 public school districts in Missouri are currently unaccredited and both are located in St. Louis
County: Normandy and Riverview Gardens.91 While having 2 unaccredited districts is a serious
concern, the presence of 21 accredited districts in St. Louis County is a positive factor in the
availability of good schools as a consideration in making housing choices.
The next table contains a summary of the MSIP 2013 ratings for all 23 school districts in St. Louis
County. The overall ratings are derived from scores combined from separate evaluations of
performance on the following items:92
91 Missouri Department of Elementary and Secondary Education, School District and School Information: http://mcds.dese.mo.gov/guidedinquiry/Pages/District-and-School-Information.aspx 92 Missouri Department of Elementary and Secondary Education, School District and School Information: http://mcds.dese.mo.gov/guidedinquiry/Pages/District-and-School-Information.aspx; 2013 LEA Annual Performance Report (APR) – Final
118
MSIP Standards Possible Score
Academic Achievement 56 Subgroup Achievement 14 College and Career Ready 30 Attendance 10 Graduation Rate 30
Total 140
As noted earlier, two districts in St. Louis County are unaccredited at this time: Normandy and
Riverview Gardens, which had the lowest MSIP scores: Normandy – 15.5 points and 11.1%;
Riverview Gardens – 40 points and 28.6%.
The Missouri State Board of Education acted on February 18, 2014 to impose financial oversight
over the Normandy School District. All expenditures, contracts, financial obligations and any other
actions with fiscal implications must be approved by the Missouri Department of Elementary and
Secondary Education through the remainder of 2014. The State Board also directed the Missouri
Department of Elementary and Secondary Education Commissioner to appoint a Transition Task
Force to develop a detailed plan for the operation of the Normandy schools starting July 2014, if the
state legislature fails to appropriate additional funds for the district and if he district lapses.93
In March 2014, the State Board also approved a plan for future local school district interventions by
the State to deal with situations similar to the Normandy district. The plan includes a tiered
structure for accreditation to replace the existing system which uses major classifications:
accredited/provisional/unaccredited.94
93 Missouri Department of Elementary and Secondary Education, http;//dese.mo.gov/communications/news-releases, February 18, 2014. 94 http://dese.mo.gov/sites/default/files/supportandintervention.pdf
Hancock Place 124.0 88.6% Riverview Gardens 40.0 28.6%
Hazelwood 119.5 85.4% Rockwood 130.0 92.9%
Jennings 92.0 65.7% Special School District of St.
Louis County 92.5 66.1%
Kirkwood 137.5 98.2% University City 93.5 66.8%
Ladue 138.5 98.9% Valley Park 125.0 89.3%
Lindbergh 139.0 99.3% Webster Groves 136.5 97.5%
Maplewood-Richmond Heights
124.0 88.6%
*Total possible points = 140.
Source: Missouri Department of Elementary and Secondary Education, School District and School Information: http://mcds.dese.mo.gov/guidedinquiry/Pages/District-and-School-Information.aspx; 2013 LEA Annual Performance Report (APR) – Final
All three school districts serving O’Fallon achieved scores that exceeded 92% under the MSIP
system, as depicted in the table below.
Missouri School Improvement Program (MSIP) Scores for O’Fallon Public Schools, 2013
School District MSIP Score % of Total Possible
Points*
Francis Howard 135.0 96.4%
Ft. Zumwalt 130.0 92.9%
Wentzville 135.0 96.4%
*Total possible points = 140.
Source: Missouri Department of Elementary and Secondary Education, School District and School Information: http://mcds.dese.mo.gov/guidedinquiry/Pages/District-and-School-Information.aspx; 2013 LEA Annual Performance Report (APR) – Final
120
Average Expenditures
A national statistic frequently used when comparing the relative wealth of school districts is the
expenditure per day of attendance.
The next table reports that 16 (69.6%) of the 23 school districts in St. Louis County spent more per
Average Daily Attendance (ADA) in 2013 than the average for the State of Missouri ($9,839.67).
Thirteen districts (56.5%) had average expenditures that exceeded the latest national average
projection ($11,169) available from the U.S. Department of Education.95
The average expenditure amounts ranged from $7,919 in the Bayless district to $17,721 for Clayton.
The data for the Special School District, while included, was not considered in the comparison with
the other districts due to the unique varieties of students that it serves and the programs that it
provides.
For the school districts serving O’Fallon, one of the three school districts spent more per Average
Daily Attendance (ADA) in 2013 than the average for the State of Missouri ($9,840). None of the
three districts had average expenditures that exceeded the latest national average projection
($11,169) available from the U.S. Department of Education.96
Districts with higher average spending may have more robust tax bases to fund their schools. Such
circumstances may result in improved facilities, additional equipment and technology, and
enhancements to basic curricula. Contrarily, some systems may be operating inefficiently, resulting
in higher average cost without concomitantly increasing the quality of school programming. This
assessment does attempt to evaluate systems using these criteria. However, when including
average expenditures with other performance factors, a better picture of overall school quality
might be made.
95 U.S. Department of Education, National Center for Education Statistics,
In addition to average expenditures per ADA, another measure of wealth is the percentage of free
and reduced cost lunches in individual schools. The percentage of free and reduced lunches in a
school is directly proportional to the number of low income households represented in the student
population of that school. Simply stated, in general, the higher the number of low income students
attending a school, the higher the number and percentage of free and reduced lunches at the school.
The State of Missouri reported that 245 schools in St. Louis County provided F&RL during 2013.
The F&RL percentage ranged from 7.6% for Conway Elementary in the Ladue District to 99.0% in
Lewis and Clark Elementary in Riverview Gardens.
From the total 245 schools, 141 (57.55%) had under 50% free and reduced lunches while the
remaining 104 (42.45%) had more than 50%.
The State of Missouri also reported that 56 schools in the three school districts serving the City of
O’Fallon provided F&RL during 2013. The F&RL percentage ranged from 7.8% for Francis Howell
High School in the Francis Howell District to 49.0% for Dardenne Elementary of the Ft. Zumwalt
District. All 56 schools (100.0%) had less than 50% of their students who received free and reduced
lunches.
Free and Reduced Lunches in St. Louis County and O’Fallon, 2013
Share of Students with Free & Reduced Lunch
St. Louis County City of O’Fallon
Number of Schools
Percentage of Schools
Number of Schools
Percentage of Schools
1.0%-9.9% 8 3.3% 2 3.6%
10.0%- 19.9% 63 25.7% 20 35.7%
20.0% - 29.9% 31 12.7% 23 41.1%
30.0% - 39.9% 15 6.1% 5 8.9%
40.0% - 49.9% 24 9.8% 6 10.7%
50.0% - 59.9% 20 8.2% 0 0.0%
60.0% - 69.9% 14 5.7% 0 0.0%
70.0% - 79.9% 21 8.6% 0 0.0%
80.0% - 89.9% 29 11.8% 0 0.0%
90.0% - 100.0% 20 8.2% 0 0.0%
Total 245 100.0% 56 100.0%
Source: Missouri Department of Elementary and Secondary Education, School District and School Information: http://mcds.dese.mo.gov/guidedinquiry/Pages/District-and-School-Information.aspx
123
Stakeholder Input
Comments received on this topic indicated that facilities and services were provided evenly and
equitably. Like the topic of discrimination, commenters who lived out of St. Louis County tended to
feel this way, while it was more typical for a commenter who lived in St. Louis County to believe that
there were some inequities. Some commenters had the opinion that North County in St. Louis
County has suffered disinvestment through the years and has been neglected when funding was
allocated.
Conclusion
Public school systems in the study area vary greatly in their sizes and performance as judged by the
State of Missouri School Improvement Program (MSIP). Overall, the school districts serving
residents of St. Louis County scored lower than the districts serving O’Fallon under the MSIP
performance evaluation system.
The presence of underperforming schools and school districts can pose barriers to housing choice
for households who may not have the economic ability to locate in areas where school performance
is higher.
124
125
126
127
Access to Areas of Opportunity
This section analyzes St. Louis County (including Florissant) and O’Fallon using a methodology
developed by HUD’s Office of Policy Development and Research to “quantify the degree to which a
neighborhood offers features commonly associated with opportunity.”97 For each block group in the
U.S., HUD provides a score on six “opportunity dimensions,” including poverty, school proficiency,
labor market engagement, jobs access, transit access, and exposure to health hazards. HUD’s index
scores are calculated based on the following:
Poverty index – family poverty rates and share of households receiving public assistance;
School proficiency index – school-level data regarding student performance on state exams;
Labor market engagement index – employment levels, labor force participation and educational
attainment;
Jobs access index – distance to job locations and labor supply levels;
Transit access index –distance to nearest rail or bus transit station or stop; and
Health hazards exposure index – distance to facilities releasing toxic chemicals and levels of
toxicity, according to the Environmental Protection Agency (EPA).
For each block group, a value is found for each of the six indices; results are then standardized on a
0 to 100 scale based on relative ranking within the metro area (or non-metro balance of the state).
For each opportunity dimension, a higher index score indicates more favorable neighborhood
characteristics.
The maps that follow show the HUD-provided opportunity scores for block groups in St. Louis
County and O’Fallon. In each map, lighter shading indicates areas of lower opportunity and darker
shading indicates higher opportunity. For the first three indices – poverty, school proficiency, and
labor market engagement – lowest opportunity areas are in north St. Louis County and highest in
central and west St. Louis County. Ten block groups have index values under 10 for each of these
indicators, located in tracts 2141.00, 2218.00, and 2136.00.
Jobs access varies, with each part of the County having a mix of high and low opportunity tracts.
Transit access is better the closer a tract is to the City of St. Louis. The southwest and northeast
parts of the County lack transit access, as does the City of O’Fallon. Exposure to environmental
hazards is not a major issue for the majority of the study area, and least exposure is in the southwest
St. Louis County/Wildwood area and in O’Fallon.
97 HUD Office of Policy Development and Research, “FHEA Data Documentation,” Draft. 2013. p. 4.
128
Poverty Index by Block Group in St. Louis County, Florissant, and O’Fallon
School Proficiency Index by Block Group in St. Louis County, Florissant, and O’Fallon
129
Labor Market Engagement Index by Block Group in St. Louis County, Florissant, and
O’Fallon
Jobs Access Index by Block Group, St. Louis County, Florissant, and O’Fallon
130
Transit Access Index by Block Group in St. Louis County, Florissant, and O’Fallon
Health Hazards Exposure Index by Block Group in St. Louis County, Florissant, and
O’Fallon
131
HUD also developed a methodology for comparing relative exposure to neighborhood opportunity
dimensions for different population subgroups (e.g., racial and ethnic groups). An average index
score for each subgroup is found by averaging the block group scores weighted by the subgroup
population. Comparing these average scores reveals any potential disparities in access to
opportunity based on residential patterns of subgroups. In other words, the analysis assesses
whether some subgroups tend to live in higher opportunity areas than others.
The tables that follow compare average opportunity scores for several racial and ethnic groups in
St. Louis County and O’Fallon. Indices for each minority group are compared to those for Whites to
arrive at an estimate of disparity.98 Positive disparity numbers indicate that Whites, on average,
reside in more favorable neighborhood conditions (higher values for the opportunity dimensions)
than the minority group being compared. Negative values indicate that the minority group tends to
live in neighborhoods with more favorable conditions than their White counterparts.
The first comparison is between St. Louis County’s general population and that portion of the
population in poverty. For poor persons, poverty, school proficiency, and labor market engagement
index values are uniformly lower than for the general population, meaning people in poverty tend
to reside in communities with less opportunity, when measured by these dimensions. Disparities
between job access and exposure to health hazards do not substantially vary between the general
population and the subpopulation of people in poverty. But, transit access improved for those in
poverty, indicating that the poorer subpopulation is more likely to live in communities with access
to transit.
Disparities between index values for Whites and each minority group are also measured by poverty
status. Comparing opportunity index values between White and Black residents reveals significant
disparities for poverty, school proficiency, and labor market engagement, regardless of poverty
status. Disparities for these indices range from 32 to 47 points. Jobs access and exposure to health
hazards index scores show less pronounced disparities between Black and White residents (under
10 points); Black residents tend to live in areas with better transit access than do Whites.
Hispanic residents of St. Louis County tend to live in lower opportunity neighborhoods when
compared to White residents, regardless of poverty status, for poverty, school proficiency, and labor
market engagement. Opportunity gaps between the two groups range from 9 to 14 points for these
dimensions. Hispanic residents’ jobs access and exposure to health hazards are roughly equivalent
to those of White residents, while their access to transit is better (by 10 points for the general
population and 4 for persons in poverty).
For most opportunity dimensions, Asians in the general population and in poverty had higher index
values than their White counterparts.
98 The analysis of access to opportunities includes data for Hispanics, Non-Hispanic Whites, Non-Hispanic Blacks, and Non-Hispanic Asians. As in the segregation analysis, these groups are referred to as “Hispanics,” “Whites,” “Blacks,” and “Asians” for simplicity.
132
In O’Fallon, opportunity index values for the general population and the population in poverty are
higher than in St. Louis County for all dimensions, with the exception of job access for the general
population and transit access for both populations. Unlike St. Louis County, there are not large
disparities in access to opportunity between different racial and ethnic groups in O’Fallon. Black
and Hispanic residents have opportunity scores quite similar to Whites, while Asians and poor
minority residents tend to have better access to opportunity than their White counterparts. These
findings reflect the fact that minority residents in O’Fallon have similar geographic distributions as
White residents (shown through the low Dissimilarity Indices). Thus, they live in similar
neighborhoods as White residents and have similar access to opportunity.
Summary
The analysis of access to neighborhood opportunities shows that in St. Louis County, poverty, school
proficiency, labor market engagement, and transit access are the four areas where level of
opportunity is most related to race, ethnicity, and poverty status. The former three tend to be worse
for minorities and those in poverty, while transit access is uniformly better for minority residents
and persons in poverty. Jobs access and exposure to health hazards are relatively similar regardless
of these factors.
In O’Fallon, there is little disparity between Black, Hispanic, and White residents for any of the
opportunity dimensions. Asians tend to have slightly higher access to opportunity, as do poor
minority subgroups in comparison to poor Whites.
133
Disparity in Access to Neighborhood Opportunity - All Persons in St. Louis County
All Persons
Disparity
Opportunity Dimension All Persons White
Persons Black
Persons
Hispanic or Latino
Persons Asian
Persons White -Black
White-Hispanic
White- Asian
Poverty 63 71 37 61 75 34 10 -4
School Proficiency 62 74 27 62 79 47 12 -5
Labor Market Engagement 66 75 38 66 81 37 9 -6
Job Access 53 55 46 57 62 9 -2 -7
Transit Access 41 36 57 46 40 -21 -10 -4
Health Hazards Exposure 60 61 59 60 61 2 1 0
Counts 998,954 687,984 231,801 25,024 34,466
Persons in Poverty Disparity
Opportunity Dimension All Poor Persons
Poor White
Persons
Poor Black
Persons
Poor Hispanic or
Latino Persons
Poor Asian
Persons
Poor White-Black
Poor White -
Hispanic
Poor White -Asian
Poverty 41 58 26 44 55 32 14 3
School Proficiency 41 60 23 47 67 37 13 -7
Labor Market Engagement 46 63 30 51 71 33 12 -8
Job Access 51 54 47 58 59 7 -4 -5
Transit Access 54 48 60 50 49 -12 -2 -1
Health Hazards Exposure 59 60 58 60 59 2 0 1
Counts 93,673 37,652 46,706 3,447 3,332
Source: U.S. HUD Office of Policy Development & Research, Regional Planning Grant Program Raw Block Group Data, Retrieved from http://www.huduser.org/portal/Sustainability/grantees/data.html
Disparity in Access to Neighborhood Opportunity - All Persons in O’Fallon
All Persons
Disparity
Opportunity Dimension All Persons White
Persons Black
Persons
Hispanic or Latino
Persons Asian
Persons White -Black
White-Hispanic
White- Asian
Poverty 74 74 74 71 77 0 3 -3
School Proficiency 67 67 67 66 72 0 1 -5
Labor Market Engagement 74 74 75 72 79 -1 2 -5
Job Access 51 51 53 53 55 -2 -2 -4
Transit Access 1 1 1 1 1 0 0 0
Health Hazards Exposure 71 71 71 71 70 0 0 1
Counts 125,123 112,371 4,631 3,299 3,345
Persons in Poverty Disparity
Opportunity Dimension All Poor Persons
Poor White
Persons
Poor Black
Persons
Poor Hispanic or
Latino Persons
Poor Asian
Persons
Poor White-Black
Poor White -
Hispanic
Poor White -Asian
Poverty 65 64 68 66 72 -4 -2 -8
School Proficiency 66 66 68 65 67 -2 1 -1
Labor Market Engagement 68 66 77 65 80 -11 1 -14
Job Access 59 58 62 64 70 -4 -6 -12
Transit Access 1 1 1 1 1 0 0 0
Health Hazards Exposure 71 71 70 72 71 1 -1 0
Counts 4,641 3,724 383 254 233
Note: Total population counts for this analysis do not match population totals for the City of O’Fallon because this analysis uses tract level rather than place level data, and includes all tracts with a portion of their population in O’Fallon.
Source: U.S. HUD Office of Policy Development & Research, Regional Planning Grant Program Raw Block Group Data, Retrieved from http://www.huduser.org/portal/Sustainability/grantees/data.html
135
Land Use & Zoning
Comprehensive land use planning is a critical means by which governments address the
interconnection and complexity of their respective jurisdictions. The interconnectedness of land
uses means that a decision as to the use of a particular piece of property has consequences not only
for surrounding property, but for a myriad of other issues as well. For example, a decision to use a
parcel of land for development of a shopping mall (a land use decision) will not only influence the
value and use of surrounding property, but is necessarily a traffic and environmental decision as
well (such an intensive commercial use will increase traffic flow and large impervious parking lots
will increase stormwater runoff). For this reason, “[t]he land-use decisions made by a community
shape its very character – what it’s like to walk through, what it’s like to drive through, who lives in
it, what kinds of jobs and businesses exist in it, how well the natural environment survives, and
whether the community is an attractive one or an ugly one.”99 By extension, decisions regarding
land use and zoning have direct and profound impacts on affordable housing and fair housing
choice, as will be discussed within this section.
From a regulatory standpoint, local government measures to control land use typically rely upon
zoning codes, subdivision codes, and housing and building codes in conjunction with
comprehensive plans. Courts have long recognized the power of local governments to control land
use, and Missouri authorizes local municipalities, townships, and counties to regulate land use and
zoning within their respective jurisdictions through the Zoning Enabling Act and other state
statutes. (Mo. Rev. Statutes § 89.020 – 89.491; 64:010 – 64.975.) Local governments may divide
their jurisdiction into zoning districts, define categories of permitted and special approval uses for
those districts, and establish design or performance standards for those uses. Jurisdictions also may
expressly prohibit certain types of uses within zoning districts. In that way, local ordinances often
define the type and density of housing resources available to residents, developers and other
organizations within certain areas.
While zoning codes have an important role to play in regulating the health and safety of the
structural environment, overly restrictive codes can negatively impact fair housing choice within a
jurisdiction. Examples of zoning provisions that most commonly result in barriers to fair housing
choice include the following:
Restrictive forms of land use that exclude any particular form of housing, particularly multi-
family housing, or that require large lot sizes that deter affordable housing development.
Restrictive definitions of family that impede unrelated individuals from sharing a dwelling
unit.
Placing administrative and siting constraints on group homes for persons with disabilities.
99 John M. Levy. Contemporary Urban Planning, Eighth Edition. Upper Saddle River, NJ: Pearson Prentice Hall, 2009.
136
Restrictions making it difficult for residents with disabilities to locate housing in certain
neighborhoods or to modify their housing.
Restrictions on occupancy of accessory housing structures such as carriage homes or
basement units.
While local governments have the power to enact zoning and land use regulations, that power is
limited by federal and state fair housing laws (e.g., Missouri Human Rights Act, Fair Housing
Amendments Act, Americans With Disabilities Act, constitutional due process and equal protection).
And even where a specific zoning decision does not violate the letter of the law, HUD entitlement
communities have made a commitment to do more than the minimum standards required to not
infringe on the property and fair housing rights of their residents, but also to establish policies and
plans that protect and advance fair housing choice.
Because zoning codes present a crucial area of analysis for a study of impediments to fair housing
choice, a detailed review of the code provisions is typically performed. However, because St. Louis
County contains more than 90 individual municipalities, each with its own unique zoning code, a
comprehensive review of all the codes was not feasible and a sample set of local codes was reviewed
instead. The sample set includes the codes of each of the three entitlement communities
contributing to this study (St. Louis County, Florissant, and O’Fallon) and five other St. Louis County
municipalities selected by the St. Louis County Office of Community Development and representing
a variety of community types and geographic diversity. The sample of eight local zoning codes
within the study area was reviewed and evaluated against a list of 18 common fair housing issues.
Each of the eight ordinances were assigned a risk score of either 1, 2, or 3 for each issue and were
then given an aggregate score calculated by averaging the individual scores, with the possible scores
defined as follows:
1 = low risk – the provision poses little risk for discrimination or limitation of fair housing choice;
2 = medium risk – the provision is neither among the most permissive nor most restrictive; while it
could complicate fair housing choice, its effect is not likely to be widespread;
3 = high risk – the provision causes or has potential to result in systematic and widespread housing
discrimination or the limitation of fair housing choice.
The matrix is designed as a tool for analyzing whether, in what areas, and to what degree a
municipality’s zoning and land use regulations restrict fair housing choice. It is not meant to simply
show whether a municipality’s code creates a per se violation of the FHA or other fair housing laws.
Restricting housing choice for certain historically/socio-economically disadvantaged groups and
protected classes can happen as a matter of degree and on a continuum. This section of the report
may point out areas where there is a clear violation of current housing law or HUD standards, but
the goal also is to answer whether a municipality’s regulations may violate the spirit of fair housing
protections and HUD’s goals and standards for its entitlement communities. The narrative that
137
follows highlights areas where the sample municipalities may not necessarily be in legal jeopardy
but could make improvements toward the goal of affirmatively furthering fair housing choice.
The 18 individual risk scores were averaged for each studied municipality, yielding a composite
score indicative of the probability of the municipality’s zoning ordinance, in general, limiting fair
housing choice. The complete reports, including citations to relevant code sections and explanatory
comments, for the individual municipalities are included as an appendix to this document, however,
the composite scores lend themselves to comparative analysis here.
The overall risk scores ranged from a low of 1.44 to a high of 1.83, with the average of the composite
risk scores being 1.63. Of the eight zoning ordinances reviewed, University City and Chesterfield
were the most permissive and the least likely to result in housing discrimination or the limitation
of fair housing choice (except when analyzed according to a specific zoning issue such as the
definition of family). Sunset Hills was assigned an average risk score of 1.83, indicating that its
zoning ordinance had the greatest potential to result in housing discrimination of the municipalities
reviewed. St. Louis County, O’Fallon, and Florissant each scored 1.61, indicating a moderate risk of
its zoning and land use regulations contributing to discriminatory housing treatment or impeding
fair housing choice in certain areas.
Zoning Matrix Analysis Composite Scores by Municipality
Municipality Score
St. Louis County 1.61
O’Fallon 1.61
Florissant 1.61
University City 1.44
Chesterfield 1.44
Maryland Heights 1.67
Webster Groves 1.78
Sunset Hills 1.83
Another dimension for analysis involves averaging the risk scores for all municipalities studied for
each of the 18 fair housing issues evaluated in the zoning analysis. Using this approach highlights
specific fair housing issues and the degree to which their application may be problematic or
restrictive throughout the study area in general.
138
Zoning Code Risk Scores
ISSUE Average
RISK SCORE
1. Does the jurisdiction’s definition of “family” have the effect of preventing unrelated individuals from sharing the same residence? Is the definition unreasonably restrictive?
2.25
2. Does the definition of family discriminate against unrelated individuals with disabilities (or members of any other protected class) who reside together in a congregate or group living arrangement?
1.13
3a. Does the zoning ordinance require a use permit to locate housing for individuals with disabilities in certain residential districts? 3b. Is housing for individuals with disabilities allowed as of right only in a few residential zones?
1.50
4. Does the zoning ordinance unreasonably restrict housing opportunities for individuals with disabilities who require onsite supportive services?
1.38
5. Does the jurisdiction’s policies, regulations, and/or zoning ordinance allow persons with disabilities to make reasonable modifications or provide reasonable accommodation to specific zoning or regulatory requirements?
2
6a. Does the jurisdiction require a public hearing to obtain public input for specific exceptions to zoning and land-use rules for applicants with disabilities? 6b. Is the hearing only for applicants with disabilities rather than for all applicants?
2
7. Does the ordinance impose spacing or dispersion requirements on certain housing types, creating a disparate impact on certain populations?
1.50
8a. Are there any restrictions for Senior Housing in the zoning ordinance? 8b.If yes, do the restrictions comply with Federal law on housing for older persons (i.e., solely occupied by persons 62 years of age or older or at least one person 55 years of age and has significant facilities or services to meet the physical or social needs of older people)?
1.50
9. Does the zoning code distinguish senior citizen housing from other single family residential and multifamily residential uses by the application of a special or conditional use permit?
1.50
10. Does the jurisdiction restrict any inherently residential uses protected by fair housing laws (such as residential substance abuse treatment facilities) only to non-residential zones?
2.38
11. Does the ordinance include residential zones with high minimum lot sizes, wide street frontages, large setbacks, low FARs, large minimum building square footage, and/or low maximum building heights, effectively preventing affordable or multi-family housing?
1.63
12. Are unreasonable restrictions placed on the construction, rental, or occupancy of accessory structures (i.e. carriage house, guest house, basement unit) within residential districts?
2
139
Zoning Code Risk Scores (continued)
ISSUE Average
RISK SCORE
13a. Does the ordinance fail to provide zones where multi-family housing is permitted as of right? 13b. Do multi-family districts restrict development only to low-density housing types?
1.75
14. Does the ordinance unreasonably restrict the siting of mobile, manufactured, and modular homes?
1.88
15a. Is the process by which a use permit (CUP, SUP, SLUP) is obtained unreasonably lengthy, complex and costly, effectively discouraging applicants? 15b. Is there a clear procedure by which denials may be appealed?
1
16. Does the zoning ordinance include an inclusionary zoning provision? 1.88
17. Does the zoning ordinance include a discussion of fair housing? 1
18a. Do the jurisdiction’s codes presently make specific reference to the accessibility requirements contained in the 1988 amendment to the Fair Housing Act? 18b. Are the jurisdiction’s accessibility standards (as contained in the zoning ordinance or building code) congruent with the requirements of the Fair Housing Act? 18c. Is there any provision for monitoring compliance?
1
Average Aggregate Risk Score 1.63
In most cases, the ordinances reviewed were reasonably permissive and allowed for flexibility as to
the most common fair housing issues. Very few of the municipalities reviewed received a “3” (high
risk) score on any of the 18 issues evaluated. However, where the average score for an issue is “2”
(medium risk) or greater, this indicates that the zoning and land use regulations and policies have
the potential to negatively impact fair housing. It also means the jurisdiction could be subject to fair
housing complaints and expensive litigation. In such cases, improvements to the rules and policies
could be made to more fully protect the fair housing rights of residents of the study area.
Of the 18 issues studied, the sample set of zoning codes generally handled very well the matter of
establishing reasonable, uncomplicated processes for obtaining special/conditional use permits
and setting forth transparent appeal procedures (Issue 15). All of the municipalities reviewed
received a “1” (low risk) on this issue. This is important because zoning codes may unnecessarily
complicate these processes with many layers of review and long spans of time between them,
effectively discouraging all but the most determined permit seekers from even applying for a
permit. An applicant seeking to develop property for a use requiring special permitting would likely
select a site elsewhere rather than navigate these types of processes. The finding that the study
140
area’s zoning ordinances generally do not impose such burdens is a feature that advances fair
housing choice.
Another low risk score was for Issue 17, whether the municipality has adopted a policy regarding
fair housing. All of the municipalities reviewed have adopted a fair housing ordinance, either as part
of the zoning ordinance, or under a separate code chapter regarding discrimination, human rights,
or human relations within the jurisdiction. Some of the ordinances (Webster Groves, Maryland
Heights, Chesterfield), however, do not include a discussion regarding the jurisdiction’s own
obligations to grant reasonable modifications or accommodations in rules, policies, practices, or
services, when such accommodations may be necessary to afford a person with a disability equal
opportunity to use and enjoy a dwelling. As will be discussed below under Issue 5, a standardized
administrative process for seeking a reasonable accommodation is important to fair housing choice
for persons with disabilities.
The jurisdictions analyzed also generally scored well regarding allowances for housing for persons
with disabilities. Under MO. Rev. Stat. Sec. 89.020(2), “the classification single family dwelling or
single family residence shall include any home in which eight or fewer unrelated mentally or
physically handicapped persons reside, and may include two additional persons acting as
houseparents or guardians.” Most of the eight ordinances surveyed follow the state guideline, either
by including in the definition of “family” up to eight unrelated persons with disabilities (plus two
supporting supervisors), or through the zoning district regulations, or through the definition and
regulation of “group homes.” Accordingly, most of the jurisdictions were given a low score for Issues
2, 3, and 4. (See, however, the Zoning Analysis Matrix for Chesterfield and for Webster Groves, both
of which received higher risk scores on these issues.)
While the foregoing is a picture of the study area’s strengths in terms of how its codes protect fair
housing choice, the following analysis illustrates concrete actions the municipalities could make in
terms of their respective zoning and land use regulations to uphold the commitment to furthering
fair housing. The issues highlighted below show where zoning ordinances, city codes, and policies
could go further to protect fair housing choice for protected and disadvantaged classes, and still
fulfill the zoning objective of protecting the public’s health, safety, and general welfare.
Often one of the most scrutinized provisions of a municipality’s zoning code is its definition of
“family.” Ideally, the definition does not unreasonably restrict the number of unrelated individuals
permitted to live together as a single housekeeping unit where the definition does not similarly limit
the number of related persons who may reside together. In viewing the scores for Issue 1, it is
important to remember that there are degrees of reasonableness, especially when comparing one
municipality’s code to its neighbor or to precedential case law. The study area’s average score for
Issue 1, was 2.25, with three of the eight jurisdiction receiving a 3 on this issue.
While a jurisdiction’s definition of family may pass constitutional muster, (See e.g., Belle Terre v.
Boraas, 416 U.S. 1 (1974) (where a zoning ordinance limiting the number of unrelated persons
141
living together in residential districts to two survived a federal equal protection and First
Amendment challenge)), the definition may violate state due process where it restricts the size of a
functionally equivalent family of unrelated persons but not the size of a family related by blood or
marriage. (See Moore v. East Cleveland, 431 U.S. 494, 511 (1977) (requiring that municipalities not
unreasonably restrict the definition of family)).The local municipality could be sued and made to
show that such a differentiation reasonably relates to a legitimate zoning purpose. Whether
unrelated residents of the same dwelling reside together as a single housekeeping unit or
functionally equivalent “family” is a factual question that in many cases must be reviewed on a case
by case basis.
In 2006, an unmarried couple, Olivia Shelltrack and Fondray Loving, represented by the ACLU, filed
suit against the City of Black Jack after being denied an occupancy permit because the local zoning
law’s definition of “family” prohibited more than three unrelated people from living together unless
related by “blood, marriage or adoption.” At the time, the couple had been together for 13 years and
had two children together. However, because Loving was not the biological father of Shelltrack’s
oldest child, the city denied the family an occupancy permit for the 2,300 sq. ft. home that they had
recently purchased. The lawsuit alleged violations of substantive due process and equal protection
under the Missouri and federal Constitutions, and discrimination on the basis of familial status in
violation of the Fair Housing Act. In response, the City of Black Jack adopted a new ordinance
redefining what constitutes a “family” for zoning and occupancy purposes to include unmarried
couples and their children. The city then settled with the plaintiffs before the fair housing issues
could be adjudicated by the court. This local case highlights the potential legal challenges
jurisdictions with restrictive definitions of family may face. See Loving v. City of Black Jack, Civil
Action No. 2106CC-03157 (Circuit Court for the County of St. Louis 2006), Civil Action No. 4:06-cv-
01430 (E.D. Mo. 2006) (case removed to federal district court and settlement agreement reached).
Another area for improvement would be for the jurisdictions to adopt a reasonable accommodation
ordinance for making requests for reasonable accommodation/modification in land use, zoning and
building regulations, policies, practices and procedures (Issues #5 & 6). Federal and state fair
housing laws require that municipalities provide individuals with disabilities or developers of
housing for people with disabilities flexibility in the application of land use and zoning and building
regulations, practices and procedures or even waiving certain requirements, when it is necessary
to eliminate barriers to housing opportunities. All of the surveyed jurisdictions received a medium
risk score “2” for this issue because they failed to provide a clear and objective process by which
persons with disabilities may request a reasonable accommodation to zoning, land use, and other
regulatory requirements. Often cities and counties handle the mandate to provide a reasonable
accommodation through their variance or conditional use permit procedures. However, the
purpose of a variance is not congruent with the purpose of requesting a reasonable accommodation.
To obtain a variance, an applicant must show special circumstances or conditions applying to the
land, building, or use that are preexisting and not owing to the applicant. In contrast, a reasonable
accommodation is to allow individuals with disabilities to have equal access to use and enjoy
142
housing. The jurisdiction does not comply with its duty to provide reasonable accommodation if it
applies a standard based on the physical characteristics of the property rather than considering the
need for modification based on the disabilities of the residents of the housing. Whereas simple
administrative procedures may be adequate for the granting of exceptions, the variance and
conditional use permit procedures subject the applicant to the public hearing process where there
is the potential that community opposition based on stereotypical assumptions about people with
disabilities may impact the outcome. Adopting a reasonable accommodation ordinance is one
specific way to address barriers in land use and zoning procedures and would help municipalities
more fully comply with the intent and purpose of fair housing laws.
Model ordinances are available that have been approved by HUD or the DOJ as part of fair housing
settlement or conciliation agreements. For example, in the St. Peters, Missouri case discussed below,
in compliance with a settlement agreement, the city adopted a “Reasonable Accommodation Policy
and Procedure” ordinance, which includes a standardized process and gives the director of
planning, or his designee, the authority to grant or deny reasonable accommodation requests
without the applicant having to submit to the variance or conditional use permit or other public
hearing process.
There also is potential risk of fair housing discrimination under Issue #7. Half of the jurisdictions
surveyed in the study area impose a minimum spacing or separation requirement on group homes
for persons with disabilities. Spacing requirements are generally inconsistent with the FHA, unless
the jurisdiction could make a showing that (1) the ordinance was passed to protect a compelling
governmental interest (e.g. over-concentration of group homes could adversely affect individuals
with disabilities and would be inconsistent with the goal of integrating persons with disabilities into
the wider community) and that (2) the spacing requirement is the least restrictive means of
protecting that interest. Where this issue has been litigated under fair housing laws, courts have
often invalidated such spacing requirements as discriminatory. (See, e.g., Horizon House
Developmental Serv., Inc. v. Township of Upper Southampton, 804 F.Supp. 683, 693 (E.D.Pa. 1992)
Given the limitations inherent in a one-time sample search, it is difficult to draw narrow conclusions
based on the results, however, the strong degree to which available properties were concentrated
almost exclusively in the communities of North St. Louis County suggests there could be some
significant limits to housing choice for people with disabilities requiring accessible rental housing.
Stakeholder Input
Substandard housing conditions were often mentioned as a major issues being faced in the northern
part of St. Louis County. This area contains high numbers of vacant and abandoned structures that
are often neglected by their owners. Some people thought that more attention should be devoted
to eliminating this problem.
Meeting participants and stakeholders think that housing and economic conditions for persons
living in areas outside St. Louis County are not as challenging as for persons who are St. Louis County
residents. These areas are perceived as having available jobs, higher performing schools, lower
crime rates, and better housing conditions.
Source: Socialserve.com, Accessed June 1, 2014
159
Home Mortgage Disclosure Act (HMDA) Analysis
Homeownership is vital to a community’s economic well-being. To live up to the requirements of
fair housing law, all persons must have the ability to live where they want and can afford.
Prospective homebuyers need access to mortgage credit, and programs that offer homeownership
should be available without discrimination. The task in this Home Mortgage Disclosure Act (HMDA)
analysis is to determine the degree to which the housing needs of St. Louis County and O’Fallon
residents are being met by home loan lenders.
The Home Mortgage Disclosure Act of 1975 (HMDA) requires most mortgage lending institutions
to disclose detailed information about their home-lending activities annually. The objectives of the
HMDA include ensuring that borrowers and loan applicants are receiving fair treatment in the home
loan market.
The national 2012 HMDA data consists of information for 15.3 million home loan applications
reported by 7,400 home lenders, including banks, savings associations, credit unions, and mortgage
companies.102 HMDA data, which is provided by the Federal Financial Institutions Examination
Council (FFIEC), includes the type, purpose, and characteristics of each home mortgage application
that lenders receive during the calendar year. It also includes additional data related to those
applications including loan pricing information, action taken, property location (by census tract),
and additional information about loan applicants including sex, race, ethnicity, and income.
The primary data source for this analysis was the 2012 HMDA dataset for St. Louis County and St.
Charles County (including O’Fallon), which included a total of 11,244 loan applications in St. Louis
County and 6,176 in St. Charles. Within each HMDA record some of the data variables are 100%
reported such as “Loan Type,” “Loan Amount,” “Action Taken,” but other data fields are less
complete. For example, for 2012 St. Louis County data, 6.1% of the records contained no information
on the applicant’s and/or co-applicant’s sex. Applicant information may be missing because it was
not provided by the applicant and the application was completed entirely by mail, the Internet or
the telephone. There is no requirement for reporting reasons for a loan denial, and this information
was not provided for 28.2% of loan denials in St. Louis County and 29.7% of those in St. Charles.
Missing race, ethnicity, and sex data are potentially problematic for an assessment of
discrimination. If the missing data are non-random there may be adverse impacts on the accuracy
of the analysis. The reasons for incomplete data are not explained in the HMDA documentation so
it is impossible to assess the biases that could arise from analyzing the data. It is possible that the
reasons for the omitted data were systematic and therefore may have had a significant but unknown
effect on the analytical results. Ideally, any missing data for a specific data variable would affect a
102 Federal Financial Institutions Examination Council, “Federal Financial Examination Council Announces Availability
of 2012 Data on Mortgage Lending,” September 18, 2013.
160
small proportion of the total number of loan records and therefore would have only a minimal effect
on the analytical results.
The HMDA data does not include a borrower’s total financial qualifications such as an actual credit
score, property type and value, loan-to-value ratio or loan product choices. Research has shown that
differences in denial rates among racial or ethnic groups can arise from these credit-related factors
not available in the HMDA data.103 Despite these limitations, the HMDA data play an important role
in fair lending enforcement. Bank examiners frequently use the HMDA price data in conjunction
with information from loan files to assess an institution’s compliance with the fair lending laws.
Loan Approvals and Denials by Applicant Sex
The 2012 HMDA data for St. Louis County included complete information about applicant and co-
applicant sex and household income for 10,209 of the total 11,244 home purchase application
records. Of these, 3,160 were by male applicants (31.0%), 2,751 by female applicants (26.9%), and
3,509 by male and female co-applicants (41.1%). Of the 5,721 loan application records with
complete information in St. Charles County, 32.5% were by male applicants, 23.7% by female
applicants, and 43.9% by male and female co-applicants. The table on the following page presents a
snapshot of loan approval rates and denial rates calculated for low, moderate, and upper income
applicants by sex.104 Note that denial rates are not simply the complement of approval rates because
the “Loan Action” variable allows other outcomes including application withdrawal by the applicant
and file closure for incompleteness.
Overall, the table shows that approval rates were from four to sixteen times higher than denial rates,
with higher denial rates for low income groups. In St. Louis County, approval rates ranged from
70.3% for low income male/female co-applicants to 85.3% for high income male/female co-
applicants. Overall, female applicants had approval and denial rates roughly equivalent to those of
male applicants and male/female co-applicants, with the biggest difference in the high income
category, where female applicants had a higher approval rating than males by 4.5 percentage points.
As in St. Louis County, approval and denial rates in St. Charles County do not generally show a
disparity for female loan applicants. In comparison to approval rates for male and male/female co-
applicants, the biggest difference was for approval rates for low income applicants – female
applicants were approved loans at rate 10.4 percentage points higher than male/female co-
applicants. All other gaps were under 4 percentage points.
103 R. B. Avery, Bhutta N., Brevoort K.P., and Canne, G.B. 2012. “The Mortgage Market in 2011: Highlights from the Data Reported Under the Home Mortgage Disclosure Act.” Board of Governors of the Federal Reserve System. Federal Reserve Bulletin, Vol. 98, No. 6. 104 The low-income category includes applicants with a household income below 50% of the 2012 median family income for the St. Louis MSA. The moderate income category includes applicants with household incomes from 50% to 120% MFI, and the upper income category consists of applicants with household incomes above 120% MFI. Based on the 2012 metro MFI of $70,400, the 50% income threshold is $35,200 and the 120% threshold is $84,480.
161
Loan Approval and Denial Rates by Sex, 2012
Income Range Female
Applicant(s)* Male
Applicant(s)* Male/Female Co-Applicants
St. Louis County
Low Income
Total Applications 856 673 158
Approval Rate 72.2% 72.4% 70.3%
Denial Rate 16.2% 16.9% 19.0%
Moderate Income
Total Applications 1,489 1,562 1,360
Approval Rate 80.0% 79.0% 80.7%
Denial Rate 9.0% 10.5% 9.0%
High Income
Total Applications 406 925 2,780
Approval Rate 84.5% 80.0% 85.3%
Denial Rate 6.4% 9.2% 5.1%
St. Charles County
Low Income
Total Applications 354 319 79
Approval Rate 71.2% 69.0% 60.8%
Denial Rate 20.1% 19.4% 30.4%
Moderate Income
Total Applications 847 1,100 1,133
Approval Rate 80.0% 81.1% 82.3%
Denial Rate 7.9% 9.0% 9.2%
High Income
Total Applications 153 438 1,298
Approval Rate 83.0% 82.9% 86.6%
Denial Rate 5.2% 5.9% 4.2%
*Includes applications with a single male or female applicant and applications with male/male or female/female co-applicants. Source: FFIEC 2012 Home Mortgage Disclosure Act Data
Under the provisions of the HMDA, reporting institutions may choose to report the reasons they
deny loans to consumers, although there is no requirement to do so. Of the 955 loan denials in St.
Louis County, reasons are provided in 72.1% of the cases; in St. Charles County, reasons are
provided in 71.8% of cases. In St. Louis County, reporting rates vary by applicant sex – reasons are
reported for 67.0% of denials to female applicants, 70.1% of denials to males and 76.6% of denials
to male/female co-applicants.
The table that follows breaks down the reasons for loan denials by sex. In both jurisdictions, the
four most common denial reasons, regardless of applicant sex, are collateral, credit history,
incomplete credit application, and debt-to-income ratio. For female applicants in both counties,
162
debt-to-income ratio was the top inhibitor for loan approval, affecting 16.8% of denials in St. Louis
County and 21.5% in St. Charles. In both areas, compared to males, females were more likely to be
denied loans based on collateral and incomplete credit applications, but less likely to be denied
based on employment history, unverifiable information, or insufficient cash. Compared to
male/female co-applicants, credit history was more likely to be a problem for female applicants in
St. Louis County and employment history was less so. Denials to female applicants in St. Charles
County were more likely to be due to insufficient collateral or cash when compared to male/female
Unverifiable information 3.2% 6.5% 2.04 0.0% 0.00 6.3% 1.98
Other 6.8% 6.5% 0.95 16.7% 2.45 12.5% 1.83
Reason not provided 29.7% 29.0% 0.98 0.0% 0.00 12.5% 0.42
Source: FFIEC 2012 Home Mortgage Disclosure Act Data
166
Fair Housing Organizations & Activities
Knowledge of Fair Housing Laws and Rights
Public awareness of fair housing laws and issues is crucial to reducing fair housing violations and is
an essential step toward stopping housing discrimination. Individuals need to be aware of their fair
housing rights and how these protections impact housing choice.
The baseline analysis of public awareness of fair housing issues comes from a national survey How
Much Do We Know published by HUD in 2002. The study reported that only one-half of the survey
respondents could correctly identify as unlawful six of eight scenarios describing illegal fair housing
conduct. In addition, HUD’s study found that 14% of the adult population claims to have
experienced some form of housing discrimination at one point or another in their lives. Of those
who thought they had been discriminated against, 83% indicated they had done nothing about it,
while 17% say they did pursue a complaint. 105
In HUD’s follow-up study Do We Know More Now? Trends in Public Knowledge, Support and Use of
Fair Housing Law (published in 2006), 41% of the former survey respondents said it was “very
likely” they would do something about future discrimination compared to only 20% in the initial
survey.” The survey revealed that 46% of those who reported having experienced discrimination
in the past and done nothing about it said they would very likely do something about future
discrimination. 106
The “Future of Fair Housing: Report of the National Commission on Fair Housing and Equal
Opportunity” was released in December 2008. The Commission corroborated the HUD survey
results when it concluded that “(d)despite a great deal of creative effort by fair housing groups and
many in the housing industry, fair housing remains too low in the public’s consciousness.” The
Commission recommended that “a comprehensive fair housing education agenda must be
developed” and that “HUD should use its direct budget authority to fund basic education and
outreach materials, written in easy-to-understand language, in multiple languages, and in accessible
formats, and targeted to the different types of consumers of fair housing services.”107
The results of a public survey conducted by St. Louis County as a part of the preparation of this “A.I”
are presented at the end of this segment. Survey results indicate the public knowledge about
recognizing acts housing discrimination is still limited.
105 Martin D. Abravanel and Mary K. Cunningham, Do We Know More Now? Trends in Public Knowledge, Support and Use of Fair Housing Law, U.S. Department of Housing and Urban Development, February 2006. Source: http://www.fhco.org/pdfs/DoWeKnowMoreNowSurvey2006.pdf 106 Martin D. Abravanel and Mary K. Cunningham, Do We Know More Now? Trends in Public Knowledge, Support and Use of Fair Housing Law, U.S. Department of Housing and Urban Development, February 2006. Source: http://www.fhco.org/pdfs/DoWeKnowMoreNowSurvey2006.pdf 107 National Commission on Fair Housing and Equal Opportunity, Washington, D.C., “The Future of Fair Housing: Report of the National Commission on Fair Housing and Equal Opportunity,” December 2008, Pages 53-55
A logical assumption may be drawn that individuals with greater understanding of fair housing laws
are more likely to pursue a formal complaint of discrimination when they feel their rights have been
violated. Therefore, there is an association between knowledge of the law, recognition of
discriminatory acts, and actions that can be taken to respond to housing discrimination. Continued
efforts are needed at the local level to educate, inform, and provide referral assistance on fair
housing issues to help residents deal with potential acts of housing discrimination.
Studies by HUD and the National Commission, such as those described above, continue to highlight
that a significant number of housing discrimination incidents go unreported. Fair housing education
helps individuals learn about the protections in fair housing laws, which in turn enables them to
recognize and appropriately report housing discrimination if and when it happens to them.
In addition to fair housing education and outreach, other fair housing services that are available to
individuals in St. Louis County and in the cities of Florissant and O’Fallon include the investigation
and resolution of housing discrimination complaints; discrimination auditing and testing; and, the
dissemination of fair housing information via written material and at fair housing workshops, and
seminars. Fair housing agencies also provide landlord/tenant-counseling services that educate
property owners and tenants of their rights and responsibilities under fair housing law and other
consumer protection legislation as well as mediating disputes between tenants and proprietors.
Federal Fair Housing Education Resources108
The United States Department of Housing and Urban Development (HUD) is responsible for
carrying out the delivery of fair housing information, through its Office of Fair Housing and Equal
Opportunity (FHEO). This office is headquartered at the HUD Central Office in Washington, D.C., has
a regional office in Kansas City and additional offices in Kansas City and in St. Louis.
HUD FHEO Mission Statement
To create equal housing opportunities for all persons living in America by administering laws that
prohibit discrimination in housing on the basis of race, color, religion, sex, national origin, disability,
and familial status.
HUD FHEO Duties and Responsibilities
The Office of Fair Housing and Equal Opportunity administers federal laws and establishes national
policies that ensure that all Americans have equal access to the housing of their choice.
Activities carried out by the Office of Fair Housing and Equal Opportunity include implementing and
enforcing the Fair Housing Act and other civil rights laws, including Title VI of the Civil Rights Act of
1964, Section 109 of the Housing and Community Development Act of 1974, Section 504 of the
108 United States Department of Housing and Urban Development, Office of Fair Housing and Equal Opportunity, Source: http://hud.gov/offices/fheo
168
Rehabilitation Act of 1973, Title II of the Americans with Disabilities Act of 1990, the Age
Discrimination Act of 1975, Title IX of the Education Amendments Act of 1972, and the Architectural
Barriers Act of 1968.
In addition to these general duties, FHEO:
manages the Fair Housing Assistance Program (FHAP), administers the award and
management of Fair Housing Initiatives Program (FHIP) grants, and proposes fair
housing legislation;
works with other government agencies on fair housing issues;
reviews and comments on Departmental clearances of proposed rules, handbooks,
legislation, draft reports, and notices of funding availability for fair housing
considerations;
interprets policy, process complaints, performs compliance reviews and offer
technical assistance to local housing authorities and community development
agencies regarding Section 3 of the Housing and Urban Development Act of 1968;
conducts oversight of the Government-Sponsored Enterprises, Fannie Mae and
Freddie Mac, to ensure consistency with the Fair Housing Act and the fair housing
provisions of the Federal Housing Enterprises Financial Safety and Soundness Act;
and
works with private industry, fair-housing and community advocates on the
promotion of voluntary fair housing compliance.
FHEO – Fair Housing Assistance Program (FHAP)109
Fair Housing Assistance Program (FHAP) funding is awarded by FHEO, noncompetitively, to State
and local agencies that enforce fair housing laws that are substantially equivalent to the Fair
Housing Act. FHAP-funded activities help protect families and individuals who believe they have
been victims of discrimination on the basis of race, color, national origin, religion, sex, disability or
familial status (i.e., the presence of children) in the sale, rental, or financing of housing. Missouri has
a Fair Housing law that covers the study area.
FHAP grantee agencies serving the study area include the Missouri Commission on Human Rights.
The City of St. Louis Civil Rights Enforcement Agency is also a FHAP agency, but it has no jurisdiction
outside the City of St. Louis.
109 United States Department of Housing and Urban Development, Office of Fair Housing and Equal Opportunity, http://portal.hud.gov/hudportal/HUD?src=/program_offices/fair_housing_equal_opp/partners/FHAP
169
FHEO – Fair Housing Initiatives Program (FHIP)110
Fair housing organizations and other non-profits that receive funding through the Fair Housing
Initiatives Program (FHIP) assist people who believe they have been victims of housing
discrimination.
FHIP organizations partner with HUD to help people identify government agencies that handle
complaints of housing discrimination. They also conduct preliminary investigation of claims,
including sending "testers" to properties suspected of practicing housing discrimination. Testers
are minorities and whites with the same financial qualifications who evaluate whether housing
providers treat equally-qualified people differently.
Applicants must be qualified fair housing enforcement organizations with at least two years of
experience in complaint intake, complaint investigation, testing for fair housing violations, and
meritorious claims in the three years prior to the filing of their application.
In addition to funding organizations that provide direct assistance to individuals who feel they have
been discriminated against while attempting to purchase or rent housing, FHIP also has initiatives
that promote fair housing laws and equal housing opportunity awareness.
HUD funded two agencies in Missouri under the most recent FHIP funding award period (2012):111
the Metropolitan St. Louis Equal Housing Opportunity Council in the City of St. Louis and the
Missouri Commission on Human Rights with offices in Jefferson City. Details about both
organizations and their fair housing activities are provided later in this section.
Other National Fair Housing Organizations
The National Fair Housing Alliance (NFHA) 112
The National Fair Housing Alliance (NFHA) is a national organization dedicated solely to ending
discrimination in housing. NFHA consists of more than 220 private, non-profit fair housing
organizations, state and local civil rights agencies, and individuals.
NFHA holds conferences, workshops, and training programs, including a Fair Housing School which
trains representatives of public and private fair housing organizations on fair housing basics,
investigation and testing of real estate and lender discrimination, and organizational operations.
The NFHA also works with the private and public partners to promote better knowledge about
housing discrimination.
110 United States Department of Housing and Urban Development, Office of Fair Housing and Equal Opportunity, http://portal.hud.gov/hudportal/HUD?src=/program_offices/fair_housing_equal_opp/partners/FHIP 111 U.S. Department of Housing and Urban Development, Office of Fair Housing and Equal opportunity, Source: http://portal.hud.gov/hudportal/documents/huddoc?id=fy2fhip_granteelist.pdf 112 National Fair Housing Alliance, Source: http://www.nationalfairhousing.org
170
The Leadership Conference on Civil and Human Rights113
The Leadership Conference on Civil and Human Rights, originally named the Leadership Conference
on Civil Rights when it was created in 1950, was organized to fight for equal opportunity and social
justice. In January 2010, the Leadership Conference on Civil Rights changed its name to The
Leadership Conference on Civil and Human Rights.
The Leadership Conference lobbied for the passage of the Civil Rights Act of 1957, the Civil Rights
Act of 1960, the Civil Rights Act of 1964, the Voting Rights Act of 1965, the Fair Housing Act of 1968,
and also helped to organize the 1963 March on Washington.
State Fair Housing Agencies in Missouri
Missouri Commission on Human Rights
“The mission of the Missouri Commission on Human Rights is to develop, recommend, and
implement ways to prevent and eliminate discrimination and to provide fair and timely resolutions
of discrimination claims through enforcement of the Missouri Human Rights Act. The Commission
investigates complaints of discrimination in housing, employment, and places of public
accommodations based on race, color, religion, national origin, ancestry, sex, disability, age (in
employment only), and familial status (in housing only).” 114
The Missouri Commission on Human Rights enforces the Missouri Human Rights Act. This law
prohibits discrimination in housing, employment, and places of public accommodations based on
race, color, religion, national origin, ancestry, sex, disability, age (in employment only), and familial
status (in housing only).
The Act also protects individuals against retaliation for filing a complaint of discrimination,
testifying or assisting in an investigation or other processes. Individuals are also protected from
discriminatory acts on the basis of their association with a person in a protected category.
Individuals who believe they have been discriminated against for any of those reasons can file a
complaint with the Missouri Commission on Human Rights (MCHR).
The Act makes it illegal to discriminate in any aspect of housing because of an individual’s race,
color, national origin, ancestry, religion, sex, familial status (children under the age of 18 living with
parents or legal custodians, pregnant women, and people securing custody of children under the
age of 18), and disability:
Refusing to rent or sell housing
Refusing to negotiate for the sale or rental of housing
113 The Leadership Conference on Civil and Human Rights, Source: http://www.civilrights.org 114 Missouri Department of Labor, Commission on Human Rights, Source: http://labor.mo.gov/mohumanrights
Setting different terms, conditions, or privileges for sale or rental of a dwelling
Making housing unavailable to certain individuals
Falsely denying that housing is available for inspection, sale, or rental
Providing different housing services or facilities to certain individuals
For profit, persuade owners to sell or rent (blockbusting)
Denying certain individuals access to or membership in a facility or service (such as a
multiple listing service) related to the sale or rental of housing.
In mortgage lending, the following actions are prohibited, if based on race, color, religion, national
origin, ancestry, sex, familial status, or disability:
Refusing to make a mortgage loan
Refusing to provide information regarding loans
Imposing different terms or conditions on a loan, such as different interest rates, points, or
fees
Discriminating in appraising a property
Refusing to purchase a loan
Setting different terms or conditions for purchasing a loan.
In addition, it is illegal for a housing provider in Missouri to:
Harass an individual on the basis of race, color, religion, national origin, ancestry, sex, familial
status, or disability
Retaliate against an individual for filing a complaint of discrimination, participating in an
investigation or hearing, or opposing discriminatory practices
Advertise or make any statement that indicates a limitation or preference based on race,
color, religion, national origin, ancestry, sex, familial status, or disability.
Additional Housing Protection for Persons with Disabilities
For persons with disabilities that substantially limits one or more major life activities, has a record
of such a disability, or is regarded as having such a disability, landlords may not:
Refuse to let the tenant make reasonable modifications to your dwelling or common-use
areas, at your expense, if necessary for you to use and enjoy the housing.
Refuse to make reasonable accommodations in rules, policies, practices, or services if
necessary for the person with a disability to use and enjoy the housing.
Housing Opportunities for Families
An apartment building or community may not exclude families with children or pregnant women
unless it qualifies as housing for older persons.
Housing for older persons is exempt from the prohibition against familial status discrimination if:
172
It houses at least one person who is 55 years of age or older in at least 80 percent of the
occupied units, and adheres to a policy that demonstrates intent to house persons who are
55 years of age or older
It is intended for, and solely occupied by, persons 62 years of age or older
It is specifically designed and operated to assist elderly persons, as defined in a state or
federal program.
Agencies Primarily Serving Persons with Disabilities
Governor’s Council on Disability115
The Governor’s Council on Disability is the state organization that provides educational programs
on disability rights and awareness, universal design, and technical assistance on disability rights
and housing.
Missouri Assistive Technology (Moat)116
MoAT administers the Show-Me Loans Program for home access modifications for persons with
disabilities.
Missouri Department of Mental Health, Division of Developmental Disabilities117
Created in 1974 and located in the Missouri Department of Mental Health, the Division of
Developmental Disabilities (DD), serves a persons with developmental disabilities such as
intellectual disabilities, cerebral palsy, head injuries, autism, epilepsy, and certain learning
disabilities. The conditions must have occurred before age 22, with the expectation that they will
continue.
To be eligible for services from the Division, persons with these disabilities must be substantially
limited in their ability to function independently.
The agency has regional offices throughout Missouri. The St. Louis County Regional Office is the
primary point of entry into the system for St. Louis County, while the St. Louis Tri County Regional
Office is the primary point of entry into the system for St. Louis City, St. Charles and Jefferson
counties.
The Division of Developmental Disabilities completed a Housing Plan in 2012 with the following
mission:
115 State of Missouri, Governor’s Council on Disability, “Missouri’s Guide to Housing Assistance Programs,” Source:
http://dmh.mo.gov/docs/ada/housingbook.pdf 116 State of Missouri, Governor’s Council on Disability, “Missouri’s Guide to Housing Assistance Programs,” Source:
http://dmh.mo.gov/docs/ada/housingbook.pdf 117 Missouri Department of Mental Health, Division of Developmental Disabilities, Source: http://dmh.mo.gov/dd/about.htm
the Legal Aid Society, the City of St. Louis and the Bar Association of Metropolitan St. Louis
established a volunteer legal aid bureau.
During the 1970s, five additional counties in the St. Louis metropolitan area were added to the
service area and the organization was renamed Legal Services of Eastern Missouri. In 1993, the
service area was expanded to another 14 counties through a merger with the Legal Services of
Northeast Missouri program in Hannibal, Missouri. Today, Legal Services of Eastern Missouri, Inc.
(LSEM) provides free civil legal assistance to elderly and low-income people in 21 counties in
Eastern Missouri.122
The LSEM has a Housing Unit that represents clients in all housing matters including landlord tenant
disputes, subsidized housing issues, fair housing issues, and home ownership matters. The Housing
Unit also assists homeless individuals in removing obstacles to obtaining housing.
Community Action Agency of St. Louis County123
The Community Action Agency of St. Louis County, Inc. (CAASTLC) is part of the national network
of federally funded Community Action Agencies (CAAs), created by the Economic Opportunity Act
of 1964.
Originally incorporated as Metroplex, Inc. in 1968, the organization was operated by the Human
Development Corporation of Metropolitan St. Louis. Ten years later, Metroplex, Inc. became a
separate organization whose mission was to carry out anti-poverty programs for St. Louis County,
excluding Wellston.
The organization has undergone two additional name changes since it was named Metroplex, Inc.
In 1996, the name was changed to STEP, Inc. and became the Community Action Agency of St. Louis
County (CAASTLC) in 2003.
The agency provides the following housing program services:
Helping clients build savings through Individual Development Accounts
Providing rent and mortgage assistance payments
Placement of clients with credit issues into permanent housing
Assists with re-negotiation of unfair leases
Provides credit and financial counseling.
Catholic Charities124
Catholic Charities of St. Louis (CCSTL) has been helping people in need since 1912.
122 The counties served by LSEM are Adair, Clark, Franklin, Jefferson, Knox, Lewis, Lincoln, Macon, Marion, Monroe, Montgomery, Pike, Ralls, Schuyler, Scotland, Shelby, St. Charles, St. Louis City, St. Louis County, Warren and Washington. 123 Community Action Agency of St. Louis County, http://www.caastlc.org/about-caastlc.html 124 Catholic Charities of the Archdiocese of Saint Louis, http://www.ccstl.org
179
Using eight agencies at 50 sites in 11 counties in the St. Louis metropolitan area, CCSTL provides
the following services:
Cardinal Ritter Senior Services provides a continuum of care to senior adults including social,
health and housing services.
Catholic Charities Community Services provides legal assistance, refugee services, housing
crisis and homeless prevention to individuals and families in need.
Catholic Family Services is a professional counseling agency which provides community-
based education and mental health services at numerous outreach locations.
Good Shepherd Children & Family Services provides the highest quality foster care, adoption,
expectant parent counseling, advocacy and residential services.
Marygrove provides day and residential treatment for children and youth, including
diagnosis, therapy and treatment, education and healthcare. Marygrove also provides crisis
care, therapeutic foster care, transitional and independent living programs.
Queen of Peace Center is a family-centered behavioral healthcare provider for women with
addiction, their children and families.
Saint Martha's Hall offers shelter, counseling and education to battered women and their
children.
St. Patrick Center provides opportunities for self-sufficiency and dignity to people who are
homeless or at risk of becoming homeless.
Housing programs provided by Catholic Charities for the AI study area include:
Transitional Housing
The St. Philippine Home provides therapeutic structured living for up to two years for
homeless women and their children. The programs at St. Philippine Home seek to stabilize
families during the transition between substance abuse treatment and recovery. Services
provided at the St. Philippine Home include:
o 24 hour residential services and 33 beds;
o Drug and alcohol, education and group and individual, family and co-dependency
Other transition housing includes Cathedral Tower (26 residential treatment beds for
women and their children), the Annex (19 residential supportive recovery beds for women
and their children), and Our Lady of Perpetual Help (24 residential treatment beds for
pregnant and postpartum women and their children.)
Permanent Housing
Queen of Peace Center offers assistance to those needing permanent housing, including:
o Rental assistance for individuals and families who are city residents, homeless, low
income or disabled by mental illness, drug addiction or HIV/AIDS;
o Property development;
o Liaison support for landlord, tenant and local referring agencies; and
o Help to meet HUD quality standards.
Several permanent housing locations are available for women and their children, including:
o Cathedral Tower – 8 units of efficiency apartments for women;
o The Annex at Pershing – 7 units of efficiency apartments for women;
o Pope – 12 units of 2 and 3 bedroom apartments for women with co-occurring disorders
and their children; and
o Visitation – 11 units of 1 and 2 bedroom apartments for women and their children.
Better Family Life, Inc.125
Better Family Life, Inc. (BFL) is a non-profit community development corporation organized in
February 1983 to find solutions to crises within African American families. Its mission is “to plan
and establish social, cultural, artistic, youth, economic, housing and educational programs that help
to promote positive and innovative changes within the metropolitan St. Louis area.” The BFL's
programs are directed to people who are unemployed, underemployed, disadvantaged and skill-
deficient. The St. Louis area is served primarily by centers in the City of St. Louis, with two centers
also located in the study area: Florissant, and Wellston.
The BFL carries out housing activities, including general and fair housing counseling, foreclosure
intervention, home repairs, and downpayment assistance.
Neighborhood Assistance Corporation of America126
The Neighborhood Assistance Corporation of America (NACA) is a non-profit community advocacy
and homeownership membership organization originally created in 1988 with offices located in 27
states and in the District of Columbia. Two NACA offices are located in Missouri: St. Louis and
Kansas City.
125 Better Family Life, Inc., Source: http://www.betterfamilylife.org 126 Neighborhood Assistance Corporation of America, https://www.naca.com
181
While NACA is more widely known as a lender for mortgages and downpayment assistance loans, it
is also a HUD-approved Housing Counseling agency that provides fair housing counseling and
education to its clients.
Lemay Housing Partnership, Inc.127
The Lemay Housing Partnership was created in 1998 as non-profit organization to help preserve
and revitalize housing and neighborhoods. The organization functions as a Community Housing
Development Organization under HUD’s HOME Program.
The Lemay Housing Partnership, Inc. (LHP) is focused on three primary areas to serve the
community:
LHP provides Home Repair services to low and moderate income residents of Lemay.
LHP administers a Homebuyer counseling and Homeowner education program.
LHP develops residential housing in the Lemay community.
Homebuyer and Homeowner Education Workshops are generally free or low cost, with classes such
as: Selecting a contractor, Creating a household spending plan, Avoiding Foreclosure, and Services
for seniors. Fair Housing information is provided to participants.
Public Knowledge of Fair Housing Issues
As a part of the preparation of the AI for St. Louis County and for the Cities of Florissant and O’Fallon,
an online survey regarding local housing conditions was conducted. Several survey questions
queried respondents regarding housing discrimination and knowledge of fair housing rights.
A survey question asked, “Do you know your fair housing rights?” The responses were 43.1% said
“Yes,” 27.5% indicated “Somewhat,” while 29.4% said “No.” 128 The survey responses revealed that
less than one-half (43.1%) knew their housings rights.
The survey then asked “Do you know where to file a housing discrimination complaint?129 The
responses were: 47.1% “Yes,” 15.7% “Somewhat,” and 37.3% “No.” Similar to the previous question,
less than one-half (47.1%) knew where to file a complaint.
127 Lemay Housing Partnership, Inc., http://www.lemayhousing.org 128 St. Louis County, Missouri, Office of Community Development, “Fair Housing Survey: St. Louis County, Florissant, O’Fallon,” 2014, Question 27 129 St. Louis County, Missouri, Office of Community Development, “Fair Housing Survey: St. Louis County, Florissant, O’Fallon,” 2014, Question 28
182
In response to the question: “Since living in the area, have you experienced housing discrimination?”
Slightly more than 9 out every 10 (92.2%) said “No.”
For persons who commented that they had experienced housing discrimination, 80% responded
that the discriminatory acts toward them were carried out by a landlord/property manager, while
20% indicated that a city/county staff person was responsible.130
130 St. Louis County, Missouri, Office of Community Development, “Fair Housing Survey: St. Louis County, Florissant, O’Fallon,” 2014, Question 24
47.1%
15.7%
37.3%
Do you know where to file a housing discrimination complaint?
43.1%
27.5%
29.4%
Do you know your Fair Housing Rights?
Yes
Somewhat
No
183
For the persons who had experienced housing discrimination, only 20% had filed a report.131
131 St. Louis County, Missouri, Office of Community Development, “Fair Housing Survey: St. Louis County, Florissant, O’Fallon,” 2014, Question 25
Yes, 7.8%
No, 92.2%
Since living in the area, have you experienced housing discrimination?
Yes, 20.0%
No, 80.0%
Did you file a report of that discrimination?
0%
10%
20%
30%
40%
50%
60%
70%
80%
90%
a landlord/propertymanager
a real estate agent a mortgage lender a city/county staffperson
If you experience housing discrimination, who discriminated against you?
184
Conclusion
In the St. Louis County, the City of Florissant, and the City of O’Fallon, many organizations provide
fair housing education and fair housing enforcement.
While the survey had a limited number of responses, from the completed surveys received, the
number of persons who knew their fair housing rights is lower than desirable. Additional efforts
are still needed to arm the residents of the region with more knowledge about what constitutes
housing discrimination and the steps to be taken if discriminatory acts occur.
185
Housing Discrimination Complaints
The HUD Office of Fair Housing and Equal Opportunity (FHEO) administers federal laws and
establishes national policies that ensure that all Americans have equal access to the housing of their
choice. Individuals who believe they are victims of housing discrimination can file a fair housing
complaint through the respective HUD Regional FHEO office and/or through local or state fair
housing organizations. Typically, when a complaint is filed with one or more of these agencies, a
case is opened and an investigation of the allegations of housing discrimination is initiated.
If the complaint is not successfully mediated, the FHEO determines whether reasonable cause exists
to believe that a discriminatory housing practice has occurred. Where reasonable cause is
ascertained, the parties to the complaint are notified by HUD's issuance of a “Determination,” as
well as a “Charge of Discrimination,” and a hearing is scheduled before a HUD administrative law
judge. Either party (complainant or respondent) may cause the HUD-scheduled administrative
proceeding to be terminated by electing to have the matter litigated in federal court.
National Housing Discrimination Complaints
According to the National Fair Housing Alliance (NFHA) 2013 Fair Housing Trends Report, national
data continues to show housing discrimination acts that result in complaints filed with fair housing
agencies. The data in 2012 showed that more disability complaints had been filed than any other
type of fair housing complaints. The NFHA suggests that this may be attributed to apartment
owners’ direct refusal to make reasonable accommodations or modifications for people with
disabilities. As a result, HUD has implemented the Fair Housing Accessibility FIRST program to
assist in educating architects and builders regarding design and construction of accessible housing
units. Total complaints filed nationally, as reported by NFHA are reflected in the chart that follows.
While the number of housing discrimination complaints at the national level may not correlate in a
mathematical way with the number of similar incidents in the study area, these national statistics
serve to illustrate that housing discrimination remains a national problem.
186
Local Housing Discrimination Complaints
Housing discrimination complaints in St. Louis County and the City of O’Fallon may be filed with
HUD; the Missouri Commission on Human Rights; the Metropolitan St. Louis Equal Housing
Opportunity Council (EHOC); or, in some jurisdictions, with the local human rights/relations
commission (see e.g., St. Louis County Code of Ordinances Sec. 717.010 et seq.; City of Sunset Hills
Code of Ordinances Sec. 2-359).
Complaints filed with HUD
Region VII of the FHEO receives complaints by households regarding alleged violations of the Fair
Housing Act for cities and counties throughout Missouri and Iowa, Kansas, and Nebraska. The
mission of the FHEO is to protect individuals from employment, housing and public accommodation
discrimination, and hate violence. To achieve this mission, the FHEO maintains databases of and
investigates complaints of discrimination and hate violence.
A FOIA request was sent to the appropriate local FHEO in Kansas City, KS, for fair housing complaint
data to include the total number of complaints, the transaction area, the status, and the basis/bases
of complaints received by HUD originating in St. Louis County or the City of O’Fallon for the period
January 1, 2009, through March 31, 2014.
In response, HUD stated that its database showed that no information was found for cases filed in
St. Louis County.
Source: National Fair Housing Alliance, 2013 Fair Housing Trends, April 13, 2013
187
The following table identifies the number of complaints filed in O’Fallon (where the alleged
discrimination occurred), the status of the complaint, and the bases for the complaint, for the period
January 1, 2009 – March 31, 2014.
According to HUD’s field office, from January 1, 2009, through March 31, 2014, there were three
discriminatory housing complaints filed with HUD regarding housing in St. Louis County and the
City of O’Fallon. Of these complaints, two were determined to have cause and were settled through
conciliation. As of March 31, 2014, three of three complaints had been closed. The complaint data
as documented by the FHEO are found in full in the Appendix.
All three of the complaints for this period investigated by the FHEO were based on disability.
Complaints Filed With Metropolitan St. Louis Equal Housing Opportunity Council (EHOC)
The Metropolitan St. Louis Equal Housing Opportunity Council (EHOC) was established in 1992 as
a private, nonprofit fair housing advocacy and enforcement organization. EHOC provides fair
housing education and outreach services, and also receives and investigates fair housing
discrimination complaints for the Greater St. Louis Area.
Complaints of Housing Discrimination Received by HUD for St. Louis County & O’Fallon
St. Louis County City of O’Fallon
# Filed No data found 3
# Closed 3
#Open 0
With Cause Settlement
2
2 - Yes Disability 3
Color/Race
Familial Status
Marital Status
Sex
National Origin
Age
Citizenship
Religion
Retaliation
Harassment
Other/Criminal Status
Source: U.S. Housing & Urban Development Office of Fair Housing and Equal Opportunity
188
On behalf of St. Louis County, a request was made to EHOC for data reflecting the total number of
housing discrimination complaints received, the transaction area of all such complaints received,
the basis/bases of all such complaints received, and the status of all such complaints received, for
the period January 1, 2009, through March 31, 2014. The following information was provided by
EHOC regarding complaints of housing discrimination:
Complaints of Housing Discrimination Received by EHOC for St. Louis County and O’Fallon (01/2009-03/2014)
St. Louis County City of O’Fallon
# Complaints Received 79 1
Transaction Area:
Rental 43
Lending 23 1
Advertisement 11
Basis:
Disability 21
Color/Race 32 1
Familial Status 20
Sex 11
National Origin 6
From January 1, 2009, through March 31, 2014, EHOC received 80 complaints for alleged housing
discrimination occurring in St. Louis County or the City of O’Fallon. Among the complaints received
by EHOC, allegations of discrimination based on color/race were the most common (33 complaints).
Discrimination with regard to disability ranked second (21 complaints), and familial status
complaints followed at 20 complaints. The majority of the complaints received occurred in the
transaction area of rental housing (43 complaints), followed by lending (23 complaints), and
discriminatory advertising (11 complaints).
Complaints Filed With the Missouri Commission on Human Rights
The Missouri Commission on Human Rights (MCHR) also receives, investigates, and facilitates
resolution of housing discrimination complaints (as well as complaints of discrimination in
employment and places of public accommodations) based on race, color, religion, national origin,
ancestry, sex, disability, age (in employment only), and familial status (in housing only). The MCHR
is tasked with upholding and enforcing the Missouri Human Rights Act (MO. Rev. Stat. Chapter 213
et seq.).
For this analysis, housing discrimination complaint data was requested from the MCHR by letter
dated May 1, 2014, for data reflecting the total number of housing discrimination complaints
received, the transaction area of all such complaints received, the basis/bases of all such complaints
189
received, and the status of all such complaints received, for the period January 1, 2009, through
March 31, 2014. The MCHR reports data to and relies on a database maintained by the Federal Equal
Employment Opportunity Council (EEOC), and accordingly requested the data needed for this
report from the EEOC.
Complaints of Housing Discrimination Received by the MCHR for St. Louis County and O’Fallon (01/2009-03/2014)
St. Louis County City of O’Fallon
# Complaints Received 201 27
# Open 26 2
No Cause finding issued 95 10
Settlement w/ benefits 28 2
Successful conciliation 0 1
Withdrawal w/ benefits 24 5
Administrative closure 28 7
Basis:
Color/Race 68 15
Sex 23 3
National Origin 9 1
Religion 7
Retaliation 11
From January 1, 2009, through March 31, 2014, the MCHR received 228 complaints for alleged
housing discrimination occurring in St. Louis County or the City of O’Fallon. Among the complaints
received by the MCHR, allegations of discrimination based on color/race were the most common
(83 complaints). Discrimination with regard to sex ranked second (26 complaints), followed by
retaliation at 11 complaints. After investigation, a “No Cause” finding was issued for 105 (46%) of
the complaints filed. Thirty-one cases were settled with benefits or successful conciliation.
Summary of Findings
An examination of fair housing complaints for jurisdictions can be used as an indicator to identify
heavily impacted areas and characteristics of households experiencing housing discrimination.
However, it is important to note that reviewing the number of fair housing complaints filed within
a given community cannot by itself be used as a direct indicator of fair housing problems in that
community. Among the agencies accepting fair housing complaints for St. Louis County, the largest
numbers of complaints filed were alleged claims of discrimination based on color/race and
disability.
190
A low number of complaints filed should not be indicative of a low incidence of housing
discrimination in a community. Many households do not file complaints because they are not
knowledgeable of the process for filing a complaint. However, there are households that are aware
that they are experiencing housing discrimination, but they are simply not aware that this
discrimination is against the law. Finally, most households are more interested in achieving their
first priority of finding decent affordable housing and prefer to avoid going through the process of
filing a complaint and following up to ensure the case is resolved.
In conducting this fair housing complaint analysis, several data limitations should be noted:
Because each agency’s complaint process relies on people self-reporting, the data represents
only complaints filed and is not inclusive of the total number of inquiries and does not represent
all acts of housing discrimination, as all incidents may not be reported;
Larger, denser areas are likelier to have a higher number of complaints due to larger
populations;
The fair housing complaint timeframe considered in the Analysis ranges due to each agency’s
access to archived complaint data;
The fair housing complaints filed in St. Louis County represent the location in which the
discrimination occurred and may include complaints filed by residents of other jurisdictions.
Due to time and cost limitations, a request for fair housing complaint data was not made to each
specific jurisdiction within the St. Louis County study area, although some individual jurisdictions
do accept complaints regarding fair housing discrimination and have their own processes for
handling those.
191
Housing Discrimination Lawsuits
Below is a summary of the nature, extent, and disposition of significant housing discrimination
lawsuits filed and/or adjudicated between 2005 and May 2014 involving or affecting parties and
local governments within the St. Louis County study area, and which may impact fair housing choice
within the study area. Several cases that involved parties and jurisdictions outside the St. Louis
County study area also are included because the issues presented may likely impact future
legislation and litigation within the study area. The cases chosen for discussion may be broken up
into four main fair housing issues: (1) discriminatory lending practices, (2) occupancy limits and
restrictive definitions of “family” which exclude unrelated persons, (3) housing rights based on
immigration status, and (4) minimum spacing and density requirements for group homes for
persons with disabilities.
Missouri has adopted a parallel version of the federal Fair Housing Act, allowing plaintiffs alleging
violation of fair housing rights to seek redress in state or federal court, or by filing a complaint with
the Missouri Human Rights Commission. Though the Missouri Human Rights Act (MHRA) (Missouri
Revised Statutes Sec. 213.040 et seq.) and the federal FHA are not identical, they are coextensive,
and accordingly Missouri courts are guided by both Missouri law and federal law in deciding claims
of housing discrimination.
Issue 1: Discriminatory lending practices found in St. Louis County.
U.S. v. Midwest BankCentre, Civil Action No. 4:11-cv-01086-FRB (E.D. Mo.) (settlement entered
June 28, 2011, amended agreement entered April 15, 2013).
In June 2011, the Department of Justice filed suit against Midwest BankCentre, a wholly-owned
subsidiary of Midwest BankCentre, Inc., a financial holding company headquartered in St. Louis
County, Missouri, with its principal office in St. Louis County. The federal government alleged that
BankCentre engaged in a pattern or practice of conduct in violation of the Fair Housing Act and the
Equal Credit Opportunity Act by discriminating on the basis of race and color in the provision of
residential real estate-related credit in the Missouri portion of the St. Louis MSA (which includes
the St. Louis County study area). The lawsuit alleged that Midwest BankCentre had been serving the
credit needs of the residents of predominantly white neighborhoods in the MSA while intentionally
and unlawfully avoiding serving the credit needs of majority African-American neighborhoods. The
bank denied the claims, but to avoid costly litigation agreed to a settlement. The original settlement
was filed in conjunction with the DOJ’s complaint in the U.S. District Court for the Eastern District
of Missouri. An amended settlement agreement, the “Amended Agreed Order,” was approved by the
court and entered April 15, 2013.
192
The lawsuit originated from information gathered by the Metropolitan St. Louis Equal Housing
Opportunities Council and provided to the Department of Justice in 2009, as well as a 2010 referral
by the Board of Governors of the Federal Reserve System to the Justice Department’s Civil Rights
Division.
The remedial plan under the settlement agreement includes the opening of at least one new full-
service branch in a majority-black census tract, and the investment of approximately $1.45 million
in majority-black areas of the St. Louis MSA. The settlement requires the Bank to make the following
investments: a minimum of $250,000 in advertising, marketing, and community outreach
campaigns; a minimum $900,000 in a special financing program to increase the amount of credit
the bank extends to majority African-American areas in order to aid in the revitalization and
stabilization of the housing market; and at least $300,000 for consumer education and credit repair
programs. The Bank also was required to conduct periodic fair lending training for its employees.
As part of the settlement, the Bank also agreed to pay $25,000 to compensate the Metropolitan St.
Louis Equal Housing Opportunity Council for the resources that it diverted to this matter
In a press release regarding the settlement, the Assistant Attorney General for the Justice
Department’s Civil Rights Division stated, “Lending discrimination deprives communities of access
to credit and leaves the residents of minority neighborhoods vulnerable to predatory lenders. This
type of discrimination is part of the web of intolerable practices that stripped vast amounts of
wealth from communities of color in the last decade. We are pleased that Midwest BankCentre has
begun working with community groups and agreed to invest and take creative steps to build credit
in an area that has been long been neglected by the banking community.”
Midwest BankCentre has until June 2016 to meet the requirements of the amended settlement
agreement, and remains under the Court’s jurisdiction for enforcement of the agreement until then.
Metropolitan St. Louis Equal Housing Opportunity Council v. First National Bank of St. Louis
and Central Bancompany, FHEO Case No. 07-10-0153-8 (Conciliation Agreement approved by
HUD Dec. 17, 2010).
In 2010, the Metropolitan St. Louis Equal Housing Opportunity Council (EHOC) – a grantee in HUD’s
Fair Housing Initiatives Program (FHIP) – filed a complaint with HUD alleging illegal redlining
against First National Bank of St. Louis and Central Bancompany. EHOC alleged that First National
designated its Community Reinvestment Act (“CRA”) assessment areas in a manner to exclude areas
of high minority concentration, and failed to market products to African Americans or in African
American communities. Further, EHOC alleged that First National denied loans to black applicants
at a rate five times higher than for white applicants, and charged higher rates based on the race of
applicants. The Banks denied wrongdoing, but to avoid costly administrative and judicial litigation
agreed to settle the claims. The parties entered a Conciliation Agreement approved by HUD on
December 17, 2010.
193
Under the settlement, EHOC received $100,000 for fair housing and community reinvestment
activities, and the Banks agreed to revise the assessment areas to include the entirety of St. Louis
County and areas of minority concentration. In addition, First National Bank of St. Louis agreed to
invest more than $2.5 million over four years in minority and low-income communities in the City
of St. Louis, north St. Louis County, and St. Clair County, Illinois. This includes opening a new full-
service branch in a majority African-American census tract, making Spanish-language services
available in all branches, conducting targeted advertising to African-Americans and Hispanics
including radio advertising and direct mailings, providing community development loans and
investments, subsidizing mortgage loans to residents of majority-minority areas, providing credit
counseling and financial literacy training, and requiring yearly fair lending training to its employees.
The agreement governs for four years from the effective date, unless the Bank fails to expend at
least $500,000 in the described Special Financing Program. Then HUD may extend the terms for an
additional year.
Issue 2: Occupancy limits and restrictive definitions of “family” that prevent unrelated
persons (including unmarried couples with children) from residing together as a single
housekeeping unit.
Loving v. City of Black Jack, Civil Action No. 2106CC-03157 (Circuit Court for the County of St.
Louis 2006), Civil Action No. 4:06-cv-01430 (E.D. Mo. 2006) (case removed to federal district
court and settlement agreement reached).
In August 2006, an unmarried couple, Olivia Shelltrack and Fondray Loving, represented by the
ACLU, filed suit against the City of Black Jack, after being denied an occupancy permit because the
local zoning law’s definition of “family” prohibited more than three unrelated people from living
together unless related by “blood, marriage or adoption.” At the time, Shelltrack and Fondray had
been together for 13 years and had two children together. However, because Loving was not the
biological father of Shelltrack’s oldest child, the City denied the family an occupancy permit for the
2,300 sq. ft. home that they had recently purchased. The family faced fines of up to $500 every week
for living in their home without an approved occupancy permit.
The lawsuit alleged violations of substantive due process and equal protection under the Missouri
and federal Constitutions, and discrimination on the basis of familial status in violation of the Fair
Housing Act. Plaintiffs argued that the City’s refusal to grant an occupancy permit, and subsequent
threat of enforcement action, burdens their fundamental rights to control the upbringing of their
children and to order their intimate family relationships within a single home, and also burdens the
children’s rights to cohabitate with their parents and siblings, without serving any legitimate
governmental interest.
194
On September 29, 2006, the Defendants removed the case to federal district court for the Eastern
District of Missouri, citing the multiple disputed issues of federal law. The City also unanimously
adopted a new ordinance redefining what constitutes a “family” for zoning and occupancy purposes,
and amended its housing code to include the same definition as that now contained in the zoning
ordinance.
In February 2007, the city of Black Jack agreed to a settlement, in its words to limit costly litigation
and because a change in the zoning code resolved the issue. The City agreed to pay $28,000 to settle
the lawsuit, including $5,500 each to Shelltrack and Loving, $1,000 for each of the three children,
and attorneys’ fees of $14,000. The case was subsequently dismissed.
The City’s current definition of “family” still restricts the number of unrelated persons who may
reside together to three, but also includes as an exception to that limit: “Two unrelated individuals
plus the biological, adopted, or foster children of either such individuals, living together as a single,
nonprofit housekeeping unit in a dwelling unit.” (The Zoning Ordinance of the City of Black Jack, Sec.
030(3)(27)(4)).
Issue 3: Prohibiting residential occupancy for persons who cannot provide proof of
citizenship or legal residency, i.e. housing rights based on immigration status.
Reynolds v. City of Valley Park, Civil Action No. 06-CC-3802, 2007 WL 857320 (Mo. Cir. Ct. St.
Louis County Mar. 12, 2007); Case No. ED89659 (Mo. Ct. App. 2008); Civil Action No.
4:06CV01487, 2006 WL 3331082 (E.D. Mo. 2006).
Gray v. City of Park Valley, Civil Action No. 2107CC-01103 (Mo. Cir. Ct. St. Louis Cnty.); Civil
In the Fair Housing Planning Guide, HUD defines an impediment to fair housing choice as an action,
omission or decision based on race, color, religion, sex, disability, familial status, or national origin
that restricts or has the effect of restricting housing choices or the availability of housing choices.133
Throughout this assessment various community issues have surfaced, both positive and negative.
Some of these issues represent general community needs (e.g. the quality of jobs available) and,
while valid, do not restrict or have the effect of restricting housing choice and thus do not constitute
impediments. Even some affordable housing-related issues (e.g. low credit scores leading to denial
of apartment rental applications) fall short of classification as impediments to fair housing choice.
For this analysis, qualitative data received in the form of input from interviews and community
meetings was combined with quantitative data from the U.S. Census and from the many other
sources consulted. In some cases, the quantitative data collected from a single source was clear and
compelling enough on its own to indicate the existence of an impediment. In other cases, and
particularly with the use of qualitative data, the cumulative effect of a comment or criticism
repeated many times over in many different settings was sufficient to indicate a barrier. Sometimes
a weak or inconclusive correlation of quantitative data from one source could be supported by
public comments and input or data from another source to constitute an impediment.
In this section, the impediments identified are summarized with supporting examples noted. Each
impediment listed is followed by recommendations, the implementation of which will correct, or
begin the process of correcting, the related barrier. It should be noted that these barriers are largely
systemic and will require effort from both private sector and public sector actors to correct.
Impediment #1: Affordable Housing Options Concentrated in Areas of Low Opportunity
(Applicable to St. Louis County & Florissant)
In St. Louis County, affordable housing options, both subsidized and non-subsidized, tend to be
concentrated in urban areas of low opportunity,134 particularly in the North County region which
includes the City of Florissant. This impediment is similar to the OneSTL FHEA’s finding that the
“(l)ocation of affordable housing perpetuates segregation and limits access to opportunity.” In
North County and in the Lemay area, affordable housing exists, sometimes with housing quality
issues, but the ability of area residents to improve economically is challenging. This report’s analysis
of access to areas of opportunity revealed that areas with low opportunity in terms of poverty,
school, proficiency, and labor market engagement are overwhelmingly concentrated in North
County communities. Public input reinforced this finding, with residents commenting that suburban
133 U.S. Department of Housing and Urban Development Office of Fair Housing and Equal Opportunity. Fair Housing Planning Guide: Volume 1 (Chapter 2: Preparing for Fair Housing Planning, Page 2-17). March 1996. 134 This Analysis of Impediments looks at neighborhood opportunity on six dimensions as defined by HUD, including poverty, school proficiency, labor market engagement, access to jobs, access to transit, and exposure to environmental health hazards. The County may choose to use these factors or develop an alternate definition of opportunity based on similar measures of community health.
203
areas outside St. Louis County tended to have higher performing schools, lower crime rates, and
better housing conditions. Residents of the study area interviewed for this report further cited a
general shortage of Section 8 units available in the County outside the North County area. Still others
named the low quality and deteriorating condition of existing affordable housing units as problems.
Taken together, the relative concentration of housing options affordable to people of low- and
moderate-income (who are disproportionately minorities) in high poverty areas without access to
quality schools and with low rates of labor market participation is an inherent restriction on
housing choice.
Recommendations
Local governments in the study area should partner with the private sector to create more mixed
income housing using available public resources such as the HOME Program, Low Income Housing
Tax Credits, and state or local housings bonds. Equally important could be the creation of a Mixed
Income Housing Investment Program, capitalized by lenders, which would provide incentive
financing to developers who construct sustainable mixed income housing in these regions of the
study area.
For affordable housing developments receiving public subsidy or incentives from a local
government entity (e.g. St. Louis County, Florissant, or other municipalities) the source of public
funds should prioritize projects located in high opportunity areas of the county, especially those
with transit access. To the extent these local government entities can influence the award of tax
credits by the Missouri Housing Development Commission to developers for new affordable
housing projects either through letters of endorsement or the investment of CDBG funds, such
measures should be reserved for those projects in high opportunity areas.
The efforts of groups like Beyond Housing, which focuses on comprehensive community
investments, stand as an example of how improving institutions that generate economic activity
should accompany affordable housing rehabilitation and preservation. If an area and its residents
do not have access to adequate income, rehabilitated housing will become subject to deferred
maintenance and the unit may again contribute to poorer housing quality in that area.
Other existing organizations such as SLEHCRA (St. Louis Equal Housing and Community
Reinvestment Alliance) are already working to improve opportunity in North County areas and
their work should be supported by St. Louis County and Florissant. New bank branches have opened
in low opportunity North County areas (Ferguson, Overland, and Pagedale) with record numbers of
deposits in their first weeks. Positive results like these should be promoted to encourage further
investment in these communities. In areas like North County that are economically distressed, the
types of employment opportunities available can perpetuate the cycle of unemployment and
underemployment. Public and private sector job training programs should be crafted that are
designed to raise the skill levels of area residents to match employment opportunities with better
pay in that area.
204
Expansion of the Section 8 program to include more units accepting the vouchers throughout St.
Louis County would increase affordable housing options in areas of greater opportunity and is
consistent with one of the recommendations of the 2012 St. Louis County Housing Study. The
County should encourage rental property owners in high opportunity areas to accept Section 8
vouchers through an education program that describes how the vouchers work and includes
testimonials from other local landlords who have had success with the Section 8 program. St. Louis
County and the City of Florissant should also explore the option of offering discounted occupancy
permits and/or expedited inspections for Section 8 landlords, and work with other jurisdictions in
the county who may be willing to offer similar incentives. The St. Louis County Housing Study also
recommended the creation of Voucher Counseling Centers where voucher recipients could be
assisted in locating housing units in locations that might not be concentrated in high poverty areas.
Impediment #2: Imbalance Between Job Centers and Affordable Housing Options (O’Fallon)
Compared to other communities in the study area, in O’Fallon, there is relatively little available
affordable housing. The rapid growth of O’Fallon and St. Charles County has occurred at the same
time that North St. Louis County has declined in population and economic prosperity. Much of the
economic expansion in O’Fallon has been as a result of the construction of higher cost housing and
the retail infrastructure that supports households with higher incomes. As a result, the City contains
many service-sector jobs, but the lack of affordable housing makes it difficult for people holding
these jobs to live in proximity to them. Because there isn’t adequate affordable housing for the City’s
workforce, the housing options for lower-wage workers tend to be limited.
Recommendations:
The construction of new affordable and/or mixed-income housing would accomplish the goal of
increased economic opportunity and greater standard housing available for a more diverse
population. A Housing Market Analysis should be prepared for O’Fallon to provide reliable
information to guide public policymakers and private investors in determining whether and where
affordable and/or mixed-income housing projects are feasible, what types of public and private
financing would be needed, and a potential timeline for development.
Density bonuses, fee waivers or other incentives for development of workforce or mixed-income
housing could spur investment and development. Finally, education for city council members and
other local leaders on the benefits of providing a range of housing options, including housing for the
local workforce could result in additional support for these initiatives.
Impediment #3: NIMBY/Prejudiced Attitudes (St. Louis County, Florissant, O’Fallon)
Segregation between Black and White residents of the study area is high (dissimilarity index value
of 0.71) and remained unchanged between 2000 and 2010. Whereas studies of other communities
outside the St. Louis region tend to reveal declining levels of racial and ethnic segregation, the issue
in this study area appears to be persistent. Public input and comments received through the Fair
Housing Survey conducted in conjunction with this AI reveal that some residents of the study area
205
hold strong “Not In My Back Yard” (NIMBY) sentiments as well as attitudes prejudiced against
people of low-income, those residing in subsidized housing, and racial/ethnic minorities.
Recommendations:
Education and awareness is imperative to alleviating NIMBYism and prejudiced attitudes.
Segregatory living patterns and prejudiced personal beliefs and attitudes create negative impacts
on social conditions and discourse and can take many years to overcome. In the near term,
education and awareness of the value of diversity and integration is especially important (this was
also recommendation 1.1 in the OneSTL FHEA). The local governments within the study area should
continue to support and work with organizations (such as InvestSTL) dedicated to promoting
diversity throughout metro St. Louis and St. Louis County.
Collaborating with the assigned HUD Office of Fair Housing and Equal Opportunity and/or with local
fair housing advocacy organizations, the entitlement communities should develop an appropriate
diversity and sensitivity awareness curriculum and then make it a mandatory requirement for staff,
subrecipients, and any other entities the County may contract with under its CDBG program. Over
time, the training program should be expanded and offered to the public, by holding workshops or
by sending speakers to club meetings and other gatherings.
A separate campaign to educate local leaders and elected officials in St. Louis County jurisdictions
and in O’Fallon regarding the economic benefits of diversity should be developed, and they should
be encouraged to participate in countywide or regional initiatives. The campaign should identify
and publicize local examples of success, such as that of the Brentwood School District which has
taken a deliberate approach of embracing diversity.
Impediment #4: Unreasonably Restrictive Definitions of “Family” and Related Occupancy
Permitting Requirements (St. Louis County & Florissant & O’Fallon)
In the sample of municipal zoning codes reviewed in conjunction with this AI, many were found to
have restrictive definitions of “family,” unreasonably restricting the number of unrelated people
permitted to live together in a housing unit. For example, in 2006, the City of Black Jack settled a
suit (Loving v. City of Black Jack) that arose out of the denial of an occupancy permit for a household
that, under the city’s code, exceeded the limit of three unrelated members.
The impact of these restrictive definitions found in local zoning codes is amplified by occupancy
permitting requirements. In Florissant and in many other communities in the study area, a permit
must be obtained from the municipal government for the number of persons occupying a housing
unit. Changes in the household composition (i.e. the number of occupants) require a new permit. In
O’Fallon, an occupancy permit and inspection is required upon turnover of rental housing units,
although the permit is not based on the number of people occupying a housing unit. Additionally,
some municipalities require proof of legal residency in order to obtain an occupancy permit.
Through these various occupancy permitting requirements, communities are able to control, by
206
approval or denial of a permit, who may live in their jurisdiction, expressly limiting fair housing
choice. It should be noted that St. Louis County’s zoning code affects only unincorporated areas of
the county and that the county government has no control over municipal ordinances.
Recommendations:
The entitlement communities should explore the opportunity to partner with a local university for
a review of occupancy permit requirements, family definitions, and zoning ordinances (including
regulations regarding group homes and residential treatment centers) in all St. Louis County
jurisdictions and in O’Fallon. This work could be led by a professor with research support from
public policy or planning graduate students. When the review is complete, the results should be
presented to a panel of community representatives, representing various stakeholder groups
(including planners, zoning officials, fair housing advocates, and advocates for immigrants) who
should then advocate ordinance revisions where appropriate.
Impediment #5: Limited Housing Options for People with Disabilities (St. Louis County,
Florissant, O’Fallon)
In both the sample set of municipal zoning codes reviewed as part of this AI and in the review of fair
housing-related lawsuits for jurisdictions in the study area, ordinance and policy provisions often
restricted housing choice for people with disabilities. In half of the zoning codes reviewed, a spacing
requirement was imposed between group homes for people with disabilities. Such requirements,
when applied to housing for people with disabilities but not to housing types occupied by others,
has potential to violate the Fair Housing Act. Of the zoning codes reviewed none provided a clear
and objective process by which persons with disabilities may request a reasonable accommodation
to zoning, land use, and other regulatory requirements. Further, the codes in the sample set also
restricted residential treatment facilities only to non-residential zones. Under federal law, it is
discriminatory to deny an individual or entity the right to site a treatment program in a residential
zone because it will serve individuals with alcohol or other drug problems. Particularly in Florissant
and St. Louis County, the age of the housing stock also may limit the availability of housing units
accessible to people with disabilities, as older housing units are less likely to have been built to
modern accessibility or visitability standards.
Recommendations:
It is recommended that St. Louis County, Florissant, and O’Fallon meet with disability advocates to
better understand types and locations of units missing from the current accessible housing stock
and to identify best practices for or examples of design of accessible units. For housing
developments with public funding, prioritize those that meet these identified needs. For other
private/market-rate projects, educate developers about and encourage them to consider these
needs.
207
Density bonuses or other incentives for projects built according to universal design principles such
that all units are handicap accessible would open up new housing options and increase housing
choice. For residential developments competing for public funding, those that offer universal
design, or that otherwise exceed FHA minimum accessibility requirements (either in number of
accessible units provided and/or in the design of these units) should be prioritized.
Regarding reasonable accommodation standards, model ordinances are available that have been
approved by HUD or the DOJ as part of fair housing settlement or conciliation agreements. These
models should be compiled by a regional organization and advocated to local municipalities.
Impediment #6: Private Sector Lending Discrimination (St. Louis County & Florissant)
Since 2005, two significant lawsuits have been filed against banks operating in or headquartered in
St. Louis County alleging discrimination on the basis of race and color in lending. Specifically, banks
in these two cases were said to have intentionally declined to provide loans to African Americans
or within predominantly African American communities. In both of these lawsuits, the banks
involved denied wrongdoing and settled the suits to avoid litigation. However, the similarities
between the two cases, the specific racial group denied loans, and the unwillingness to make loans
within specific communities raises important issues of fair housing choice.
Recommendations:
The Metropolitan St. Louis Equal Housing Opportunity Council (EHOC) and SLEHCRA have been
working to pressure lenders to stop disinvestment in areas with majority-minority populations and
reinvest in these regions. In fact, EHOC was involved in both of the cited lawsuits, as a plaintiff in
one and an informant in the other. This investigative and advocacy work should be supported by
the entitlement communities. Additionally, these or other local organizations should be funded and
charged with fair housing education and testing efforts as well as periodic review and analysis of
lending data provided by banks and other lenders under the Home Mortgage Disclosure Act.
Publicly praise or otherwise recognize financial institutions with a record of supporting fair housing
initiatives. For County and City financial business, give banks that have not supported fair housing
goals a low priority.
Impediment #7: Difficulties with Fair Housing Compliance from Small-Scale Landlords (St.
Louis County & Florissant)
Some stakeholders interviewed in the course of this analysis noted that acts of housing
discrimination are more prevalent in the study area from small-scale landlords who own or manage
very limited numbers of housing units. Survey results, while quite limited, provide some anecdotal
support for this perspective: of the four respondents who reported having faced housing
discrimination, all of them named a landlord or property manager as the perpetrator of the
discrimination.
208
Recommendations:
As recommended in the 2012 St. Louis County Housing Study, more outreach and training is needed
to educate rental property owners and managers on the requirements of the Fair Housing Act, the
definitions of protected classes, discriminatory practices, and potential consequences for non-
compliance. The St. Louis Apartment Association (SLAA) offers education opportunities and could
play a coordinating role in the outreach and education of small-scale landlords in the study area.
Support for continued testing by EHOC or a similar organization is also recommended, with capacity
for subsequent legal action if necessary.
Impediment #8: Need for Alternative Transportation Options (O’Fallon)
Transportation links are essential components to successful fair housing. The issue at hand
regarding transportation and fair housing choice revolves around the ease with which a resident
can travel from home to work if he or she lives in a lower income area or an area of minority
concentration. Residents who do not have access to commercial areas are limited in where they can
shop for goods and services, as well as seek employment. The reverse is true as well. A lack of
transportation options limits the selection of housing to neighborhoods within walking or biking
distance of employers and disproportionately affects low-income, disabled, and elderly residents.
There is no system of public transportation serving O’Fallon or greater St. Charles County. Public
input received in the process of developing this AI repeatedly cited the lack of transportation
alternatives as an important factor limiting the housing choices of people either living or working
in O’Fallon. It was not uncommon for participants to share the view that, for people without a
personal vehicle, living in O’Fallon simply was not a viable choice.
Recommendations:
The City’s Public Assistance Department should routinely review transportation planning efforts
carried out by other City departments, the regional council of governments, and other planning
bodies for opportunities to advocate public infrastructure improvements that align with the goal of
expanding housing choice.
It is recommended that the City convene a group of service providers, Planning & Development staff,
business leaders, and other local stakeholders to identify top transit needs (e.g. connections to the
City of St. Louis, to St. Louis County, to job centers in general, or simply transit within O’Fallon, etc.),
level of need, and locations of transit dependent populations in O’Fallon. If improved connectivity
with St. Louis is identified as a need, the City is advised to meet with a Metro representative to
determine what role it may play.
Given the size of O’Fallon, a full-scale public transit system is unlikely to be feasible, however there
are intermediate options (such as demand-response systems, vanpools, and transit management
organizations) that could provide needed connections for the City’s residents and workforce. A
209
survey of similarly-sized suburban cities should be conducted to identify successful transit
programs in comparable jurisdictions.
210
Conclusion
Through this Analysis of Impediments to Fair Housing Choice, several barriers have been identified
that restrict the housing choice available to residents of St. Louis County, Florissant, and O’Fallon.
These barriers may prevent residents from realizing their right to fair and equitable treatment
under the law. It is imperative that residents know their rights and that those providing housing or
related services know their responsibilities. St. Louis County, the City of Florissant, and the City of
O’Fallon will work diligently toward achieving fair housing choice for their residents using the
recommendations provided here to address the identified impediments. However, it should be
noted that these impediments are largely systemic and will require effort from both private sector
and public sector actors to correct. Each jurisdiction has an important role to play but cannot on its
own bring about the change necessary to remove these impediments to fair housing choice.
The recommendations proposed in this document address impediments relative to concentrations
of affordable housing, an imbalance between job centers and housing options, restrictive definitions
of “family” and restrictive occupancy permitting requirements, lending discrimination,
discrimination by small-scale landlords, limited accessible housing options, and NIMBYism.
Implementation of the recommendations can assist St. Louis County, Florissant, and O’Fallon in
achieving the reality of an open and inclusive region that truly embraces fair housing choice for all