48
Presented to the Staple Inn Actuarial Society on 2 nd November 1993 ANALYSIS OF LIFE COMPANY FINANCIAL PERFORMANCE by Sue A. Collins and David J. Keeler

Presented to the Staple Inn Actuarial Society
on 2nd November 1993
ANALYSIS OF LIFE COMPANYFINANCIAL PERFORMANCE
by
Sue A. Collins
and
David J. Keeler

Contents
Section Page
1.
2.
3.
4.
5.
Introduction
Analysis of Surplus
Embedded Value Accounting Method
Practical Considerations
Conclusion
1
4
15
24
31
Appendices
A.
B.
C.
D
E.
F.
G.
H
I.
J.
K.
L.
Key Assumptions for Examples
Statutory Results, Actual
Statutory Reserve Development, Actual Results
. Sources of Profit, Statutory Basis, Actual Results
Natural Reserve Development
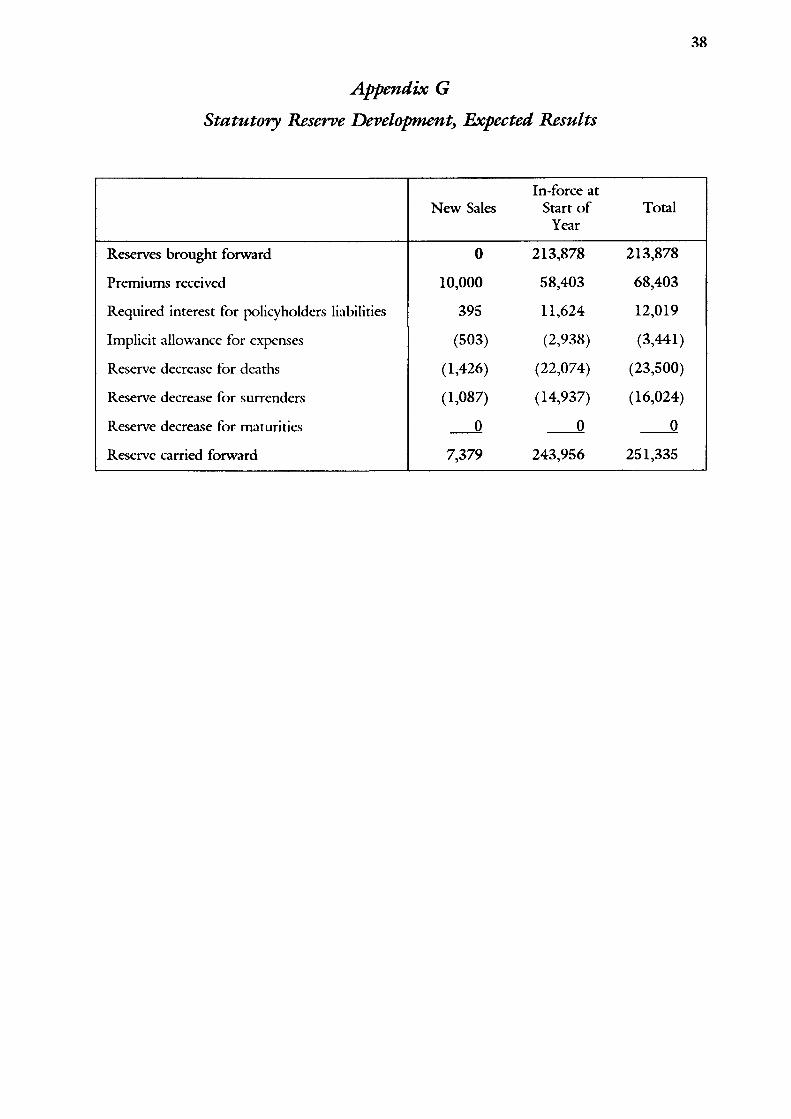
Statutory Results, Expected Results
Statutory Reserve Development, Expected Results
. Sources of Profit, Statutory Basis, Expected Results
Comparison Actual vs Expected, Statutory Gain by Source
Formula for Successive Embedded Values
Values of Business
With-Profit Business
32
33
34
35
36
37
38
39
40
41
43
44

1
Analysis of Life Company Financial Performance
1. Introduction
Measuring the financial performance of a life company, and producing information to highlight the
products, functions or business divisions which are performing well or badly is not an easy task.
Until recently, actuarial techniques and appropriate software to calculate meaningful profits, viewed
from the shareholders' perspective have not existed. It is not surprising, therefore, that the industry
has tended to measure success in terms of measures such as new business sold or assets under
management, and has tended to neglect "bottom line" measures such as the profit margin on new
sales, or the profit from the management of in-force business.
Techniques developed by actuaries for analysing profit (or surplus) have been primarily developed
to support the actuarial valuation, which in turn is better suited to demonstrating solvency than
determining profit. The analyses traditionally produced do not naturally provide the general
management with the information required to manage business for profit maximisation in the same
way as would be considered normal in many other industries.
This paper has two themes. Firstly, it describes how traditional actuarial techniques for analysis
of surplus can be extended and adapted to apply to modern concepts of profit for life assurance
business, such as accruals or embedded value profits. The second theme concerns the presentation
of results and describes some ways in which results can be made more readily accessible by general
management. This is done by concealing a level of detail which generally serves to emphasise the
technical difficulty of the analysis rather than communicating the main messages that the results
indicate.
Control Cycle - Review
It is useful briefly to review some of the key principles in Goford's control cycle (1985). This will
provide a frame of reference from which to take a detailed look at financial analysis.
Goford's control cycle is shown in Figure 1. It envisages that the financial operation of a life office
follows a continuous path which, for a mature office, has no defined starting or finishing point.

2
However, for ease in providing a brief summary of the steps in the cycle, the setting of the
assumptions is assumed to occur first.
Figure 1: The Control Cycle
INITIALASSUMPTIONS
PROFIT TEST
UPDATING OFASSUMPTIONS
MONITORING
MODEL
ANALYSIS OFVALUE
APPRAISALVALUES
Briefly, the cycle consists of the following:
a) first, the initial assumptions are set for each major product of the office and using these, profit
tests are calculated for the same products
b) a projection of the company's business is then constructed on a seriatim basis or alternatively
by building a model of the major product lines.
c) the company's actual results are then analysed to uncover reasons why its value increased or
decreased over the accounting period
d) this analysis then extends to a comparison between the actual and expected results identifying

3
the reasons for any differences, a process referred to by Goford as monitoring.
e) this monitoring process could have several outcomes:
updating assumptions used in the projection to reflect actual experience
initiating management action to achieve consistency between actual and expected results
initiating management action to eliminate or add products, to enter or leave particular
markets or to change distribution strategy.
It is the last three steps shown above, and referred to as Analysis of Surplus, Monitoring and
Updating of Assumptions, that are the subject of the remainder of this paper.
Acknowledgements
We would like to thank Andy Aldridge, Doug Doll and Steve Taylor-Gooby for their helpful
comments in drafting the paper. We also extend a warm appreciation to Mary Bailey, Emil
Huyghebaert and Alexia Karaiskos for their assistance.

4
2. Analysis of Surplus
Introduction
All companies are required to produce statutory accounts on a periodic basis and in a prescribed
format. While fulfilling their primary objective in being concerned with the solvency of an
enterprise, they are not an adequate reflection of the economic value of an organisation and do not
represent a "true and fair" financial picture. However, further analysis of the results, beyond what
is required in the statutory financial statements, can be useful to aid understanding of the key
sources that contribute to statutory profits.
In this section we will briefly outline and present an example of the traditional approach to
analysing statutory surplus, namely an analysis of the gains by source measured against the
statutory reserve basis. An alternative approach to analysing the increase in surplus will also be
presented. Under this approach, sources of profit are measured against the pricing basis as opposed
to the statutory basis. Lastly, a comparison of actual to expected results will be presented.
These analyses will then be used in subsequent sections of the paper to support analyses of results
in a format that can be readily understood by the general management of a life office.
Traditional Analysis of Surplus
Table 1 contains a presentation of a company's pre-tax annual results on a statutory basis. The
office is assumed to write only non-profit life policies in the example provided. Key assumptions
regarding the examples used in this paper are given in Appendix A.

5
Table 1: Annual Statutory Results
£
Reserves brought forward
Premiums received
Interest and gains received
Expenses incurred and commissions paid
Death claims paid
Surrender values paid
Amounts paid on maturity
Reserves carried forward
Profit during year
213,878
68,403
22,765
(20,881)
(16,912)
(15,140)
0
247,133
4,980
From this presentation the source of statutory profits remains unclear and there are a number of
questions unanswered, for example:
• What was the contribution from new sales?
• Were actual expenses lower than those anticipated?
• Was the investment return higher than expected?
• Did surrenders make a positive contribution to profits?
• Were death claims higher or lower than expected?
• What was the impact of the reserving basis on profits?
One can answer these questions by referring to the basis and methodology used to calculate
mathematical reserves. This is the traditional actuarial analysis of surplus. Its major purpose is to
provide a check on the valuation data and the valuation process; accordingly, it has an inward focus
of supporting the valuation actuary. The value of such an analysis to the general management of
the company is limited, as the sources of profit are typically related to conservative (or artificial)
assumptions regarding future experience.
6
For completeness we have included an example of such an analysis in Table 3. In order to see how
the sources of profit are derived from the results in Table 1, it is necessary to analyse the increase
in mathematical reserves into its component pieces.
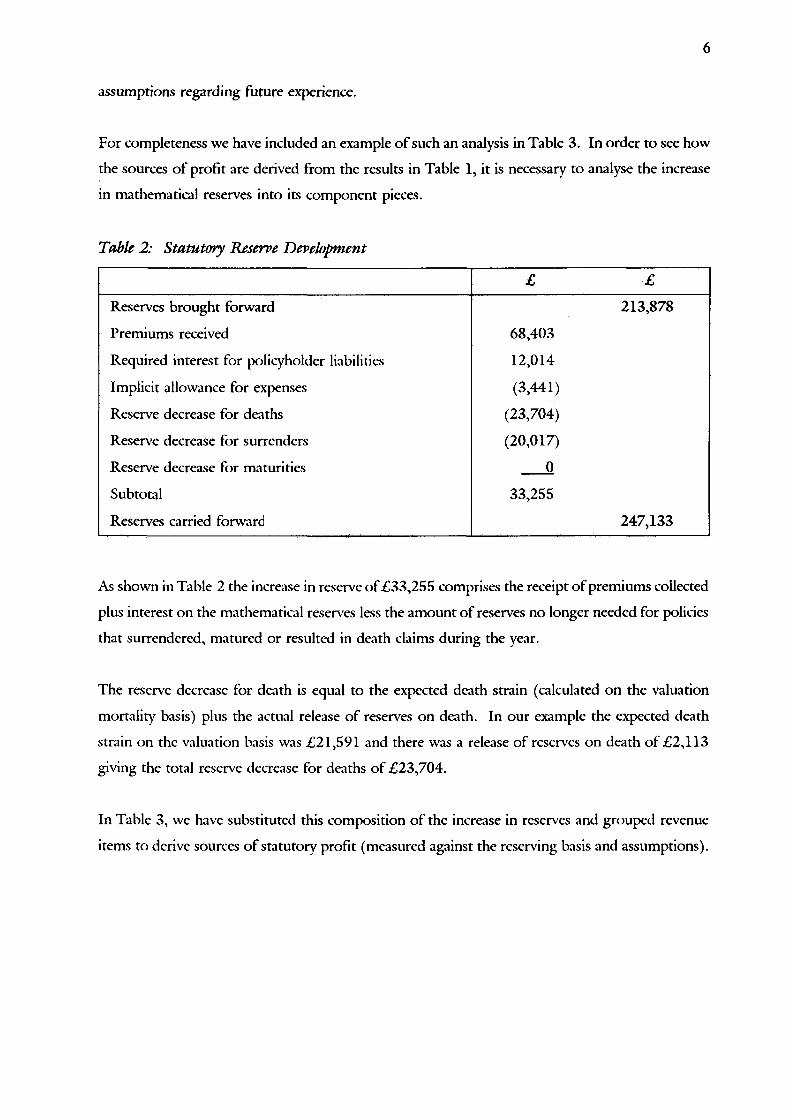
Table 2: Statutory Reserve Development
£ £
Reserves brought forward
Premiums received
Required interest for policyholder liabilities
Implicit allowance for expenses
Reserve decrease for deaths
Reserve decrease for surrenders
Reserve decrease for maturities
Subtotal
Reserves carried forward
68,403
12,014
(3,441)
(23,704)
(20,017)
0
33,255
213,878
247,133
As shown in Table 2 the increase in reserve of £33,255 comprises the receipt of premiums collected
plus interest on the mathematical reserves less the amount of reserves no longer needed for policies
that surrendered, matured or resulted in death claims during the year.
The reserve decrease for death is equal to the expected death strain (calculated on the valuation
mortality basis) plus the actual release of reserves on death. In our example the expected death
strain on the valuation basis was £21,591 and there was a release of reserves on death of £2,113
giving the total reserve decrease for deaths of £23,704.
In Table 3, we have substituted this composition of the increase in reserves and grouped revenue
items to derive sources of statutory profit (measured against the reserving basis and assumptions).

7
Table 3: Sources of Profit, Statutory Basis
£ £
a. Gain from interest:Interest and gains receivedRequired interest for policyholder liabilities
b. Gain from loadings:Valuation basis loadings in premium ratesExpenses incurred and commissions paid
c. Gain from mortality:Reserve decreases for deathsDeath claims paid
d. Gain from surrender:Reserve decreases for surrendersSurrender values paid
e. Profit during year
22,765(12.014)
3,441(20.881)
23,704(16.912)
20,017(15.140)
10,751
(17,440)
6,792
4,877
4,980
In a traditional analysis of surplus, it would be normal to respread some of the gain from interest to the gains from mortality and
surrender to reflect their impact on interest earned on cash flows.
The analysis shown in Table 3 tells a familiar story:
• The company made a significant profit from excess investment return (over the valuation rate
of interest).
• Owing to the conservatism in the statutory valuation basis, there is only a small difference
between the valuation premium and the gross premium. This is the loading available to cover
expenses and commissions.
• The significant mortality profit demonstrates that the mortality assumption underlying the
valuation basis is considerably in excess of the office's actual experience.
• The company makes a profit on surrender, as cash values paid are lower than the statutory
reserve.

8
The analysis would normally be carried out separately for business in-force at the start of the year
and for new sales made during the year. Naturally, this requires the availability of revenue account
and valuation reserve information in suitable form. This is shown in Table 4 and provides
interesting additional information on the cost of putting business on the books on a statutory basis.
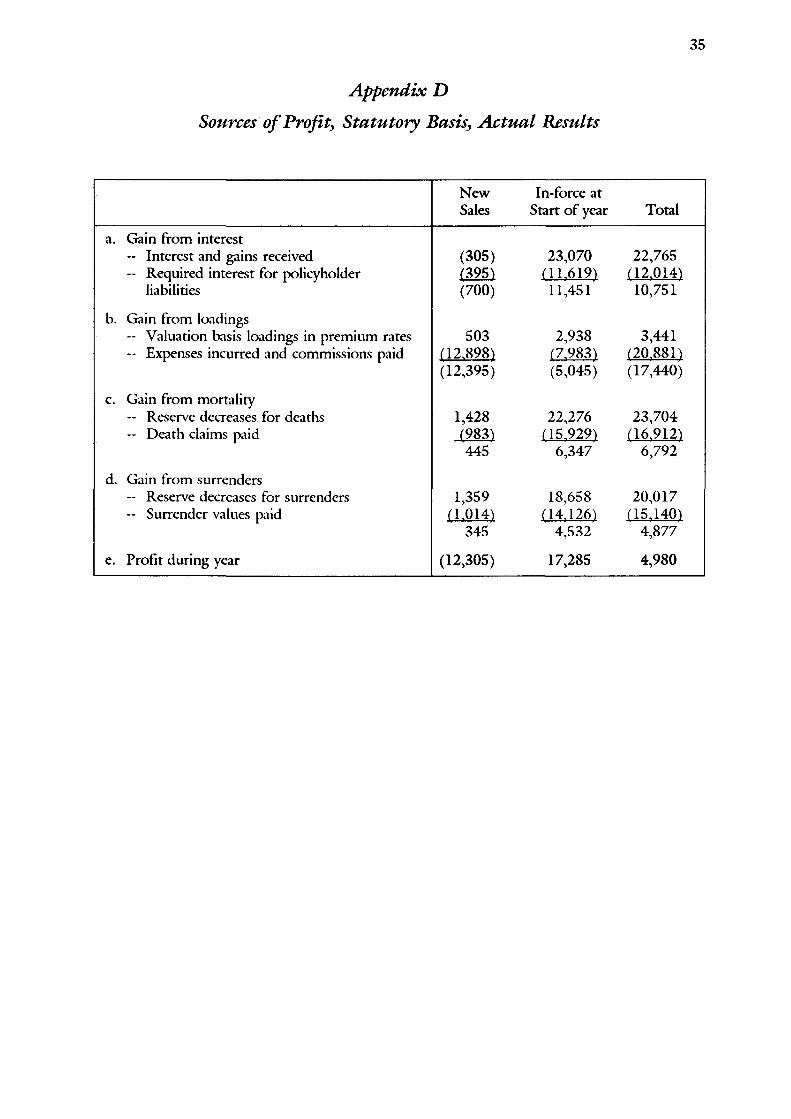
Appendices B, C and D provide more detail on the results presented in Table 4.
Table 4: Sources of Profit, Statutory Basis
In-rorce atNew Sales Start of Year Total
£ £ £
a.
b.
c.
d.
e.
Gain from interest
Gain from loadings
Gain from mortality
Gain from surrender
Profit during year
(700)
(12,395)
445
345
(12,305)
11,451
(5,045)
6,347
4.532
17,285
10,751
(17,440)
6,792
4.877
4,980
The analyses presented in Tables 3 and 4 are not especially useful to the general management of
a life office since they do not provide any information regarding the company's actual experience
against the assumptions made when the products were priced or the assumptions used in the
current business plan. This analysis does not provide information on the following:
• the difference between the expenses the company expected to incur and the actual expenses,
ie the "real" gain from expenses
• the amounts the office realistically expected to earn in mortality and surrender profits.
• the profit margin assumed when the products were priced.
In summary, the gains shown in Tables 3 and 4 are measured against an artificial basis and do not
tell the real story of the office's financial performance.
Alternative Analyses of Surplus
It is reasonable for management to ask how actual profits compare with those expected on the

9
pricing basis or with those expected in the business plan. The analyses presented in Tables 3 and
4 do not address this question, but can readily be modified to do so.
- comparison with pricing basis
A source of profit analysis carried out against the pricing basis will show additional items such as
the gain from profit loading and the impact of the reserving basis. Thus, from an analysis against
the pricing basis, we may expect to see:
a. Gain from interest.
b. Gain from expenses.
c. Gain from mortality.
d. Gain from surrender.
e. Impact of reserving basis.
f. Gain from profit loading.
In this analysis
i) the gain from interest is obtained by comparing the investment return actually earned against
the expected income calculated by applying the pricing basis interest rate to policyholder
liabilities and cashflows.
ii) the expected death strain is calculated using the pricing mortality basis rather than the
valuation mortality basis.
iii) the expected surrender profit will need to be calculated as it is likely that the pricing basis will
anticipate a certain level of surrenders.
iv) the gain from profit loading is the annual profit contribution expected when the product was
priced, adjusted for differences between actual experience and that anticipated in pricing.
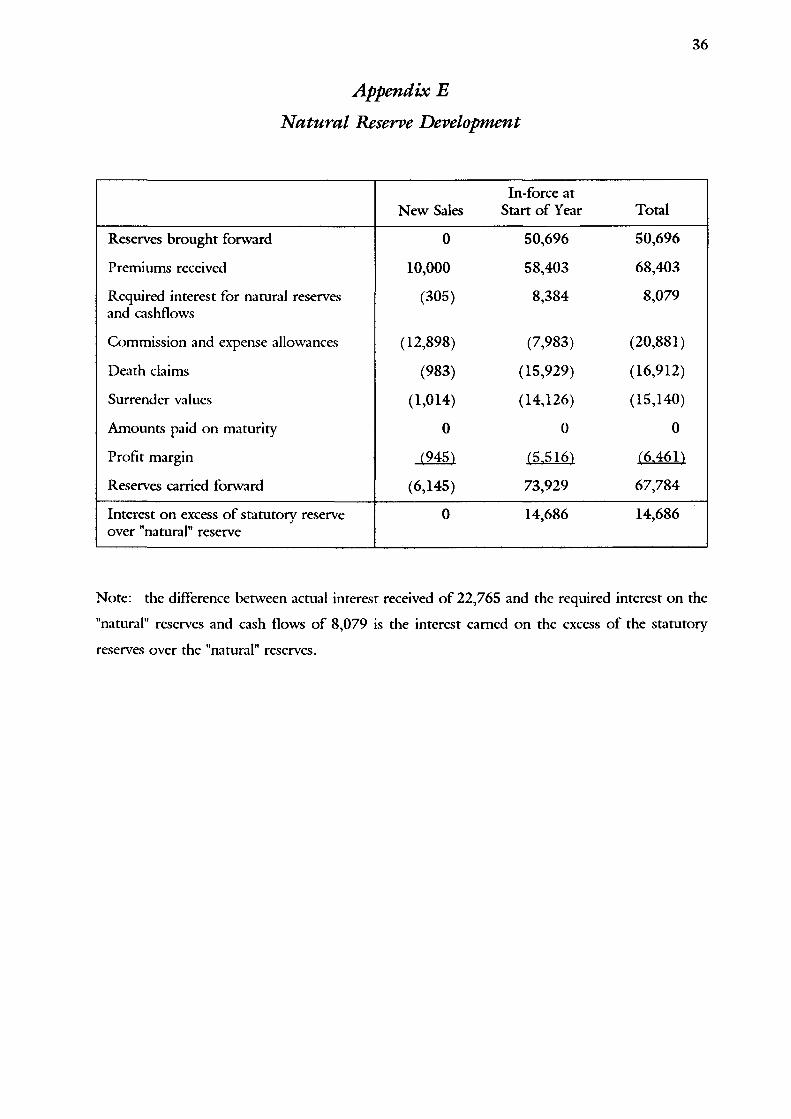
In order to quantify the impact of the reserving basis we introduce the concept of the "natural"
valuation basis. The reserve (or Fund) obtained on the "natural" valuation basis is obtained by
accumulating premiums received after deducting expected outgo (commission, expenses, surrender

10
payments, death claims) using the pricing interest rate. Alternatively, reserves can be calculated on
a prospective basis using pricing assumptions and allowing for all future claims, expenses and profit
loadings. There is a question as to how to allow for the emergence of the profit loading. In our
example, we have allowed the profit loading to emerge as a constant proportion of premium. The
impact of the reserving basis would be equal to the sum of two items,
• the increase in reserve on the "natural" valuation basis less the increase in reserve on the
statutory valuation basis.
• interest (at the pricing rate) on the excess of statutory reserves over the "natural" reserves.
In order to illustrate the impact of the reserve basis we have made a simplifying assumption that
investment returns, mortality and surrender rates, and expense levels are consistent with the pricing
basis. The results are given in Table 5.
Table 5: Illustration of Impact of Reserve Basis
In-force atNew Sales Start of Year Total
£ £ £
Impact of reserve basis
Gain from profit loading
Statutory profit during year
(13,250) 11,769 (1,481)
945 5.516 6.461
(12,305) 17,285 4,980
The analysis of profit given in Table 5 highlights the impact of the reserve basis on the emergence
of statutory profit. The separation of the contributions from business in-force at the start of the
year and the contribution from new sales, demonstrates the "new business strain" incurred at policy
issue which is repaid over the lifetime of the contract. In this type of analysis the influence of the
reserving basis on profit is separated from the differences in actual experience compared with the
assumptions assumed in the pricing basis.
In our example, however, since actual experience is assumed to be the same as that assumed in the
pricing basis, there are no contributions to profit from investment return, mortality, surrenders or
expenses.

11
The message presented in Table 5 is very different from that presented in Table 4. The actual
revenue account is the same one, but the presentations address very different questions.
- comparison with the business plan forecast
Most companies prepare business plans for the year. A natural part of the process at the end of
the year is to explain how actual results compare with those forecast by the business plan. Over
time, the assumptions used in the pricing basis may no longer represent management's view of
likely future experience. One would, therefore, wish to quantify sources of profit measured against
the experience assumptions used in the business plan.
As new sales are unlikely to be consistent with the business plan, the first stage in the process
would be to recalculate the plan using actual sales. Thereafter it would be possible to compare
actual and expected sources of profit. An example of such a comparison is contained in Table 6.
In this constructed example experience is as follows:
Interest rate
Expenses
Mortality rates
Surrender rates
as expected
as expected
111% of expected
125% of expected
Table 6: Statutory Sources of Profits: A Comparison of Actual vs Expected Results (per BusinessPlan)
In-force atNew Sales (£) Start of Year (£) Total (£)
a. Gain from interest
b. Gain from expenses
c. Gain from mortality
d. Gain from surrender
e. Subtotal
f. Planned profit
g. Statutory profit during year
(4) (67) (71)
0 0 0
(96) (1,391) (1,487)
69 904 973
(31) (554) (585)
(12.274) 17.839 5.565
(12,305) 17,285 4,980

12
The gain from interest can be the result either of a variance in the actual earned investment return
(expressed as a proportion of invested assets), or of a variance in the average amount of invested
assets during the year. We refer to the contribution from any variance in the rate of investment
return as a "rate variance" and we refer to the contribution from a variance in the average amount
of invested assets as a "volume variance".
In Table 6 the variance in interest is a volume variance entirely due to the effect of increased death
claims on interest income, since, in the examples used, the earned rate of interest and the valuation
interest rates are the same as forecast. This is confirmed in Table 7 in respect of business in-force
at the start of the year. Further details regarding the forecast business plan results are contained
in Appendices F, G, H and I.
Table 7: Derivation of Rate and Volume Variance of Gain from Interest on Business In-forceat Start of Tear
Asset Base Interest Rate InterestIncome
Volume Variance Analysis
Expected results-- Interest income received-- Required interest-- Interest profit
Expected results (adjusted for asset base)— Interest income received-- Required interest- Interest profit
Volume variance
257,130258,306
9.0%4.5%
23,14211.62411,518
256,336258,205
9.0%4.5%
23,07011.61911,451
(67)
256,336
256,336
9.0%
9.0%
0.0%
23.070
0
23,070Expected results (adjusted for asset base)-- Interest income received
Actual results~ Interest income received
Rate variance
In the business plan, the company forecast interest income of 23,142 being an investment return of 9% on average invested assets of257,130 (the reserves brought forward plus office premiums less expenses less 50% of death claims taken from the In-force at Start ofYear column of Appendix F); of this interest income some 11,624 was required to support the statutory reserve development being 4.5%of average reserves of 258,306 (the reserves brought forward plus office premiums less loadings less 50% of reserve decreases for deathstaken from the In-force at Start of Year column of Appendix G). In practice average invested assets were 256,336 (from Appendix B)and average reserves were 258,205 (from Appendix C).

13
In our example, the interest volume variance is caused by a difference in mortality rates, since
deaths are assumed to occur evenly throughout the year and surrenders are assumed to occur at
the end of the year. Table 8 is a restatement of Table 6 after reallocating volume variances to the
appropriate cause but retaining interest rate variances (which in this example are zero) under "gain
from interest".
Table 8: Sources of Profit: Expected Basis After Adjusting for Rate and Volume Variances
In-force atNew Sales Start of Year Total
£ £ £
a. Gain from interest
b. Gain from expenses
c. Gain from mortality
d. Gain from surrender
e. Subtotal
f. Planned statutory profit
g. Actual statutory profit
0
0
(100)
69
(31)
(12274)
(12,305)
0
0
(1,458)
904
(554)
17.839
17,285
0
0
(1,558)
973
(585)
5.565
4,980
A similar analysis into a rate variance and a volume variance can be carried out on the gain from
mortality and gain from surrenders. For example, the gain from surrenders may arise from higher
rates of surrender, or from surrender values paid out being a lower proportion of statutory reserves
than expected (or modelled). It may be difficult to capture the necessary statistical and accounting
data to perform this analysis, but if this can be done the results can be very useful in identifying
consistent differences between actual and expected surrender payments.
Summary
In this section we have described three different means of analysing statutory profit, each designed
to address a different set of questions.
The traditional analysis of surplus provides a check on the valuation data and the valuation process.
An analysis against the premium basis allows an explanation of how actual profits compare with
those expected on the pricing basis - albeit in respect of that particular year. Finally, an analysis

14
against the experience assumptions underlying the business plan explains how actual profits differ
from those forecast in the business plan.
However, even though these analysis provide a detailed look at the current year's statutory results
compared with the pricing basis and with the results that management expected, they are deficient
since they do not provide any insight on whether new business written during the year meets profit
targets, or whether the value of the total company is increasing or decreasing. They capture the
financial operations of a life policy over a single period and no insight is gained about the profits
that a set of contracts is expected to generate over its entire lifetime.
For example, the results in Table 8 show a higher contribution to statutory profit than was
expected because surrenders were higher than expected. Generally, however, higher surrenders will
result in lower future profits to an office although this is not apparent from the analyses provided.
In the next section an alternative accounting method will be described. Use will be made of the
analyses in this section to understand the annual "profit" achieved under this alternative accounting
method.

15
3. Embedded Value Accounting Method
Overview
In recent years many UK companies have adopted alternative accounting methods, such as
embedded value and accruals basis accounting, to overcome flaws perceived in statutory accounting.
Statutory accounting, with its primary objective focused on solvency of life offices, was not felt to
provide a realistic view of the operation of a life office. The purpose of the remainder of this paper
is not to debate the merits of either of the alternative methods but to provide some useful insight
and approaches into analysing the change in the embedded value (or shareholders' accrued interest)
between the beginning and the end of the year. As will be shown, the process of analysing the
change in embedded value over the year automatically results in the identification of the differences
between actual and expected results.
The primary focus will be related to the embedded value accounting method, but the principles and
approaches, with slight adjustments, are transferable to the accruals basis.
For the purpose of this paper the embedded value of a life office, at a particular valuation date, is
taken to be the sum of the shareholders' net assets and the value of the business in-force at the
valuation date. The value of in-force business at the valuation date is the present value of future
profits expected to emerge from policies already written. The value of business written after the
valuation date is not included in this definition.
Companies which calculate embedded values generally have methods and techniques in place that
will generate the value of business in-force at the valuation date. This is then added to the
shareholders' net assets to arrive at the embedded value. Methods or techniques that will assist the
company in understanding the change in embedded value over the year are less formalised and, in
many cases, absent - in spite of the useful information that can be gained from this process.

16
Embedded Value Formula
As a first step it is useful to document a formula that can be used to derive consecutive embedded
values. A simplified version of the formula is set out below; a more detailed formula is given in
Appendix J.
Embedded value at the beginning of the year
+ Interest on shareholders' net assets
+ Contribution from in-force business
+ Contribution from new business
+ Change of basis
+/- Capital adjustments
= Embedded value at the end of the year
A brief explanation of each of the above items follows. The impact of a possible change of basis
is discussed under the contribution from in-force business item.
Interest on Shareholders' Net Assets
Interest on shareholders' net assets is the after-tax investment return earned by the assets that
support shareholders' net assets. It is not unusual for this rate of return to be substantially below
the return earned on assets supporting insurance liabilities because of asset allocation techniques
used by companies. It is common to assign non-interest-bearing assets or lower-yielding assets to
support shareholders' net assets and to allow the higher-yielding assets to back policyholder
liabilities.
Contribution from In-force Business
The contribution from in-force business can be separated into several parts:
a) the planned return on the value of in-force business at the beginning of the year;
b) the difference between
statutory profits earned during the year
and
those anticipated from the beginning of year embedded value calculation;

17
c) the difference between
the value at the end of the year of business which was in-force at the start of the year
(and is still in-force at the end of the year).
and
the expected value of in-force business at the end of the current year as anticipated from
the beginning of year embedded value calculations.
Item a), the planned return on the value of in-force business at the beginning of the year is the
amount resulting from applying the risk rate of return to the value of in-force business brought
forward.
For item b) above, the analysis process is the same as that for the statutory profits described in the
preceding section, where the analysis is performed against the basis used in the calculation of the
embedded value at the beginning of the year; in our example, we have calculated the embedded
values using the business plan assumptions regarding future experience. To gain maximum
information, the analysis should separate the current year's actual and expected profits into
individual sources of profit: eg, investment return, mortality, surrender and expense. In conducting
this analysis a company can readily see the factors that influence the year-by-year profits earned on
its business, and whether the contribution from any of the factors is materially different than
expected.
There is likely to be a contribution under item c) to the extent that the volume and mix of business
still in-force at the end of the year differs from the expected volume, owing to variations in actual
mortality and lapse experience during the year. The other contribution to item c) is the impact of
any changes in assumptions regarding future experience which may have been made in calculating
the value of in-force business at the end of the year.
If changes in assumptions regarding future experience are made, care needs to be taken that these
do not hinder the investigation of the impact of variances in experience during the year. The
impact of the changes in assumptions regarding future experience could either be calculated at the
start of the year by recalculating the opening value, or by calculating the value of in-force business
at the end of the year on two bases.
The decision as to which approach to use is likely to be practical ease of calculation. However, if

18
the intention is to compare actual performance with expected performance, then it is more
appropriate to calculate the effect of the change of basis on the closing value of in-force business.
In this case, the value of in-force business at the end of the year should be calculated using the
same assumptions as were used to calculate the equivalent value at the start of the year. This allows
the investigation of the impact of variations in experience during the year on the value of in-force
business at the end of the year to be quantified. Secondly, the impact of each change in
assumption regarding future experience is separately calculated by making one change at a time and
recording the impact on the value of in-force business until each change has been made.
The order in which the changes are made will make a difference to the results. In presenting the
results of changes in assumptions regarding future experience, one may wish to present the total
impact as one number. Alternatively, a change in assumptions relating to future expense levels may
reflect the company's operating experience, and should perhaps be separated from changes to future
investment returns (and the risk rate of return) which reflect changes in the company's operating
environment.
The assumptions used to calculate the value of in-force business could change for many reasons,
for example, to reflect higher or lower maintenance expense levels, to reflect changes in outlook
regarding investment returns, to reflect changes in mortality levels or changes in corporate tax rates
or rules.
Contribution from New Business
The contribution from new business has several components, which are similar to those described
for the in-force contribution. The components are:
a) the value of new business at the point of sale, plus the risk rate of return earned on this value
between the point of sale and the end of the year.
b) the difference between
statutory profits earned during the year
and
those anticipated in the projection of new business;

19
c) the difference between
the value of the new business still in-force at the end of the year
and
the expected value of the new business that was expected to remain in-force at the end
of the year
The value of business issued during the year first enters the embedded value through the
contribution from new business. Since, in our example, sales of new business are assumed to take
place at the beginning of the year, it is appropriate to include the planned return on this value as
part of the contribution from new business. The planned return is calculated in the same manner
as the planned return on the value of business in-force at the start of the year; it is the risk rate of
return multiplied by the value of new business.
The descriptions of items b) and c) for new business are analogous to the corresponding
descriptions for the contribution from in-force.
The impact of actual volumes of new business differing from those included in the business plan
should be calculated by producing a revised business plan using them, followed by the above
analysis. In this way any variances that emerge relate to differences between actual and expected
experience on the same business, and not to differences caused by varying amounts of production.
Similarly, to the extent that an office's product pricing or experience varies by distribution channel,
values can be calculated and results analysed by distribution channel in order to gain maximum
insight into the financial mechanics of the business.
Capital Adjustments
A final adjustment is necessary to reflect cashflows in and out of the company during the period -
that is to say the payments of dividends to shareholders or any capital contributions made to the
company during the year. The timing and amount of the transfers can influence whether or not
an interest adjustment is appropriate on them. In the example provided it has been assumed that
no new capital has been contributed during the year and that there is a dividend payment of
£8,000 at the end of the year.

20
Presenting and Understanding Results
Assuming a company has sufficient records to track all the information necessary to complete the
analysis of in-force and new business envisaged above, a presentation of results similar to that
shown in Tables 9 and 10 can be prepared. The results are based on the actual and expected results
given in the previous section. For completeness, information regarding the actual and expected
values of the business are given in Appendix K.
Table 9: Illustrative Movement in Embedded Value (£)
Shareholders Value or Total EmbeddedNet Assets In-force Value
Embedded value brought forward
+ Investment return on shareholders' net assets+ Contribution from in-force business:
planned return on value of in-forceexpected profits during yearvariance between actual and expectedexperience during yearimpact of changes in assumptionsregarding future experience on value ofin-force business carried forward
+ Contribution from new business:value of new business at point of saleplanned return on value of new businessexpected profits during yearvariance between actual and expectedexperience during yearimpact of changes in assumptionsregarding future experience on value ofbusiness carried forward
10,000 172,383 182,383
500 500
18,962 18,962
17,839 (17,839) n/a
(554) (2,916) (3,470)
2,731 2,731300 300
(12,274) 12,274 n/a
(31) (566) (597)
Subtotal+ Capital adjustments
Embedded value carried forward
15,480 185,329 200,809(8,000)7,480 185.329
(8,000)
192,809
Table 9 contains a presentation of the movement in embedded values from the beginning to the
end of the year. The presentation corresponds to the formula presented in Appendix J. From a
presentation point of view, one could simplify the table by dropping the first two columns. The
Embedded Value has increased from £182,383 to £200,809 before payment of the dividend. This
represents a rate of return of 10.1% on the opening value.

21
From this analysis some key financial data can be obtained:
• The extent to which actual results over the year differed from those that were expected,
including a comparison of the actual and expected profits during the year as well as a
comparison of the actual and expected value of the in-force business at the end of the year
• The value added by new sales during the year
• The individual contributions to shareholders' net assets and to the value of in-force business
over the year.
This analysis, however, does not provide any insight into the particular areas where actual results
differed from those that were expected. To get this insight, the variances must be analysed into
the form given in Table 10.
Table 10: Variance Analysis (£)
Source of variance Impact on Profit Impact on Value ofDuring Year In-force Business Total
In-force business at beginning ofyear:
Variances arising during year— interest-- expense-- mortality-- surrender
New business:
Variances arising during year— interest— expense— mortality— surrender
Change in assumptions regardingfuture experience:— risk rate of return— interest— expense— mortality— surrender
00
(1,458)904
(80)(2,836)
00
(1,538)(1,932)
00
(100)69
0(566)
00
(100)(497)

22
From Table 10 the sources of the variances between actual and expected results, on both the
current year's profits and the year-end values of in-force business, are given. The sources of
variance on profit during the year are the same as shown in Table 8. The variances in the end of
year values were estimated from the projections used. In the examples used, no changes to
assumptions were made before calculating the final year-end values.
These two presentations provide management with the tools necessary to understand the key
financial factors affecting profitability and value of the business, and to understand where current
experience differs from that which was expected. The following information is apparent from the
analysis.
• Actual mortality and lapse experience during the year was worse than expected. Investment
returns and expenses were as expected
• The deterioration in mortality reduced statutory profits for the year and reduced the value of
the business overall
• The deterioration in lapses resulted in higher current earnings but overall has reduced the value
of the business.
If one wanted to focus on key information for management, it is likely that Table 10 would only
be shown with the one column headed "total".
Until now, the analysis presented has been fairly mechanical. The areas where actual results differ
from those that were expected are known, but the reasons for such variance are not. The process
now enters a discovery and documentation phase. During this, the reasons for the difference
between actual and expected results are researched. The discovery process could expose one or
more of the following:
• Economic or actuarial assumptions that are conservative or optimistic
• Previous undiscovered errors in the company's administrative, accounting or investment
systems

23
• Previous undiscovered errors in the methodology or systems used to calculate the values of
in-force and new business
• Identification of areas where actual transactions differ from stated company practice
(possibilities include payment of policyholder benefits or refunding of policy premiums and
agent commissions)
• Identification of areas of good or bad performance (for example, poor underwriting, or profits
and losses arising from mismatched investments).
The analysis becomes more meaningful according to the extent that a company completes this
analysis for each major operating division and for major products within each division. It can offer
insights as to which products are profitable, which products need to be repriced or areas from
which the office may wish to withdraw, enabling company management to take appropriate action.
Finally, if trends are observed over a period of time, this process can indicate required revisions in
pricing or embedded value assumptions.
24
4. Practical Considerations
The process of calculating and analysing the change in embedded value is complex and can be time
consuming. Although as shown in Appendix J the formulae produce a consistent picture, the order
of calculation in practice is such that the balance sheet numbers - that is the opening and closing
embedded values - are usually calculated first. The difference between actual and expected profit,
in total, is generally readily available, but the split between business issued during the year and
business in-force at the start of the year may be more difficult to obtain if the company's systems
do not support this analysis. Similarly, some of the other elements in the movement during the
year may need to be calculated on an approximate basis, at least initially. Over time the objective
should be for accounting systems to support the analysis.
This section opens with some remarks on our simplified example. The remainder then summarises
some practical considerations that may arise in performing the calculations and analyses.
Extension of Simplified Example
The example used in Sections 2 and 3 to illustrate the points made is a simple one, where only
conventional non-profit business is written. If the example included unit-linked business or
with-profit business then typically the same factors would affect results but the underlying
calculations may differ.
For unit-linked business the key items of company income to be monitored are
• the amount of annual management charges deducted from the linked funds
• the expense deductions made from the linked funds
• the amount of premiums collected not invested in linked funds
• the deductions made from the linked funds to cover mortality and morbidity risks
• the deductions made from the linked funds to cover the company's liability to tax
• the amount of surrender penalties levied on surrendering policies.
Each of these key items of income would need to be related to expected income according to the
business plan.

25
The variance analysis may be affected by the impact of changes in the statutory valuation basis.
This naturally affects the profit reported during the year, but it will also affect the value of in-force
business.
The proposed format of the presentations given in Tables 9 and 10 are still appropriate, but one
would expect several of the above items to appear in Table 10 under the variance analysis.
For with-profit business, the value of in-force business will be the sum of the value of future
shareholders' transfers generated by future bonus declarations, and the value of the shareholders'
interest in the balance of the long term fund. As the first item is dependent on the cost of future
bonus declarations, one factor appearing in the analysis of results may be the impact of the actual
bonus declaration. It is suggested that a separate analysis of variance is carried out on the value
of future shareholder transfers and the value of shareholders' interests in the balance of the long
term fund. This will make it simpler to calculate and verify. Examples of Tables 9 and 10 for
with-profit business are contained in Appendix L.
Complications
There are a number of potential complications which affect the calculations or the analysis of the
movement in embedded value. These can affect the opening or closing embedded values or affect
values at some stage during the year. Depending on the nature of these changes and their impact
on the results, it may be useful to restate the value of in-force business brought forward in order
to make the analysis more meaningful.
The reasons which can cause a revision to the opening value include:
• Prior year adjustments in an accounting sense (eg the impact of a settlement of tax
computations with the Inland Revenue)
• Changes in methodology (eg, introduction of an allowance for the need to maintain solvency
margins)
• Changes to the software used

26
• Changes to the model of the business (if a model is used to perform the calculations).
Mid-year complications may include:
• Repricing of existing contracts (eg, changes to annual management charges, or policy fees)
• Changes in the tax law
• Changes in commission structures
• Capital adjustments, eg, dividends paid out or new capital put in
• Acquisition or disposal of blocks of business.
A number of changes can be made which affect closing embedded values. These include alterations
in assumptions relating to future experience and changes to the risk discount rate. Generally, these
are not troublesome since they are made after the analyses for the year have been completed.
When changes are made, regardless of their timing, it is important for their impact to be quantified
so that their contribution to the change in embedded value can be separately identified from the
other sources of profit. In practice, this requires that, for each change, the value of in-force
business is calculated with and without the change at the date on which the change becomes
effective. The size of the change's effect should, of course, be checked for general reasonableness.
In certain circumstances, it may be possible to estimate the impact of the change, rather than carry
out detailed calculations.
Data Collection
The difficulty in gathering the information necessary to support the analyses developed in
Sections 2 and 3 will depend on a variety of factors, eg:
• The separate business segments within which the company desires to monitor its operations,
eg, individual life, individual pensions, group pensions, disability

27
• The product line splits that may be made within each business segment
• Accounting treatment of subsidiaries, eg, are they charged with their full actual expenses or
some other amount and, if so, the accounting treatment of the difference
• The company's accounting systems and its ability to produce the required information and,
most importantly, the availability of this information analysed between the desired business
segments
• The sophistication and composition of the in-force and new business models.
Certain information on actual company results is likely to be readily available by business segment
and by product within that segment, eg, premiums received, commissions, and change in statutory
reserve. Other information will be more difficult to allocate, eg, expenses, policy benefits, tax. For
unit-linked companies, required information may include the separation of claim payments into the
linked fund component and the non-linked balance (which is necessary for a comparison of
mortality experience) or the amount of premiums received not invested in units. Additionally, the
split of actual results between items attributed to business issued during the year and business in-
force at the start of the year will be easy for some items and difficult for others.
Some companies allocate expenses to operating lines of business on a marginal basis and fixed or
overhead costs are retained in a "corporate" line of business. Such companies manage their
operating lines of business on a contribution to overhead basis. An embedded value is calculated
for the corporate line of business as well as for the operating lines of business. This approach
works well in catering for temporary expense overruns.
Other areas where use may be made of a corporate line of business in the analysis of results include
the treatment of taxation and the effect of an active investment policy. In respect of taxation, the
analysis of results for the operating lines of business are calculated using notional tax rates
applicable to that line of business and the difference between the company's actual tax liability and
the tax liabilities included in the operating lines of business is the amount of tax (or tax saving)
attributed to the corporate line of business.
Some companies analyse the gain from interest into the contribution from investment policy and

28
the contribution from the active management of the portfolio within the guidelines set by that
policy. This separation may be particularly relevant where investment management is treated as
a separate profit centre within the company or group.
In the early years of conducting these analyses, it is unlikely that the company will be able to split
all revenue account items that it wishes to allocate to business units on an actual basis, and the
splits will need to be estimated. However, as time goes by, it is useful to work towards a plan
whereby the company's administrative and financial systems produce the information necessary to
conduct the analysis in the required level of detail.
As far as the projection of the new and in-force business is concerned, the split of the in-force
business into segments, and by product within those segments, should be relatively easy - assuming
the company's administrative systems support this data. An area that may present difficulties,
however, is the composition of the statutory change in reserves. If the software system used does
not supply this information, estimates can be used. Such estimates can be derived from the
underlying profit tests, a sample of the in-force and new business and an understanding of the
statutory reserve basis. However, a better way is to revise the output to include information either
on the statutory composition of the reserve increase or on the gains by source directly.
Level of Detail and Consistency with Other Internal Reports
Judging the level of detail in which to perform or present the analysis is a key issue. In order to
address this issue one must look to the reasons why such analyses are carried out and the role such
analyses play in communicating the financial progress of the company to senior management. The
level of detail in a given presentation will depend on the audience, but the level of detail underlying
the analyses will depend more on the use to which they are put.
If a life office desires to monitor its performance on an embedded value basis (using either pricing
assumptions or current expected assumptions), the analyses should be consistent with the way the
office monitors its financial condition - eg, if an office reviews results by major business unit
(ordinary life, pension, disability) and by major product line within each unit (eg, non-profit and
unit-linked), an embedded value analysis should be completed for each subdivision. Similarly, if
an office monitors its performance by distribution channel, this distinction should also be
incorporated into the embedded value analyses.

29
If the company uses embedded values and associated analyses to monitor its financial performance,
as opposed to calculating an estimate of its economic value, the level of detail underlying the
projections should necessarily be greater and will vary according to the diversity of the company's
portfolio. Generally, there should be sufficient detail that the projection can be judged to be a
reasonable representation of the company's business, ie it is consistent with historic trends (unless
there are valid reasons why it should differ).
Senior management and the Board will receive various reports on the financial progress of the
company, such as the Appointed Actuary's report, financial projections and business plans, and a
product pricing report. Each of these will be written for a different purpose and may relate to
either current or expected experience of the company. The reports may well be generated by
combining the office's in-force and forecast levels of new business, with an expected set of future
assumptions which could well be different for each report. As one can imagine, it can be quite a
challenge for the reports' authors to produce coherent documents that complement each other and
which are internally consistent. The potential for confusion is great. Nevertheless, in an ideal
situation, they should be consistent and, if not, the differences readily identifiable and
understandable.
Frequency of Analysis
For most offices sufficient information to complete these analyses will be available at the end of
the financial year, so that a detailed analysis of profit by source can be carried out. At other times
during the year, the ability to carry out such a detailed investigation will depend on the availability
of data from the management information systems. For most companies, some of the necessary
information will need to be estimated if interim analyses are carried out. In order to avoid
surprises, companies will generally want to complete the analyses, on at least an approximate basis,
on the half yearly results.
Use of Estimates
Many companies will not capture all the relevant data necessary to complete the analyses so, if it
does not exist, how worthwhile is it to use estimates? As previously stated, it is likely that certain
revenue account and balance sheet data will need to be estimated (at least in the early years) in
order to carry out this analysis in all the desired segments. Even if this is the case, the insight that
can be gained through the use of this process usually outweighs any temporary disadvantages from

30
the use of estimates. However, when estimates are used, care should be taken in the interpretation
of the results.
The calculation of the expected basis against which actual results will be monitored is less likely to
be an issue, assuming the office's administrative systems can split the business in-force into all the
desired segments and that a projection system exists. One issue that could arise, however, is the
office's ability to produce experience analyses for all the desired segments. In some cases, it may
be acceptable to use a less detailed analysis for a particular assumption.
An example of this approach relates to the surrender rate assumption. An investigation into the
difference between actual and expected surrender payments may reveal differences in actual
payments or differences in the decrement rate. Irrespective of whether a per policy projection
system or a modelling system is used, it is unlikely that the projection will reflect timing delays
accurately. Provided that the reasons for the difference are understood, it is unlikely that greater
insight will be gained by more detailed investigation.
Over time administrative and accounting systems may be improved and analyses of experience are
likely to be developed to support the calculations.

31
5. Conclusion
As competition within the financial services industry increases, management's need to understand
its financial condition, including its primary sources of profit and requirements for capital, also
increases. This understanding is crucial to management's ability to make well-informed decisions
regarding the future direction of the company. The techniques for analysing sources of profit
against the pricing basis and against future expected results presented in this paper should provide
management with the tools necessary to carry out this challenging task.
The effectiveness of the analysis of results is dependent on the skill with which the results are
communicated to senior management. Care needs to be taken not to obscure the message; for
example by avoiding the presentation of too many numbers, or by spending too much time on
secondary details. This requires the actuary to consider written reports from the viewpoint of the
reader, rather than to regard them as documentation of the processes undertaken. As a profession
we do not have a good track record for effective communication; in the future, we must improve
to retain our influence on management.

32
Appendix A
Key Assumptions for Examples
Contracts: Non-profit, 25 year contract.
Assumptions:
• Net earned interest rate equals 9%.
• Valuation interest rate equals 4.5%
• Actual mortality is 111% of expected in the first projection year; otherwise actual equals
expected.
• Actual lapses are 125% of expected in the first projection year; otherwise actual equals
expected.
• Risk discount rate used is 11%.
Timing of cashflows in model:
• Premiums received and expenses incurred at the beginning of the calendar year.
• Deaths occur evenly throughout the calendar year.
• Lapses occur at the end of the calendar year.
• Statutory profits are distributed annually at the end of the calendar year.

33
Appendix B
Statutory Results, Actual
In-force atNew Sales Start of Total
Year
Reserves brought forward
Premiums received
Interest and gains received
Expenses incurred and commissions paid
Death claims paid
Surrender values paid
Amounts paid on maturity
Reserves carried forward
Profit during year
0
10,000
(305)
(12,898)
(983)
(1,014)
0
(7.105)
(12,305)
213,878
58,403
23,070
(7,983)
(15,929)
(14,126)
0
(240.028)
17,285
213,878
68,403
22,765
(20,881)
(16,912)
(15,140)
0
(247.133)
4,980

34
Appendix C
Statutory Reserve Development, Actual Results
In-force atNew Sales Start of Year Total
Reserves brought forward
Premiums received
Required interest for policyholderliabilities
Expense loadings
Reserve decrease for deaths
Reserve decrease for surrenders
Reserve decrease for maturities
Reserves carried forward
0
10,000
395
(503)
(1,428)
(1,359)
0
7,105
213,878
58,403
11,619
(2,938)
(22,276)
(18,658)
0
240,028
213,878
68,403
12,014
(3,441)
(23,704)
(20,017)
o247,133
35
Appendix D
Sources of Profit, Statutory Basis, Actual Results
New In-force atSales Start of year Total
a. Gain from interest-- Interest and gains received-- Required interest for policyholder
liabilities
b. Gain from loadings-- Valuation basis loadings in premium rates-- Expenses incurred and commissions paid
c. Gain from mortality-- Reserve decreases for deaths— Death claims paid
d. Gain from surrenders— Reserve decreases for surrenders-- Surrender values paid
e. Profit during year
(305){395}(700)
503(1 2.898}(12,395)
1,428(983}445
1,359(1.014}345
(12,305)
23,070(11.619}11,451
2,938(7.983}(5,045)
22,276(15.929}6,347
18,658(14.126}4,532
17,285
22,765(12.014}10,751
3,441(20.881}(17,440)
23,704(16.912}6,792
20,017(15.140}4,877
4,980
36
Appendix E
Natural Reserve Development
In-force atNew Sales Start of Year Total
Reserves brought forward
Premiums received
Required interest for natural reservesand cashflows
Commission and expense allowances
Death claims
Surrender values
Amounts paid on maturity
Profit margin
Reserves carried forward
0
10,000
(305)
(12,898)
(983)
(1,014)
0
(945)
(6,145)
50,696
58,403
8,384
(7,983)
(15,929)
(14,126)
0
(5.516)
73,929
50,696
68,403
8,079
(20,881)
(16,912)
(15,140)
0
(6.461)
67,784
Interest on excess of statutory reserveover "natural" reserve
0 14,686 14,686
Note: the difference between actual interest received of 22,765 and the required interest on the
"natural" reserves and cash flows of 8,079 is the interest earned on the excess of the statutory
reserves over the "natural" reserves.

37
Appendix F
Statutory Results, Expected Results
In-force atNew Sales Start of Year Total
Reserves brought forward
Premiums received
Interest and gains received
Expenses incurred and commissionspaid
Death claims paid
Surrender values paid
Amounts paid on maturity
Reserves carried forward
Profit carried forward
0
10,000
(301)
(12,898)
(885)
(811)
0
(7.379)
(12,274)
213,878
58,403
23,142
(7,983)
(14,336)
(11,309)
0
(243.956}
17,839
213,878
68,403
22,841
(20,881)
(15,221)
(12,120)
0
(251.335)
5,565
38
Appendix G
Statutory Reserve Development, Expected Results
In-force atNew Sales Start of Total
Year
Reserves brought forward
Premiums received
Required interest for policyholders liabilities
Implicit allowance for expenses
Reserve decrease for deaths
Reserve decrease for surrenders
Reserve decrease for maturities
Reserve carried forward
0
10,000
395
(503)
(1,426)
(1,087)
0
7,379
213,878
58,403
11,624
(2,938)
(22,074)
(14,937)
0
243,956
213,878
68,403
12,019
(3,441)
(23,500)
(16,024)
0
251,335

39
Appendix H
Sources of Profit, Statutory Basis, Expected Results
In-force atNew Sales Start of Total
Year
a. Gain from interest-- Interest and gains received— Required interest for policyholders
liabilities
b. Gain from loadings-- Valuation basis loadings in premium rates-- Expenses incurred and commissions paid
c. Gain mortality-- Reserve decreases for deaths-- Death claims paid
d. Gain from surrenders-- Reserve decreases for surrenders- Surrender values paid
e. Profit during year
(301)(395)(696)
503C12.898)(12,395)
1,426(885)541
1,087(811)276
(12,274)
23,142(11.624)11,518
2,938(7.983)(5,045)
22,074(14.336)7,738
14,937(11.309}3,628
17,839
22,841(12.019)10,822
3,441(20.881)(17,440)
23,500(15.221)8,279
16,024(12.120)3,904
5,565

40
Appendix I
Comparison Actual vs Expected, Statutory Gain by Source
Actual Expected Difference
a. New Sales-- Gain from interest-- Gain from loadings— Gain from mortality— Gain from surrenderSubtotal
b. In-force at start of year-- Gain from interest- Gain from loadings~ Gain from mortality— Gain from surrenderSubtotal
c. Total-- Gain from interest- Gain from loadings- Gain from mortality- Gain from surrenderTotal
(700)(12,395)
445345
12,305
(696)(12,395)
541276
(12,274)
(4)0
(96)69(31)
11,451(5,045)6,3474.53217,285
11,518(5,045)7,7383.62817,839
(67)0
(1,391)904(554)
10,751(17,440)6,7924.8774,980
10,822(17,440)8,2793.9045,565
(71)0
(1,487)973(585)

App
endi
x J
For
mul
a fo
r Su
cces
sive
Em
bedd
ed V
alue
s
41

42
These formulae assume that the value of in-force business and the value of new business have been
calculated in a manner which makes it appropriate to apply the risk rate of return (j) to the values.
If, on the other hand, the values of in-force business and new business allowed for surplus to
emerge throughout the year, the above formulae would need to be amended to reflect the timing
of the surplus distributions. In particular in the Table the risk rate of return has been applied for
a full year to the value of new business. This is only appropriate as in our example new business
is sold at the beginning of the year; otherwise, the appropriate allowance depends on the incidence
of the new business sales.

43
Appendix K
Values of Business
• Expected values, beginning of year:
New sales
In-force at Start of Year
£2,731
£172,383
• Values, end of year:
New sales
In-force at Start of Year
Actual
£14,739
£170,590
Expected
£15,305
£173,506
Variance
£(566)
£(2,916)

44
Appendix L
With-Profit Business
The example used throughout this paper concerns a company which writes only conventional non
profit products. This Appendix contains suggested amendments to the presentation of Tables 9
and 10 which could be used for a company writing with-profit business.
For a with-profit fund, the value of in-force business is the sum of
the value of future shareholder transfers generated by future bonus declarations,
and
the value of the shareholders' interest in the balance of the long term fund surplus to that
required to provide for the bonuses mentioned above.
The assumptions regarding future experience which are used to calculate the above values include
an assumption regarding future levels of reversionary and terminal bonus (even if that assumption
was zero).
The balance of the long term fund after allowing for expected claims, expenses, taxes and
shareholders transfers is referred to as excess assets in this Appendix. The value of shareholders'
interests in these excess assets will depend on the methodology used in the embedded value
calculation.
The amended presentations of Tables 9 and 10 separate the column related to value of in-force
business into two columns as shown below.
The table of variances demonstrates that certain assumptions relating to future experience, such as
surrender rates, affect both the value of future shareholder transfers and the value of shareholders'
interests in the excess assets, whereas other assumptions (eg maintenance expenses) only affect the
amount of excess assets unless the variance is accompanied by a change in current or future bonus
declarations.

45
Table 9 (Amended): Illustrative Movement in Embedded Value of a With-Profit Company (£)
Value of Shareholders'Shareholders' Shareholders' Interest in
Net Assets Transfers Excess Assets Total
Embedded value brought forward
+ Investment return on shareholders' net assets
X Y Z X+Y+Z
X X
+ Contribution from in-force business:
risk rate of return on shareholders' transfers
investment return on excess assets
expected profits during year
variance between actual and expectedexperience during year
impact of changes in assumptions
changes in proportion of excess assetsattributable to shareholders
X
X
X
(X)
Y
X
Z
X
X
X+Y+Z
X X
+ Contribution from new business:
value of new business at point of sale
risk rate of return on shareholders' transfers
expected profits during year
variance between actual and expectedexperience during year
impact of changes in assumptions
change in proportion of excess assetsattributable to shareholders
X Y X+Y
X
X
X
(X)
X Y z X+Y+Z
X X
Subtotal
+ Capital adjustments
Embedded value carried forward
X Y Z X+Y+Z
X Y Z X+Y+Z

46
Table 10 (Amended): Variance Analysis of a With-Profit Company (£)
Source of varianceShareholders'
Net Assets
Value ofShareholders'
Transfers
Shareholders'Interest in
Excess Assets
Total
In-force at beginning ofyear and new business:
Variances arising duringyear— interest— expense-- mortality-- surrender-- bonus declaration-- change in reserve basis
n/a
XXX
XYYY
XXYZZZ
XXX+YX+Y+ZX+Y+ZX+Y+Z
Change in assumptionsregarding futureexperience:— risk rate of return-- interest— expense— mortality~ surrender— bonus levels— change in reserve basis
X
XXXX
YXXYYYY
X+YXX
X+YX+YX+YX+Y


