Aalto University School of Electrical Engineering Department of Communications and Networking Joona Mikola Analysis of Migration Scenarios from Synchronous to Packet Transmission in an Operator Network Master‟s Thesis Helsinki, May 30, 2012 Supervisor: Professor Raimo Kantola Instructor: Seppo Kuusisto M.Sc
Transcript
Aalto University
School of Electrical Engineering
Department of Communications and Networking
Joona Mikola
Analysis of Migration Scenarios from Synchronous to
Packet Transmission in an Operator Network
Master‟s Thesis
Helsinki, May 30, 2012
Supervisor: Professor Raimo Kantola
Instructor: Seppo Kuusisto M.Sc
I
Abstract
AALTO UNIVERSITY ABSTRACT OF THE SCHOOL OF ELECTRICAL ENGINEERING MASTER‟S THESIS
Author: Joona Mikola
Title: Analysis of Migration Scenarios from Synchronous to Packet
Transmission in an Operator Network
Date: 30.05.2012 Language: English Number of pages: 8+71
Department of Communications and Networking
Professorship: Networking Technology Code: S-38
Supervisor: Prof. Raimo Kantola
Instructor: M.Sc Seppo Kuusisto
The evolution of telecommunication networks has led to a situation where the
usage of traditional fixed telecom services has been replaced with wireless and
IP-based solutions. Network operators have identified this trend and have started
to migrate their networks towards IP based Next Generation Network.
Network migration is a complicated process and requires a lot of different
analyses. Migration needs to be optimized so that the maximum revenue is
obtained during a transition process while at the same time customer satisfaction
is maintained. This thesis describes how analyses help to manage and predict
migration process effectively. Two separate analysis solutions are presented: A
tool to predict the development of customer amounts and a tool that helps to
obtain the most optimal migration order.
The overall benefits of these tools will become evident in the future when the
migration has progressed further but the first obtained results are encouraging.
During the implementation of the analyses it was identified that a more evolved
analysis platform is needed to replace Microsoft Excel currently in use.
Päivämäärä: 30.05.2012 Kieli: Englanti Sivumäärä: 8+71
Tietoliikenne- ja Tietoverkkotekniikan laitos
Professuuri: Tietoverkkotekniikka Koodi: S-38
Valvoja: Prof. Raimo Kantola
Ohjaaja: DI Seppo Kuusisto
Tietoliikenneverkkojen kehitys on johtanut tilanteeseen, jossa kiinteän verkon
teleliikennepalvelujen käyttöä on korvattu langattomilla ja IP-pohjaisilla
ratkaisuilla. Verkko-operaattorit ovat tunnistaneet tämän kasvavan trendin ja
ovat alkaneet muuttamaan verkkojaan IP-pohjaiseen seuraavan polven
verkkoon.
Verkkomigraatio on monimutkainen prosessi ja se vaatii paljon analyysityötä
tuekseen. Migraatio täytyy optimoida niin, että saavutetaan maksimaalinen
liikevaihto siirtymävaiheen aikana ja samalla ylläpidetään myös
asiakastyytyväisyyttä. Tämä työ tutkii miten analyysejä hyödynnetään
migraation hallinnassa ja ennustamisessa. Työssä esitellään kaksi eri
esimerkkiä analyyseistä: Analyysiratkaisu, jolla kyetään ennustamaan
liittymämäärien muutosta, sekä analyysi, jota hyödynnetään optimaalisen
migraatiojärjestyksen määrittelyssä.
Näistä analyyseistä saatava kokonaishyöty selviää vasta, kun projekti on
edennyt hieman pidemmälle, mutta alustavat tulokset ovat rohkaisevia.
Analyysejä implementoitaessa tunnistettiin tarve paremmalla
analyysityökalulle tällä hetkellä käytössä olevan Microsoft Excelin tilalle.
Avainsanat: TDM, NGN, migraatio, analyysi
III
Acknowledgements
I would like to thank my instructor Seppo Kuusisto for the support. In addition, I would like to
thank Risto Kuitunen from TeliaSonera for providing necessary information for my thesis. I
would also like to thank Raimo Kantola from Aalto University as well as my family for their
support during the writing process.
Helsinki 30.5.2012
Joona Mikola
IV
Table of Contents
Abstract .............................................................................................................................................. I
Table 1 PDH Hierarchy levels and Data Rates ............................................................................13 Table 2 SDH hierarchy levels and data rates ................................................................................16
Table 4 IPTV subscriptions top 10 countries ...............................................................................36 Table 5 Product x subscriptions ....................................................................................................57 Table 6 Distribution of replacement solution ...............................................................................58
Table 7 ARPUs of examined products ..........................................................................................60 Table 8 Business analysis ..............................................................................................................64
VII
List of Abbreviations
AAA Advanced Access Architecture
ADM Add/Drop Multiplexers
ANSI American National Standards Institute
ARPU Average Revenue per User
AU Administrative Unit
BRI Basic Rate Interface
CAPEX Capital Expenditure
CESoPSN Structure – Aware Time Division Multiplexed (TDM) Circuit Emulation
Service over Packet Switched Network
CLASS Custom Local Area Signalling Services
CSMA/CD Carrier Sense Multiple Access/Collision Detection
CWDM Coarse Wavelength Division Multiplexing
DWDM Dense Wavelength Division Multiplexing
DXC Digital Cross Connect
ED Emulation Device
FDM Frequency Division Multiplexing
GMPLS Generalized MPLS
HDTV High Definition Television
IP Internet Protocol
IPTV IP Television
ISDN Integrated Services Digital Network
ITU-T International Telecommunication Union Telecommunication Standardization
Sector
LAN Local Area Network
MAN Metropolitan Area Network
MEF Metro Ethernet Forum
MPLS Multiprotocol Label Switching
MSOH Multiplex Section Overhead
NGN Next Generation Network
VIII
OPEX Operational Expenditure
OSI Open Systems Interconnection
PCM Pulse Code Modulation
PDH Plesiochronous Digital Hierarchy
POTS Plain Old Telephone Service
PRI Primary Rate Interface
PSTN Public Switched Telephone Network
PW Pseudowire
PWE3 Pseudowire Emulation Edge to Edge
QoS Quality of Service
RSOH Regeneration Section Overhead
SAToP Structure-agnostic transport of TDM over Packet
SDH Synchronous Digital Hierarchy
SIP Session Initiation Protocol
STM Synchronous Transport Module
TCP Transmission Control Protocol
TDM Time Division Multiplexing
TDMoP TDM over Packet
TM Terminal Multiplexer
UDP User Datagram Protocol
VC Virtual Container
VoIP Voice over IP
VPN Virtual Private Network
WAN Wide Area Network
WDM Wavelength Division Multiplexing
1
1. Introduction
Telecommunication networks have evolved rapidly during the years. Especially the
performance of mobile networks has improved and at the same time bandwidth demands are
continuously increasing. Network provider‟s goal is to maintain necessary revenue growth that
is required to sustain operator profitability in an increasingly competitive market environment.
In order to achieve these goals the operators need to modernize their networks to enable new
services and reduce costs.
Traditionally operators have two fixed network platforms working in parallel. One is a TDM-
based circuit-switched legacy network used to provide traditional telecom services like
telephony and fax. The other network in use is a packet-switched network used for the
Internet. Today it is also possible to deploy telephony services over the packet network. It is
easy to understand that maintaining two parallel platforms that offer similar services is not
economically sensible. That is why network operators are transforming their networks from
TDM to All-IP Next Generation Network (NGN). Shifting to one-platform NGN reduces costs
and simplifies network maintenance. The new network makes it also possible to implement
more advanced services that will attract customers.
Transformation from TDM to IP can be done in different ways. Some customers naturally
adopt new products but usually this natural churn is happening too slowly from the operator‟s
point of view. Some customers must be actively migrated. This process requires extensive
customer analysis and interaction which creates additional costs. Network emulation is a
technique that is used to simulate the functions of the TDM-network in an IP-network. This
can be done with specific emulation devices (ED) so that a connection is migrated to packet
without customers noticing any difference. Network emulation requires investments in EDs so
it is more economically sensible to deploy it in areas that have more connections.
2
Determining the suitable migration amounts and methods requires extensive analysis work and
a lot of co-operation between the network- and service operator. A network operator has
different preferences about migration targets than a service operator. This thesis describes
different analyses needed to maintain the most optimal migration process. Mainly the analyses
are needed to determine the yearly amounts of active migration and how that affects in
emulation amounts and vice versa. In addition to that analyses are needed to determine yearly
migration targets. That is also examined in this thesis. The goal is to achieve the most cost
efficient migration process while maintaining maximum customer satisfaction.
This thesis is divided in nine chapters. The second chapter focuses on different networks. The
main aspects of traditional and next generation networks are presented. The third chapter
focuses on the theoretical background. The most essential technologies used in traditional and
future IP-networks are also explained. This chapter should be helpful for people who have no
background knowledge in telecommunications. Different services provided by networks are
examined in the fourth chapter
The reasons and motivation for network migration are examined more thoroughly in the fifth
chapter. The chapter describes different migration methods that can be used to optimize the
technology change. The sixth chapter describes the different analyses required for migration
planning. An overview of migration analysis and planning process is given and different
migration strategies are examined. The seventh chapter focuses on an analysis tool used to
predict and optimize yearly migration amounts while the sixth chapter describes an analysis
process of how yearly migration targets are chosen.
Another case example is presented in the eight chapter: an example of how yearly migration
targets are determined. The ninth and the final chapter shortly summarize the thesis.
Conclusions about the usefulness of analyses and how the migration could be improved are
given.
3
2. Network overview
The second chapter focuses on different kinds of networks. The differences between circuit
and packet switched networks are examined. The characteristics of the circuit-switched legacy
and packet-switched Next generation networks are also examined. This chapter provides a
useful insight of the environment network migration functions in.
2.1 Circuit-switched Networks vs. Packet-switched Networks
Traditional telephone networks are circuit switched. In circuit switching a dedicated channel is
reserved for each telephone call. This channel remains open and active during the whole call
and it cannot be used by any other data or phone calls. Usually the calls are routed through
several switches that hold switching state for the call. The entire data is routed along the same
path. The dedicated circuit offers several advantages. There is no interference, connections
have a low delay and there is no need for channel sharing. The disadvantage of circuit
switching is that it is not very efficient for short flows or bursty traffic. For example during a
telephone call there are some silent moments when neither person is speaking. During this
only a very small amount or no useful data is transmitted along the circuit. The resources
remain still reserved even though no data is sent which leads to a less than optimal operation.
4
Figure 1 Circuit-Switched Network
.
In packet switching the data is broken into small packets that are sent into a network. These
packets travel in the network trying to find the best possible route to the destination. When
sending a packet a specific header containing information about its destination is added to the
packet. This header may also have sequence numbers and information about how many
packets were sent. This information enables the destination side to put the packets in the
correct order and to find out if packets are missing. If a packet doesn‟t reach its destination the
destination host can request the missing packet to be resent.
Figure 2 Packet-Switched Network
5
Packet switching allows better utilization of bandwidth compared to circuit switching. For
most of the traffic there is no need for reserved channels. Data is sent to a network when there
is something to send and during the silent periods the bandwidth is available to other users.
Packet switched networks are also cheaper and easier to expand. The disadvantages of packet
switching are potential packet losses and increased delays when there are lots of users in the
network. Because of the possibility of packets arriving out of order, packet switching is not a
very suitable solution for some data streams like real-time video. [1]
2.2 Public Switched Telephone Network
Traditional telephone networks are circuit switched. Telephone networks that have public
access are generally called Public Switched Telephone Networks (PSTN). The PSTN consist
of copper wires and optical fibres interconnected with different switches and exchanges. At
the beginning of the PSTN these switches were manually operated but today these manual
switches have been replaced by automatic electronic switches. PSTN is a global network
which is divided to smaller networks managed by different operators. These networks need to
interconnect so that their subscribers can call to subscribers using other networks.
Traditionally the PSTNs are based on TDM technology and use digital signalling. PCM is the
method used in converting an analogue signal to digital format. TDM and PCM are examined
in the next chapter. Current signalling technology in use is called Signalling System No. 7
(SS7). SS7 is an out-of-band signalling method which enables the implementing of more
advanced services.
PSTN‟s main function is to switch voice calls. It is not very suitable for data transmission
because data has different characteristics compared to voice. Data has, for example, a variable
use of the bandwidth and the need for higher transmission speeds. PSTN has also issues
concerning its flexibility. It is built on an infrastructure whereby only the vendors of the
equipment develop the applications for said equipment. At the same time deregulation has
6
increased competition and that has encouraged operators to develop new services and
applications. For that purpose a more open infrastructure, by which many vendors can provide
and develop applications is needed. [2]
2.3 Integrated Services Digital Network
Integrated Services Digital Network (ISDN) is a design for a completely digital network.
While PSTN uses digitalized switches, it doesn‟t offer the end-to-end digital connections
provided by ISDN. ISDN is a circuit-switched network system that mainly uses the same
switches and exchanges with PSTN. ISDN can also provide access to packet networks. The
main advantage of ISDN is its ability to handle different types of information, like data, audio
and video. It also provides a single interface for all devices, such as telephones, fax machines
and computers.
ISDN has two different user interfaces:
Basic Rate Interface (BRI)
Primary Rate Interface (PRI)
BRI is a 144kbps service that is separated in three channels. There are two 64kbps bearer
channels, also known as B-channels, and one 16kbps data channel, also known as D-channel.
The B-channels are used to transmit the actual data, while the confusingly named D-channel
transmits different signalling and control information. The PRI is transmitted over an E1-
carrier that has the 2048kbps transmission rate. In ISDN PRI this 2048kbps channel is divided
to 30 64kbps B-channels, one 64kbps D-channel and one 64kbps channel used for timing and
alarms. BRI is the most appropriate for individual use and for small businesses, while PRI is
mostly used only by businesses.
7
Generally ISDN can be considered to be a more evolved version of PSTN. The end-to-end
digital connection enables better quality and higher transmission speeds. One of the ISDNs
biggest attractions was its data transmission capabilities, which were more evolved, compared
to those of PSTN. For example, ISDN offered higher data rates and made it possible to access
Internet while the telephone was in use. Today in data transmission the ISDN has been mostly
superseded by broadband Internet that offers much higher rates and lower prices. [3]
2.4 Next Generation Network
The Next Generation Network (NGN) is a quite broad term. It is used to describe the
architectural change in telecommunications networks and it consists of multiple technologies
and protocols. ITU-T has created several documents where NGN characteristics are described.
The fundamental principles of the NGN are documented in ITU-T recommendation Y.2001
[4]
Figure 3 Traditional networks
8
NGN is a packet-based network, so it is ideal for data transmission. The main motivation for
NGN is the convergence of different services and networks. Data, voice and video can all be
transmitted in the same network. In NGN the service and transport levels are separated, which
means that the services are independent of transport details. This enables the service provider
to implement new services simply by defining them in the service layer, without consideration
for the underlying transport layer.
Figure 4 NGN Layers
Additional flexibility is obtained by the ability to use the services provided by NGN from
different access networks. One key requirement of NGN is to provide broadband capabilities
with end-to-end QoS and transparency. NGN must also be able to support different legacy
networks. This can be achieved with emulation, for example. Emulation is discussed later on
in this thesis.
9
Commonly the NGNs are built around the IP-protocol and that is why the term “all IP-
network” is often used around NGN. IP is the widely accepted standard for which most of the
new applications are built. This enables easier integration and interoperability between the
applications within networks. [5]
10
3. Technologies used in Networks
There are different networks and many different technologies are used in them. This chapter
focuses on these different network technologies. The services provided in the network depend
heavily on underlying technology so that is why it is important to have understanding about
that. This chapter provides about both the technologies working on older platform and newer
technologies used in the NGN.
3.1 Time Division Multiplexing
In circuit switched networks multiple transmissions need to be transferred along the same
transmission medium. Time Division Multiplexing (TDM) is used in circuit switched
networks to achieve this. TDM is a technique where the time domain is divided in slots and
these slots are allocated to different sub-channels. TDM allows multiple users to transmit data
on the same transmission medium. During the time slot the full bandwidth of the channel is
reserved to the sub-channel occupying the slot. One TDM frame consists of one timeslot per
sub-channel plus synchronization and signalling channels. TDM is widely deployed in
traditional PSTN transmission protocols, PDH and SDH, which are discussed later in this
chapter.
Figure 5 TDM system
11
The basic idea of TDM is presented in figure 5. Six different channels arrive to the multiplexer
where they are buffered. The buffer length is equal to the length of one time slot. These
buffers are then sequentially scanned so that a multiplexed data stream is formed. The de-
multiplexer receives the data stream, separates the data back to their channels and outputs it to
the correct lines.
TDM is mainly used in PSTN to multiplex digital signals. Pulse Code Modulation (PCM) is a
method where analogue signal is coded in digital format. The main idea of the PCM is to
sample the analogue signal at regular intervals and then quantize values to the nearest digital
value. In telephony each sample is represented with 8 bits, so there are 28
= 256 possible
quantization values.
In order to obtain the necessary quality for the signal, samples must be made frequently
enough. The required sampling rate for telephone calls can be derived from Nyquist Sampling
Law [6], which states that the minimum sampling rate should be twice the maximum
frequency of the signal so that the full information in the signal can be preserved. In telephony
the voice signal range is between 300-3400Hz, so the minimum sampling rate should be
6800Hz, but for practical reasons an 8000Hz sampling rate is used.
When the signals have been converted to digital format, TDM can be used to obtain larger
aggregate data streams. Currently the International Telecommunications Union (ITU) has two
standardized versions of PCM multiplexing [7]:
The 30-channel E-carrier, which is used in Europe, Asia and on international links
The 24-channel T-carrier, which is used in America and Japan.
Here we focus more on the European version. In the 30-channel multiplexing standard, the
transmission channel is represented as a time frame split in 32 time slots. The timeslots are
numbered from 0 to 31. The 8000Hz sampling rate means that the samples are taken every
12
125µs. That is also the size of the TDM time frame, while the size of the time slot is 125µs /
32 = 3.9µs.
Figure 6 PCM system
Only 30 channels from the available 32 are used to transmit speech. The channel occupying
the time slot 0 (TS0) is used to indicate the start of the frame. At the sending end, a special 8-
bit pattern called frame alignment pattern is inserted into the TS0. This pattern is used to
identify the start of the frame. At the receiving end two-frames worth of bits are picked and
the first 8 bits are checked. If the frame alignment pattern is not detected, the inspected area is
shifted by one bit and the check is redone. This process is repeated until the frame alignment
pattern is recognized. Traditionally the channel in TS16 was used to transmit signalling
information related to call control. That left channels 1-15 and 17-31 to be used in speech
transmission. If each sample is represented with 8 bits and the sampling rate is 8 kHz, the
transmission speed of a single slot is:
8 kHz * 8 bit = 64kbps
From the equation above the transmission speed C of the whole system of 32 slots can easily
be calculated:
C = 32 * 64kbps = 2048kbps.
The more popular form for C is simply to abbreviate it to „2Mbps‟. Traditionally circuit
switched digital telecommunications networks are built on these 2Mbps connections. In
addition to speech they can be used to transmit data.
13
TDM has been the leading multiplexing technology for about 30 years. Before TDM,
Frequency Division Multiplexing (FDM) was dominant. The idea of FDM is to divide the
bandwidth available into smaller parts. Each transmitting signal was attached to a certain part
of the bandwidth so that multiple users could deploy the same transmission medium. FDM
was eventually largely replaced by TDM systems that had better support for data and digital
transmission. [8-9]
3.2 Plesiochronous Digital Hierarchy
Plesiochronous Digital Hierarchy (PDH) was the first internationally standardised form of
digital higher-order multiplexing. There are both European and American standards for PDH
but here we focus on the European version. The word plesiochorous comes from the Greek
language and roughly translates to “almost synchronous”. PDH has been mostly replaced,
especially in core networks, by SDH and other more advanced technologies, but in access
networks there are still noticeable amounts of PDH-devices. In Europe PDH-systems are
based on the 30-channel PCM-multiplexing standard discussed earlier. The basic transfer rate
of PDH is therefore 2Mbps, with 30 64kbps channels used to transmit speech and two 64kbps
channels for synchronization and signalling. Alternatively the bandwidth can be used for other
purposes, for example data transfer. This first level PDH hierarchy is known as E1. Different
PDH hierarchy levels are presented in Table 1.
Table 1 PDH Hierarchy levels and Data Rates
Class No. of 64 Kbit/s Channels Actual capacity Mbit/s Nominal Capacity Mbit/s
E1 30 2.048 2
E2 120 8.448 8
E3 480 34.368 34
E4 1920 139.264 140
E5 7680 564.148 565
14
As can be seen in Table 1, there are five different PDH hierarchy levels, each with roughly 4
times higher transmission rate than the previous level. So four 2Mbps E1s are multiplexed to
form the E2 channel with a transmission rate of 8.448Mbps, four E2s for the E3 with a
transmission rate of roughly 34Mbps and so on.
PDH‟s almost synchronous nature means that different parts of the PDH system are operating
on slightly varying rates. That leads to a need to add justification and stuffing bits for each
multiplexing session. For example if we simply multiplex four 2.048Mbps E1s to E2, the E2
transmission rate should be 4 * 2.048Mbps = 8.192Mbps. The deviation from the calculated
E2 capacity (8.448Mbps) results from the addition of stuffing and justification bits.
PDH‟s multiplexing and hierarchy levels make it a rather cumbersome technology. The
existence of justification bits requires a step-by-step de-multiplexing process within the PDH-
systems. For example, in order to extract a 2Mbps E1 block from the 140Mbps E4, each stage
of de-multiplexing must be performed. At first E4 must be de-multiplexed to four E3s, then
these to E2s, and finally E2s to E1s. It is easy to understand that this is quite an inflexible
solution, which requires a huge number of devices.
Figure 7 PDH multiplexing and de-multiplexing
15
Another problem is that PDH doesn‟t have a standardised control mechanism, which means
that it can differ between manufacturers. There are some spare overhead bits that are being
used for management, but they have limited bandwidth and are hard to locate in a 140 Mbps
stream without the cumbersome de-multiplexing. Optical interfaces are also not standardized
in PDH. These are just a couple of reasons why the more flexible SDH technology was
developed. [10]
3.3 Synchronous Digital Hierarchy
The growth of network traffic and problems with PDH lead to the need for developing a new
transmission technology. For this purpose the Synchronous Digital Hierarchy (SDH) was
created. SHD was standardised by ITU and it is used globally, excluding North America. In
North America a technology called SONET, which is quite similar to SDH, is used. Actually
the American National Standards Institute (ANSI) developed SONET before SDH at the
beginning of the 1980‟s. SDH, which is strongly based on SONET but adapted to European
networks, was developed by ITU-T by the end of the 1980‟s.
The transmission data streams of SDH are called Synchronous Transport Modules (STM). The
first SDH hierarchy level is called STM-1 and its transmission rate is 155.52Mbps. SDH
hierarchy levels and their transmission rates are presented in Table 2. From the table it can
easily be seen that the transmission rates of each SDH level are exact multiples of STM-1‟s
155.52Mbps data rate.
16
Table 2 SDH hierarchy levels and data rates
Class Actual Capacity Mbit/s
STM-1 155.52
STM-4 622.08
STM-16 2488.32
STM-64 9953.28
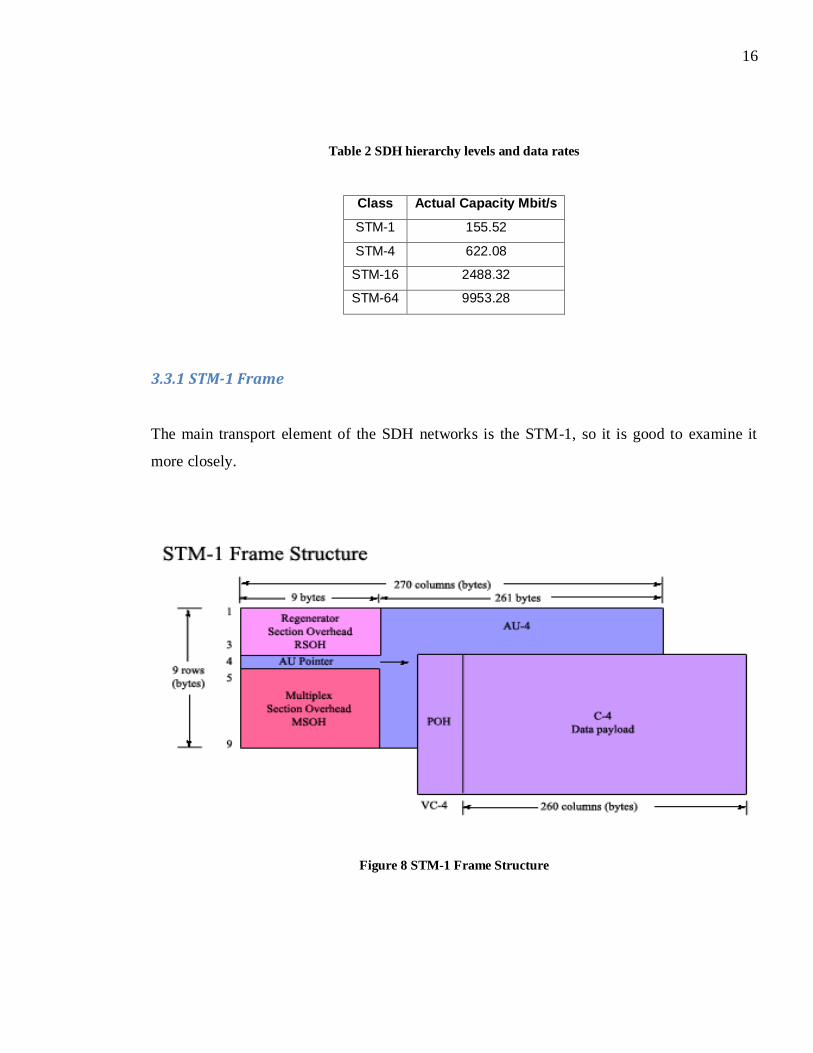
3.3.1 STM-1 Frame
The main transport element of the SDH networks is the STM-1, so it is good to examine it
more closely.
Figure 8 STM-1 Frame Structure
17
The structure of the STM-1 frame can be seen in Figure 8. The STM-1 frame is a matrix with
9 rows and 270 columns of bytes. Each frame is repeated 8000 times in a second, so the
transmission rate is:
(9*270*8) bits * 8000/s = 155.52Mbps.
The SDH network must be capable of transmitting PDH data, so for that reason specific
containers have been defined in the SDH standard that can carry this data. PDH streams from
E1 to E4 are synchronized and then packed in these containers. The path overhead (POH)
which contains control and supervisory information, is added to the beginning of the
container. The sum of the container and POH is called a virtual container (VC). VC-4 is used
for 140Mbps E4 and VC-3 for E3, while VC-12 is used for 2 Mbps E1. VCs can be packed
into larger VCs so that VC-4 can consist of three VC-3s or 63 VC-12s. From Figure 8 the
payload of STM-1 frame can be calculated:
(9*260*8) * 8000 = 149.76Mbps
The result indicates that STM-1 frame can carry one VC-4 or three VC-3s. In addition to
payload, the STM-1 frame has two main fields: AU (administrative unit) pointer and section
overhead (SOH). AU pointer is used to specify where the payload starts. SOH has two fields:
multiplexer section overhead (MSOH) and repeater section overhead RSOH. Both contain
different control and frame synchronization information. RSOH is used by all network
elements while MSOH is accessible to every element, other than regenerators.
SDH network is divided into sections and paths. The physical network is divided into two
sections called repeater section (RS) and multiplexing section (MS), while the logical network
is divided in lower and higher-order paths. The section indicates the distance between two
network elements and the path tells us the distance between the points where VC is formed
and terminated. If VC is formed by multiplexing smaller VCs, it corresponds to a higher-order
path and if VC carries non-multiplexed flow it belongs to a lower-order path.
18
3.3.2 SDH Network Elements
Different kinds of network elements are used in SDH networks. These are regenerators,
terminal- and add/drop multiplexers (ADM) and digital cross connects. Different systems
make the SDH much more flexible than the PDH. Terminal multiplexers (TM) are located at
the end points of the SDH network and are used to multiplex and de-multiplex PDH and SDH
streams from STM-n frames. For example with TM, 63 E1 streams can be extracted from one
STM-1 frame. An ADM is a multiplexer that can add or drop single streams from STM-n.
Figure 9 Terminal- and Add/Drop multiplexers
Digital cross-connect (DXC) devices are used to rearrange different SDH connections. They
can transmit information within the SDH network and different lower-level bit streams can be
attached straight to them. With DXC the connection is set up and released by the network
operator. Generally DXCs are the largest and the most expensive SDH-elements.
19
Figure 10 SDH Digital Cross-connect
Regenerators are the least complicated elements and they are simply used to regenerate the
line signal in order to maintain acceptable signal strength. [8,10]
3.4 TCP/IP
The Internet Protocol Suite, more commonly known as TCP/IP is a set of different protocols,
applications and network media used in the Internet and similar networks. It is the most
commonly used protocol in networks today and also the majority of the traffic in next
generation networks is based on TCP/IP. Two of the most popular protocols of the set are
Transmission Control Protocol (TCP) and Internet Protocol (IP), hence the name TCP/IP.
Other protocols of this suite are for example ICMP, ARP and UDP, while the example
applications are TELNET and FTP. The Open Systems Interconnection model (OSI model) is
another way to describe network technologies and like OSI model, TCP/IP also uses different
layers of functionality. The layer architectures of OSI and TCP/IP model can be seen in Figure
11.
20
Figure 11 OSI and TCP/IP reference models
As can be seen in Figure 11, the TCP/IP model has four layers. The application layer contains
direct interaction with programs and it includes commonly known protocols such as HTTP for
web browsing and SMTP for e-mail. The transport layer is responsible of transporting data
between the application layer and the Internet. The most common transport layer protocols are
TCP and UDP. On the Internet layer IP-protocol receives packets from the transport layer,
adds data header including sending and receiving computer addresses and passes these
datagrams to the network interface. The network interface then sends these packets over the
network. Today the most important network interface layer protocol is called Ethernet, which
will be discussed later in this thesis. The basic idea of the TCP/IP architecture is that the data
is packed in packets and each packet must be processed by each layer. At each processing step
a different layer header containing different control and routing information is added to the
packet. This is called packet encapsulation. Figure 12 describes a typical encapsulation case in
TCP/IP, where data IP packet is sent to the Ethernet network using TCP.
21
Figure 12 IP packet encapsulation
The main purpose of the IP-protocol is to transfer packets from sources to destinations.
Generally IP-packets are called datagrams. The IP defines the addressing methods and
structures for datagram encapsulation. The sources and destinations are identified with
specified binary addresses called IP-addresses. The first major version of IP was IP version 4
(IPv4). IPV4 defined addresses that were 32 bits long. This offered an address space of 232
=
4,294,967,296 addresses. An increased demand in IP-based services has led to a situation
where there simply aren‟t enough IPv4 addresses for everyone. For this purpose IPv6, that has
an address space of 2128
= 3.41038
, was developed. IP is a connectionless protocol, which
means that the communication between hosts occurs without any handshaking procedure.
Basically the host can send packets to the destination without being sure that the sender is
prepared to receive them. This combined with the unpredictable routes of packet network
means that the IP cannot guarantee that the packets will arrive to their destination. [11]
TCP is used to provide highly reliable transmission between hosts in packet switched
networks. TCP data is sent in segments that are encapsulated in IP datagrams. TCP uses three-
way handshaking to form a connection between hosts [12]. First the sender sends a SYN
packet to the receiver, who acknowledges this by replying with a SYN/ACK packet. Finally
the sender replies to this with an ACK packet and thus the connection is established.
Connection can be terminated in a few ways, but a similar three-way handshaking method is
22
considered to be most common. TCP makes sure that the data is received in the right order by
attaching a sequence number to each transmitted octet. Damaged segments can be identified
with a checksum that has been added to them. In the original version of TCP, reliability is
achieved by requesting an ACK packet from the receiver for every packet sent. If this
acknowledgment is not received within the timeout interval, the data is retransmitted. This can
lead to an inefficient performance when multiple packets are lost from one window of data. In
the cumulative acknowledgement, implemented in the original version, only a single lost
packet in a window can be identified per round trip time. TCP Selective Acknowledgment
Options that was introduced in 1996 is used to counter this problem. It allows the receiving
end to acknowledge correctly received discontinuous block of packets. Flow Control and
Congestion Control are other TCP mechanisms used to counter the problems of cumulative
acknowledgements. [12-13]
UDP is a transport layer protocol, which enables applications to send data to each other
without any communications set-ups or path reservations. That means that UDP does not
provide the reliable transport TCP does. For that reason UDP is also much more of a light-
weight protocol. It is suitable for use for example in transmitting voice in an IP network,
because the three-way handshaking used in TCP would cause delays that would then hinder
voice communication. [14]
3.5 Metro Ethernet
Metro Ethernet is an Ethernet based network that covers metropolitan areas. More generally
Metro Ethernet is commonly used in access networks, so basically they are built between core
networks and customer premises. It can also be used to bridge or connect to separate enterprise
Local Area Networks (LANs).
Ethernet was developed in the beginning of the 1970‟s and it is one of the first packet-based
transmission technologies. Ethernet includes many different standards and it is constantly
23
evolving. Traditional Ethernet was based on idea where computers attached to network would
use the same transmission medium. That enabled multiple users to send packets at the same
time, and because of the shared medium, that lead to packet collisions. There is a technique
called Carrier Sense Multiple Access/Collision Detect (CSMA/CD) that is used to handle
these collisions appropriately. Today the Ethernet standards support full-duplex, which means
that a network node can transmit and receive data simultaneously. Full-duplex and different
switches have made CSMA/CD obsolete. Until recently the highest data rate supported by the
Ethernet was 10 Gbit/s, but today the possible transmission rates of the Ethernet are 40 Gbit/s
and 100 Gbit/s, which are much higher rates compared to the ones provided by traditional
TDM technologies. The Ethernet‟s lower prices and a larger number of vendors have also
made it the dominant LAN technology over Token Ring [15-16]
Figure 13 The Growth of Ethernet Ports
Metro Ethernet Forum (MEF) is a non-profit organization that is dedicated to accelerating the
adoption of carrier-class Ethernet networks and services. The main idea of a Carrier Ethernet
Service is that the network operator can provide Ethernet for a customer as a service.
Traditional Ethernet was designed for LANs, so Carrier Ethernet can be considered to be an
24
extension to Ethernet that is deployed in wide area networks (WANs) and in metropolitan area
networks (MANs). The MEF has defined service attributes and parameters for successful
implementation of Ethernet services in WANs and MANs. Three different types of services
that can be delivered through Metro Ethernet have been identified [17]:
The point-to-point service called E-Line
The multipoint-to-multipoint service called E-Lan
The Rooted-Multipoint Ethernet Virtual Connection for multicast domains called E-
TREE
The MEF does not actually create new standards but it supplies different white papers, case
studies and technical specifications that are used to leverage current standards and define new
ones. Figure 14 describes normal Metro Ethernet network architecture. 10 Gigabit Metro
Ethernet ring is used to connect different customer networks into a core IP Backbone.
Customers like different businesses can have their own local area Ethernet rings that are also
connected to Metro Ethernet.
Figure 14 Metro Ethernet Network
25
Traditionally TDM-based technologies like SDH and PDH have been used in metropolitan
area networks. They are replaced by Ethernet because it offers much lower operational and
capital expenditures (OPEX and CAPEX). One important reason is also that packet based
traffic has overtaken all other traffic types. The main problems in Metro Ethernet networks are
that they are not as reliable as SDH networks and they can‟t offer as good end-to-end Quality
of Service (QoS) guarantees. To target these issues Metro Ethernet usually uses IP and
Multiprotocol Label Switching (MPLS)
The main function of MPLS is to route packets in networks. It supports many different
transmission protocols like ATM, Frame Relay and IP. In MPLS a label is attached to the
packets. This label has information of the next destination router of the packet, and when a
packet arrives to the router a new label indicating the next destination is added to replace the
old one. The original motivation behind MPLS was to make routers faster. It was observed
that the usage of labels enables routers to make routing decisions at a much faster rate,
because they only have to analyse the next destination of the packet, rather than perform a
complex route lookup based on the destination IP address. Later this advantage has been found
to be rather marginal.
MPLS offers advanced traffic engineering capabilities. Labels can have different priority
levels, which makes SDH-like QoS guarantees possible. This enables managing traffic
characteristics, such as who can send data, where to and what kind of data can be sent. More
importantly MPLS is totally independent of different link- and network technologies and that
allows the integration of networks with different technologies. In Metro Ethernet different
services have to be provisioned and monitored over different kinds of data and switches.
Generalized MPLS (GMPLS) is an extension of MPLS that works as a control plane in Metro
Ethernet managing mixed data and switches. [18, 26]
26
3.6 Wavelength Division Multiplexing
When traffic in the networks started to increase, new techniques to support higher
transmission capacities were needed. Wavelength Division Multiplexing (WDM) is a
technique that allows a number of channels to be sent on a single optical fibre by using
different wavelengths. WDM allows both uni- and bi-directional transmission. One downside
of WDM is that it is end-to-end technology, which means that if the fibre capacity is wanted to
be utilized in the middle of the fibre, WDM devices need to be installed there. That makes it
quite expensive to implement WDM in rural regions.
There are two different versions of WDM: Coarse Wavelength Division Multiplexing
(CWDM) and Dense Wavelength Division Multiplexing (DWDM). CWDM was originally
developed during the 1980‟s but it has been modified since then. Currently CWDM has a
channel spacing of 20nm and it uses wavelengths from 1270nm to 1610nm. DWDM was
developed in the early 1990‟s. The channel spacing in DWDM can be as small as 0,8nm and it
operates around 1550nm band. DWDM can transmit over 100 different channels on one fibre,
while with CWDM there are approximately 18 channels available. DWDM has a much higher
capacity and a bigger range than CWDM, but it is also more expensive and requires more
complex technology. For these reasons the use of DWDM limits to core networks and long-
distance connections. [19-20]
3.7 TDM over Packet
TDM over Packet (TDMoP) describes technologies that are used to emulate circuit switched
traffic like TDM E1s or STM-1s in packet network. The underlying packet network may be
based on, for example, Ethernet, MPLS or IP technology. TDMoP is an especially important
27
technology in network migration. With TDMoP virtual TDM connections are created through
the packet network. These connections are called pseudowires (PW). Figure 15 describes a
basic setup of TDMoP. Customer Edge (CE) devices CE1 and CE2 are TDM network
elements. The Provider Edge (PE) devices PE1 and PE2 are converters that convert circuit -
switched traffic to packet-switched traffic.
Figure 15 TDMoP
The simplest way to implement TDMoP is to encapsulate a E1 frame in a IP-packet by adding
appropriate header to the frame. TCP/IP would provide a reliable way for encapsulation but it
is not useful on voice transmissions because TCP resends packets that didn‟t reach the
destination. This can lead to a situation where the voice packets could arrive out of order. That
is why Real-time Transport Protocol (RTP) is more preferable in voice transmission.
Encapsulation adds a lot of overhead to the TDM traffic but that can be handled with header
compression and with the grouping of frames.
One of the main problems in TDMoP is how to obtain acceptable synchronization between
PW endpoints. A good solution is to use a separate TDM-based synchronization network.
Other options are to use GPS or to calculate synchronization information from delays between
network nodes.
28
TDMoP related standardization is done in multiple organizations but mainly in ITU-T and in
IETF (Internet Engineering Task Force). The IETF has set up a specific Pseudowire Emulation
Edge to Edge (PWE3) group for developing the architecture for service provider edge-to-edge
PWs and gathering information about different encapsulation techniques. A couple of common
TDMoP technologies implemented in networks are:
Structure-agnostic transport of TDM over Packet (SAToP).
Structure-aware Time Division Multiplexed (TDM) Circuit Emulation Service over
Packet Switched Network (CESoPSN).
SAToP protocol is used in multiplexing TDM streams like STM-1 over packet network. The
protocol disregards structures imposed on streams like the standard TDM framing. SAToP is
an ideal solution for networks where the packet network doesn‟t need to interpret the TDM
data or to participate in TDM signalling. It is often used to transmit 2G data from mobile base
stations to the network. CESoPSN is a quite similar protocol to SAToP. It is used to transmit
structured TDM data over packet network. It also improves the resilience of the circuit-
switched part of the network to effects of loss of packets occurring in the packet-switched
network. With CESoPSN it is also possible to separate for example 64 kbit/s channels from
the E1 frame. [21-22]
29
4. Migrated Services and Their Replacements
The users of the network services do not need to know what the underlying technology, in
which the service is built, is. Different networks and technologies make it possible to provide
different services. This chapter describes the most common services offered in PSTN and in
NGN. The information about different services is useful in migration management, because it
helps in determining suitable replacing solutions.
4.1 TDM Network Services
The TDM network services focused mainly on voice transmission. When the technology
evolved, many additional features were implemented in these services. Technology evolution
also made it possible to develop different usage purposes for the traditional telephone
subscription.
4.1.1 Plain Old Telephone Service
Traditional telephone service is based on a bi-directional audio channel with a frequency range
between 300–3400Hz. This allows telephone calls where both participants can speak
simultaneously. More commonly this service is called Plain Old Telephone Service (POTS).
Other basic POTS attributes are: call progressing tones, like a dial tone, and a ringing signal
and emergency number service (for example 112 in Finland). The arrival of electronic
switches in PSTN enabled including many additional services to POTS. These features can be
divided into two categories: Customer Calling Features and Custom Local Area Signalling
Services (CLASS).
30
For example the following services can be categorized as Customer Calling Features:
Call waiting
Call forwarding
Conference Calling
Call waiting is used to notify users, who are already engaged in a call, that they are receiving
an incoming call. Call forwarding, like its name implies, is used to forward calls to a different
destination. Conference calling, also known as three-way calling, enables multiple persons to
participate in a telephone conversation.
Custom calling features work basically on every phone. CLASS features on the other hand
require SS7 features in order to work. A few of the more popular CLASS Display Features are
listed below [23]:
Caller ID
Call Blocking
Call Return
Caller ID enables the calling party‟s number to be displayed at the receiving end. This requires
a device that is able to read the out-of-band signalling information that contains the number.
Call blocking allows users to specify certain numbers from which he doesn‟t want to receive
calls. These callers receive a message that their call is not accepted, while the receiving end
doesn‟t get any indication of the call. Call return is used to return a call to the most recent
caller. This returning call can be queued if the original caller is currently busy.
ISDN offers a similar service to POTS, but with some advantages. Many of the calling
features were at first only available to ISDN based telephones, but today, when the technology
has evolved, they are also possible to be implemented in PSTN. The existence of two B-
channels offers the possibility to perform simultaneous functions. The user can, for example,
31
use one 64kbps channel for Internet connection and at the same time another 64kbps channel
for speech. Overall the digital technology is considered to offer higher reliability and better
sound quality.
4.1.2 Other uses for POTS
PSTN and ISDN telephone services can be used in many purposes other than speech. One of
the more traditional uses is to utilize POTS to access Internet. A modem is used to convert IP
packets into audio frequency signals. Dial-up requires no additional hardware for the
telephone network to provide this service, thus making it the most widely available form of
Internet access. The downside of the dial-up Internet is the low transfer speed: the typical
maximum transfer speed of most modern modems is 56kbit/s, which is a much lower rate than
broadband Internet can offer.
Telephone subscription can be also used as a fax service. This can be done by connecting a
telephone number to a printer or fax machine.
Other possible usage purposes of a telephone subscription are listed below:
Alerting service (for example fire and burglar alarm)
Payment terminal
Traffic cameras
Elevator phones
Milking robots
As can be seen from the examples above, the range of potential solutions is quite wide. The
purpose for which the telephone subscription is implemented can be an important factor when
determining a replacing solution for service migration.
32
4.2 NGN Services
The convergence of different networks in NGN also enables the convergence of different
services. Triple play is the term used in telecommunications market for describing the
combined offering of three services: Television, Telephony (IP-based) and Internet. NGN
enables the offering of triple-play services over the same broadband connection. It is estimated
that currently over 80% of the revenue of incumbent operators is obtained through traditional
voice [24]. The rise of IP-telephony has increased the vulnerability of operators, and that has
encouraged them to offer bundled services including IP-telephony. Some operators have also
planned offering a quadruple-play bundle that would include mobile voice and data in addition
to normal triple play services. [25]
4.2.1 Voice over IP
Voice over IP (VoIP) is a technique for sending real-time, full-duplex voice over the Internet
or intranet. It is a digital packet based technique. In VoIP the analogue voice signal is
digitalized, encoded and then segmented into frames that are then stored into voice packets.
These packets are then sent to the network and on their way to the destination they can travel
through multiple switches and routers.
VoIP has several different advantages compared to the standard telephone services. Most of
these advantages arise from the fact that VoIP operates on top of a packet switched network
while the traditional POTS is deployed in the circuit switched PSTN. As discussed earlier, the
packet network allows better utilization of bandwidth, because it is in use only when
something is transmitted. Therefore more calls can be carried over a single link. VoIP also
creates cost savings that are obtained mostly from the better bandwidth utilization. Another
factor for creating cost savings is that VoIP requires fewer long-distance trunks between
33
switches. That enables the billing to be based on the transmitted data instead of the distance
used in the traditional service. VoIP also offers similar calling features as in POTS, like caller
ID and call forwarding. These can be implemented at minimal extra cost. It is also possible to
use an IP phone to call and receive calls from the PSTN. This can be achieved with adapters
that translate IP addresses to phone numbers and vice versa.
The disadvantages of VoIP include packet loss and delay. Packets arrive to routers from many
different sources and they are all queued for transmission over an outgoing link in the router.
When the queue is full, the arriving packet is lost in the router, because there is no place left
for it. When a lot of people are using the Internet at the same time, routers can become
congested so that packet loss occurs. Packet losses can severely damage the quality of the
voice signal. Several approaches for dealing with this problem have been presented [26]:
Upgrading the network
Silence Substitution – Substitute silence in the place of a missing packet(s)
Noise Substitution – Substitute white background noise in the place of a lost packet(s)
Repetition of Packets – The last correctly received packet is replayed in the place of a
lost packet
Interpolation of Packets
Frame Interleaving
Forward Error Correction – Packets are redundantly transmitted, so that a lost packet
can be reconstructed from the subsequent packet
Transmitting voice in a packet network has some differences compared to data transmission.
Data is considered to be delay tolerant but loss sensitive, while voice tolerates loss but is delay
sensitive. That is why UDP is used to transport voice packets instead of the more traditional
34
TCP. There are many different sources contributing to the overall delay of the VoIP
transmission. Couple of examples are listed below:
Queuing delay, which occurs in different switches and routers where voice packets are
queued behind each other to be transmitted over the same outgoing link
Propagation delay occurs in a link and is the time signals require travelling from one
point in space to another.
To summarize the VoIP, it can be said to offer the efficiency of packet-switched networks and
at the same time it rivals the voice quality of circuit-switched networks. It creates cost savings
for users and operators. One of the main reasons why VoIP hasn‟t been popular with
telecommunication operators is the operator‟s need to maintain a healthy revenue flow
obtained from the circuit-switched voice traffic. However, the rapid decrease of the PSTN
revenues has increased the offering of VoIP. There are also companies, like Skype, who offer
free VoIP calls between users. Operators need to address this situation by developing
additional features and reliability to VoIP that customers would be willing to pay for. [27]
4.2.1 Session Initiation Protocol
NGN services use many different application layer protocols. Sessions Initiation Protocol
(SIP) is one of the most important protocols and it is used in many NGN services. That is why
a short introduction to SIP is provided.
SIP is a signalling protocol used in creating, modifying and terminating multimedia sessions
where data is exchanged between participants. It is also used to invite participants to already
existing sessions. Good examples of a session are a VoIP call or a video conference over IP.
SIP itself doesn‟t carry any media data but it allows media to be added or removed from the
35
existing session. It is an application level protocol that runs on any transport protocol. Like
HTTP, SIP also uses text-based messages. These messages are divided in two categories:
request from a client to a server, or a response from a server to a client.
The five different functionalities provided by SIP are listed below [28]:
1. User Location: Determines the end system that is going to be used in a communication.
2. User Availability: Determines the willingness of the called party to engage in
communications.
3. User Capabilities: Determination of media parameters to be used.
4. Session Setup: Establishment of session parameters at both the called and the calling
party.
5. Session Management: Transfer and termination of sessions, modifying session
parameters and invoking services.
4.2.3 IPTV
IPTV is considered to be one of the main drivers of NGN deployment. It is a new potential
source of revenue for telecom operators. IPTV in itself is not a replacement solution to any
particular NGN service, but because of its importance a short overview of its characteristics is
provided.
IPTV is primarily implemented by coding picture frames to IP packets and then multicasting
them in the network. At the transport layer IPTV uses UDP instead of TCP. The reason for
this is the same as with VoIP: to reduce delays. IPTV requires a broadband connection in
order to work properly. For example a High Definition Television (HDTV) approximately
requires a 20 Mbps connection per channel and in times of channel changes about 40
Mbps/channel is required for two channel streams. In the last few years the broadband Internet
36
has become more widely available and the number of IPTV subscribers is growing steadily as
well. In 2009, estimation was that by the year 2013 there would be 115.6 million IPTV
subscribers [29].
Figure 16 IPTV subscribers
Based on the data dated 2010, Europe has the largest IPTV subscriber base, but in other
countries, especially in China and the USA, the subscription amounts have grown rapidly. In
China the subscriptions have doubled during just one year [30].
Table 3 IPTV subscriptions top 10 countries
Country 2009Q1 2010Q1
France 7 066 000 9 018 305
USA 4 171 850 6 071 898
China 2 850 000 5 750 000
South Korea 1 450 407 2 576 663
Japan 1 340 608 1 861 127
Germany 740 000 1 522 500
Hong Kong 1 140 000 1 165 000
Russia 700 000 1 117 900
Italy 790 000 825 000
Spain 711 390 825 000
37
IPTV has many advanced services and features compared to the traditional cable or terrestrial
TV. One interesting feature is time shifting, that allows users to replay, pause, and rewind TV
broadcasts. Other important feature is the Video on Demand (VOD) service, which allows
users to browse and access different videos on the Internet.
4.2.4 Other NGN services
In addition to VoIP and IPTV, NGN provides multiple different services. The actual service
portfolio depends on the service provider, and this can vary in different countries or areas.
One good example of an NGN service is the CStream service provided by TeliaSonera in
Finland. CStream offers a two-way messaging channel for different information. The
messaging channels supported are listed below:
SMS
Fax
Voice Message
E-mail
To transmit information with this service, the user sends a text file containing the message
they want to send and an identification number of the receiving end (for example a phone
number, a fax number or an e-mail address). CStream then modifies this text file to the desired
format (SMS, fax page or voice message with text to speech technique) and sends it to the
receiver. The service has a web-based application where the received messages can be viewed.
38
CStream is a useful service in migration, because it can be used to replace traditional fax
services. It also enables businesses to manage their different messaging channels from the
same portal.
Before the implementation of NGN, the businesses handled their inner communications with
telephone switches. Typical products that operators offered to customers were 2 Mbps E1-
lines with ISDN PRI interface. This central line was then used to handle the company‟s
telephone calls. TeliaSonera offers a service called Sonera Office Communications to replace
2 Mbps E1s used by businesses. Sonera Office Communications offers a common platform for
all real-time messaging like voice calls, meetings, content sharing and instant messaging.
VoIP is used to provide voice calls in this service. There are also additional features, like
information about users present in the network. The Sonera Office Communications service
can be used with computers, laptops or with certain mobile devices.
These were just a few examples of different services enabled by the emergence of NGN. There
is a constant process going on to create new services and further improve the existing
products.
4.3 Wireless replacement solutions
This thesis mainly focuses on how the TDM network services are migrated into the fixed IP-
network. There are also situations in which a sufficient IP-product is not available, for
example when the whole wire network is replaced. In some cases it is more cost efficient and
practical to replace a TDM service with a wireless solution. That is why a short introduction of
different wireless services, used in replacing TDM services, is provided.
Probably the simplest example is to provide a traditional mobile phone subscription to replace
the POTS connection. Mobile phones have acceptable voice quality and provide additional
mobility compared to the POTS. The downside of this solution is that customers need to
39
change their telephone numbers because of the different numbering schemes between fixed-
and mobile networks.
TeliaSonera has implemented a service called Home Number, where the connection is based
on a mobile technology, but customers can still have their old telephone number. Basically
every Home Number subscription really has a mobile number but a network server converts it
to a traditional telephone number. Customers can use this subscription with a mobile phone or
with a phone that resembles a traditional landline phone. The drawback of this solution is that
it isn‟t suitable for all of the services the POTS were able to provide. For example a fax
service or a payment terminal can‟t be implemented with Home Number.
TeliaSonera has also developed a wireless replacement for telephone switches. Sonera Mobile
Centrex service offers a similar service to the traditional TDM switches. The only difference is
that it is implemented in a wireless environment. Between 5 and 200 mobile subscriptions can
be connected to the Mobile Centrex.
40
5. Migration to NGN
This chapter examines different reasons that why network migration must be done. The
reasons range from the decreased usage of traditional telephone services to increased usage of
data services. Migration can be done in different ways and these rely heavily on each other.
These different implementations are also described in this chapter.
5.1 Reasons for Network Migration
The network examined in this thesis was originally built to accommodate more than one
million telephone customers. During the last two decades, the mobile technology has evolved
rapidly, and that has led to a decrease in the usage of traditional telephone networks. Because
of that, the utilization levels of TDM equipment, like concentrators and switches, have also
decreased. That has led to decreasing profits.
Figure 17 The amount of Fixed- and mobile telephone subscriptions [31-32]