Page 1
i
ANALYSIS OF MILK CHAINS AND DETERMINANTS OF
PARTICIPATION IN PROCESSED DAIRY CHAINS BY SMALLHOLDER
DAIRY FARMERS IN MERU AND UASIN GISHU COUNTIES, KENYA
METTO CHEMUTAI VERONICA
A Thesis Submitted to the Graduate School in Fulfillment for the Requirements of the
Award of Master of Science Degree in Agricultural and Applied Economics of Egerton
University
EGERTON UNIVERSITY
OCTOBER, 2016
Page 2
ii
DECLARATION AND APPROVAL
Declaration
I hereby declare that this is my original work and has not been presented in this or any other
University for the award of a degree.
Signature …………………………………... Date…………………………………
METTO CHEMUTAI VERONICA
Registration Number: KM17/3007/11
Supervisors’ Approval
This thesis has been prepared under our supervision and submitted with our approval as
supervisors.
Signature…………………………………. Date………………………………
Prof. Ngigi W. Margaret
Department of Agricultural Economics and Agribusiness Management, Egerton University
…………………………………………… …………………………………….
Signature Date
Dr. Makokha N. Stella (PhD)
Kenya Agricultural and Livestock Research Organization (Nairobi)
Page 3
iii
COPYRIGHT
© 2016 Veronica Chemutai Metto
No part of this thesis may be reproduced or transmitted in any form or means, such as
electronic, mechanical including photocopying, recording or any information storage and
retrieval system without prior written permission of the author or Egerton University
All rights reserved
Page 4
iv
DEDICATION
This work is dedicated to my family and my children Andrew and Megan.
Page 5
v
ACKNOWLEDGEMENT
I thank the Almighty God for enabling me reach this far. My sincere appreciation also
goes to Egerton University for giving me an opportunity to pursue a Master’s degree. I wish to
also acknowledge with appreciation my University supervisors Prof. Margaret Ngigi and Dr.
Stella Makokha, for their technical advice, guidance, patience and encouragement throughout the
thesis writing period.
I also give my appreciation to the CMAAE secretariat and KALRO for funding and
supporting my research. I am thankful to the smallholder dairy farmers from Meru and Uasin
Gishu for their time and the information that guided my research. I acknowledge the staff of the
Department of Agricultural Economics and Agribusiness Management for their support since I
enrolled for my studies. I also give my gratitude to my course mates and my family for their
financial support throughout my studies.
Page 6
vi
ABSTRACT
The dairy sub-sector in Kenya is of particular importance as it provides vital
employment, income and nutrition, in an environment where job opportunities are scarce. The
subsector markets about 55 percent of the total milk produced but the informal sector accounting
for more than 75 percent of all the marketed milk. Large milk quantities are marketed through
the informal sector raising questions over the safety and quality of milk products. In spite of the
growth of value added milk chains in Kenya, unprocessed milk chains are still dominant. The
major milk processors in the country face a challenge of low capacity utilization during dry
seasons while during the rainy seasons milk is wasted due to limited capacity. This has led to the
growth of small scale milk processors and milk handlers in the country. This study compared
marketing margins along unprocessed and processed dairy chains and examined factors that
influenced actors’ decisions to upgrade processes, products as well as functions along selected
dairy chains. The study employed Probit and Tobit econometric models as well as principle
component analysis to answer the objectives. Using a sample of 273 respondents and farmer-
based self-help groups, the results of the probit analysis showed that smallholder dairy farmers
were more likely to add value to milk if they had value addition skills and if they were members
in a value addition group. The results of Tobit analysis showed that participation by smallholder
farmers in either the unprocessed or processed milk channel was significantly influenced by
distance to the market, the herd size, total farm revenue as well as awareness of standard
regulations. In the quest to upgrade the quality of milk, there is therefore need to improve on
value addition skills through training and encouragement of participation in collective action.
Furthermore, infrastructure in the form of roads, communication and electricity need to be
improved to facilitate improvement in the quality of milk.
Page 7
vii
TABLE OF CONTENTS
DECLARATION AND APPROVAL .......................................................................................... ii
COPYRIGHT ............................................................................................................................... iii
DEDICATION.............................................................................................................................. iv
ABSTRACT .................................................................................................................................. vi
TABLE OF CONTENTS ........................................................................................................... vii
LIST OF TABLES ........................................................................................................................ x
LIST OF FIGURES ..................................................................................................................... xi
LIST OF ACRONYMS AND ABBREVIATIONS .................................................................. xii
CHAPTER ONE: INTRODUCTION ......................................................................................... 1
4.1 Background Information .................................................................................................. 1
1.2 Statement of the problem ................................................................................................. 3
1.3 Objectives of the study..................................................................................................... 3
1.3.1 General objective ...................................................................................................... 3
1.3.2 Specific Objectives ................................................................................................... 3
1.4 Research questions ........................................................................................................... 4
1.5 Justification of the study .................................................................................................. 4
1.6 Scope of the study ............................................................................................................ 4
1.7 Operational definitions of terms Figure 1: Map of Meru county,.................................... 4
CHAPTER TWO: LITERATURE REVIEW ............................................................................ 6
2.1 Value addition concept .................................................................................................... 6
2.2 Value chain upgrading ..................................................................................................... 6
2.3 Determinants of participation in value added channels ................................................... 9
2.4 Determinants of participation in a channel .................................................................... 10
2.5 Theoretical framework ................................................................................................... 12
2.5 Probit model ................................................................................................................... 12
2.6 The Tobit model ............................................................................................................. 13
2.7 Conceptual framework ............................................................................................................ 15
CHAPTER THREE: METHODOLOGY ................................................................................ 16
Page 8
viii
3.1 Study Areas .................................................................................................................... 16
3.2 Uasin Gishu County ....................................................................................................... 16
3.3 Meru County .................................................................................................................. 17
3.4 Sampling procedure ....................................................................................................... 19
3.5 Data and Data Collection Methods ................................................................................ 19
3.6 Data Analysis ................................................................................................................. 19
3.7 Analytical framework .................................................................................................... 20
3.8 Principle component and cluster Analysis (PCA) ......................................................... 20
3.9 Marketing margin (MM) analysis .................................................................................. 21
3.10 Probit model specification ............................................................................................. 22
3.11 The Tobit model specification ....................................................................................... 23
CHAPTER FOUR: RESULTS AND DISCUSSIONS ............................................................. 24
4.1 Introduction .................................................................................................................... 24
4.2 Characteristics of dairy farmers ..................................................................................... 24
4.3 Value addition by individual smallholder dairy farmers ............................................... 27
4.4 Demographic and socio-economic comparison of farmers who add value to milk ....... 28
4.5 Challenges faced by dairy farmers ................................................................................. 29
4.6 Description of selected value addition groups ............................................................... 31
4.7 Upgrading activities of the farmer groups ..................................................................... 32
4.8 Value addition activities by the farmer groups .............................................................. 33
4.9 Market margin analysis .................................................................................................. 34
4.10 Relationship between value addition and market margin .............................................. 35
4.11 Gross margin analysis of selected farmer groups .......................................................... 35
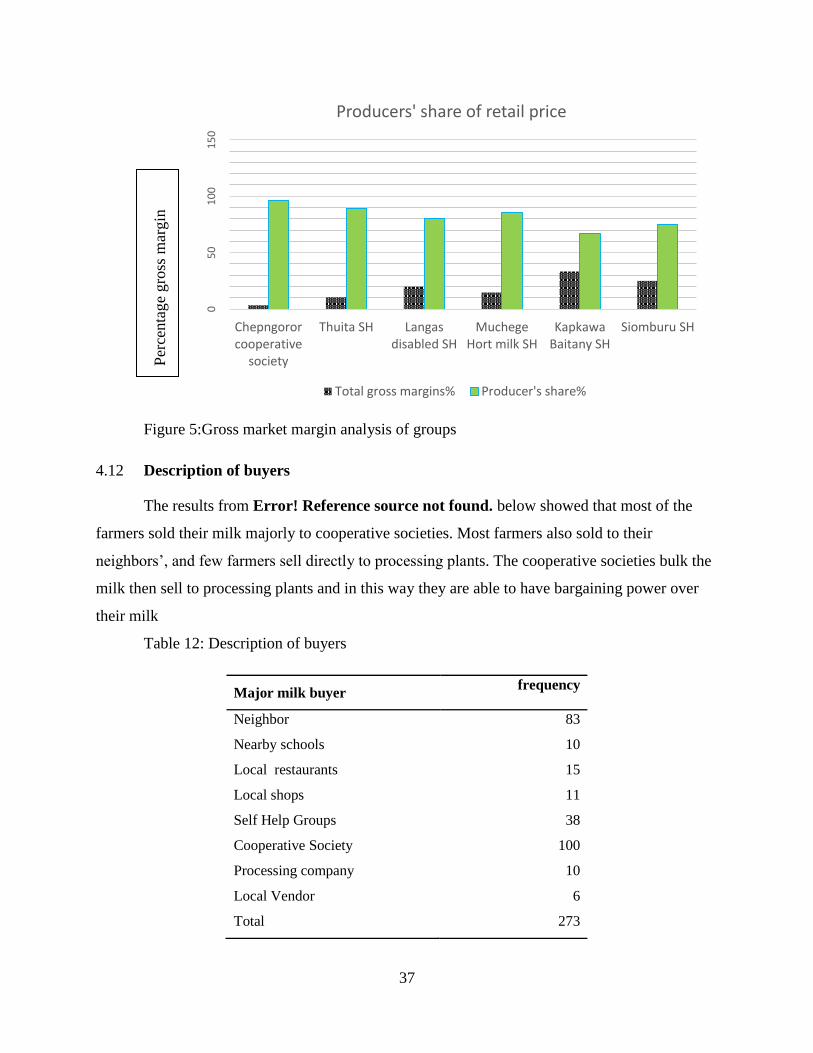
4.12 Description of buyers ..................................................................................................... 36
4.13 Analysis of production cost ........................................................................................... 37
4.14 Factors influencing decision by smallholder dairy farmers to upgrade milk products .. 37
4.15 Determinants of participation in a processed or unprocessed milk channel .................. 39
4.16 Determinants of participation in the selected value addition groups ............................. 41
CHAPTER FIVE: CONCLUSION AND RECOMMENDATIONS ..................................... 44
5.1 Conclusions .................................................................................................................... 44
Page 9
ix
5.2 Recommendation ........................................................................................................... 44
5.3 Area for further research ................................................................................................ 45
REFERENCES ............................................................................................................................ 46
APPENDIX .................................................................................................................................. 51
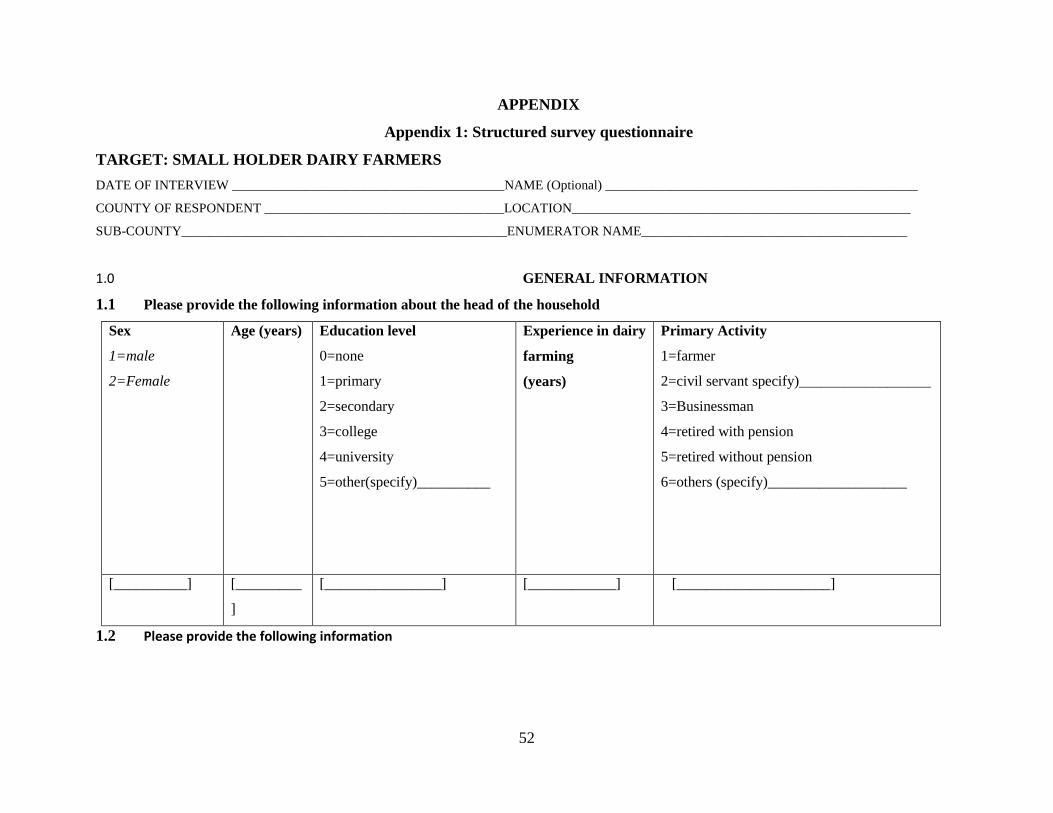
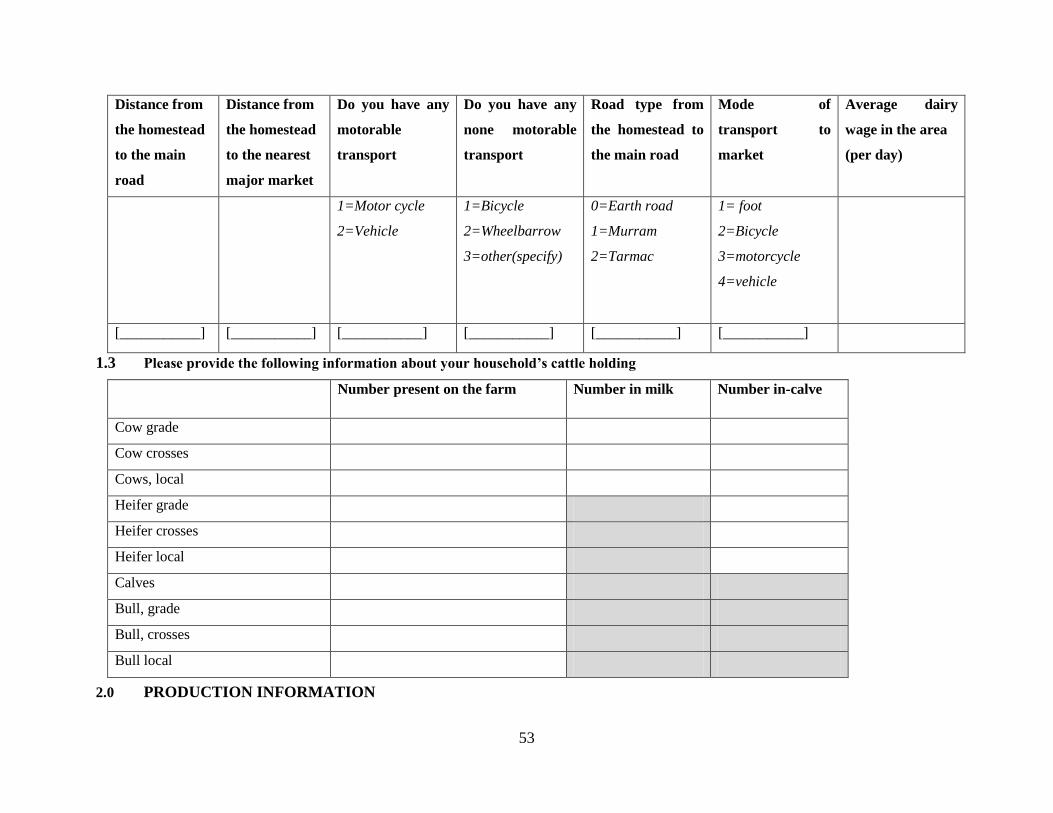
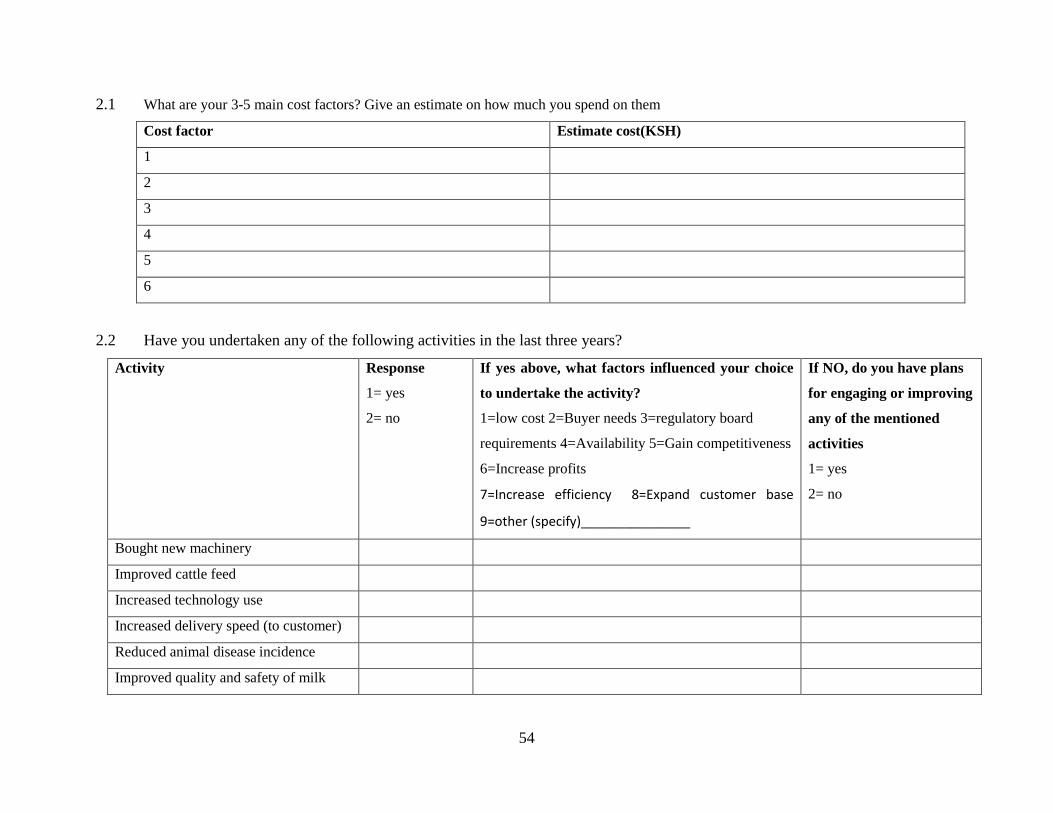
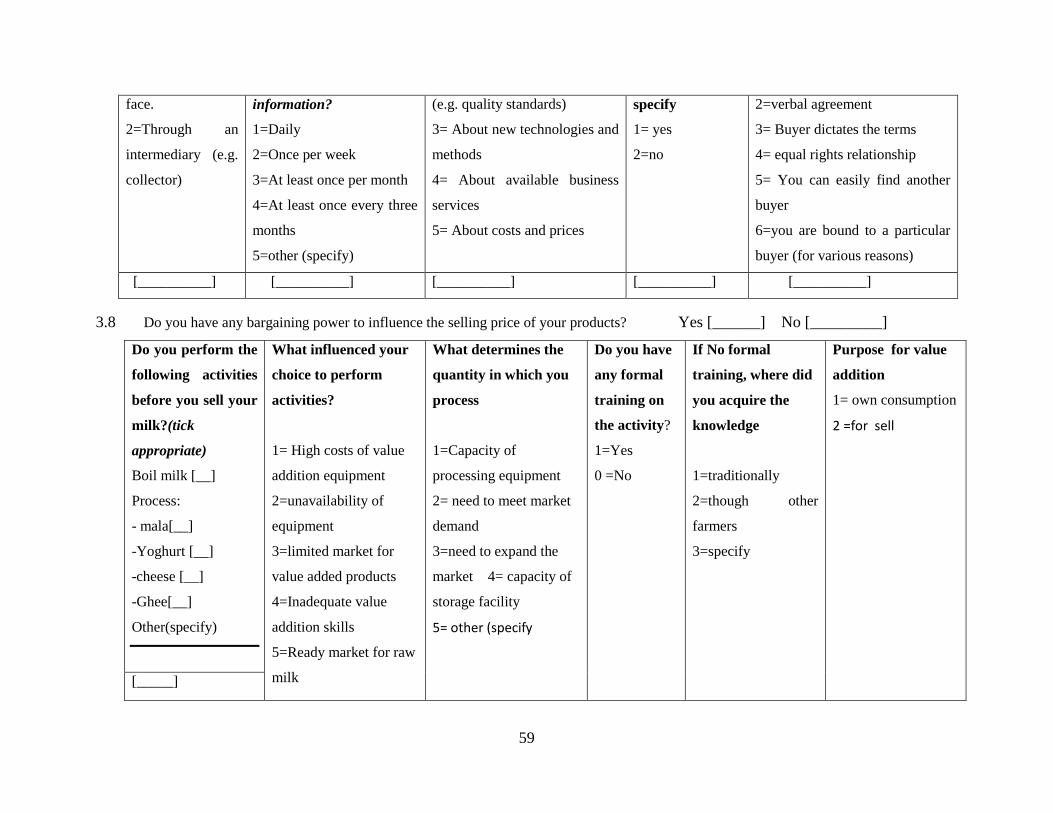
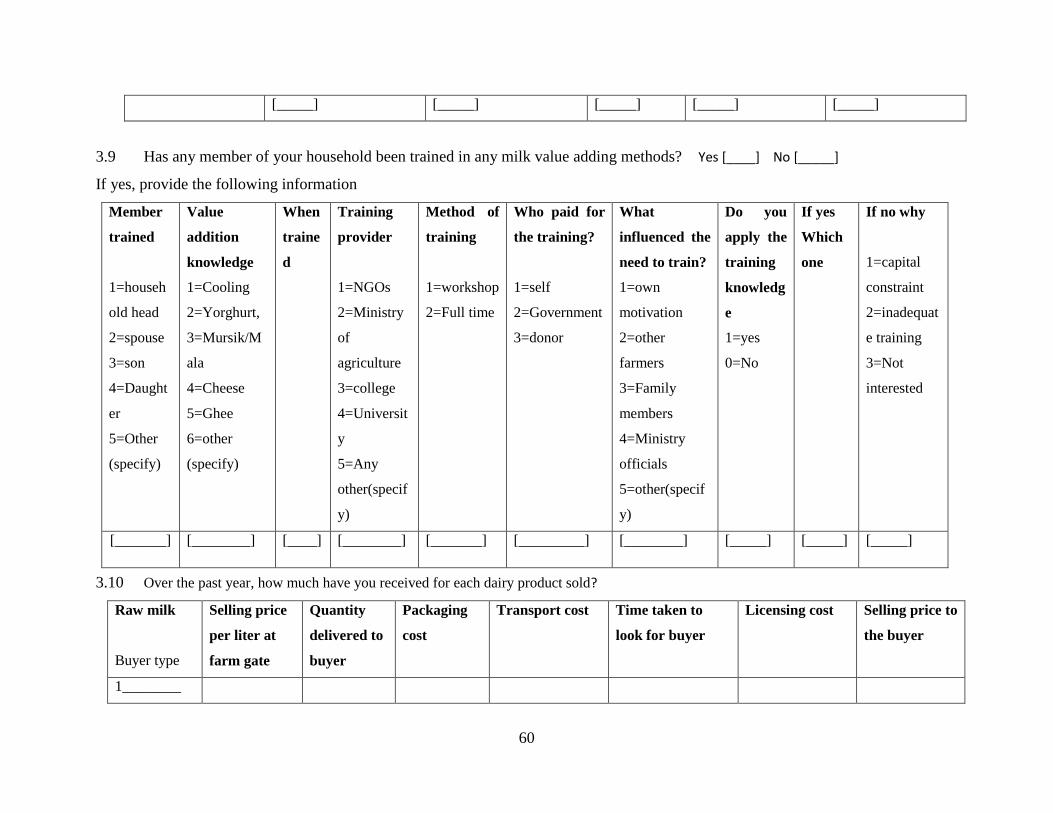
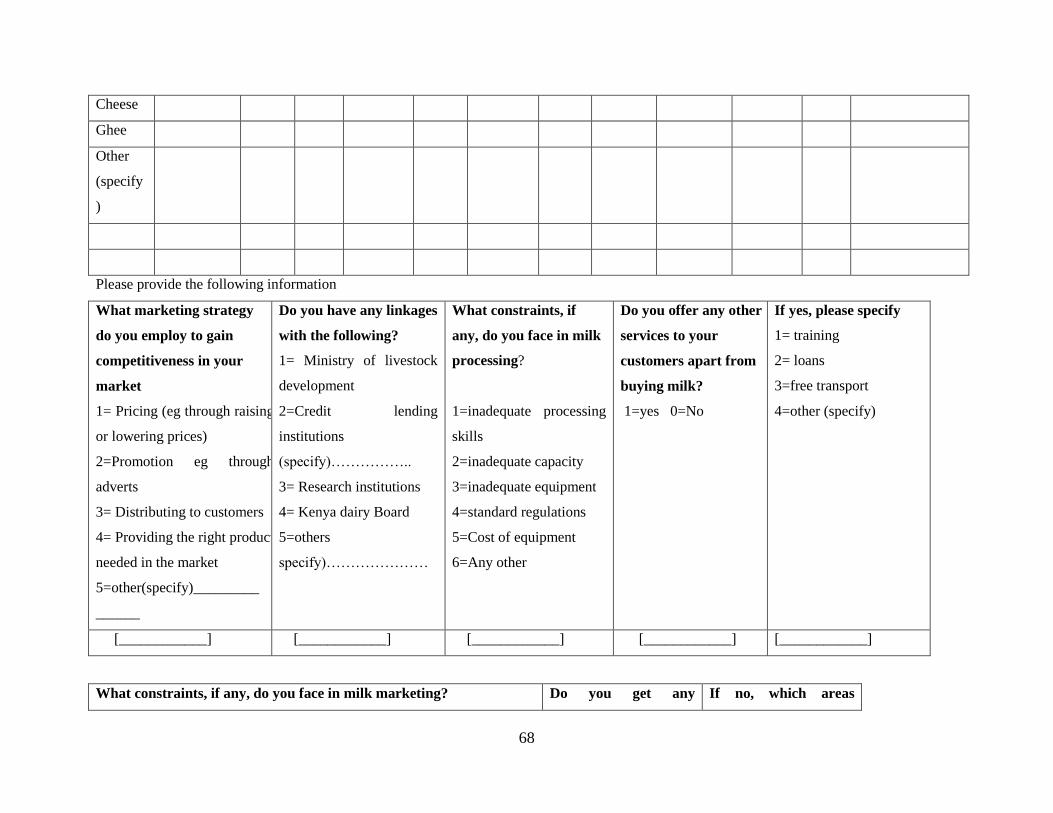
Appendix 1: Structured survey questionnaire ......................................................................... 51
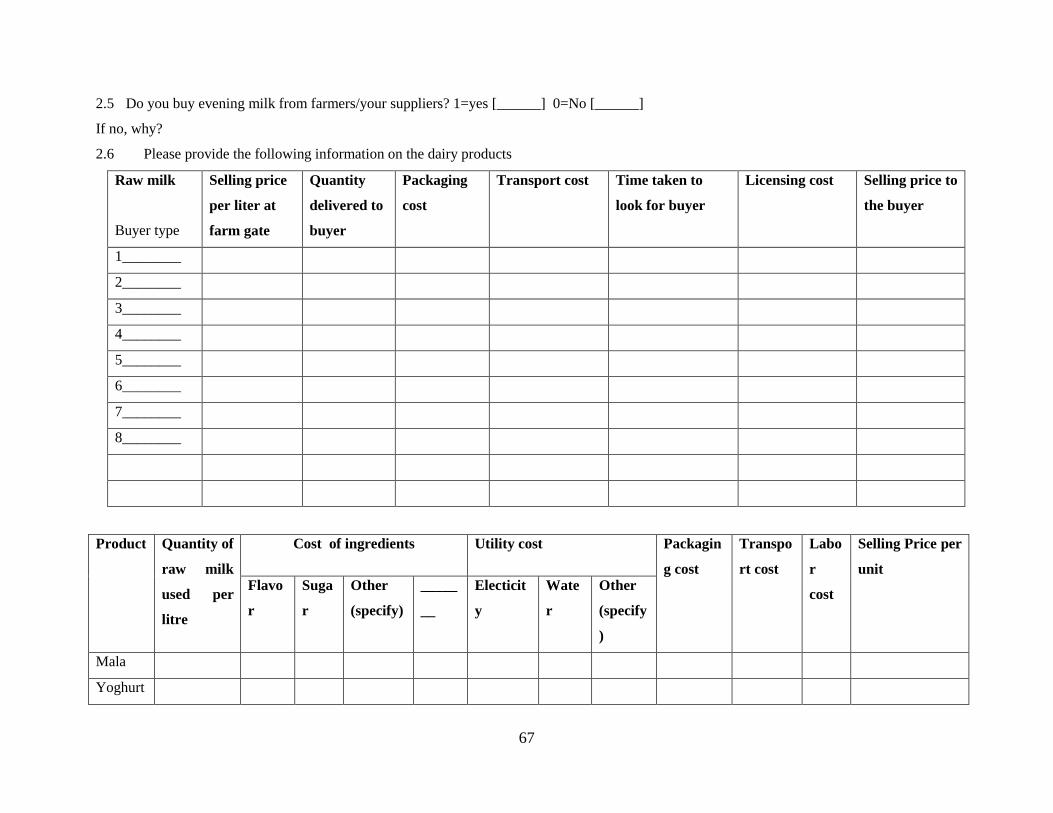
Appendix 2: survey questionnaire: Self-help groups ............................................................... 62
APPENDIX 3: Probit regression results ................................................................................... 69
APPENDIX 4: marginal effects after probit ............................................................................ 70
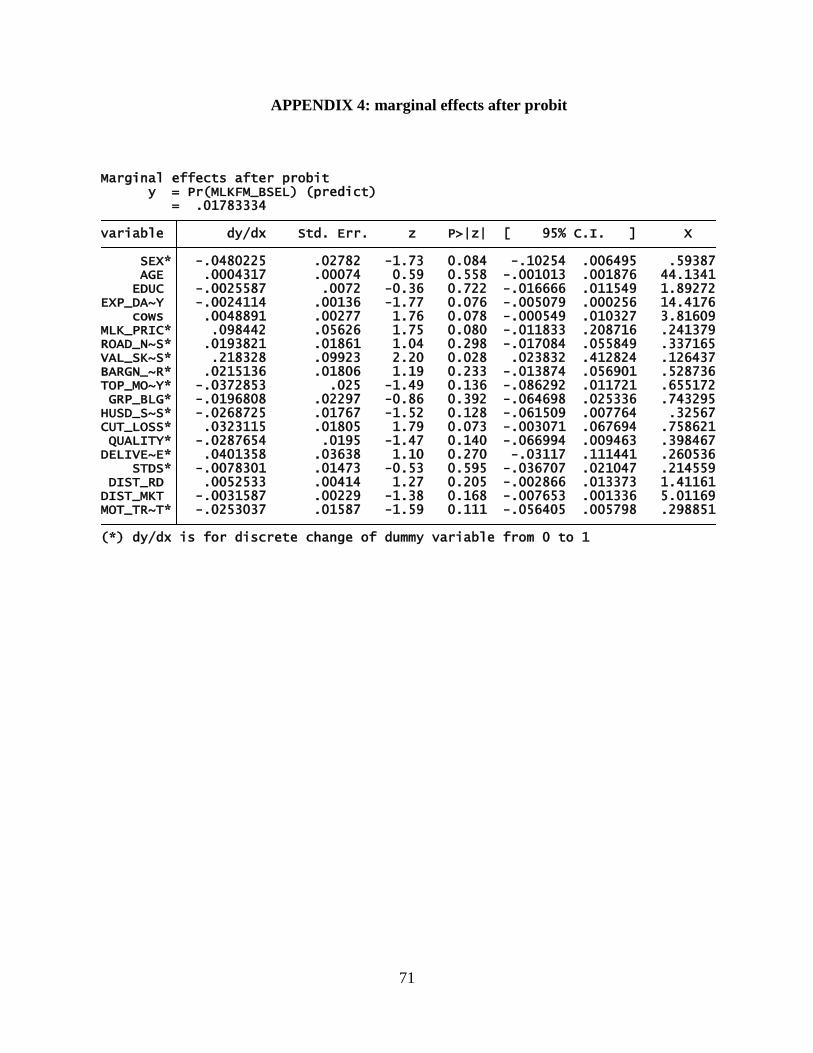
APPENDIX 5: Tobit regression results .................................................................................... 71
APPENDIX 6: Marginal effects after Tobit ............................................................................. 72
APPENDIX 7:Probit results ...................................................................................................... 72
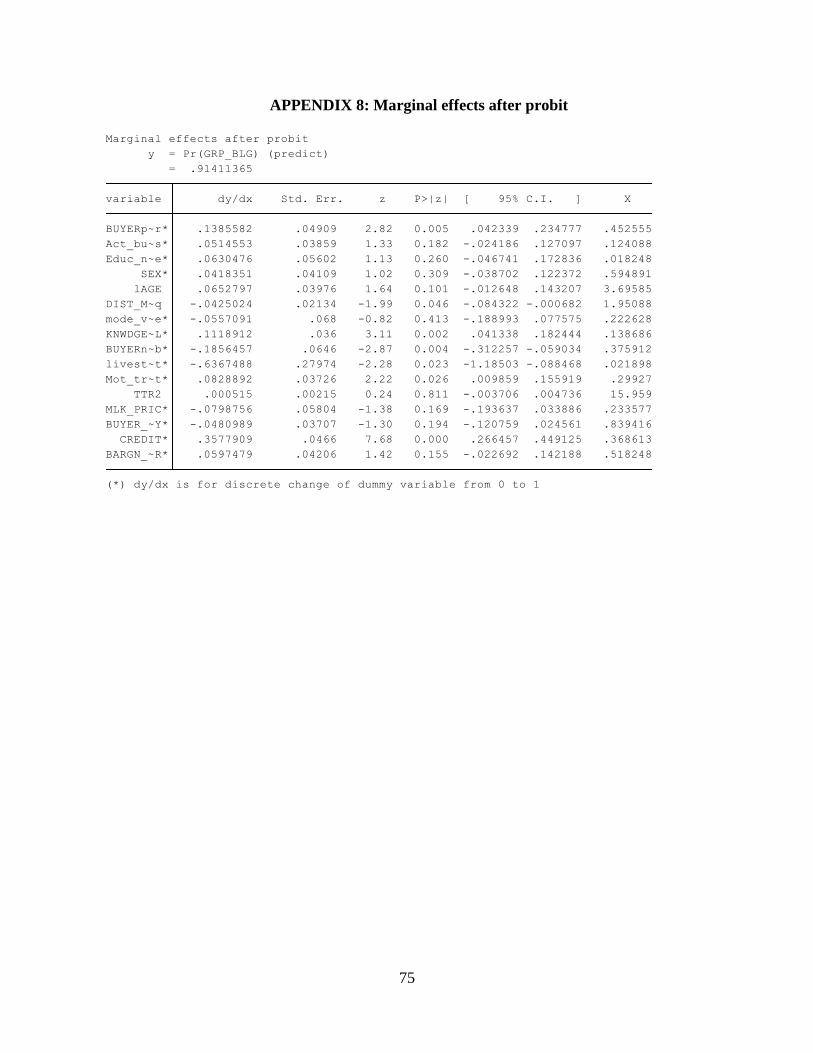
APPENDIX 8: Marginal effects after probit ............................................................................ 74
Page 10
x
LIST OF TABLES
Table 1: Demographic characteristics of farmers ......................................................................... 25
Table 2: Socio economic characteristics of the respondents ........................................................ 27
Table 3: Value addition by smallholder farmers........................................................................... 28
Table 4: Comparison of farmers who add value and those who do not ........................................ 29
Table 5: Challenges faced by smallholder dairy farmers .............................................................. 30
Table 6: PCA analysis: Rotated component matrix ...................................................................... 31
Table 7: Descriptive analysis of selected groups .......................................................................... 32
Table 8:Upgrading decisions by farmer groups ............................................................................ 33
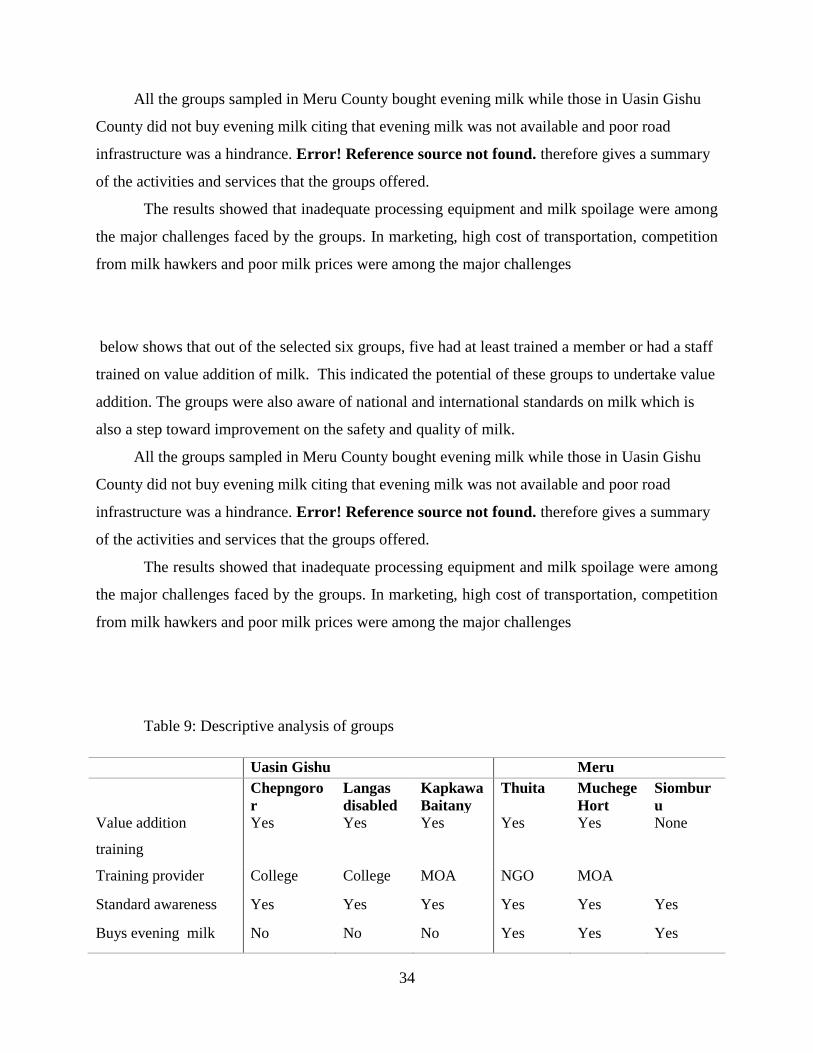
Table 9: Descriptive analysis of groups ........................................................................................ 34
Table 10: Market margin Analysis of unprocessed channel ......................................................... 34
Table 11: Market Margin Analysis of processed dairy chain ...................................................... 35
Table 12: Description of buyers .................................................................................................... 36
Table 13: Main cost factor in production ..................................................................................... 37
Table 14: Probit Model results: Determinants of Upgrading........................................................ 38
Table 15 Tobit Model results ........................................................................................................ 40
Table 16: Probit Model analysis. Determinants of participation in selected self help groups ...... 42
Page 11
xi
LIST OF FIGURES
Figure 1:conceptual framework .................................................................................................... 15
Figure 2 Map of Uasin Gishu County ........................................................................................... 17
Figure 3: Map of Meru County ..................................................................................................... 18
Figure 5:Gross market margin analysis of groups ........................................................................ 36
Page 12
xii
LIST OF ACRONYMS AND ABBREVIATIONS
KDB – Kenya Dairy Board
GDP- Gross Domestic Product
SDP-Smallholder dairy Project
FAO-Food and Agricultural Organization
USAID- United States Agency for International Development
UNIDO-United Nations Industrial Development Organization
IFAD-International Fund for Agricultural Development
PCA- Principle Component Analysis
SPSS-Statistical Package for Social Sciences
KM-Kilometer
KES-Kenya shillings
Page 14
1
CHAPTER ONE: INTRODUCTION
4.1 Background Information
Kenya’s economy is largely agricultural. The agriculture sector accounts for 26 percent
of the gross domestic product (GDP) and 60 percent of export earnings. The sector directly and
indirectly employs more than 80 percent of the population (World Bank, 2009). There are over
one million smallholder farmers who contribute up to 75 percent of the total agricultural output
and 70 percent of the marketed agricultural output (SDP, 2005)
The dairy subsector in Kenya is rated as one of the fastest growing subsectors in Kenya,
faster than even tea. It plays an important role in the national economy and in the socio-
economic development of many rural households in Kenya. It contributes to about 14 percent of
the agricultural GDP and 4 percent of Kenya’s GDP as shown by statistics by the Kenya Dairy
Board (KDB, 2014). Milk, which is a major product of the dairy sub sector, is valued by many
families in Kenya due to its nutritional contribution especially to children. The subsector
contributes more to livelihood of many Kenyans through employment, directly and indirectly,
along its value chains and to nutrition. The subsector has had tremendous growth over the past
years with research showing that for the periods between 2002 and 2010, volumes of milk
processed have increased from 144 million litres to 516 million litres while milk production is
estimated to be 4.1 billion litres per year (KDB, 2014). This shows that out of the total milk
produced per year a very small percentage is processed. Annual per capita milk consumption in
Kenya is estimated at 115 litres per individual which translates to an approximate of 5 billion
litres per annum. This therefore means that there is limited surplus milk for exports (FAO 2007).
The Kenyan dairy sub-sector has had significant changes since the industry was
liberalized in 1992 (Karanja, 2003).The subsector markets about 55 percent of the total milk
produced with the informal sector accounting for more than 75 percent of all the marketed milk
(FAO 2011). Since large milk quantities are handled by the informal sector which is unregulated,
questions have been raised over the safety and quality of milk products with research showing
milk products handled by traders in Kenya having high bacteria levels (Omore et al., 2011).
Increased safety standards and consumer trusts as well as climate change continue to be a
challenge in the dairy sub-sector. Production is costly and characterized by very low input use
but this varies according to the degree of commercialization by a farmer. Muriuki (2011) showed
that feed represented the largest part of the cost of milk production in Kenya and that there were
Page 15
2
no effective mechanisms to assure farmers of the quality of feeds in the markets. Research done
in Kenya shows that cows are generally underfed, causing low milk production per cow (FAO
2011).
Kenya’s milk surplus is concentrated in regions where milk production is high and much
of the milk not absorbed into informal and formal channels goes to waste for lack of storage
facilities. According to 2009 statistics, there were 52 milk processors in Kenya of which only 34
were active (FAO 2011). The major milk processors face the challenge of capacity utilization of
as low as 40 percent with most of the processors constantly looking for new milk sources to fill
processing plants to capacity (Technoserve, 2008). Other actors involved in the marketing of
milk are distributers and retailers.
A value chain perspective shifts focus of agriculture from production alone to a whole
range of production activities from designing to marketing and consumption. Many policy
makers have emphasized the need for developing a market oriented and market led opportunities
along the entire value chain ( (USAID, 2010), (IFAD, 2010), and (UNIDO, 2009a). Production
driven by demand requires improved market literacy of producers as a prerequisite for access to
niche markets e.g. supermarkets (Reardon, et al., 2004) but this remains a challenge for small
scale farmers.
Upgraded value chains are characterized by high technological capabilities, skills and
specialization. Dairy products from these chains are pasteurized and packaged before marketing
thus tend to serve niche markets, such as supermarkets, which are characterized by stringent
standards for quality. According to (Giuliani, Pietrobelli, & Rabelloti, 2005) traditional
manufacturing industries are characterized by a low degree of technology use. Traditional
processes such as boiling and fermentation of milk are some of the ways in which participants in
the dairy value chain use to add value to the milk products (Makita et al., 2011).
According to (UNIDO, 2009b) upgrading involves increasing technological know-how
and management abilities of the involved parties so as to enable effective participation in value
chains. Upgrading a value chain therefore means not only acquiring knowledge and technologies,
but at a faster pace than other actors in competing chains so as to have a competitive edge. There
is therefore a need to shift focus and study the unprocessed milk and processed dairy chains and
ways of improving processes, products as well as functions. Traditional value addition have
opportunities to increase volumes of milk marketed with less stringent standards (UNIDO,
Page 16
3
2009b) and comprise of majority of smallholder farmer thus giving opportunities for broad-based
rural development. It is therefore imperative to study the two value chains, compare marketing
margins and characteristics and identify the key drivers of upgrading decisions along the dairy
channels in terms of specific factors in each selected value chain.
1.2 Statement of the problem
Research shows that consumers are willing to pay for high quality and safe milk
products, hence the reason for increased demand for value addition. Varieties of dairy products,
to suit different needs by consumers, have emerged in the Kenyan market necessitated by
changes in taste, increase in income and exposure. Despite this, unprocessed milk is still
dominant in the market indicating minimal value addition is done.
The unprocessed milk and processed milk value chains may offer different opportunities
for development and improvement of the overall dairy sub sector, however, little has been done
in terms of characterizing and comparing the unprocessed milk value chains with the processed
dairy value chains. It is not clear whether the marketing margins received by actors from
unprocessed milk and processed marketing channels differ hence this research proposes to
provide this information. There is no sufficient information on factors that influence upgrading
and participation decisions by actors along unprocessed and processed dairy chains in Kenya;
hence opportunities for efficiency and development that are available in the dairy value chains
have not been sufficiently explored.
1.3 Objectives of the study
1.3.1 General objective
To contribute towards improved value addition and marketing of milk by smallholder dairy
farmers and market agents
1.3.2 Specific Objectives
1. To characteristics processed dairy chains and unprocessed dairy chains in Meru and
Uasin Gishu counties
2. To analyze the determinants of smallholder actor’s participation in unprocessed milk
value chains and processed dairy chains in Meru and Uasin Gishu Counties
3. To compare the cost structures and marketing margins along processed and unprocessed
milk marketing channels in Meru and Uasin Gishu Counties
Page 17
4
4. To determine the factors that influence the decisions to upgrade by actors along the
selected dairy chains in Meru and Uasin Gishu counties
1.4 Research questions
1. What are the characteristics of raw milk and value added milk chains in Meru and Uasin
Gishu counties?
2. What are the determinants of smallholder farmer participation in unprocessed and value
added dairy chains?
3. How do cost structures and gross margins vary along raw and value added milk
marketing channels?
4. What are the factors that influence upgrading decisions by actors along raw and value
added dairy chains in Meru and Uasin Gishu counties?
1.5 Justification of the study
Analyzing and examining factors influencing upgrading decisions in the dairy chain
allows for identification of interventions along the chain likely to provide improved incomes in
line to benefits to low-income households. The identification of information on actor
participation, costs, gross margins and, markets, marketing opportunities and challenges can
enable formulation of intervention pathways and policies for developing the dairy value chains.
The two regions were selected because they had significant production on milk and had potential
markets.
1.6 Scope of the study
The study will only be conducted in Meru and Uasin Gishu Counties along selected dairy
value chains and only the actors within the selected dairy value chains and dairy farmers within
the regions will be targeted in this research. The research will also be limited to cow’s milk
analysis. The two regions were selected because
1.7 Operational definitions of terms
Upgrading:
This means acquiring the technological, institutional and market capabilities that allow
actors to improve their competitiveness and move into higher-value activities. Actions that
upgrade or increase the competitiveness of a value chain can take many forms and include
improving product quality through value addition, adding more operations to the value chain,
Page 18
5
bringing value chain operations into a country from overseas, capturing a new market channel,
and entering a separate value chain (new market) with a similar product
Value added dairy chains:
These are value chains that handle processed milk from which a wide range of dairy end
products are obtained such as yoghurt, ghee and cheese. These processes could either be
traditional or upgraded
Unprocessed milk value chains:
In this study, unprocessed milk value chain is a dairy chain that handles milk in its raw (fresh)
form and no value addition has been made to change the form or taste of the product along the
chain
Value addition:
Value addition refers to an innovation that enhances or improves an existing product or
introduces new products or new product uses
A vulnerable group: It is a group whose membership includes women, youth, female headed
households or HIV/AIDs affected
Small holder actors: they are actors along the dairy value chains including farmers who own
less than 3 dairy cows, market agents and processors with limited capital investments
Page 19
6
CHAPTER TWO: LITERATURE REVIEW
2.1 Value addition concept
A value chain is full range of activities which are required to bring a product or service
from conception through different phases of production, processing and delivery to the final
consumer and then finally to the disposal after use’ (Kaplinsky, 2000:Kaplinsky et al.,
2001:Kaplinsky & Morris, 2000).Value chains include all of the vertically linked, interdependent
processes that generate value for the consumer, as well as horizontal linkages to other value
chains that provide intermediate goods and services (Webber & Labaste, 2010)
Agricultural value chains are divided into five stages which include production,
distribution, processing, marketing and consumption. Value addition can be in form of product or
process innovation such as new varieties, new formulations, new presentations, entirely new
manufactured products. Improved technology in production or manufacturing practices,
certification, traceability, identity preservation, or branding are another major way to add value
(Webber & Labaste, 2010). Small holder dairy value chain on the other hand comprises a
production stage, collection and bulking, cooling, processing, packaging, distribution, wholesale
and retailing.
Value-chain analysis investigates the complexity of the actors involved and how they
affect the production to consumption process. It incorporates production activities (cultivation,
manufacturing and processing), non-production activities (design, finance, marketing and
retailing), and governance (Bedford et al., 2001).
Value addition refers to an innovation that enhances or improves an existing product or
introduces new products or new product uses (Fleming, 2005). It is the act of adding value(s) to a
product to create form, place, and time utility which increase the customer value offered by a
product or service. Value addition and diversifying food exports depends not only on changing
production and processing systems, but also on linking to appropriate marketing networks
2.2 Value chain upgrading
According to (Humphrey & Schmitz, 2002), upgrading refers to a shift in activities by
producers in an effort to increase their incomes in the face of globalization and competitive
pressures. This can be through increasing the skill content of activities and/or moving into
market niches which have entry barriers and are insulated to some extent from these pressures.
Measures that result in cluster upgrading include credit access, research and development,
Page 20
7
strengthening technological capacities, diffusion of knowledge and information, building trust
among cluster members, support to contracting with suppliers and linking up with traders and
access markets (UNIDO, 2009a)
(Humphrey & Schmitz, 2002), distinguished between different types of upgrading;
Process upgrading: transforming inputs into outputs more efficiently by re-organizing the
production system or introducing superior technology. Product upgrading: moving into more
sophisticated product lines (which can be defined in terms of increased unit values). Functional
upgrading: acquiring new functions (or abandoning existing functions) to increase the overall
skill content of activities and inter-sector upgrading: firms of clusters move into new productive
activities
Global coordination, according to (Humphrey, 2004), can affect possibilities for
upgrading by agricultural and manufacturing producers and traders in developing countries
through acquisition of technological capabilities, market access and also access to particular
channels. He argued that entry into global value chains has a positive impact on technological
capability and upgrading since it promotes learning and specialization in production by firms in
developing countries. Furthermore, he suggested that the increasingly stringent requirements of
global buyers in areas such as quality and delivery may offer firms opportunities to add value to
products.
Horizontal coordination, according to (Mitchel, Coles, & Keane, 2009) is a prerequisite
for other forms of upgrading because it allows producers to achieve economies of scale in
supplies and to reduce transaction costs while vertical coordination is important because it can
result in greater certainty about future revenue flows for poor participants. According to (Da
Silva, 2005), entering into contracts facilitates vertical coordination in food and agriculture as
explained by transaction cost economics where the increased adoption of contracting worldwide
can be regarded as a rational response of supply chain actors seeking to minimize their
transaction costs.
Membership in a credit organization affords farmers to make necessary investments in
order to upgrade for quality and meet standards of a sustainable marketing channel (Angula,
2010) while finance availability can be an incentive for contracts that ensure supply, as well as
provide working capital that producer needs to upgrade a product to meet a buyer’s standards.
Fries & Akin, (2004) proposed a value chain financing that is more on seasonal working capital
Page 21
8
rather than longer term investment capital, is more likely to facilitate product upgrades than
process upgrades.
According to a Probit analysis by ( Sinja, et al., 2006), belonging to a group increases the
probability of a trader being established in informal milk marketing since he/she incurs fewer
milk loses in the business, is able to handle bigger volumes of milk and fetch higher prices for
the milk and meets requirements by the regulatory institutions. This will more likely lead to an
increase in the incomes of such type of traders than for those not in groups
Chain governance is likely to influence a firm’s upgrading chances while quasi-
hierarchical chain governance has been associated with fast process and product upgrading in
developing country firms according to (Schmitz, 2005), mainly because global buyers need to
ensure that the manufacturing capabilities of their suppliers comply with their exact requirements
in an ever increasing global competitive environment (Giuliani et al., 2005:Humphrey &
Schmitz, 2002)
In studies done in Kenya and Madagascar, country specific factors such as wage and
capital costs, reliability and cost of infrastructure, ease of logistics and factors affecting ease of
business, the location of final markets as well as ownership were shown to influence the
decisions to upgrade value chains (Kaplinsky & Wamae, 2010).
The degree of cumulativeness, appropriateness, of knowledge, codification and
complexity of the knowledge base influences the capacity and ways in which firms upgrade as
found in a likert scale quantification by Giuliani, et al., (2005). Specific knowledge is critical for
upgrading products and processes while the upgrading opportunities of local enterprises differ
according to the type of value chain they feed into that is, the way trade is organized matters
according to (Schmitz, 2005).
According to (Navas-Aleman, 2011), firm size and age are not associated with product or
process upgrading while there was evidence of a positive relationship between functional
upgrading and the age of the firm while there is a potential for domestic and neighboring markets
to influence industrial upgrading.
The above researchers have looked at different aspects of upgrading; however none have
focused attention on factors that influence decisions to upgrade products, processes and functions
along agricultural value chains and more specifically on small holder dairy farmers in Kenya.
Page 22
9
Hence the question arises whether smallholder farmers will always be smallholders or can they
to upgrade themselves to earn more?
2.3 Determinants of participation in value added channels
In a study on the extent of value addition in honey production, (Berem, Obare, & Owuor,
, 2010)employed a Heckman two stage model and concluded that value addition in honey was
significantly influenced by household heads’ age, the amount of time spent in off farm activities,
group membership, household education level, measured by the years of schooling, and
household size
(Kumar, Staal, & Singh, 2011) used a logit model to identify drivers that could induce
milk market agents’ participation in processing in India and he found out that education,
experience in milk trading and sole dependence on milk trading for livelihood influence
positively the decision to participate in a milk value chain. He further argued that traders who
solely depend on milk marketing have a higher propensity to adopt milk value addition to
maximize their income, while age and household size influenced value addition decisions
negatively.
According to a research done in Ethiopia, a Heckman two stage model was used to
identify the determinants of participation and the level of participation in firm-level value
addition. It was found out that milk yield, distance from urban centers, household demography
(age and presence of a child), livestock extension services, the need to extend shelf life,
consideration of milk products for social factors such as holidays and fasting, and availability of
labor for milk value addition determined household’s decision to add value to milk (Berhanu et
al., 2011)
Findings by (Jari, 2009) showed that good storage facilities is positively correlated with
value addition mainly because it reduces loss of produce and urgency of selling and while results
from a Multinomial Logistic regression showed that institutional and technical factors such as
access to market information, expertise on grades and standards, availability of contractual
agreements, existence of extensive social capital, availability of good market infrastructure,
group participation and reliance on tradition to influence market participation choice. Consumer
demand, according to (Schipmann., 2006) is a determining factor for the kind, amount and
quality of a wide range of products; therefore consumer’s esteem of a certain product determines
its possible price and the potential value adding to the net product within a chain
Page 23
10
Market information, according to (Ruijs et al., 2004), allows farmers to make informed
marketing decisions that are related to supplying necessary goods, searching for potential buyers,
negotiating, enforcing contracts and monitoring. Necessary information includes information on
consumer preferences, quantity demanded, prices, produce quality, market requirements and
opportunities. Lack of information on prices, lack of linkages between farmers and other market
actors, credit constraints and other market imperfections lead peasants to sell their crops at the
farm gate to intermediaries, often at a low price, and to not take advantage of market
opportunities.
2.4 Determinants of participation in a channel
In the Kenyan maize subsector, a farm gate to consumer value chain analysis conducted
by (Kirimi, et al., 2011) found that proximity to demand centers and access to markets are
important determinants of smallholder farmers’ ability to participate in markets, however limited
land and capital are the primary constraints preventing the majority of smallholder farmers to
enter into commercialized production.
Knowledge on grades and standards influences the possibility of smallholder farmers to
get contracts to supply to certain channels that are governed by high quality standards (Benfica et
al., 2002).The legal environment, such as through licensing also influences decisions to
participate in a marketing channel since it influence transaction costs. Effective legal institutions
may improve the organization of the marketing channels and decrease marketing costs. Presence
of institutional arrangements such as supply contracts also influences the farmers’ decision to
sell to a particular channel.
Staal et al., 2006, applied a conditional logit model to determine farmers’ decision to
participate in alternative milk markets in Gujarat, India, and found out that there was a continued
preference for direct sales from producers to buyers in spite of the high transaction costs
associated with this choice. The results further indicated that households were less likely to
select channels that paid cash, or that took milk on informal credit. Conversely, channels that
offered monthly payment or provided formalized credit terms were more likely to be selected.
Ohajianya & Ogochukwu , 2011, employed an ordered probit analysis to find out factors
related to fixed and variable transaction costs that influenced decisions to participate in sweet
potato markets in Nigeria. They found out that that marketing experience, farm size, membership
Page 24
11
of cooperatives/social organizations, extension contact, farming experience and road conditions
to the nearest town had a positive relationship with market participation
According to Gebremedhin & Jaleta, 2010, market orientation strongly translates into
market participation however the determinants of market participation were shown to be
different from the determinants of market orientation. The determinants of market participation
include distance to the market and the degree of market orientation of the farmer and the value of
produce while the determinants of the extent of market orientation are related to household
characteristics, market access, and technical support by the extension service.
Collective action has also been shown to influence decisions to participate in a channel
due to increased bargaining power and reduced transaction costs (Kherallah and Minot, 2001).
Reduced marketing costs through improved organization of the marketing channels results in
economies of scale, improve access to resources such as inputs, credit, training, transport and
information, increase bargaining power and facilitate certification and labeling (Negassa, 2009)
High transaction costs has been shown to hinder market access hence significantly
influencing the decisions to participate in a channel (Ruijs., 2004), (Kyeyamwa, 2007), (Ouma &
Jagwe, 2010); while transaction costs related to the geographical location of a household, market
information and distance to the nearest urban centre also influences participation decisions
(Alene,et a.,, 2007)
Olwande & Mathenge, 2010, showed, by use of a double hurdle model, that there is a
strong relationship between market participation and existing poverty among farmers dealing
with selected commodities (maize, vegetables, fruits and dairy). He concluded that the poor have
lower production volumes and thus lower market participation.
A truncated regression model was applied by (Omiti et al., 2009) to find out the factors
that influence the intensity of smallholder farmer participation in Kenya and results showed that
farmers in peri-urban areas sold a higher proportion of their output and distance to the market
was found to be significantly influencing the intensity of market participation
Shiimi et al.,, 2010 employed a Probit model in to determine the factors influencing the
marketing decision of whether or not to sell through the formal market by smallholder cattle
farmers in Namibia. He found out that transportation problems, improved productivity,
accessibility to market-related information and access to new information technology, are some
factors significantly affecting the decision of whether or not to sell through a formal market
Page 25
12
Other studies have employed different approaches in analyzing and understanding
smallholder farmer’s decisions in terms of participation in groups and participation in value
addition. This study contributes to literature on participation decisions by farmers by looking not
only at household and farm characteristics but by also looking at transaction cost factors. This
study recognizes that collective action plays an important role in reducing transaction costs,
provision of information as well as markets and sometimes credit to farmers therefore upgrading
these groups formed by farmers in terms of education and support could significantly increase
value addition of milk which eventually could reduce milk spoilage thus farmers will have higher
incomes. This study therefore not only looks at smallholder farmers’ decisions but also
incorporates decisions and activities of self- help groups within the farmers’ localities in order to
find out if upgrading the self-help group could eventually contribute towards improving milk
prices, standards on the other hand increase farmer incomes.
2.5 Theoretical framework
This study will be based on utility maximization theory which states that an individual
will select the alternative from his/her set of available alternatives that maximizes his or her
utility. Further, the rule implies that there is a function containing attributes of alternatives and
characteristics of individuals that describes an individual’s utility valuation for each alternative
A discrete choice framework will be used to analyze the determinants of the upgrading
by actors along a value chain. Discrete choice models are usually derived in a random utility
model (RUM) framework in which decision makers are assumed to maximize their utility. The
level of utility from a choice is known only to the decision maker and is observed through the
choices made.
2.5 Probit model
When an individual’s choice is discrete and there are only two choices involved, a binary
choice model is selected. In this case the decision to upgrade or not, is discrete and binary
therefore a logit or probit model may be applicable. A probit model will be used in the analysis.
It is assumed that there is a potential for upgrading products, processes and functions along dairy
value chains and that actors along the chain who exploit this potential get higher profit margins
hence have a high utility. The decision on whether or not to upgrade is considered under the
general framework of utility maximization (Gujarat, 2003). Within this framework, actors in a
value chain will decide to upgrade if the perceived utility or net benefit from the option is
Page 26
13
significantly greater than is the case without. Although utility is not directly observed, the actions
of the actors are observed through their choices.
Suppose that 𝑈𝑗 and 𝑈𝑘 represents a value chain actor’s utility for two choices, which are
denoted by 𝑌𝑗 and 𝑌𝑘 respectively. The linear random utility model could then be specified as:
𝑈𝑗 = 𝛽𝑗𝑋𝑖 + 𝜀𝑗
𝑈𝑘 = 𝛽𝑘𝑋𝑖 + 𝜀𝑘…………………………………………………………………..…….. (1)
where 𝑈𝑗and 𝑈𝑘 are perceived utilities of an value chain actor’s choice j and k , respectively, Xi
is the vector of explanatory variables that influence the perceived desirability of each choice,
𝛽𝑗and𝛽𝑘 are utility shifters, and 𝜀𝑗 and 𝜀𝑘 are error terms assumed to be independently and
identically distributed (Greene, 2002) .
If a chain actor decides to use option j, it follows that the perceived utility or benefit from
option j is greater than the utility from other options (say k) depicted as:
𝑈𝑖𝑗(𝛽𝑗𝑋𝑖 + 𝜀𝑗) > 𝑈𝑖𝑘(𝛽𝑘𝑋𝑖 + 𝜀𝑘), 𝑘 ≠ 𝑗∀𝑖………………..………………………. (2)
The probability that a chain actor will choose to upgrade, i.e. choose j instead of k could then be
defined as:
𝑃(𝑌 = 1|𝑋) = 𝑃(𝑈𝑖𝑗 > 𝑈𝑖𝑘)
𝑃(𝛽′𝑗𝑋𝑖 + 𝜀𝑗 − 𝛽′𝑘𝑋𝑖 − 𝜀𝑘 > 0|𝑋)
𝑃(𝛽′𝑗𝑋𝑖 − 𝛽′𝑘𝑋𝑖 + 𝜀𝑗 − 𝜀𝑘 > 0|𝑋)
𝑃(𝑋∗𝑋𝑖 + 𝜀∗ > 0|𝑋) = 𝐹(𝛽∗𝑋𝑖)…………………………………………………… (3)
Where𝑃 is a probability function, 𝑈𝑖𝑗 , 𝑈𝑖𝑘and 𝑋𝑖 are as defined above,
𝜀∗ = 𝜀𝑗 − 𝜀𝑘is a random disturbance term,
𝛽∗ = 𝛽′𝑗𝑋𝑖 − 𝛽′𝑘𝑋𝑖is a vector of unknown parameters that can be interpreted as a net influence
of the vector of independent variables influencing choice, and 𝐹(𝛽∗𝑋𝑖) is a cumulative
distribution function of𝜀∗ evaluated at 𝛽∗𝑋𝑖. The exact distribution of 𝐹 depends on the
distribution of the random disturbance term, 𝜀∗. Depending on the assumed distribution that the
random disturbance term follows, several qualitative choice models can be estimated (Greene,
2002).
2.6 The Tobit model
The Tobit model is used in analysis of metric dependent variables when it is “limited” or
observed if and only if it is above or below a cut off level. Conditional on the decision to
Page 27
14
participate on the market, the factors influencing smallholder dairy farmers’ participation in raw
milk channel and value added channel in relation to the volume of milk sold in the channel can
be modeled using Tobit or censored regression model.
The Tobit model was developed by Tobin (1958) for a situation where the dependent
variable is censored from above, below, or both. It is indicated that in a situation where the
dependent variable is censored the Ordinary Least Squares estimators are biased downwards and
the use of Tobit regression model is recommended (Greene, 2002). In this case, the dependent
variables, that is, amount of dairy and dairy products marketed in the selected chains involve
lower limit censoring at zero for a significant fraction of the observations. Greene, 2002, argued
that when the dependent variable is censored the conventional regression methods fail to account
for the qualitative difference between limit (zero) observations and non-limit (continuous)
observations. Therefore, the Tobit model is estimated using the maximum likelihood method and
is given as follows.
𝑉∗ = 𝑥′𝛽 + 𝜀1
𝑉𝑖=𝑉∗ 𝑖𝑓 𝑉∗ > 0
𝑉𝑖=0 𝑖𝑓 𝑉∗ ≤ 0…………………………..……………………………………………(4)
Where𝑉∗, is the latent variable representing the observed volume of milk sold to a dairy
channel 𝑖𝑓 𝑉∗ ≤ 0 and unobserved otherwise.V is the quantity of a given dairy product sold and
X is a vector of independent variables affecting participation in a channel. 𝛽the parameter to be
estimated and 𝜀1is the error term.
Various studies on small holder participation have modeled participation decisions as a
two-step process. This is based on the assumption two separate decisions are made; one involves
the decision to participate or not and secondly the level of participation. These studies have used
either the sample selection model of Heckman (1979) (Makhura et al, 2001; Alene et al., 2007;
Berem et al., 2010) or the double hurdle models (Omiti et al.,2009: Olwande & Mathenge, 2010:
Reyes et al.,2010). The Heckman two stage model is used to model two decisions, one on
participation which Probit model is used and the second on level of participation in which the
Inverse mills ratio (IMR) is used. The double hurdle model on the other hand is also used to
model two decisions, one involving participation and the other on intensity of participation.
(Wooldridge, 2002). In this study therefore a Tobit model was applicable since actors already
participating in either the unprocessed milk channel or a processed milk channel was selected
Page 28
15
Institutional and
technical factors
-Legal environment,
access to credit &
market, contracts,
market coordination,
support, transaction cost
-Market infrastructure,
Physical infrastructure
-communication
networks -Technical
support
Economic factors
-marketing
margins
-production cost
-input and output
prices
Socio-economic
characteristics
Age, education,
income, gender,
experience,
knowledge on
standards,
technological
skills
Unprocesse
d dairy
chain
Resource factors
-Volume of milk,
buyer
information, Size
of actors’
enterprise, age of
the enterprise,
equipment
Processed
dairy chain
Farm
characteristics
Herd size
Labor size
Land size
Distance to
market
and used to determine the factors influencing their participation decision in terms of the quantity
of dairy products supplied to a particular channel
2.7 Conceptual framework
In this study, actors along the chain are faced with decisions on whether to upgrade or
not. These decisions are influenced by a number of factors which in this case are categorized
under socioeconomic, institutional and technical factors as well as the characteristics of the
actors. These factors can interact together to impede or enhance the decisions they choose. The
study conceptualizes that those actors who are willing to upgrade are likely to improve their
margins. Institutional and technical factors in this case therefore act as moderating variables to
the decisions that actors make. In this study, it is conceptualized that characteristics will initially
influence.
Figure 2:conceptual framework
Source: own conceptualization
Page 29
16
CHAPTER THREE: METHODOLOGY
3.1 Study Areas
This study assessed the factors that influenced decisions by smallholder farmers and
selected groups to add value to milk. It also analyzed group participation decisions by farmers.
The selected regions for the study are in close proximities to major markets which imply good
markets for milk and milk products. The study was conducted in Uasin Gishu and Meru counties
of Kenya. The regions were selected basing on a baseline survey by Eastern Africa Agricultural
Productivity Project Coordinating Unit, Kenya (EAAPP) in 2011 which showed enterprises for
dairy production in the selected sites had competitive advantages and there was availability of
suitable technologies that could be scaled up
3.2 Uasin Gishu County
Uasin Gishu County lies in the Midwest of the Rift Valley and borders six counties
namely Elgeyo-Marakwet County to the East, Trans Nzoia to the North, Kericho to the South,
Baringo to the South East, Nandi to the South West and Bungoma to the West. It covers an area
of 3,345.2 Km2 with temperatures ranging from a minimum of 8.4 0C to a maximum of 27 0C
Uasin Gishu county has two rainy seasons with average rainfall from 900mm to 1,200mm
per annum. It has a population of 894,179 (KNBS: 2009) and a population density of 267 people
per square kilometer. Statistics show that 50 percent of population lives below poverty line. The
main agricultural activities in the county are Maize, Wheat, beef and dairy farming.
Page 30
17
Figure 3 Map of Uasin Gishu County
Source: Karani (2014)
3.3 Meru County
Meru County is located along the eastern side of the Mt Kenya ring road. It borders
Isiolo County to the North and North East, Tharaka County to the South, Nyeri County to the
South West and Laikipia County to the West. The economy of Meru County is basically
Page 31
18
agricultural with Khat being the most commonly grown in the south both for export and local
consumption.
Figure 4: Map of Meru County
Source: Karani (2014)
The other major crop in is coffee as well as tea in some prime growing areas especially in areas
near Mt Kenya. Meru is situated about five miles north of the equator, at an altitude of
approximately 5,000 feet, Dairy farming also forms a huge part of Meru county’s economy. The
Page 32
19
rainfall pattern is bimodal with long periods of rain occurring from mid-March to May and short
periods occurring from October to December. The mean annual rainfall is about 1,300
millimeters, ranging from 380 millimeters in lowland areas to 2,500 millimeters on the slopes of
Mount Kenya
3.4 Sampling procedure
For the selection of groups, purposive sampling was employed: farmer groups that engaged
in value adding activities to unprocessed milk were selected. The groups had to be operating
legally and had to have good management and well defined future plans. Six groups were thus
selected, three from each county and one from each selected district.
Two sub-samples for individual farmers were collected for this study: one in which the
actors were affiliated to selected value addition groups and the other that are not affiliated. For
the affiliated, a source list was obtained from the collective action groups from which actors
were selected randomly. For the non-affiliated actors, a sampling frame was constructed with the
assistance of the area agricultural officer from which simple random sampling was used to obtain
a sample of 300 respondents.
3.5 Data and Data Collection Methods
The research used both primary and secondary data. Though primary data was the main
source of information, secondary data was used for literature review and to get information on
the selected areas of study. Secondary data was obtained from government reports such as
statistical abstracts and government national development plans and session papers, journals,
computer databases and previous research studies. Interview schedules were used to obtain
primary data from dairy farmers about their socio-demographic factors, group participation
behavior and factors influencing their decisions. Data on selected groups was also obtained using
interview schedules.
3.6 Data Analysis
The data collected was coded and entered using both Statistical Package for Social
Scientists (SPSS), it was then cleaned and analysis was done using (SPSS) and STATA. After
data cleaning a sample of 273 respondents was used for the purpose of analysis. The study
Principle Component (PCA) and factor analysis to describe the variables in the data. Marketing
margin analysis, Probit and a Tobit model was also used in the analysis of data.
Page 33
20
3.7 Analytical framework
3.8 Principle component and cluster Analysis (PCA)
The PCA was used to characterize processed dairy chains and unprocessed dairy chains
in the study areas. This included socio economic and demographic characteristics as well as
constraints faced by participants in the selected dairy chains. Principal component analysis,
(PCA) is a statistical technique used for data reduction. According to (Hamilton, 2006), PCA and
factor analysis provide a method for simplification, combining many correlated variables into
smaller number of underlying dimensions. The leading eigenvectors from the eigen
decomposition of the correlation or covariance matrix of the variables describe a series of
uncorrelated linear combinations of the variables that contain most of the variance. In addition to
data reduction, the eigenvectors from a PCA are often inspected to learn more about the
underlying structure of the data, (Madala, 1992)
The objective of PCA is to find unit-length linear combinations of the variables with the
greatest variance. The first principal component has maximal overall variance. The second
principal component has maximal variance among all unit length linear combinations that are
uncorrelated to the first principal component, etc. The last principal component has the smallest
variance among all unit length linear combinations of the variables. Experimenting with the PCA
options can be able to tell us how stable a particular finding is or how much it depends on
arbitrary choices about specific analytic technique (Hamilton, 2006).
The Cluster Analysis attempts to identify relatively homogeneous groups of cases based
on selected characteristics, using an algorithm that starts with each case in a separate cluster and
combines clusters until only one is left. The new variables created from principal component
were then used in standard cluster analysis to obtain homogenous groups of farmers for gross
margin and socio-economic characteristics comparison. It is assumed that each Yi variable is
linearly related to the various attributes. The number of factors may be determined by examining
the proportion of total variance explained by each component or by cumulative proportion of
total variance explained. The principal component model was represented in equation 6.
i
i
i
iiiXY
1 ………………………………………………………………………….6
Where Yi is standardized variable,
βi are parameters also referred to as loadings for Xi variable factors
Page 34
21
εi is the error (residual) term.
The assumptions of PCA model include: the model is linear, Yi are measured as
deviations from the mean (otherwise a constant should be included in the model) and εi is
independent with 0 mean and have variance equal to 1. The strength of the factors is indicated by
the loadings. Eigen values which are the variance of principal components (PCs) were obtained
to indicate the extent to which factors explain management interventions and their attributes.
Kaiser-Guttman criterion of retaining all PCs with Eigen value greater than one in further or
subsequent analysis was applied. Factor loadings greater than or equal to ± 0.500 was
interpreted.
3.9 Marketing margin (MM) analysis
Marketing margin analysis was used to answer objective two of the study. Marketing
margin is the difference between prices at two market levels. Marketing margins was examined
on the basis of data obtained on prices at different stages of the marketing chain. It can be
calculated through computing the absolute margins or price spread, which is essentially the same
as the difference between the price paid and received by each specific marketing actor. The total
marketing margin is the difference between what the consumer pays and what the
producer/farmer receives for his product. In other words, it is the difference between retail price
and farm price The following formula will be used to compute percentage marketing margins as
earned by each market intermediary in the marketing raw and value added dairy products.
𝑀𝑀 =𝐸𝑛𝑑 𝑏𝑢𝑦𝑒𝑟 𝑝𝑟𝑖𝑐𝑒−𝐹𝑖𝑟𝑠𝑡 𝑠𝑒𝑙𝑙𝑒𝑟 𝑝𝑟𝑖𝑐𝑒
𝐸𝑛𝑑 𝑏𝑢𝑦𝑒𝑟 𝑝𝑟𝑖𝑐𝑒 𝑋 100…………………………………………. (7)
Where. 'Mm' indicates the marketing margins earned by an actor.
To get the portion of the price paid by the consumer that goes to the dairy farmer. The producer’s
margin is calculated as :
GMM = (End buyer price− Marketing costs)
𝐸𝑛𝑑 𝑏𝑢𝑦𝑒𝑟 𝑝𝑟𝑖𝑐𝑒100…………………………………………..(8)
Descriptive statistics will be used to identify cost structures along the value chains; this
will show adjustments in prices as value is added as well as costs incurred. A comparative
analysis will then be done to compare upgraded value chains and traditional value chains in
terms of gross margins and cost strictures using descriptive statistics
Page 35
22
3.10 Probit model specification
A probit model was used to determine the factors influencing choice of whether to
upgrade or not. By upgrading the milk products and processes such as increasing delivery speed,
selling processed milk products, using standardized equipment and adopting measures to
increase the quantity of milk sold, the dairy farmer is considered to have added value.
𝑃𝑟𝑜𝑏(𝑦𝑖 = 1|𝑋) = ∫ Ф(𝑡)𝑑𝑡𝑋′𝛽
−∞= Ф(𝑋′𝛽)…………………………………………... (9)
Where 𝑦𝑖 is an indicator variable equal to 1 if the value chain actor chooses to upgrade or
otherwise.
Ф(. ) Is the standard normal distribution function 𝛽𝑠 are the parameters that are estimated and
𝑋𝑠 are the determinants of the dependent variable, that is, the choice of adding value to milk
𝑌(0,1) = log(𝑝
1 − 𝑝⁄ ) = 𝛽0 + 𝛽1𝑋1 + 𝛽2 𝑋2+𝛽3𝑋3 + 𝛽4𝑋4 … … . . 𝛽𝑛𝑋𝑛 + 𝜀𝑖𝑗)…………. (10)
Where:
𝑌 is the probability of a chain actor to add value to milk and milk products
𝛽0,𝛽1,𝛽2,, 𝛽3 and𝛽4 are the parameters to be estimated
X1 is a vector of socio economic factors
X2 is a vector of institutional factors
X3is a vector of economic factors
X4 is a vector of resource factors
𝜀𝑖𝑗is an error term that is independently and identically distributed
The Probit parameter estimate does not show by how much a particular variable increases
or decreases the likelihood of choosing to upgrade milk. For this purpose we need to calculate
the marginal effects of the independent variables on the probability of a chain actor to choose to
add value to milk or to or the probability to upgrade. For continuous independent variables, the
marginal effect of the probit model is calculated by multiplying the coefficient estimate (∝) by
the standard probability density function given above by holding the other independent variables
attheir mean values:
𝜕𝑃(𝑌=1)
𝜕𝑋𝑖= 𝛼Ф(𝛽𝑗𝑋𝑖………………………………………………………………. (11)
On the other hand, the marginal effects of the dummy independent variables are analyzed
by comparing the probabilities that result when the dummy variables take their two different
values while holding all other independent variables at their sample mean values (Wooldridge,
Page 36
23
2002). Finally, the log-likelihood function which is maximized to obtain the parameter estimates
and the corresponding marginal effects for the probit model is given as:
ln L(𝛼|𝑌, 𝑋𝑖) = ∑ ln Ф (𝛽𝑗𝑋𝑖) +𝑦=1 ∑ ln(1 − Ф) (𝛽𝑗𝑋𝑖)𝑦=0 ………………………………. (12)
Probit model is then estimated using maximum likelihood estimation. The probit model uses a
normal distribution and mathematically it involves the use of integrals.
3.11 The Tobit model specification
The Tobit model was used to analyze the determinants of participation in a dairy value
chain. The tobit model allows for the analysis of censored data, originally applied to variables
censored so that they could not fall below zero. In this study the presence of zeroes in the
dependent variables of volume, is due to non-participation in raw or value added dairy chain and
not from zero quantity of milk sold to the market. Therefore, by using a Tobit model, the zero
observations are accounted for and the censored regression provides a more accurate estimation
(Wooldridge, 2002)
The structural equation in the tobit model is given as:
𝑌∗ = 𝑋𝑖𝛽 + 𝜀𝑖………………………………………………………………………………….(13)
Where 𝜀𝑖is an error term which is independently and identically distributed
𝑌∗is a latent variable that is observed for values greater than 𝜏.The observed Yis defined by the
following measurement equation
𝑦1 = {𝑦∗𝑖𝑓 𝑦∗ > 𝜏𝜏𝑦 𝑖𝑓 𝑦∗ ≤ 𝜏
………………………………………………………………………….… (14)
In the tobit model we assume that 𝜏 = 0that is no data is censored at zero thus we have
𝑦1 = {𝑦∗𝑖𝑓 𝑦∗ > 00 𝑖𝑓 𝑦∗ ≤ 0
……………………………………………………………………………. (15)
𝑦∗ = 𝛽1 + 𝛽2𝑥2 + ⋯ … + 𝛽𝑘𝑥𝑘 + 𝑈
𝑦∗is unobservable by 𝑦1 = {𝑦∗𝑖𝑓 𝑦∗ > 00 𝑖𝑓 𝑦∗ < 0
Page 37
24
CHAPTER FOUR: RESULTS AND DISCUSSIONS
4.1 Introduction
This chapter is divided into two broad sub sections. Section 4.2 discusses descriptive
results which include socio economic, demographic and institutional characteristics of
smallholder dairy farmers and the value addition groups. Section Error! Reference source not
found. presents empirical results of the Probit and Tobit econometric models. This section will
also present findings of the market margin analysis and the principle component and factor
analysis. The results were drawn from analysis of smallholder dairy farmers participating in
selected collective action groups and those that did not participate. This section ends with
discussion of the factors that would influence the smallholder farmers’ choice to participate in a
group that adds value to milk or not. Factors that influence the farmers’ decisions to choose to
upgrade the processes involved in handling of milk were also examined.
4.2 Characteristics of dairy farmers
The result in
Table 1 shows demographic characteristics of the respondents. There were more male
respondents (59%) as compared to female (40%). Majority of the respondents (39.5%) had
secondary education and a mean age of 43. The mean distance to the market was 5 km and
farmers had an average of 14 years of experience in dairy farming. Majority of the roads used by
the farmers in all the selected regions were earth roads (70%), hence a major sign that poor road
infrastructure exists in the selected regions.
Farming was also shown to be the predominant activity in the selected regions since
majority of the respondents depended on farming as their primary activity. The results
significantly show that the farmers delivered milk to the market on foot as opposed to using
vehicles. This implies that farmers take longer time to deliver products to the market.
The results also show that majority of the farmers did not own any motorized transport while
they had an average of 3-5 cows in a household; farmers in Uasin Gishu County had a
significantly higher number of cattle compared to Meru County
Page 38
25
Table 1: Demographic characteristics of farmers
Meru
N=141
Uasin gishu
N=132
Significance
Level
Gender of household head (%) 0.326
Male% 55 56
Female% 85 78
Education level 0.777
No formal education 2 3
Primary 52 42
Secondary 53 54
College 30 26
University 4 6
Age of respondent 48 40 0.000*
Dairy farming experience 17 11 0.000*
Distance to main road(km) 1.2 1.5 0.104
Distance to market(km) 2.5 7.7 0.000*
Primary Activity of household head
Farmer 96 91 0.002*
Civil servant 20 14
Businessman/woman 10 24
Retired with pension 9 1
Retired without pension 5 0
Mode of transport to market 0.000*
Foot 104 36
Bicycle 14 15
Motor cycle 14 26
Vehicle 8 53
Total cattle 3 5 0.000*
Page 39
26
Ownership of motor able transport
No 113 76 0.000*
Yes 28 56
Source: Own survey data 2013
Raw milk is generally perishable in nature and therefore needs to be processed or delivered
to the markets fast or processed into a form that can be preserved. However, with a combination
of long distance to the market (5km) as evidenced by the interviewed farmers and existence of
earth roads in most areas and could imply that farmers incur high transaction costs in terms of
the time and costs to deliver milk and milk products to the market.
The results statistically showed that there was a significant difference between the mean
ages of respondents in the selected regions. Meru County was shown to have older respondents
compared to Uasin Gishu localities. There was a difference in distance to the market in the
selected regions however it was not statistically significant. There was a significant difference in
distance to the market between Meru and Uasin Gishu Counties. Farmers in Uasin Gishu were
shown to be located further away from the market compared to Meru.
The result in the Table 2 below shows further characterization of respondents. Majority of
the respondents (77%) were not aware of any international or national standards in dairy
production and marketing of milk such as licensing by the Kenya Dairy Board and hygiene. This
indicated the need for more sensitization, education and enforcements of existing standards in
order to improve the quality of milk being traded in the market. Majority of the respondents
(62%) participated in collective action.
The results further indicate that many households did not sell evening milk (56.57%). The
main reason for this was because during rainy seasons, roads were impassable in the evenings in
most regions and there was no ready market for evening milk. This presents opportunities to
increase quantities of milk sold that have not been tapped yet. Out of the percentage who did not
sell evening milk, 91% consumed the milk at home and the remaining 9% gave out to neighbors.
Majority of the farmers in Uasin Gishu County did not sell evening milk compared to those in
Meru County. This could be because the farmers in Meru County were located closer to the
markets compared to those in Uasin Gishu County as shown by the results.
Majority of the respondents (69%) did not preserve milk using either traditional or modern
methods of milk preservation. Preservation of milk reduces the urgency to sell milk by reducing
Page 40
27
spoilage. Modern preservation of milk was not practiced by most households and this could be
because electricity was not available in most households as well as in the self-help groups that
bought milk from the farmers
Table 2: Socio economic characteristics of the respondents
Meru
N=139
Uasin Gishu
N=134
Significance
level
Awareness of milk standard 0.736
No 79.3 76.69
Yes 20.7 23.31
Participate in group 0.045**
No 34 41.04
Yes 66 58.96
Add value to milk 0.001***
Yes 6 20.15
No 132 79.85
Sell evening milk 0.010**
No 69 85
Yes 72 47
Preserve milk 0.561
No 60 70.15
Yes 40 29.85
Easy to find market 0.067*
Yes 28 16
No 113 116
Source: Own survey data 2013
This study therefore suggests facilitating and upgrading of these self-help groups that are
closer to the farmers as a way of creating more markets for milk produced as well as reduce
spoilage within dairy chains.
4.3 Value addition by individual smallholder dairy farmers
As indicated by the results in Table 3, majority of the farmers, 86% of the respondents
sell their milk as unprocessed. None of the farmers interviewed processed milk into cheese citing
that it was not liked by many buyers. This is consistent with a study done in the central region in
Kenya which showed that only 3% of Kenya’s milk is processed into cheese. (JKUAT; CAIS &
KIPPRA, 2012). This implies that there are more opportunities for value addition which have not
been exhausted in the dairy sector.
Page 41
28
This result showed that most smallholder farmers in Kenya sold their milk individually as
raw. Minimal Processing was done at the farm level and this could be because of inadequate
equipment that can be used to add value. Most farmers who sold milk did not boil before selling
the milk. Raw milk is highly perishable and in its raw form, it is more likely to get contaminated
before it reaches the final consumer hence greater risks in health. Traditional value addition was
minimally practiced for commercial purpose thus offering opportunities for value addition in the
Dairy subsector
Table 3: Value addition by smallholder farmers
Value addition type *** Meru Uasin Gishu Percentage
Raw 132 106 86.86%
Boiled 4 13 6.20%
Mala (Traditionally Fermented Milk) 1 5 2.19%
Yoghurt 1 0 0.36%
Ghee 0 1 0.36%
Raw & mala 2 0 0.73%
Raw & yoghurt
1 0 0.36%
Boiled& mala & yoghurt 0 5 1.82%
Mala& yoghurt &cheese 0 3 1.09%
Note: Mala- Traditionally Fermented Milk
Source: Survey data 2013
4.4 Demographic and socio-economic comparison of farmers who add value to milk
Table 4 shows summary statistics of variables that indicated demographic and socio
economic characteristics of smallholder dairy farmers who added value to milk in comparison to
those farmers who did not add value. The results indicated that small holder farmers who added
value to milk were less educated as compared to those who did not add value to milk. The
possible explanation for this could be that educated farmers probably depended on farming
entirely for income generation therefore they would be more probable to try and maximize
revenue from milk through value addition
Page 42
29
The results also indicated that female respondents were more involved in value addition
than their male counterparts. Majority of those farmers who added value did not own motorized
as compared to those who added value to milk. Further results showed that the farmers who
added value to milk were slightly younger compared to those who did not add value to milk.
Farmers who added value to milk were also located closer to the market than those who did not
add value to milk.
Table 4: Comparison of farmers who add value and those who do not
Add value
(N=35)
Do not add value
(N=238)
Significance level
(Pearson chi-square)
Variable
Gender of household head 0.001***
Female 23 88
Male 12 150
Training on value addition 0.000***
Yes 21 229
No 14 9
Motor able transport
Mode of transport
Age 39 44 0.027**
Distance to market 3.6 5.1 0.045**
Education level 0.08*
No formal education 2 3
Primary 14 80
secondary 12 97
College 4 51
University 3 7
Experience 9 14 0.004***
Total revenue
Source: Survey data 2013
Farmers who added value to milk tended to have significantly had less experience
compared to those who did not. In addition, also more farmers who added value to milk had
primary education compared to those who added value had secondary education
Page 43
30
4.5 Challenges faced by dairy farmers
Challenges faced by dairy farmer were identified using the PCA method. When the factors
were subjected to PCA, three principle components with Eigen values greater than 1 were
extracted according to the Kaiser rule as shown in Error! Reference source not found. .
An Eigen value is an index of strength of the component and the amount of variance it
accounts for. The three components explained up to 50% variations in other factors while the
determinant was more than 0.00001 thus indicating the absence of multi collinearity in the
factors. There was a good fit of the data as indicated by the Bartlett’s test of sphericity (p=0.000)
and the KMO measure of sampling adequacy (0.731).
Table 5: Challenges faced by smallholder dairy farmers
Component Initial Eigenvalues
Total % of Variance Cumulative %
1 2.999 24.995 24.995
2 1.827 15.225 40.220
3 1.201 10.009 50.228
4 .976 8.136 58.364
5 .933 7.776 66.140
6 .809 6.743 72.884
7 .708 5.898 78.782
8 .662 5.513 84.295
9 .560 4.671 88.966
10 .490 4.086 93.052
11 .463 3.861 96.913
12 .370 3.087 100.000
Kaiser-Meyer-Olkin Measure of Sampling Adequacy 0.731
Barlett test, Approx. Chi-Square=411.314, df= 66, Significance= 0.000
Source: Own Survey data 2013
The first component extracted explained 25% of the variations in other components. The factor
loadings that were high in principle component 1 (PC1) were transportation (0.734), contractual
arrangements (0.540), and standards in milk marketing (0.611), market access (0.754), and road
networks (0.776) as shown in Error! Reference source not found. below.
Page 44
31
According to Table 6: PCA analysis: Rotated component matrixTable 6 below, the
factors that loaded heavily on PC2, which explained up to 15 % of the variations in other
components, were lack of extension advice (0.617) and high incidences of diseases (0.716). The
factors that loaded heavily on PC3 (10%), were milk prices (0.744) and high cost of animal feeds
(0.603). The principle components were therefore named according to the cluster of factors that
heavily loaded on the components, PC1=milk marketing, PC2=milk production and PC3= cost
factors
Table 6: PCA analysis: Rotated component matrix
Rotated Component Matrix
Component
Milk
marketing
Milk
production
Cost factors
Milk demand .271 -.241 -.070
Milk prices .254 -.115 .744
Transportation .734 .073 -.007
Contractual arrangements .540 -.027 .426
Standards .611 .100 .350
Market access .754 .045 .138
Road networks .776 .152 -.153
lack of extension advice .134 .617 -.275
high cost of animal feed -.124 .181 .603
high incidence of diseases .015 .742 .061
inadequate animal husbandry skills .280 .629 .265
inadequate credit -.029 .716 .044
Rotation Method: Varimax with Kaiser Normalization.
Source: Own survey data 2013
Page 45
32
4.6 Description of selected value addition groups
Table 7: Descriptive analysis of selected groups
below shows results of six groups that were selected within the study regions. Each
selected district had one value addition group that had been in operation for more than three
years. Among the selected groups, Thuita SH group which was located in Meru south was the
oldest (24) in terms of years in operation. Langas SH group was run by a group of disabled who
collected milk from farmers within the regions and processed the milk for resale.
The main activities undertaken by the groups were bulking, processing, distribution,
marketing as well as support depending on each group and the group’s needs. The main reason
for the formation of these groups was to be able to get better prices and market for their
produces, to provide loans to members as well as improve the welfare of its members. All the
selected groups required the members to contribute membership fee and contribution fee.
Table 7: Descriptive analysis of selected groups
Uasin Gishu Meru
Chepngoro
r
Langas
disabled
Kapkawa
Baitany
Thuita Muchege
Hort
Siombur
u
Age 3 4 7 24 9 6
Membership 56 42 21 150 18 20
Est. Value(Ksh) 300,000 58,000 50,000 800,000 800,000 60,000
Other income None None None None sell feed None
Road type to market Earth road Earth Tarmac Earth tarmac murram
Own motorable transport No No No No No No
Distance to market (km) 30 0 3 4 3 3
NB: S H= Self help
Source: Own Survey data 2013
4.7 Upgrading activities of the farmer groups
The Table 8:Upgrading decisions by farmer groups
presents results that showed the willingness of the selected farmer groups to upgrade. From
the results, five groups out of the selected six had invested in new machinery and increased the
number of products the groups supply to the market in the past few years. This, according to
Page 46
33
(Trienekens, 2011) is a sign that the self-help groups are striving towards upgrading processes as
well as products.
All the groups have in the past tried to minimize losses resulting from spoilage of milk by
buying lactometers and some by pasteurizing milk. One group invested in a cooler hence
upgrading the quality of milk as well as quantity since they could now buy evening milk from
farmers.
Some groups had upgraded their processes through activities such as expansion of their
market base as well as increasing delivery speed to the market. Most of the groups are yet to
improve on technology usage.
Table 8:Upgrading decisions by farmer groups
Uasin Gishu County Meru
County
Chepngoror
cooperative
society
Langas
disabled
SH
Kapkawa
Baitany
SH
Thuita
SH
Muchege
Hort milk
SH
Siomburu
SH
Invested in machinery No Yes Yes Yes Yes Yes
Increased products
sold
No Yes Yes Yes Yes Yes
Increased technology
use
No None None None None Yes
Increased delivery
speed
Yes None Yes None None None
Expanded market Yes Yes Yes None Yes Yes
Improved milk safety Yes Yes Yes Yes Yes
Prevented losses Yes Yes Yes Yes Yes Yes
NB: S H= Self help
4.8 Value addition activities by the farmer groups
The results in This indicated the potential of these groups to undertake value addition. The
groups were also aware of national and international standards on milk which is also a step
toward improvement on the safety and quality of milk.
Page 47
34
All the groups sampled in Meru County bought evening milk while those in Uasin Gishu
County did not buy evening milk citing that evening milk was not available and poor road
infrastructure was a hindrance. Error! Reference source not found. therefore gives a summary
of the activities and services that the groups offered.
The results showed that inadequate processing equipment and milk spoilage were among
the major challenges faced by the groups. In marketing, high cost of transportation, competition
from milk hawkers and poor milk prices were among the major challenges
below shows that out of the selected six groups, five had at least trained a member or had a staff
trained on value addition of milk. This indicated the potential of these groups to undertake value
addition. The groups were also aware of national and international standards on milk which is
also a step toward improvement on the safety and quality of milk.
All the groups sampled in Meru County bought evening milk while those in Uasin Gishu
County did not buy evening milk citing that evening milk was not available and poor road
infrastructure was a hindrance. Error! Reference source not found. therefore gives a summary
of the activities and services that the groups offered.
The results showed that inadequate processing equipment and milk spoilage were among
the major challenges faced by the groups. In marketing, high cost of transportation, competition
from milk hawkers and poor milk prices were among the major challenges
Table 9: Descriptive analysis of groups
Uasin Gishu Meru
Chepngoro
r
Langas
disabled
Kapkawa
Baitany
Thuita Muchege
Hort
Siombur
u
Value addition
training
Yes Yes Yes Yes Yes None
Training provider College College MOA NGO MOA
Standard awareness Yes Yes Yes Yes Yes Yes
Buys evening milk No No No Yes Yes Yes
Page 48
35
Information source MoA
Marketing strategy Pricing Promotio
n
Quality Product Quality Quality
Linkages with other
institutions
Research Credit MoA Credit Credit MoA
Services offered Loans Training training Loans Feed &
treatment
Has external support Yes No Yes Yes Yes
Areas in need of
support
Training Credit Electricit
y costs
Marketin
g
Training
MoA=Ministry of Agriculture
4.9 Market margin analysis
Table 10: Market margin Analysis of unprocessed channel
Average end buyer price/ltre 35.99
Average first seller price/ltre 32.76
Marketing margin (%) 8.974715
Average end buyer price/ltre 35.99
Transport cost 0.488492
Delivery cost 0.942877
Total costs 1.431368
End buyer price-Marketing costs 34.55863
Gross Market Margin 0.960229
Market margin analysis results showed that farmers had a bigger share of the retail prices in
the market. However gross margin received by farmers is small due to higher transactions costs,
marketing and production cost. Marketing margin is computed as the difference between the end
buyer price and the first seller price divided by the end buyer price.
Results from Error! Reference source not found. show that producers received a bigger
share of the market price (96%). The gross market margin shows the portion of the price paid by
the consumer that goes to the dairy farmer. Since majority of the farmers sell milk in raw form,
the value chain is shorter; a greater portion of price goes to the farmer. However, this does not
imply that the farmer is making huge profits since farmers incur high production costs
Page 49
36
4.10 Relationship between value addition and market margin
The results as shown in Error! Reference source not found. below shows that as more
value addition is done the more market margin is accrued to trader. However, most respondents
who added value did not have records showing the expenses incurred for processing such as
electricity, water, labor, and flavor hence calculation of the gross marketing margin was not
possible for this research
Table 11: Market Margin Analysis of processed dairy chain
Mala Yoghurt
Average end buyer price/ltre 60 140
Average first seller price/ltre 50 100
Marketing margin (%) 16.6% 28%
4.11 Gross margin analysis of selected farmer groups
The results in Figure 5 above shows the gross marketing margins received by the selected
groups. Kapkawa Baitany SH group received the largest gross market margin when compared to
the other groups. This was because value addition was done on milk to produce products such as
pasteurized milk, mala, and yoghurt.
Chepngoror cooperative society had the least gross margins. This was because there was
minimal processing in the group. Minimal processing by the group (chepngoror) could also be
because of high transportation costs due to long distance to the markets and bad roads. The
group was involved in bulking and selling the milk. This result showed that value addition
increases margins received by the actors hence there is need to promote and encourage farmers
and groups to sell value added dairy products
Page 50
37
Figure 5:Gross market margin analysis of groups
4.12 Description of buyers
The results from Error! Reference source not found. below showed that most of the
farmers sold their milk majorly to cooperative societies. Most farmers also sold to their
neighbors’, and few farmers sell directly to processing plants. The cooperative societies bulk the
milk then sell to processing plants and in this way they are able to have bargaining power over
their milk
Table 12: Description of buyers
Major milk buyer frequency
Neighbor 83
Nearby schools 10
Local restaurants 15
Local shops 11
Self Help Groups 38
Cooperative Society 100
Processing company 10
Local Vendor 6
Total 273
05
01
00
15
0
Chepngororcooperative
society
Thuita SH Langasdisabled SH
MuchegeHort milk SH
KapkawaBaitany SH
Siomburu SH
Producers' share of retail price
Total gross margins% Producer's share%
Per
centa
ge
gro
ss m
argin
Page 51
38
Pearson chi2(7) = 31.5694 Pr = 0.000
4.13 Analysis of production cost
The results in Error! Reference source not found. shows that animal feed was considered by
82% of the farmers to be a major cost. There was a significant difference in the estimate for feed
with Meru County having higher costs compared to Uasin Gishu. This could be because farmers
in Meru County used the zero grazing systems while the farmers in Uasin Gishu County used the
open grazing systems to feed the animals.
Table 13: Main cost factor in production
Meru Uasin gishu Meru Uasin
Gishu
main cost factor Main cost estimate per month per cow
(KES)
Animal Feed 117 98 3070 2919 ***
Salt 7 3 1555 678 ***
Medicine 8 5
Veterinary costs 0 1 2160 583 ***
De worming 2 1 1412 1308
Labour 7 24
Total 141 132
Pearson Chi-Square .014**
Likelihood Ratio .009
4.14 Factors influencing decision by smallholder dairy farmers to upgrade milk products
By choosing to add value to milk, farmers are considered to have upgraded milk products.
This implies that more dairy products are sold to the market by farmers. However, farmers who
sell only one product to the market, in this case unprocessed milk are considered not to have
upgraded products. The decisions on whether or not to upgrade products have been modeled
using the Probit model. Dairy farmers who sold their milk in an unprocessed form were given a
value of 0 while for those farmers who sold milk products to the market in other forms, were
given a value of 1 for modeling purposes.
The p-value for the overall model fit statistic was less than the conventional 0.05 hence
showing evidence that at least one of the independent variables contributes to the prediction of
Page 52
39
the outcome. The Mcfadden pseudo R2 showed that the variables explained at least 45% of the
changes in the dependent variable.
The result in Error! Reference source not found. below gives the marginal effects after a
probit analysis of the factors that influenced the decisions by smallholder dairy farmers to
upgrade. The results indicate that the gender of the respondent had a negative and a statistically
significant effect on the decision by smallholder farmers to add value to milk. This implies that a
male headed household is less likely to upgrade milk products than the female counterparts. This
is shown by a negative and significant coefficient and a marginal effect of 0.05.
Table 14: Probit Model results: Determinants of Upgrading
Add value dy/dx Standard error z P>z
Gender of household head -0.0550281 0.02998 -1.84 0.066*
Age of house hold head 0.0003055 0.00079 0.39 0.697
Education -0.0015983 0.00785 -0.2 0.839
Experience -0.0023648 0.00137 -1.73 0.084*
Number of cows 0.0052094 0.00286 1.82 0.068
Milk price 0.0919561 0.05483 1.68 0.094*
Road network 0.0226077 0.02071 1.09 0.275
Value addition skills 0.2454437 0.1039 2.36 0.018**
Bargaining power 0.0196729 0.01851 1.06 0.288
Daily milk payment 0.0612548 0.04314 1.42 0.156
Group belonging -0.0263058 0.02645 -0.99 0.32
Husbandry skills -0.0263145 0.01795 -1.47 0.143
Cut down losses 0.0350342 0.0183 1.91 0.056*
Level of significance, * 10%, ** 5%, *** 1%.
Prob >chi2 = 0.0000 Log likelihood = -51.951719 Pseudo R2 = 0.4539
Further results show that at 1% significant level, if a farmer has value addition skill then
the likelihood of adding value to milk also increases by up to 24%. This finding agrees Giuliani
et al., (2005) who found out that appropriateness of knowledge base influenced the capacity and
ways in which firms upgrade. This result therefore implies the need to equip farmers with more
specific skills on value addition in order to increase their ability to upgrade milk products to the
market hence get more income.
Page 53
40
At 10% significant level, the results show that farmers who considered milk prices to be
favorable were more likely to add value to milk than those who did not. A unit change in the
favorability of milk prices would increase the chances of adding value by up to 7% as indicated
by the marginal effects. This result implies that prices have an effect on the farmers’ decisions on
whether to upgrade or not. In order to encourage more farmers to add value there is therefore a
need to improve the prices offered to them in the market.
Experience had a negative influence on the decisions by farmers to add value to milk. A
unit change in age would result decrease the probability of adding value to milk as indicated by
the marginal effects. Experience as a proxy for age could imply that older farmers were less
likely to add value than the younger farmer. This result could be because as people age, increase
in responsibilities would demand for more cash requirements which the raw milk value chain
offers. This result is contrary to (Sharma, Kumar, & Singh, 2009), who suggested that age
enhances the skills and ability to meet quality requirements of the modern milk channels, better
information utilization hence lower transaction costs thus have an impact to participation.
The results also indicate that farmers who had tried to cut down on losses were more
likely to add value when compared to those who had not. This result was significant at 10%
level. This could be because by cutting down on losses, farmers have more cash at their disposal
hence this reduces the need to sell raw milk faster so as to meet their daily cash requirements.
Awareness of standards in milk by farmers and quality requirements by buyers was
shown to have a negative influence on the decision to add value to milk. This result was however
not significant at more than 10% confidence level. This could be because by adding value to
milk and producing a variety of dairy products, requirements such as licensing and packaging
could make farmers sell their milk in raw form which has lesser requirements.
4.15 Determinants of participation in a processed or unprocessed milk channel
The Error! Reference source not found. indicate the results of a Tobit analysis used to
determine the factors that influence participation decision of dairy farmers in the unprocessed or
processed dairy channel.
The results indicated that majority of the farmers (86.86%) sold milk in raw form. The
Tobit result shows the factors that influences the farmers’ decisions. The model was significant
in estimation as indicated by p=0.000.
Table 15 Tobit Model results
Page 54
41
Variable dy/dx Standard
error
z P>z
Household gender 0.4233 1.46045 0.29 0.772
Household age 0.02729 0.054 0.51 0.613
Education level 0.86822 0.78981 1.1 0.272
Distance to Main road 0.5477848 0.36533 1.5 0.134
Distance to market 0.2538857 0.1472 1.72 0.085*
Transport ownership 2.635057 1.66386 1.58 0.113
Quality requirements -0.50791 1.78681 -0.28 0.776
Delivery time requirements -0.69157 2.05354 -0.34 0.736
Reliability requirements -1.1386 1.598 -0.71 0.476
Health standard requirements 3.4599 1.659 2.08 0.037**
Group belonging 2.5119 1.67543 1.5 0.134
Sell evening milk 1.0631 1.490 0.71 0.476
Preserves milk 4.2549 1.612 2.64 0.008***
Easy access to buyer 2.9717 1.9703 1.51 0.131
Add value 3.914552 2.53244 1.55 0.122
Favorable milk price 2.040369 1.90337 1.07 0.284
Favorable transportation -3.298669 1.73661 -1.9 0.058*
Level of significance, * 10%, ** 5%, *** 1%.
LR chi2(16) = 54.92 Prob > chi2 = 0.0003
Log likelihood = -850.514 Pseudo R2 = 0.0312
Ownership of a motor able transport by a household is shown to have a positive influence
on participation in the unprocessed milk channel, this results was not however statistically
significant. Owning a motor able transport increases the chances of increasing the quantity of
milk sold as unprocessed. This result was however not significant at less than 10%. A household
that owns a motor able transport would be able to deliver fresh and unprocessed milk to the
market faster than other households that do not have, hence they would find it easy to participate
in the unprocessed milk channel.
Further results showed that farmers who considered transport networks to be favorable
were less likely to sell more quantities of raw milk. This result was statistically significant at 1%
Page 55
42
and this could imply that farmers who were located in areas with good road network were more
likely to sell more quantities of value added milk
Participation in the unprocessed milk channel is also positively influenced by demand in
health standards negatively and significantly influenced by the demand for quality by buyers. A
unit change in the value for quality milk would result in decrease in the quantity of raw milk sold
by up to 9.9%. This implies that farmers would choose to participate in the processed milk
channel if there are demands for quality in the unprocessed milk channel.
Participation in the unprocessed milk channel is also influenced positively and
significantly by whether a farmer preserved milk or not. This could be because when a farmer
preserves milk when there is no market, especially evening milk, then the quantity delivered to
the market will increase if he combines morning and evening milk.
Distance to the market also had a positive and significant influence on the quantity
delivered to the market as unprocessed. A unit increase in distance would result in an increase in
quantity sold as raw. This could be because most farmers who were located far from the markets
sold their milk to did not deliver the milk themselves but depended on the buyer to collect. This
increases the chances of selling the milk as unprocessed since the milk collected is bulked
together with milk from other dairy farmers
4.16 Determinants of participation in the selected value addition groups
Within the selected regions, farmer groups that were involved in bulking, value addition and
marketing of milk were also analyzed. The farmer groups were at close proximities to the
smallholder farmers had good management practices and some offered varieties of support to the
farmers who belonged to these groups. The selected groups were relevant for this study since
these groups offered the farmers within the study regions a chance to upgrade milk and milk
products through value addition and collective marketing. Some of the groups offered extra
services to their members such as training on improved milk production as well as value
addition. However, some farmers participated in these groups while others did not.
A probit model was used to determine the factors that influenced participation in a group.
The significance of the model was shown by a p value of less than 1% and a pseudo R2 of
31.09%. Error! Reference source not found. presents the marginal effects of the probit
analysis.
Page 56
43
The variables hypothesized to influence participation decision by farmers in groups, nine
were found to be significant at less than 5% level. Results also show that the age of the farmer
significantly (at 10% level) and positively influenced decisions to participate in a group. If age is
increased by a single unit, the probability of belonging to a farmer group also increases by up to
6.5%.
Table 16: Probit Model analysis. Determinants of participation in selected self help
groups
Group belonging Dy/dx Standard
error.
P>z
Buyer-processor 0.139 0.049 0.001***
Primary activity-business 0.051 0.039 0.251
No formal education 0.063 0.056 0.490
Gender of household head 0.042 0.041 0.290
Age 0.065 0.040 0.073*
Distance to market -0.043 0.021 0.027**
Mode of transport-vehicle -0.056 0.068 0.360
Value addition skills 0.112 0.036 0.012**
Sell to neighbor -0.186 0.065 0.000***
Livestock-enterprise -0.637 0.280 0.019**
Motorable-transport Ownership 0.083 0.037 0.038**
Total revenue 0.001 0.002 0.809
Favorable Milk price -0.080 0.058 0.096*
Easy to find buyer -0.048 0.037 0.261
Credit availability 0.358 0.047 0.000***
Bargaining power 0.060 0.042 0.119
Level of significance, * 10%, ** 5%, *** 1%.
Prob >chi2 = 0.0000 Log likelihood = -86.68 Pseudo R2 = 0.0.4507
Furthermore, the results show that farmers would choose to participate in a group if they
had access to credit. The marginal effects indicate that a unit increase in the favorability of
access to credit increases the probability of participation in a farmer group. From the study, all
farmer groups that were sampled were able to give credit to their members. The marginal effects
Page 57
44
show that a one unit change in the value for access to credit would result in an increase in group
participation by 35%.
Distance to the market is also shown have a negative effect on participation in the
selected groups and is significant at 5%. The results of the marginal effects show that a unit
increase in distance to the market decreases participation in these groups by 4%. One explanation
for this could be that distance presents higher transaction costs in terms of transport or milk loss
in form of spoilage hence farmers would reduce participation in the groups if they are located far
from the market.
Farmers who kept only livestock were less likely to participate in the groups according to
the results. The marginal effects show that a unit increase in the value for livestock enterprise
decreases participation in the groups by up to 63%.
When the buyer is a large scale processor, farmers were more likely to participate in a
group as indicated by the results. This could be because the farmers would want to eliminate
traders along the chain so that they can get better. On the other hand, if the buyers are neighbors
the probability to participate in a group would decrease by up to 18%. This implies that farmers
who sell to their neighbors were less likely to participate in groups.
Further, the results show that value addition skills influences positively and significantly
the decision by famers to participate in the groups. If a farmer had value addition knowledge,
probability of participation would increase by up to 11%. The explanation for this could be that
farmers who have knowledge in value addition would participate in the groups since the group’s
offer them an opportunity to apply their skills.
Page 58
45
CHAPTER FIVE: CONCLUSION AND RECOMMENDATIONS
5.1 Conclusions
Minimal processing of milk was done at farm and products such as cheese were hardly
known by farmers. In addition, traditional processing of milk was also minimally practiced. This
results indicated that there were more opportunities for value addition in the dairy sector which
could contribute to development of the agricultural sector in general.
Gross margins received by farmers who participated in the unprocessed dairy channel
were low as compared to the margins received by farmers in the processed dairy chains. This
showed that there was need to promote value addition by farmers and groups in order to improve
their incomes.
Factors such as poor roads and longer distances to the markets played a major role in
influencing decisions by farmers on whether sell to self-help groups that processed the milk.
Some regions had roads which were impossible to pass during rainy seasons thus limiting the
farmers market choices.
Participation in value addition was influenced positively by whether farmers had specific
knowledge on value addition. This showed that for value addition to be practiced by farmers
they needed to be trained and made aware of the various types of value addition that they could
do.
Farmers who were able to preserve milk were also more likely to increase the quantities
delivered to the market as unprocessed. The lack of electricity in some regions hindered the
ability of farmers to preserve milk. Farmers were more likely to participate in groups if they
were given incentives such as access to credit and inputs on credit.
5.2 Recommendation
Traditional processing as a form of value addition is minimally practiced for commercial
purpose thus presenting opportunities for value addition in the Dairy subsector. Traditional
methods of value addition are labor intensive and for these methods to be used for commercial
purposes there is need to upgrade the processes in terms of commercialization and marketing.
There is need to build technological and innovative capabilities of groups to encourage more
value addition in the overall dairy subsector.
Page 59
46
There is need to equip farmers with more skills on value addition in order to increase their
ability to upgrade milk products going to the market hence get more income. This study therefore
suggests facilitating and upgrading of self-help groups that are closer to the farmers as a way of
creating more markets for milk produced as well as reduce spoilage within dairy chains.
Infrastructure was a major hindrance to value addition majorly poor roads and lack of
electricity in the remote areas. This needs to be improved so as to realize more benefit from
value addition.
5.3 Area for further research
More research could be done on production and marketing of evening milk. Majority of the
farmers interviewed did not sell evening milk. Promoting the sale of evening milk could
contribute to significant increase in quantities of milk sold to the markets. Further research also
needs to be done in small scale dairy groups that were facing managerial challenges and how
build capacity and capabilities for the self-help groups.
Page 60
47
REFERENCES
Alene, A. D., Manyong, V. M., Omanya, G., D., M. H., M., B., & G., O. (2007). Smallholder
Market Participation Under Transactions Costs: Maize Supply and Fertilizer Demand in
Kenya. Food Policy , 33 (2008), 318 – 328.
Angula, M. N. (2010). Determinants of sustainable coffee marketing channel choice and supply
response among organic and UTZ certified smallholder Farmers: Evidence from
Uganda. Masters Thesis, Michigan State University, Agricultural, Food and Resource
Economics.
Bedford , A., Blowfield, M., Burnett, D., & Gree, p. (2001). Value chains: Lessons from the
Kenya tea and Indonesia cocoa sectors. London: ResourceCentre Soc. Dimens. Business
Practice.
Berem, R. M., Obare, G., & Owuor, , G. (2010). Is value addition in honey a panacea for poverty
reduction in the asal in africa? Empirical evidence from baringo district,
kenyaContributed Paper presented at the Joint 3rd African Association of Agricultural
Economics
Berhanu, K., Getne, T. K., Baker, D., & Kassa, B. (2011). Determinants of participation
decisions and level of participation in farm level milk value addition: The case of
smallholder dairy farmers in Ethiopia. Ethiopian Journal of Applied Science and
Technology. , 19-30.
Da Silva, C. B. (2005). The growing role of contract farming in Agri-food systems
development:Drivers, Theory and practice. Rome: FAO.
Fleming, K. (2005). Value added strategies: Taking agricultural products to the next level.
Agribusiness; .
Fries, R., & Akin, B. (2004). Value Chains and Their Significance for Addressing the Rural
finance challenge. Washington DC: Accelerated microenterprise advancement project.
Gebremedhin, B., & Jaleta, M. (2010). Commercialization of Smallholders: Is Market
Participation Enough?
Giuliani, E., Pietrobelli, C., & Rabelloti, R. (2005). Giuliani, E., PietroUpgrading in Global
Value Chains: Lessons from Latin American Clusters. World Development , 33(4), 549-
573.
Greene, W. H. (2002). Econometric Analysis, 5th edition. , . New York: Macmillan Publishers.
Page 61
48
Gujarat, D. (2003). Basic Econometrics. Fourth Edition. McGraw-Hill Publisher.
Hamilton, L. (2006). Statistics with Stata. Duxbury: Curt Hinrins.
Humphrey, J. (2004). Upgrading in global value chains. Geneva: International labour office.
Humphrey, J., & Schmitz, H. (2002). How does insertion in global value chains affect upgrading
in industrial clusters? Institute of development studies.
IFAD. (2010). National Programme to Support Agricultural Value Chain Actors. Guinea:
International Fund for Agricultural Development.
Jari, B. (2009). Institutional and Technical Factors Influencing agricultural marketing channel
choices amongst Smallholder and Emerging Farmers in The Kat River Valley. Masters
Thesis, University of Fort Hare, Department of Agricultural Economics And Extension.
Jari, B. (2009). Intitutional and technical Factors influencing agricultural marketing channel
choices amongst smallholder and emerging farmers in the kat river valley. masters
theses, University of Fort hare, Department of Agricultural Economics and Extention.
JKUAT, Jomo Kenyatta University Of Agriculture And Tech; Cais, Central Artificial
Insemination Station; Kippra, Kenya Institute Of Public Policy Reasearch Institu; Kippra,
Kenya Dairy Processors’ Association. (2012). Strategic and Value Chain Smallholder
Dairy Study in Central Kenya. NAIROBI: Kilimo trust.
Kaplinsky, R. (2000). Spreading the gains from globalization. Sussex: Institute of development
Studies.
Kaplinsky, R., & Morris, M. (2000). A handbook for value chain research. IDRC.
Kaplinsky, R., & Wamae, W. (2010). Determinants of upgrading and value added in the african
clothing sector: The contrasting experiences from kenya and Madagascar.
Kaplinsky, R., Morris, M., & Reardon, J. (2001). The globalization of product market and
immiserising growth: lessons from the South African Furniture industry.
Karani, M. (2014) Geography department – Egerton University, Njoro.
Karanja, A. M. (2003). The dairy industry in Kenya: The post-liberalization agenda.
Karuga , S. (2010). Staple Foods Value Chain Analysis Country Report – Kenya. USAID.
KDB. (2014). Kenya dairy Board publications. Retrieved from Kenya dairy website:
http://www.kdb..com
Page 62
49
Kirimi, L., Sitko, N., Jayne, T. S., Karin, F., Muyanga, M., Sheahan, M., et al. (2011). A Farm-
Gate to Consumer Value chain Analysis of Kenya's Maize marketing System. Michigan
State University.
KNBS: (Kenya national Bureau of Statistics). (2009). Population Statistics. Nairobi:
Government press.
Kumar, A. (2010). Milk Marketing Chains in Bihar: Implications for dairy farmers and traders.
Agricultural economics research review , 23, 469-477.
Kumar, A. (2010). Milk marketing chains in Bihar:Implications for dairy farmers and Traders.
Agricultural economics research review , 23, 469-477.
Kumar, A., Staal, S. J., & Singh, D. K. (2011). Smallholder Dairy Farmers’ Access to Modern
Milk Marketing Chains in India. Agricultural Economics Research Review , 243-253.
Kyeyamwa, H. (2007). Integration of smallholders‟ cattle farmers in the livestock market of
Uganda. Thesis, Ghent University, Ghent, Faculty of Bioscience Engineering., Ghent.
Madala, G. S. (1992). Introduction to Economics. New York: Macmillan Publishers.
Makhura, M. N., Kirsten, J., & Delgado, C. (2001). Transaction Costs and Smallholder
participation in the Maize market in tha northern province of South Africa. 7th eastern
and Southern Africa regional Maize conference, (p. 453).
Makita, K., Desissa, F., Teklu, A., Zewde, G., & Grace, D. (2011). Risk assessment of
staphylococcal poisoning due to consumption of informally-marketed milk and home-
made yoghurt in Debre Zeit, Ethiopia. International Journal of Food Microbiology , 153
(2012), 135-141.
Mitchel, J., Coles, C., & Keane, J. (2009). Upgrading along Value Chains: strategies for poverty
reduction in Latin America.
Navas-Aleman, L. (2011). The Impact of Operating in Multiple Value Chains for Upgrading:The
Case of the Brazilian Furniture and Footwear Industries. World development , 39 (8),
1386-1397.
Negassa, A. (2009). Improving smallholder farmers’ marketed supply and market access for
dairy products in Arsi Zone, Ethiopia. Nairobi: ILRI (International Institute of Livestock
Research).
Page 63
50
Ohajianya, D. O., & Ogochukwu , A. I. (2011). An Ordered Probit Model Analysis of
Transaction costs and Market Participation by Sweet Potato Farmers in South Eastern
Nigeria. 85 th Annual Conference of the Agricultural Economics Society.
Olwande, J., & Mathenge, M. (2010). Market Participation among Rural poor households in
Kenya,. Tegemeo Institute, Egerton University.
Omiti, J. M., Otieno, D. J., Nyanamba, T. O., & Mc cullough, E. (2009). Factors influencing the
intensity of market participation by smallholder farmers: A case study of rural and peri-
urban areas of Kenya. AFJARE , 1.
Omore, A., Kurwijila, L., Makokha, S., & Rosemirta, B. (2011). Market study reveals the need
for appropriate food safety standards and incentive-based approaches for improved
compliance in ECA countries. Policy Brief.
Ouma, E., & Jagwe, J. (2010). Banana Value Chains in central Africa: Constraints and
Opportunities. African Association of Agricultural Economics.
Reardon, T. A., Berdegué, A. J., Lundy, M., Hernández, R., Pérez, E., Jano, P., et al. (2004).
Supermarkets and Rural Livelihoods:A research method. Michigan: Michigan State
University.
Reyes, B., Donovan, C., Bernsten, D., & M, M. (2010). Market participation and sale of potatoes
by smallholder farmers in the central highlands of Angola: A Double Hurdle approach.
International Association of Agricultural Economics (IAAE) triennial conference, (pp.
18-22). Brazil.
Ruijs, A., Schweigman, C., & Lutz, C. (2004). The impact of transport and transaction-cost
reductions on food markets in developing countries: evidence for tempered expectations
for Burkina Faso. Agricultural Economics , 31, 219–228.
Ruijs, A., Schweigman, C., & Lutz, C. (2004). The impact of transport and transaction-cost
reductions on food markets in developing countries: evidence for tempered expectations
for Burkina Faso. Agricultural Economics , 31, 219–228.
Schipmann., C. (2006). Value Chains for a Better Integration of Smallholders to trade – The
case of chilli in Ghana. Master Thesis, Humboldt University, Agricultural Economics.
Schmitz, H. (2005). Value Chain Analysis for Policy-Makers and Practitioners. International
Labour Organization.
SDP. (2005). The Policy Environment of Kenya’s dairy sector. Nairobi: ILRI.
Page 64
51
Sharma, P. V., Kumar, K., & Singh, V. R. (2009). Determinants of Small-Scale Farmer inclusion
in Emerging Modern Agrifood Markets: A Study of the Dairy Industry in India. Indian
Institute of management.
Shiimi, T., Taljaard, P., & Jordaan, H. (2010). Transaction Costs and Cattle Farmers’ Choice of
Marketing Channels in North-Central Namibia. African Association of Agricultural
Economists (AAAE) . South Africa.
Staal, S. J., Baltenweck , I., Njoroge, L., Patil, B. R., Ibrahim, M. N., & Kariuki, E. (2006).
Smallholder Dairy Farmer Access to Alternative Milk Market. IAAE Conference .
Brisbane, Australia.
Technoserve. (2008). The Dairy Value Chain in Kenya. East African Dairy Development
Programm.
Trienekens, J. H. (2011). Agricultural Value Chains in Developing Countries A Framework for
Analysis. International Food and Agribusiness Management Review , 14 (2).
UNIDO. (2009a). Agro-Value Chain Analysis and Development: The UNIDO Approach .
Vienna: United Nations Industrial Development Organization.
UNIDO. (2009b). Value chain Diagnostics for industrial development:Building Blocks for a
Holistic and rapid analytical tool. Vienna: UNIDO.
USAID. (2010). Introduction to Value Chain Development. U.S.Agency for International
development.
Webber, M. C., & Labaste, P. (2010). Building competitiveness in Africa's Agriculture:A guide
to value chain concepts and Applications. Washington DC: World bank.
Wooldridge, J. M. (2002). Econometric Analysis of Cross Section and Panel Data. Cambridge:
MA: MIT Press.
World Bank. (2009). Agribusiness and innovative systems in Africa. Washington DC:
international institute for rural reconstruction.
Page 65
52
APPENDIX
Appendix 1: Structured survey questionnaire
TARGET: SMALL HOLDER DAIRY FARMERS
DATE OF INTERVIEW _________________________________________NAME (Optional) _______________________________________________
COUNTY OF RESPONDENT ____________________________________LOCATION___________________________________________________
SUB-COUNTY_________________________________________________ENUMERATOR NAME________________________________________
1.0 GENERAL INFORMATION
1.1 Please provide the following information about the head of the household
1.2 Please provide the following information
Sex
1=male
2=Female
Age (years)
Education level
0=none
1=primary
2=secondary
3=college
4=university
5=other(specify)__________
Experience in dairy
farming
(years)
Primary Activity
1=farmer
2=civil servant specify)__________________
3=Businessman
4=retired with pension
5=retired without pension
6=others (specify)___________________
[__________] [_________
]
[________________] [____________] [_____________________]
Page 66
53
Distance from
the homestead
to the main
road
Distance from
the homestead
to the nearest
major market
Do you have any
motorable
transport
Do you have any
none motorable
transport
Road type from
the homestead to
the main road
Mode of
transport to
market
Average dairy
wage in the area
(per day)
1=Motor cycle
2=Vehicle
1=Bicycle
2=Wheelbarrow
3=other(specify)
0=Earth road
1=Murram
2=Tarmac
1= foot
2=Bicycle
3=motorcycle
4=vehicle
[___________] [___________] [___________] [___________] [___________] [___________]
1.3 Please provide the following information about your household’s cattle holding
Number present on the farm Number in milk Number in-calve
Cow grade
Cow crosses
Cows, local
Heifer grade
Heifer crosses
Heifer local
Calves
Bull, grade
Bull, crosses
Bull local
2.0 PRODUCTION INFORMATION
Page 67
54
2.1 What are your 3-5 main cost factors? Give an estimate on how much you spend on them
Cost factor Estimate cost(KSH)
1
2
3
4
5
6
2.2 Have you undertaken any of the following activities in the last three years?
Activity Response
1= yes
2= no
If yes above, what factors influenced your choice
to undertake the activity?
1=low cost 2=Buyer needs 3=regulatory board
requirements 4=Availability 5=Gain competitiveness
6=Increase profits
7=Increase efficiency 8=Expand customer base
9=other (specify)_______________
If NO, do you have plans
for engaging or improving
any of the mentioned
activities
1= yes
2= no
Bought new machinery
Improved cattle feed
Increased technology use
Increased delivery speed (to customer)
Reduced animal disease incidence
Improved quality and safety of milk
Page 68
55
Cut down losses
2.3 Are you aware of international/national standards and regulations in dairy farming? (e. g. ISO norms, GAP, GMP, quality standards and
laws, etc.) 1=yes [ ] 0= No [ ]
If Yes, What are these standards? Describe below
_____________________________________________________________________________________________________________________
______________________________________________________________________________________________________________
2.4 What requirements do your buyers have? (E.g. with regard to quality, delivery time, reliability, health standards, production standards etc.)
_________________________________________________________________________________________________________________
____________________________________________________________________________________________________________
2.5 What kind of packaging materials do you use for your product? ______________________________________________________
2.6 With regard to your production: What are the strengths and weaknesses?
Strength Weaknesses
Availability of feed
Lack of extension advice
High cost of animal feed
high incidence of diseases
Inadequate animal husbandry
skills
Inadequate credit
3.0 MARKETING INFORMATION
3.1 Where do you get your supply (raw materials, designs, tools, machines etc.) from?
Input (specify)
Source
Page 69
56
3.2 What kind of information do you get from your suppliers?
Information about their
products and services
About new technologies
and methods
About available services How to use and maintain
inputs (eg chemicals,
machines)
Other
3.3 Is this information easily available? Yes [___] No [_____]
If no, why not?______________________________________________________________________
3.4 Who in the household makes the decision to sell milk?
1=father [___] 2= mother [___] 3= manager [___] 4=other (specify) ________________
3.5 Does any member of the household belong to a group?
1=Yes [______] 0=No [_______]
If yes, please provide the following information
Household
member
1= Household
head
2=spouse
3=son
4=Daughter
Group type
1=Common
interest group
Specify________
2=Community
based organization
3=Farmer
4=cooperative
When
joined
Purpose of group
1=Collective
2=marketing
3=Income
generation
4=Saving and
credit
others
How the
group started
If externallysupport
1=Ngo
2=ministry of
livestock
3=Credit lending
institution
4=Research institution
5=Other (Specify)
If yes, is there a
membership
contribution fee
(Please
specifyamount)
[_________] [_________] [_________] [_________] [_________] [_________] [_________]
If you participate, what are the major benefits in participate in the If no, what are your reasons for not participating?
Page 70
57
group?
1= high buying price 2= Reliability 3=Proximity
4=support services 5= Assured market 6= Access to credit
7= Access to training 8=Stable prices 9=Better prices for products
10=Access to inputs 11=Others (specify)[____________________]
1=offer lower prices
2= member of other groups
3=Not interested
4=Entry fee is high
5=other(specify)___________________________________]
Do you sell your
evening milk?
1=Yes
0=No
If answer is NO, How is the milk used?
1= home consumption 2=Give to neighbors
3=Process 4= Preserve
5= others (specify__________
Do preserve
milk?
1=Yes
0=No
If YES, how?
1= Refrigeration 2=Water bath
3=Earthen pot 4= Wet charcoal
5=Leave outside overnight
6=Others (specify) ___________________
[____________] [_________________] [______________] [_____________]
3.6 Who do you sell your milk to?
Buyer
type
Terms of
payment
1= on the spot
2= weekly
3= monthly [
]
4=other
(specify………
……………
Cost
per
litre
Point of
sale/coll
ection
point
Distanc
e to the
point of
sale
delivery/col
lection
Responsibil
ity for
1=buyer
2=seller(far
mer)
If seller who delivers
1=self
2=spouse
3=Boy child (<18years)
4=girl child (<18 years)
5=Son (above 18 years)
6=daughter(>18 years)
7=female worker
8=Male worker
If seller
,Time taken
to deliver to
collection/sa
les point
If seller,
Means of
transport to
collection/sa
les point
1= foot
2=Bicycle
3=motorcycl
e
4=vehicle
If
seller
Cost of
transp
ort to
the
point
of
sale(pe
r trip)
Page 71
58
Type 1
[_____]
Type 2
[_____]
Type 3
[_____]
Type 4
[_____]
[1=neighbor’s] [2= nearby schools] [3= Local restaurants] [4= local shops] [5=Self-help group]
[6=Cooperative society] [7= Processing companies] [Any other (specify) [______________________________]
Is it easy is it to find buyers for your products? 1= Yes [___] 0=No [_____]
3.7 Do you incur any costs in finding your buyer? 1= yes[_____] 0=No[______]
If yes, please specify
Cost item cost Frequency of transaction Time taken per day
Communication(airtime)
Transport
Bargaining
How do you
interact with
your buyer(s)?
1=Directly, face to
How often do you meet
your buyer(s)to discuss
business related matters
and exchange new
What kind of information do
you get from your buyer(s)?
1= about new market trends
2=About market requirements
Is the
information
received
enough? Please
What is the nature of
relationship between you and
your buyer(s)
1= Formal contract
Page 72
59
face.
2=Through an
intermediary (e.g.
collector)
information?
1=Daily
2=Once per week
3=At least once per month
4=At least once every three
months
5=other (specify)
(e.g. quality standards)
3= About new technologies and
methods
4= About available business
services
5= About costs and prices
specify
1= yes
2=no
2=verbal agreement
3= Buyer dictates the terms
4= equal rights relationship
5= You can easily find another
buyer
6=you are bound to a particular
buyer (for various reasons)
[__________] [__________] [__________] [__________] [__________]
3.8 Do you have any bargaining power to influence the selling price of your products? Yes [______] No [_________]
Do you perform the
following activities
before you sell your
milk?(tick
appropriate)
Boil milk [__]
Process:
- mala[__]
-Yoghurt [__]
-cheese [__]
-Ghee[__]
Other(specify)
What influenced your
choice to perform
activities?
1= High costs of value
addition equipment
2=unavailability of
equipment
3=limited market for
value added products
4=Inadequate value
addition skills
5=Ready market for raw
milk
What determines the
quantity in which you
process
1=Capacity of
processing equipment
2= need to meet market
demand
3=need to expand the
market 4= capacity of
storage facility
5= other (specify
Do you have
any formal
training on
the activity?
1=Yes
0 =No
If No formal
training, where did
you acquire the
knowledge
1=traditionally
2=though other
farmers
3=specify
Purpose for value
addition
1= own consumption
2 =for sell
[_____]
Page 73
60
[_____] [_____] [_____] [_____] [_____]
3.9 Has any member of your household been trained in any milk value adding methods? Yes [____] No [_____]
If yes, provide the following information
Member
trained
1=househ
old head
2=spouse
3=son
4=Daught
er
5=Other
(specify)
Value
addition
knowledge
1=Cooling
2=Yorghurt,
3=Mursik/M
ala
4=Cheese
5=Ghee
6=other
(specify)
When
traine
d
Training
provider
1=NGOs
2=Ministry
of
agriculture
3=college
4=Universit
y
5=Any
other(specif
y)
Method of
training
1=workshop
2=Full time
Who paid for
the training?
1=self
2=Government
3=donor
What
influenced the
need to train?
1=own
motivation
2=other
farmers
3=Family
members
4=Ministry
officials
5=other(specif
y)
Do you
apply the
training
knowledg
e
1=yes
0=No
If yes
Which
one
If no why
1=capital
constraint
2=inadequat
e training
3=Not
interested
[_______] [________] [____] [________] [_______] [_________] [________] [_____] [_____] [_____]
3.10 Over the past year, how much have you received for each dairy product sold?
Raw milk
Buyer type
Selling price
per liter at
farm gate
Quantity
delivered to
buyer
Packaging
cost
Transport cost Time taken to
look for buyer
Licensing cost Selling price to
the buyer
1________
Page 74
61
2________
3________
4________
5________
6________
7________
Product Quantity of
raw milk
used per
litre
Cost of ingredients Utility cost Packaging
cost
Transpor
t cost
Labo
r cost
Selling Price per
unit
Flavor Sugar Other
(specify)
_____
__
Electricit
y
Water Other
(specify)
Mala
Yoghurt
Cheese
Ghee
Other
(specify)
3.11 What strengths or weaknesses, if any, do you face in milk marketing?
Strength Weaknesses
demand
prices
Transport
Page 75
62
contractual arrangement
standards
access to markets
road network
Other(specify)
Page 76
63
Appendix 2: survey questionnaire: Self-help groups
SERIAL NO ___________________________________DATE OF INTERVIEW _______________________________________
NAME (Optional) _____________________________________________
1.0 GENERAL INFORMATION
2.0 PLEASE PROVIDE THE FOLLOWING INFORMATION
Age of the
group(years)
Size of the
group/enter
prise
Estimated value
of
enterprise(KES)
Activity
1=processing
2= distributing
3=Marketing
4=Support
5=Any other
(specify)]
Other
income
generating
activity
Distance
from the
group to
the
nearest
major
market
Do you have
any motorable
transport
1=Motor cycle
2=Vehicle
Road type
from the
homestead to
the main road
0=Earth road
1=Murram
2=Tarmac
[_______] [_____] [________] [________] [______] [_____] [________] [________]
2.1 Have you undertaken any of the following activities in the last three years?
Activity Response
1= yes
2= no
If yes above, what factors influenced your choice
to undertake the activity?
1=low cost 2=Buyer needs 3=regulatory board
requirements 4=Availability 5=Gain competitiveness
6=Increase profits
7=Increase efficiency 8=Expand customer base
9=other (specify)_________________
If NO, do you have plans
for engaging or improving
any of the mentioned
activities
1= yes
2= no
Page 77
64
Bought new machinery
Increased products
Increased technology use
Increased delivery speed (to
customer)
Expanded market
Improved quality and safety of milk
Cut down losses
2.2 Do you add value to raw milk/any dairy products you handle?
1=yes [________] 0 No [__________]
2.3 Has your staff been trained in any milk value adding methods?
Yes [________] No [_________]
If yes, provide the following information
Staff
trained
1=Manager
2=Proccessi
ng staff
3=any
Value
addition
knowledge
1=Cooling
2=Yorghurt
,
When
trained
Training
provider
1=NGOs
2=Ministry
of
Method of
training
1=workshop
2=Full time
Who paid for
the training?
1=self
2=Government
3=donor
What
influenced the
need to train?
1=own
motivation
2=other
Do you
apply the
training
knowledg
e
1=yes
If yes
Which
one
(specify
)
If no why
1=capital
constraint
2=inadequat
e training
Page 78
65
other(specif
y)
________
3=Mursik/
Mala
4=Cheese
5=Ghee
6=other
(specify)
agriculture
3=college
4=Universit
y
5=Any
other(specif
y)
4=The group competitors
3=Ministry
officials
5=other(specif
y)
0=No 3=Not
interested
[________] [________] [_____] [________] [_______] [_________] [__________] [_____] [_____] [_____]
1.6. Do you regularly change the specifications of your product according to new trends and developments on the market? (e.g. the design of a
product)
Please provide the following information
Products
1=mala
2=yoghurt
3=ghee
4=cheese
5=any
other
If yes What factors have
influenced your decisions
to add value?
1= Availability of
equipment
2= Have the skills
3= need to meet market
demand
4=need to expand the
market
5=increase profits
6=other(specify ………..
If No, what factors constrain you from
performing the mentioned activities?
1= High costs of value addition
equipment
2=unavailability of equipment
3=limited market for value added
products
4=Inadequate value addition skills
5=Ready market for raw milk
6= others
(specify)……………………………..
What determines the quantity in
which you process or add value?
1=Capacity of processing equipment
2= need to meet market demand
3=need to expand the market
4= capacity of storage facility
5= other (specify
………………………….
Page 79
66
[___________________] [______________________] [______________________]
2.4 Please provide the following information
Buyer type Terms of
payment
1= on the spot
2= weekly
3= monthly [ ]
4=other
(specify……
………………
Cost
per
litre
Point of
sale/colle
ction
point
Distance
to the
point of
sale
delivery/colle
ction
Responsibility
for
1=buyer
2=seller(group
)
If seller ,Time
taken to deliver
to
collection/sales
point
If seller,
Means of
transport to
collection/sal
es point
1= foot
2=Bicycle
3=motorcycle
4=vehicle
If seller
Cost of
transport
to the point
of sale(per
trip)
Type 1
[________]
Type 2
[________]
Type 3
[________]
Type 4
[_________]
Type 5
[________]
Type 6
[_________]
Page 80
67
2.5 Do you buy evening milk from farmers/your suppliers? 1=yes [______] 0=No [______]
If no, why?
2.6 Please provide the following information on the dairy products
Raw milk
Buyer type
Selling price
per liter at
farm gate
Quantity
delivered to
buyer
Packaging
cost
Transport cost Time taken to
look for buyer
Licensing cost Selling price to
the buyer
1________
2________
3________
4________
5________
6________
7________
8________
Product Quantity of
raw milk
used per
litre
Cost of ingredients Utility cost Packagin
g cost
Transpo
rt cost
Labo
r
cost
Selling Price per
unit Flavo
r
Suga
r
Other
(specify)
_____
__
Electicit
y
Wate
r
Other
(specify
)
Mala
Yoghurt
Page 81
68
Cheese
Ghee
Other
(specify
)
Please provide the following information
What marketing strategy
do you employ to gain
competitiveness in your
market
1= Pricing (eg through raising
or lowering prices)
2=Promotion eg through
adverts
3= Distributing to customers
4= Providing the right product
needed in the market
5=other(specify)_________
______
Do you have any linkages
with the following?
1= Ministry of livestock
development
2=Credit lending
institutions
(specify)……………..
3= Research institutions
4= Kenya dairy Board
5=others
specify)…………………
What constraints, if
any, do you face in milk
processing?
1=inadequate processing
skills
2=inadequate capacity
3=inadequate equipment
4=standard regulations
5=Cost of equipment
6=Any other
Do you offer any other
services to your
customers apart from
buying milk?
1=yes 0=No
If yes, please specify
1= training
2= loans
3=free transport
4=other (specify)
[____________] [____________] [____________] [____________] [____________]
What constraints, if any, do you face in milk marketing? Do you get any If no, which areas
Page 82
69
1=low demand
2=low prices
3=High cost of transport
4=Unfavorable contractual arrangement
5=Inability to meet required standards
6=limited access to certain markets
7=poor road network
8=Uncertainty of prices
support from
government agencies
or donors in relation to
your dairy enterprise
1=yes
2=no
would you like to have
support in your dairy
enterprise?
(Please specify)
1=Training
2=Marketing
3=credit
4=Any (specify)
_______________
Thank you
Page 83
70
APPENDIX 3: Probit regression results
Probit regression showing factors that influence decisions to add value to milk
_cons -1.758371 .9124396 -1.93 0.054 -3.54672 .0299778 MOT_TRSNPT -.7271598 .370773 -1.96 0.050 -1.453862 -.0004581 DIST_MKT -.0719227 .0487946 -1.47 0.140 -.1675582 .0237129 DIST_RD .1196157 .0909988 1.31 0.189 -.0587388 .2979701 STDS -.2001277 .4257319 -0.47 0.638 -1.034547 .6342916DELIVERYTIME .639959 .4175327 1.53 0.125 -.1783901 1.458308 QUALITY -.708926 .4219841 -1.68 0.093 -1.536 .1181477 CUT_LOSS 1.133711 .468937 2.42 0.016 .2146118 2.052811 HUSD_SKILLS -.7423081 .3461202 -2.14 0.032 -1.420691 -.063925 GRP_BLG -.3667624 .3537523 -1.04 0.300 -1.060104 .3265793 TOP_MONTHLY -.6546579 .3115999 -2.10 0.036 -1.265383 -.0439333 BARGN_POWR .4878061 .3513866 1.39 0.165 -.2008989 1.176511 VAL_SKILLS 1.555673 .3888559 4.00 0.000 .7935295 2.317817 ROAD_NETWKS .3809057 .3026197 1.26 0.208 -.212218 .9740294 MLK_PRIC 1.13278 .3724658 3.04 0.002 .4027604 1.862799 cows .1113229 .0496565 2.24 0.025 .0139979 .2086479 EXP_DAIRY -.054907 .0228303 -2.41 0.016 -.0996536 -.0101604 EDUC -.0582596 .1610569 -0.36 0.718 -.3739254 .2574062 AGE .0098298 .0159057 0.62 0.537 -.0213448 .0410044 SEX -.8499078 .3215787 -2.64 0.008 -1.480191 -.2196251 MLKFM_BSEL Coef. Std. Err. z P>|z| [95% Conf. Interval]
Log likelihood = -52.168 Pseudo R2 = 0.4516 Prob > chi2 = 0.0000 LR chi2(19) = 85.92Probit regression Number of obs = 261
Page 84
71
APPENDIX 4: marginal effects after probit
(*) dy/dx is for discrete change of dummy variable from 0 to 1 MOT_TR~T* -.0253037 .01587 -1.59 0.111 -.056405 .005798 .298851DIST_MKT -.0031587 .00229 -1.38 0.168 -.007653 .001336 5.01169 DIST_RD .0052533 .00414 1.27 0.205 -.002866 .013373 1.41161 STDS* -.0078301 .01473 -0.53 0.595 -.036707 .021047 .214559DELIVE~E* .0401358 .03638 1.10 0.270 -.03117 .111441 .260536 QUALITY* -.0287654 .0195 -1.47 0.140 -.066994 .009463 .398467CUT_LOSS* .0323115 .01805 1.79 0.073 -.003071 .067694 .758621HUSD_S~S* -.0268725 .01767 -1.52 0.128 -.061509 .007764 .32567 GRP_BLG* -.0196808 .02297 -0.86 0.392 -.064698 .025336 .743295TOP_MO~Y* -.0372853 .025 -1.49 0.136 -.086292 .011721 .655172BARGN_~R* .0215136 .01806 1.19 0.233 -.013874 .056901 .528736VAL_SK~S* .218328 .09923 2.20 0.028 .023832 .412824 .126437ROAD_N~S* .0193821 .01861 1.04 0.298 -.017084 .055849 .337165MLK_PRIC* .098442 .05626 1.75 0.080 -.011833 .208716 .241379 cows .0048891 .00277 1.76 0.078 -.000549 .010327 3.81609EXP_DA~Y -.0024114 .00136 -1.77 0.076 -.005079 .000256 14.4176 EDUC -.0025587 .0072 -0.36 0.722 -.016666 .011549 1.89272 AGE .0004317 .00074 0.59 0.558 -.001013 .001876 44.1341 SEX* -.0480225 .02782 -1.73 0.084 -.10254 .006495 .59387 variable dy/dx Std. Err. z P>|z| [ 95% C.I. ] X = .01783334 y = Pr(MLKFM_BSEL) (predict)Marginal effects after probit
Page 85
72
APPENDIX 5: Tobit regression results
Tobit regression showing factors that influence decisions by farmers to participate in a dairy
channel
0 right-censored observations 221 uncensored observations Obs. summary: 24 left-censored observations at RM_QNTY_BYR1<=0 /sigma 10.19947 .4939933 9.225928 11.17301 _cons -5.575588 4.146137 -1.34 0.180 -13.74661 2.595438 cows .3678306 .2454593 1.50 0.135 -.1159099 .8515711 TOP_CASH 2.017604 1.832474 1.10 0.272 -1.593755 5.628964 VAL_SKILLS 1.334131 2.251175 0.59 0.554 -3.102387 5.770649 ROAD_NETWKS -.5013616 1.817651 -0.28 0.783 -4.083508 3.080785 ACCESS_MKT 1.313288 1.915521 0.69 0.494 -2.461738 5.088314 STANDRD -.0485411 1.712039 -0.03 0.977 -3.422553 3.325471 MLK_TRSNP -3.298669 1.736614 -1.90 0.059 -6.721113 .1237743 MLK_PRIC 2.040369 1.903371 1.07 0.285 -1.710711 5.791448 MLK_DEMND -1.214684 2.00402 -0.61 0.545 -5.16412 2.734752 MLKFM_BSEL 3.914552 2.532439 1.55 0.124 -1.076269 8.905372 BUYER_EASY 2.971778 1.9703 1.51 0.133 -.9112026 6.854759 PRESV_MLK 4.25492 1.612001 2.64 0.009 1.078059 7.431781 SELL_MLK 1.063148 1.490723 0.71 0.476 -1.874704 4.001 GRP_BLG 2.511935 1.675433 1.50 0.135 -.7899355 5.813806 HEALTHSTDS 3.459947 1.659835 2.08 0.038 .1888168 6.731078 RELIABILITY -1.138604 1.598126 -0.71 0.477 -4.288121 2.010913DELIVERYTIME -.6915792 2.053537 -0.34 0.737 -4.738599 3.355441 QUALITY -.5079155 1.786806 -0.28 0.776 -4.029275 3.013444 MOT_TRSNPT 2.635057 1.663858 1.58 0.115 -.6440016 5.914115 DIST_MKT .2538857 .1472021 1.72 0.086 -.0362138 .5439851 DIST_RD .5477848 .3653326 1.50 0.135 -.1721967 1.267766 EDUC .8682255 .7898102 1.10 0.273 -.6882979 2.424749 AGE .0272977 .0539974 0.51 0.614 -.0791181 .1337135 SEX .423307 1.460455 0.29 0.772 -2.454893 3.301507 RM_QNTY_BYR1 Coef. Std. Err. t P>|t| [95% Conf. Interval]
Log likelihood = -850.47508 Pseudo R2 = 0.0313 Prob > chi2 = 0.0003 LR chi2(24) = 54.92Tobit regression Number of obs = 245
Page 86
73
APPENDIX 6: Marginal effects after Tobit
APPENDIX 7:Probit results
Probit regression showing factors influencing decisions to participate in a group
(*) dy/dx is for discrete change of dummy variable from 0 to 1 cows .3678306 .24546 1.50 0.134 -.113261 .848922 3.82041TOP_CASH* 2.017604 1.83247 1.10 0.271 -1.57398 5.60919 .204082VAL_SK~S* 1.334131 2.25118 0.59 0.553 -3.07809 5.74635 .126531ROAD_N~S* -.5013616 1.81765 -0.28 0.783 -4.06389 3.06117 .355102ACCESS~T* 1.313288 1.91552 0.69 0.493 -2.44106 5.06764 .546939 STANDRD* -.0485411 1.71204 -0.03 0.977 -3.40408 3.30699 .567347MLK_TR~P* -3.298669 1.73661 -1.90 0.058 -6.70237 .105032 .4MLK_PRIC* 2.040369 1.90337 1.07 0.284 -1.69017 5.77091 .253061MLK_DE~D* -1.214684 2.00402 -0.61 0.544 -5.14249 2.71312 .820408MLKFM_~L* 3.914552 2.53244 1.55 0.122 -1.04894 8.87804 .114286BUYER_~Y* 2.971778 1.9703 1.51 0.131 -.889939 6.8335 .840816PRESV_~K* 4.25492 1.612 2.64 0.008 1.09546 7.41438 .314286SELL_MLK* 1.063148 1.49072 0.71 0.476 -1.85862 3.98491 .432653 GRP_BLG* 2.511935 1.67543 1.50 0.134 -.771854 5.79572 .742857HEALTH~S* 3.459947 1.65984 2.08 0.037 .20673 6.71316 .465306RELIAB~Y* -1.138604 1.59813 -0.71 0.476 -4.27087 1.99367 .534694DELIVE~E* -.6915792 2.05354 -0.34 0.736 -4.71644 3.33328 .273469 QUALITY* -.5079155 1.78681 -0.28 0.776 -4.00999 2.99416 .412245MOT_TR~T* 2.635057 1.66386 1.58 0.113 -.626045 5.89616 .302041DIST_MKT .2538857 .1472 1.72 0.085 -.034625 .542396 5.03212 DIST_RD .5477848 .36533 1.50 0.134 -.168254 1.26382 1.42143 EDUC .8682255 .78981 1.10 0.272 -.679774 2.41623 1.88163 AGE .0272977 .054 0.51 0.613 -.078535 .133131 44.0449 SEX* .423307 1.46045 0.29 0.772 -2.43913 3.28575 .608163 variable dy/dx Std. Err. z P>|z| [ 95% C.I. ] X = 8.2808086 y = Linear prediction (predict)Marginal effects after tobit
Page 87
74
_cons -.9965578 .9806515 -1.02 0.310 -2.918599 .9254838
BARGN_POWR .3755918 .2408402 1.56 0.119 -.0964464 .84763
CREDIT 2.726056 .5119202 5.33 0.000 1.722711 3.729401
BUYER_EASY -.3633631 .3233298 -1.12 0.261 -.9970778 .2703516
MLK_PRIC -.4356591 .2620896 -1.66 0.096 -.9493454 .0780271
TTR2 .0032841 .0136003 0.24 0.809 -.023372 .0299403
Mot_transport .6194523 .2988844 2.07 0.038 .0336497 1.205255
livestock_ent -1.981003 .842584 -2.35 0.019 -3.632438 -.3295692
BUYERneighb -.9884936 .2624776 -3.77 0.000 -1.50294 -.4740469
KNWDGE_VAL 1.313599 .5211679 2.52 0.012 .2921282 2.335069
mode_vehicle -.315572 .3448225 -0.92 0.360 -.9914116 .3602676
DIST_MKTsq -.2710224 .1223494 -2.22 0.027 -.5108229 -.0312219
lAGE .4162649 .2319142 1.79 0.073 -.0382786 .8708085
SEX .2575158 .2434033 1.06 0.290 -.2195459 .7345774
Educ_none .6114488 .8862943 0.69 0.490 -1.125656 2.348554
Act_business .4051484 .3526133 1.15 0.251 -.285961 1.096258
BUYERprocessor .9087318 .2650706 3.43 0.001 .3892029 1.428261
GRP_BLG Coef. Std. Err. z P>|z| [95% Conf. Interval]
Log likelihood = -86.687779 Pseudo R2 = 0.4507
Prob > chi2 = 0.0000
LR chi2(16) = 142.24
Probit regression Number of obs = 274
Page 88
75
APPENDIX 8: Marginal effects after probit
(*) dy/dx is for discrete change of dummy variable from 0 to 1
BARGN_~R* .0597479 .04206 1.42 0.155 -.022692 .142188 .518248
CREDIT* .3577909 .0466 7.68 0.000 .266457 .449125 .368613
BUYER_~Y* -.0480989 .03707 -1.30 0.194 -.120759 .024561 .839416
MLK_PRIC* -.0798756 .05804 -1.38 0.169 -.193637 .033886 .233577
TTR2 .000515 .00215 0.24 0.811 -.003706 .004736 15.959
Mot_tr~t* .0828892 .03726 2.22 0.026 .009859 .155919 .29927
livest~t* -.6367488 .27974 -2.28 0.023 -1.18503 -.088468 .021898
BUYERn~b* -.1856457 .0646 -2.87 0.004 -.312257 -.059034 .375912
KNWDGE~L* .1118912 .036 3.11 0.002 .041338 .182444 .138686
mode_v~e* -.0557091 .068 -0.82 0.413 -.188993 .077575 .222628
DIST_M~q -.0425024 .02134 -1.99 0.046 -.084322 -.000682 1.95088
lAGE .0652797 .03976 1.64 0.101 -.012648 .143207 3.69585
SEX* .0418351 .04109 1.02 0.309 -.038702 .122372 .594891
Educ_n~e* .0630476 .05602 1.13 0.260 -.046741 .172836 .018248
Act_bu~s* .0514553 .03859 1.33 0.182 -.024186 .127097 .124088
BUYERp~r* .1385582 .04909 2.82 0.005 .042339 .234777 .452555
variable dy/dx Std. Err. z P>|z| [ 95% C.I. ] X
= .91411365
y = Pr(GRP_BLG) (predict)
Marginal effects after probit