30
ANALYSIS OF MINING SAMPLES USING INFRARED SPECTROSCOPY AND MACHINE LEARNING MATLAB CONFERENCE PERTH, MAY 2017

ANALYSIS OF MINING SAMPLES USING INFRARED SPECTROSCOPY AND MACHINE LEARNING
MATLAB CONFERENCE
PERTH, MAY 2017

SUMMARY
© Copyright Bureau Veritas
01
Who is Bureau Veritas?
02
Bureau Veritas Minerals Services
Infrared Spectroscopy
03
Machine Learning and Matlab
04
Summary
05

01WHO IS BUREAU VERITASEstablished in 1828, Bureau Veritas is a global leader in Testing, Inspection & Certification services in the areas of Quality, Health & Safety, Environment and Social Responsibility across eight global businesses.
© Copyright Bureau Veritas

4
8 GLOBAL BUSINESSES2015 REVENUE: €4.6 BILLION
Marine & Offshore
Commodities Government Services & International Trade
Consumer Products
In-Service Inspection & Verification
CertificationConstructionIndustry
23% 13% 11% 8%
8% 17% 14% 6%
Global network comprising of 66,500 employees in
1400 offices and laboratories across 140
countries.

02BUREAU VERITAS MINERALS SERVICES
© Copyright Bureau Veritas

© Copyright Bureau Veritas


8
© Copyright Bureau Veritas9
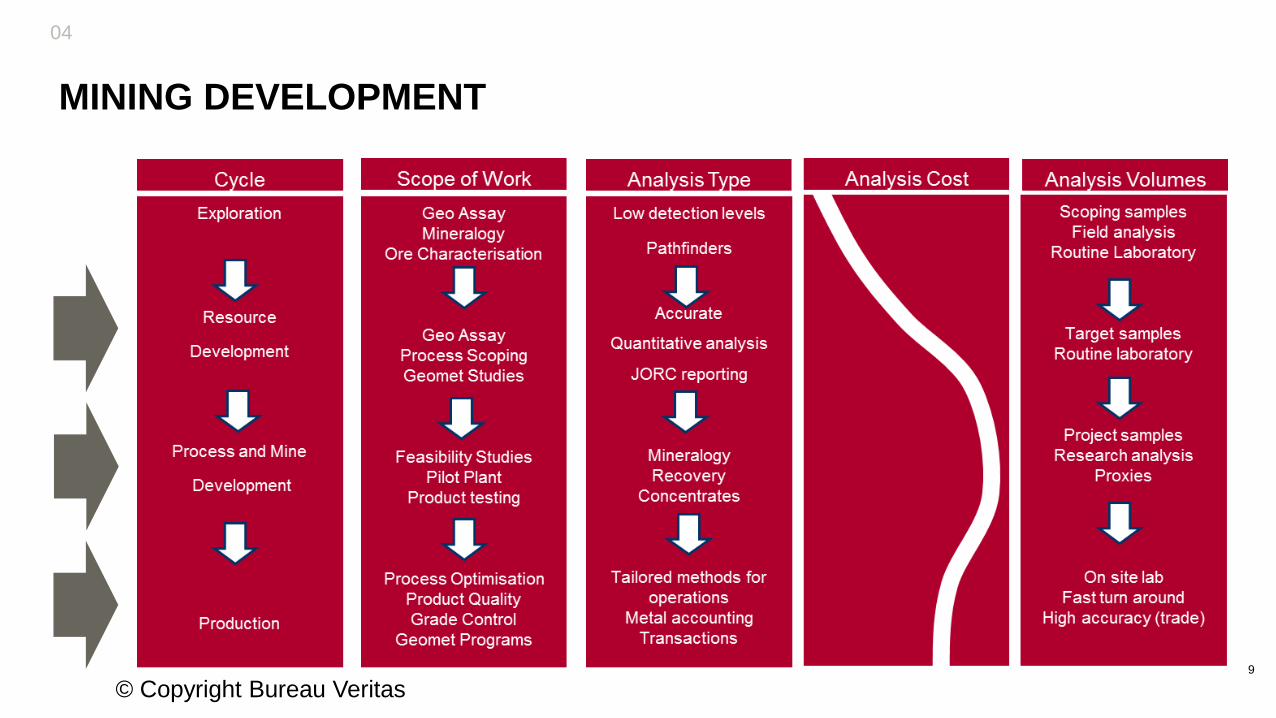
04
MINING DEVELOPMENT

© Copyright Bureau Veritas10
03INFRAREDSPECTROSCOPY

Sample is presented to a light source. – No special preparation
The response from the sample is measured by a detector.
Near Infrared, Short Wave Infrared
FTIR – Fourier Transform Infrared Spectroscopy – Mid to Thermal Infrared
Spectra is representative of the molecular bonding in the sample
Absorption of incident light at specific characteristic wavelengths
Bond vibration, bending and stretching
© Copyright Bureau Veritas
03
INFRARED SPECTROSCOPY
© Copyright Bureau Veritas12
03
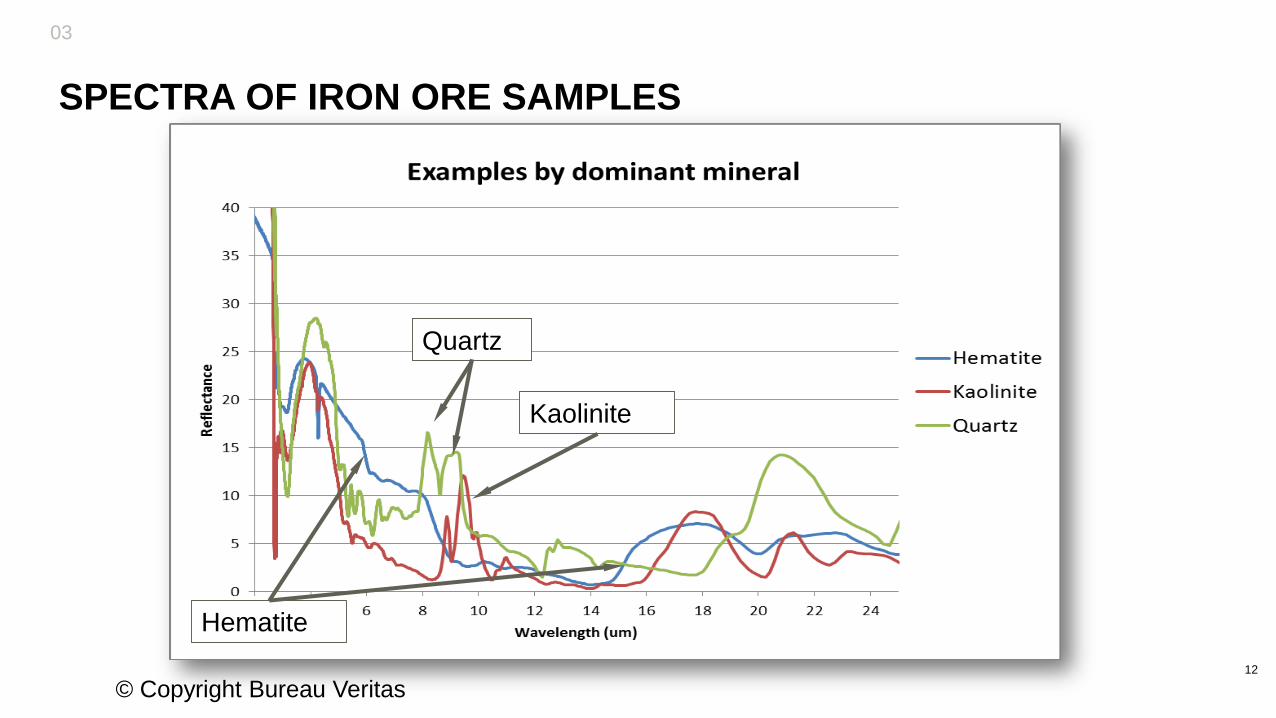
SPECTRA OF IRON ORE SAMPLES
Quartz
Kaolinite
Hematite

© Copyright Bureau Veritas13
03
EXAMPLE SPECTRA
1200 – 2500 Datapoints per sample

© Copyright Bureau Veritas14
03
SPECTRAL INTERPRETATION
► Spectral Library
► Analyse Features for
DEPTH
LOCATION
SHAPE
► Major Minerals Only

© Copyright Bureau Veritas15
04MACHINE LEARNING AND MATLAB
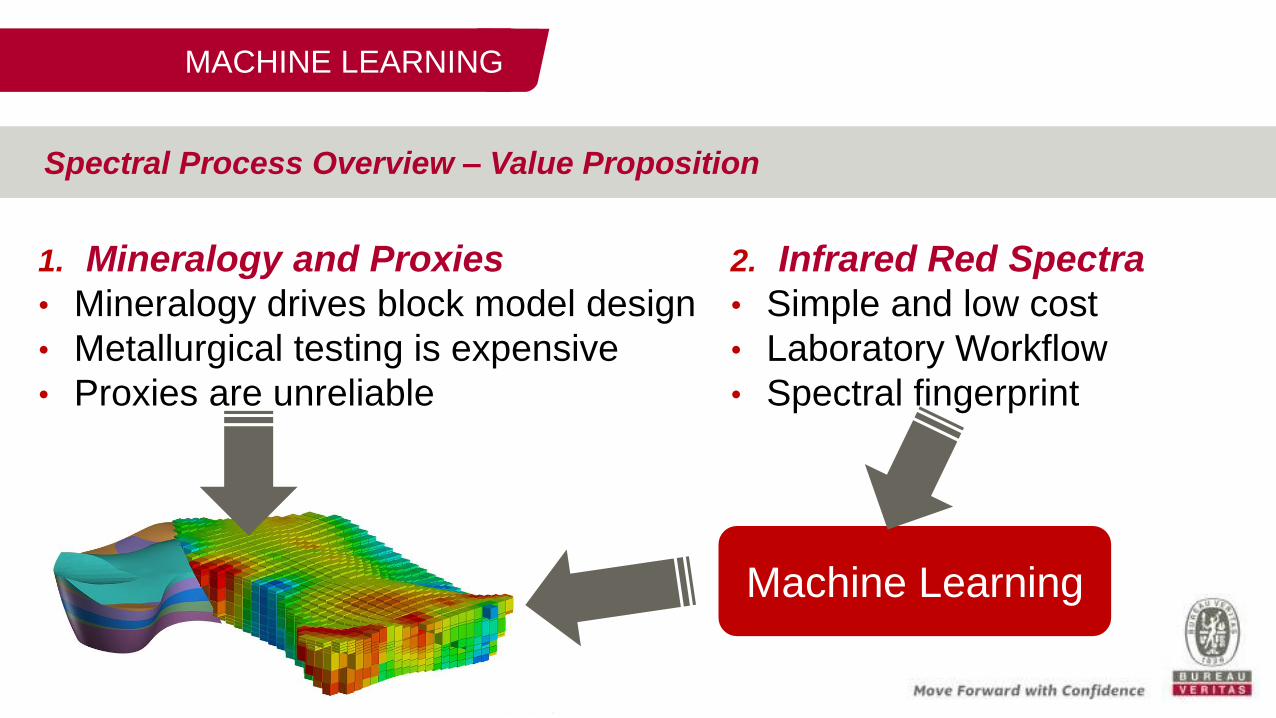
MACHINE LEARNING
2. Infrared Red Spectra
• Simple and low cost
• Laboratory Workflow
• Spectral fingerprint
Spectral Process Overview – Value Proposition
1. Mineralogy and Proxies
• Mineralogy drives block model design
• Metallurgical testing is expensive
• Proxies are unreliable
Machine Learning

MACHINE LEARNING
How do we use this data for routine analysis?
Two step process:

►Mineralogy
• Hematite, Goethite, Gibbsite, Kaolinite, Talc, Mica, Quartz
►Physical properties
• LOI, SG, Bulk Density
►Ore processing properties
• Comminution energy, recovery, acid consumption
►Chemistry
• Fe, Al, Si for laterites and Cu, Ni, Pb, Zn for base metal ores
MACHINE LEARNING

RESULTS Matrix/dominant minerals – Fe ore

RESULTS Matrix/dominant minerals – Fe ore

RESULTS Substitution Analyte – Fe ore
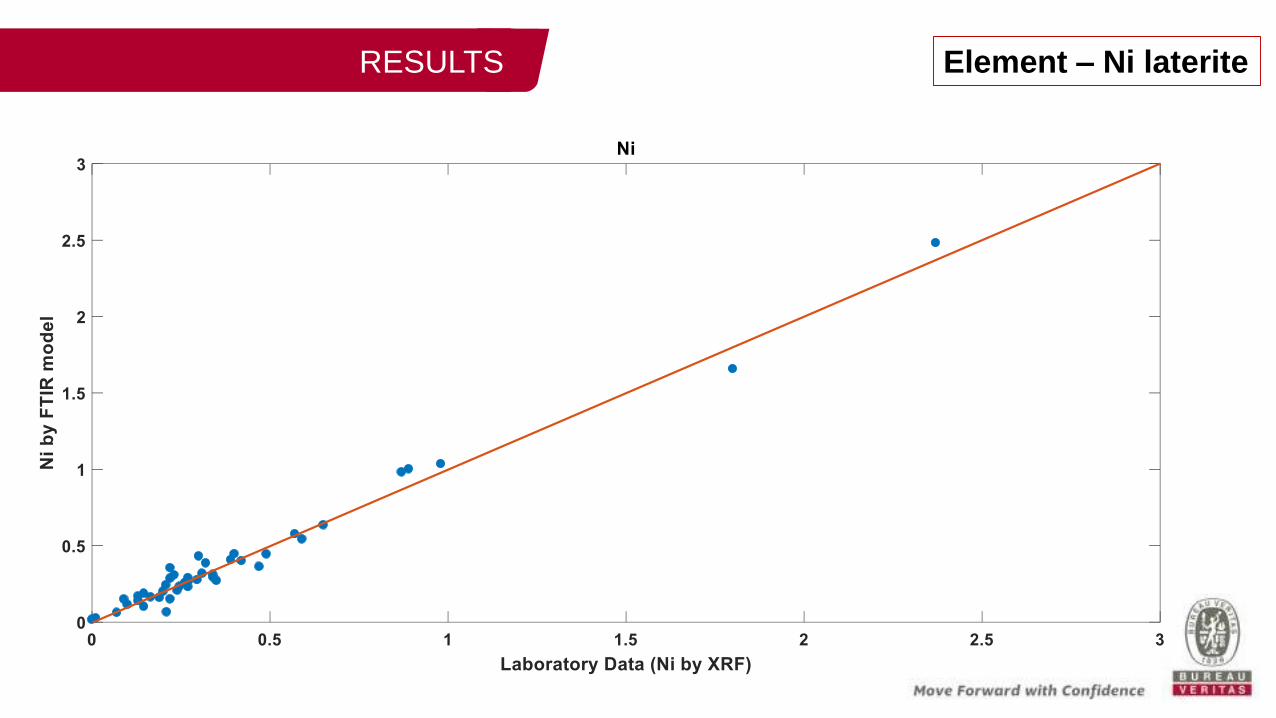
Element – Ni lateriteRESULTS

Element speciation – Fe2+RESULTS

Physical property - DensityRESULTS
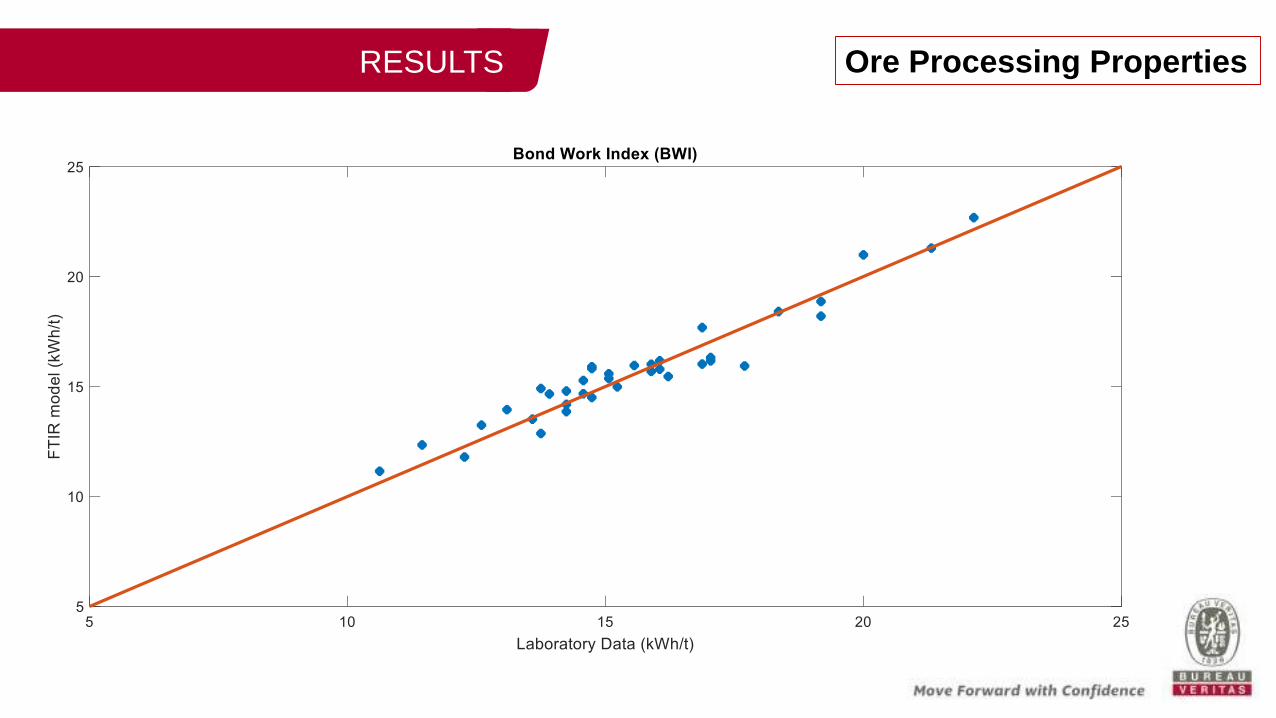
RESULTS Ore Processing Properties

APPLICATION DEPLOYMENT - OPERATIONS04

© Copyright Bureau Veritas27
05SUMMARY

► Low cost analysis (Spectral <$10 per sample vs XRD >$100 per sample)
► Obtain complete mine picture from a routine laboratory workflow
► Predict future processing conditions – high value data !!
► Create a digital mine record.
SUMMARY05

AUSIMM IRON ORE 2017
Fourier Transform Infrared (FTIR) spectroscopy and other NIR tools have been used in the bauxite industry for many
years. Infrared spectroscopy exploits the differences in chemical composition and lattice structure to produce a
characteristic response. Spectral devices, such as those from ASD Inc. and the HyloggerTM, provide qualitative
mineralogical data targeted towards hydrated minerals detected in the near and short wave infrared region. The FTIR
spectrum extends into the mid and thermal infrared range and can therefore respond to the presence of silicates and
oxides, in addition to hydrates and carbonates.
The key to successful utilisation of infrared spectra, however, is the interpretation methodology. In this study, FTIR
spectra were calibrated against quantitative x-ray diffraction data for the determination of the mineralogy of iron ore. A
full pattern machine learning technique was utilised for the calibration, and the assessment of the regressions
determined from an independent validation set. The abundance of key minerals - hematite, goethite, kaolinite and
quartz - were determined and the results correlated against X-ray fluorescence assays and loss on ignition data. The
results of the study indicate that spectral techniques using a full pattern machine learning approach and artificial
neural networks can be used successfully to obtain objective and quantitative mineralogical data to support field
observations and analytical results for iron ore resource modelling. A comparison of this technique to the cost, quality
and timeliness of other quantitative mineralogy tools is also made.
Determination of Iron Ore Mineralogy using Fourier
Transform Infrared Spectroscopy: a Chemometric Approach.
J Carter, K Auyong and L Dixon
Bi-Annual premier iron ore conference – July 2017