INTERNET PROTOCOLS, TECHNOLOGY AND APPLICATIONS (VoIP) Analysis of MPEG-4 scalable encoded video S.H. Mian Abstract: Streaming video is expected to account for a considerable percentage of traffic on both wired and wireless networks, and is expected to be encoded in a scalable fashion and have a heterogeneous quality. The author discusses a key standard that has introduced such improvements, namely MPEG-4, and outlines a statistical study of predominantly single layer (non-scalable) and temporal/spatial (scalable) MPEG-4 encoded video of differing quality. The results are reported by illustrating the scaling behaviour of such traffic and conclusions are drawn concerning the potential impact on future telecommunication networks. 1 Introduction The combination of text, audio, graphics, video and virtual reality in multimedia communications is producing a revolution in the way information and communications are shared. There is now demand for more predictable and higher quality services over the Internet, driven by the increasing commercial importance of services supported over the Internet (i.e. the Internet has become a mission- critical resource) and by the desire to support delay- intolerant services such as IP telephony and streaming audio/video [1]. Video traffic is expected to account for a more substantial portion of the total traffic carried over the Internet and next generation wireless networks. Video is usually encoded, using lossy compression, in order to reduce bandwidth for transportation over networks. However, such compressed streams change the nature of the traffic load compared with other streams as such video streams exhibit highly variable bit rates (VBR) and possess long-range dependent (LRD) properties. Until recently, most of the research community have studied the characteristics of single-layer MPEG-1 encoded video at a fixed quality [2–4] , because of a shortage of video traces encoded with different quality levels and scalability. Evaluation and understanding of the behaviour of single and aggregated MPEG-4 video streams will become increasingly important as video traffic over the Internet and wireless networks will be significantly different from the single layer MPEG-1. 2 MPEG-4: the next generation MPEG-4 is the worldwide standard for interactive multi- media creation, delivery and playback for the Internet [5] . MPEG-4 is an extensive set of key enabling technology specifications with audio and video at its core. It was defined by the Moving Picture Experts Group (MPEG), the working group within the International Organisation for Standardisation (ISO) that specified the widely adopted standards known as MPEG-1 and MPEG-2. Hundreds of researchers around the world contributed to MPEG-4, which was finalised in October 1998 and became an international standard in 2000 [6] . Characteristics of MPEG-1, MPEG-2 and MPEG-3 are summarised in Fig. 1. The use of MPEG-4 enables media companies to save time and resources by encoding material once for playback everywhere. The background to MPEG-4 over the past ten years is depicted in Fig. 2. Resources saved in encoding, hosting, and storing media can be used to create a wider library of digital media, which benefits the entire Internet community. MPEG-1 as well as MPEG-2, provide interoperable ways of representing audio/visual content, commonly used on digital media and on the air. MPEG-4 extends this to many more application areas through features like its extended bit rate range, its scalability, its error resilience, its seamless integration of different types of ‘objects’ in the same scene and its powerful ways to build interactivity into content. MPEG-4 is proving its viability in the market as an open standard for multimedia. The full range of utilities is now available: players, servers, hardware and software, testing systems, IP cores, and authoring tools are all being readied. This technology has produced a major step towards more interoperability in multimedia. Already, work on future Fig. 1 MPEG-1, MPEG-2 and MPEG-4 The author is with the Cardiff School of Engineering, Electronic Division, Cardiff University, Queen’s Buildings, P.O. Box 689, Newport Road, Cardiff, CF2 3TF, UK r IEE, 2004 IEE Proceedings online no. 20040299 doi:10.1049/ip-com:20040299 Paper received 8th May 2003 270 IEE Proc.-Commun., Vol. 151, No. 3, June 2004
Transcript
INTERNET PROTOCOLS, TECHNOLOGY AND APPLICATIONS (VoIP)
Analysis of MPEG-4 scalable encoded video
S.H. Mian
Abstract: Streaming video is expected to account for a considerable percentage of traffic on bothwired and wireless networks, and is expected to be encoded in a scalable fashion and have aheterogeneous quality. The author discusses a key standard that has introduced suchimprovements, namely MPEG-4, and outlines a statistical study of predominantly single layer(non-scalable) and temporal/spatial (scalable) MPEG-4 encoded video of differing quality. Theresults are reported by illustrating the scaling behaviour of such traffic and conclusions are drawnconcerning the potential impact on future telecommunication networks.
1 Introduction
The combination of text, audio, graphics, video and virtualreality in multimedia communications is producing arevolution in the way information and communicationsare shared. There is now demand for more predictable andhigher quality services over the Internet, driven by theincreasing commercial importance of services supportedover the Internet (i.e. the Internet has become a mission-critical resource) and by the desire to support delay-intolerant services such as IP telephony and streamingaudio/video [1].
Video traffic is expected to account for a more substantialportion of the total traffic carried over the Internet and nextgeneration wireless networks. Video is usually encoded,using lossy compression, in order to reduce bandwidth fortransportation over networks. However, such compressedstreams change the nature of the traffic load compared withother streams as such video streams exhibit highly variablebit rates (VBR) and possess long-range dependent (LRD)properties.
Until recently, most of the research community havestudied the characteristics of single-layer MPEG-1 encodedvideo at a fixed quality [2–4], because of a shortage of videotraces encoded with different quality levels and scalability.Evaluation and understanding of the behaviour of singleand aggregated MPEG-4 video streams will becomeincreasingly important as video traffic over the Internetand wireless networks will be significantly different from thesingle layer MPEG-1.
2 MPEG-4: the next generation
MPEG-4 is the worldwide standard for interactive multi-media creation, delivery and playback for the Internet [5].MPEG-4 is an extensive set of key enabling technologyspecifications with audio and video at its core. It wasdefined by the Moving Picture Experts Group (MPEG), theworking group within the International Organisation forStandardisation (ISO) that specified the widely adopted
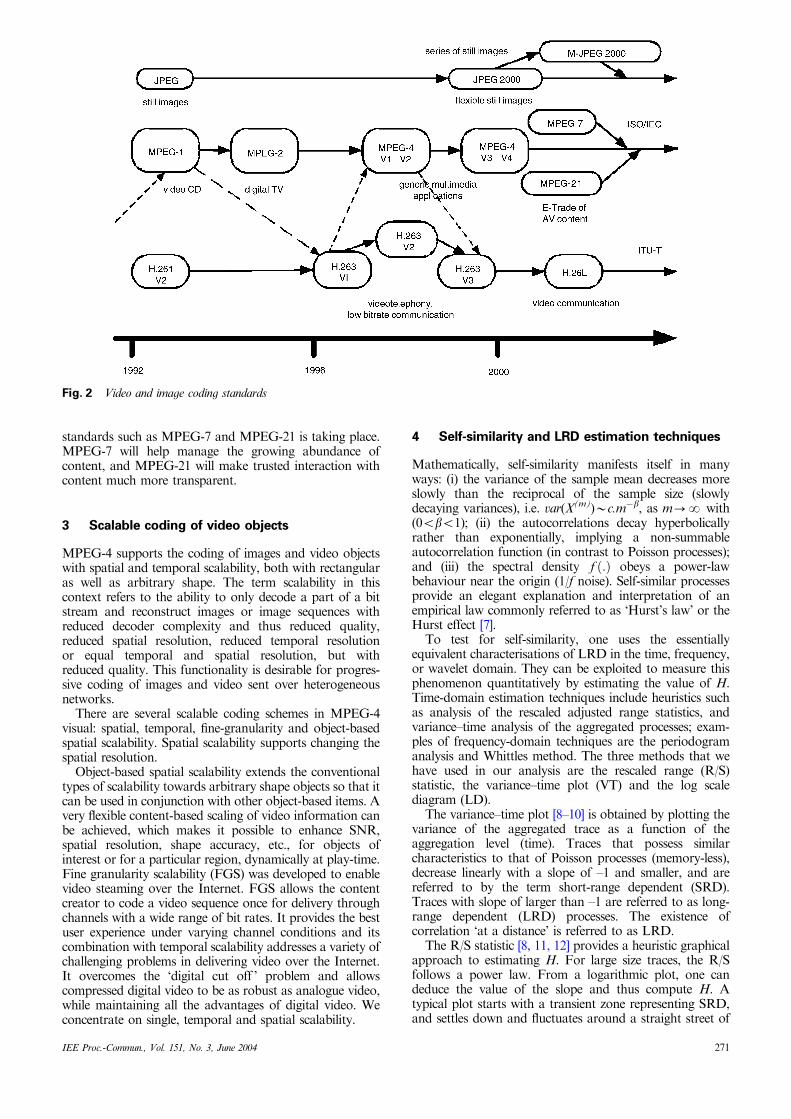
standards known as MPEG-1 and MPEG-2. Hundreds ofresearchers around the world contributed to MPEG-4,which was finalised in October 1998 and became aninternational standard in 2000 [6]. Characteristics ofMPEG-1, MPEG-2 and MPEG-3 are summarised inFig. 1. The use of MPEG-4 enables media companies tosave time and resources by encoding material once forplayback everywhere. The background to MPEG-4 overthe past ten years is depicted in Fig. 2.
Resources saved in encoding, hosting, and storing mediacan be used to create a wider library of digital media, whichbenefits the entire Internet community. MPEG-1 as well asMPEG-2, provide interoperable ways of representingaudio/visual content, commonly used on digital mediaand on the air. MPEG-4 extends this to many moreapplication areas through features like its extended bit raterange, its scalability, its error resilience, its seamlessintegration of different types of ‘objects’ in the same sceneand its powerful ways to build interactivity into content.
MPEG-4 is proving its viability in the market as an openstandard for multimedia. The full range of utilities is nowavailable: players, servers, hardware and software, testingsystems, IP cores, and authoring tools are all being readied.This technology has produced a major step towards moreinteroperability in multimedia. Already, work on future
Fig. 1 MPEG-1, MPEG-2 and MPEG-4
The author is with the Cardiff School of Engineering, Electronic Division,Cardiff University, Queen’s Buildings, P.O. Box 689, Newport Road, Cardiff,CF2 3TF, UK
r IEE, 2004
IEE Proceedings online no. 20040299
doi:10.1049/ip-com:20040299
Paper received 8th May 2003
270 IEE Proc.-Commun., Vol. 151, No. 3, June 2004
standards such as MPEG-7 and MPEG-21 is taking place.MPEG-7 will help manage the growing abundance ofcontent, and MPEG-21 will make trusted interaction withcontent much more transparent.
3 Scalable coding of video objects
MPEG-4 supports the coding of images and video objectswith spatial and temporal scalability, both with rectangularas well as arbitrary shape. The term scalability in thiscontext refers to the ability to only decode a part of a bitstream and reconstruct images or image sequences withreduced decoder complexity and thus reduced quality,reduced spatial resolution, reduced temporal resolutionor equal temporal and spatial resolution, but withreduced quality. This functionality is desirable for progres-sive coding of images and video sent over heterogeneousnetworks.
There are several scalable coding schemes in MPEG-4visual: spatial, temporal, fine-granularity and object-basedspatial scalability. Spatial scalability supports changing thespatial resolution.
Object-based spatial scalability extends the conventionaltypes of scalability towards arbitrary shape objects so that itcan be used in conjunction with other object-based items. Avery flexible content-based scaling of video information canbe achieved, which makes it possible to enhance SNR,spatial resolution, shape accuracy, etc., for objects ofinterest or for a particular region, dynamically at play-time.Fine granularity scalability (FGS) was developed to enablevideo steaming over the Internet. FGS allows the contentcreator to code a video sequence once for delivery throughchannels with a wide range of bit rates. It provides the bestuser experience under varying channel conditions and itscombination with temporal scalability addresses a variety ofchallenging problems in delivering video over the Internet.It overcomes the ‘digital cut off ’ problem and allowscompressed digital video to be as robust as analogue video,while maintaining all the advantages of digital video. Weconcentrate on single, temporal and spatial scalability.
4 Self-similarity and LRD estimation techniques
Mathematically, self-similarity manifests itself in manyways: (i) the variance of the sample mean decreases moreslowly than the reciprocal of the sample size (slowlydecaying variances), i.e. var(X(m))Bc.m�b, as m-N with(0obo1); (ii) the autocorrelations decay hyperbolicallyrather than exponentially, implying a non-summableautocorrelation function (in contrast to Poisson processes);and (iii) the spectral density f ð:Þ obeys a power-lawbehaviour near the origin (1/f noise). Self-similar processesprovide an elegant explanation and interpretation of anempirical law commonly referred to as ‘Hurst’s law’ or theHurst effect [7].
To test for self-similarity, one uses the essentiallyequivalent characterisations of LRD in the time, frequency,or wavelet domain. They can be exploited to measure thisphenomenon quantitatively by estimating the value of H.Time-domain estimation techniques include heuristics suchas analysis of the rescaled adjusted range statistics, andvariance–time analysis of the aggregated processes; exam-ples of frequency-domain techniques are the periodogramanalysis and Whittles method. The three methods that wehave used in our analysis are the rescaled range (R/S)statistic, the variance–time plot (VT) and the log scalediagram (LD).
The variance–time plot [8–10] is obtained by plotting thevariance of the aggregated trace as a function of theaggregation level (time). Traces that possess similarcharacteristics to that of Poisson processes (memory-less),decrease linearly with a slope of –1 and smaller, and arereferred to by the term short-range dependent (SRD).Traces with slope of larger than –1 are referred to as long-range dependent (LRD) processes. The existence ofcorrelation ‘at a distance’ is referred to as LRD.
The R/S statistic [8, 11, 12] provides a heuristic graphicalapproach to estimating H. For large size traces, the R/Sfollows a power law. From a logarithmic plot, one candeduce the value of the slope and thus compute H. Atypical plot starts with a transient zone representing SRD,and settles down and fluctuates around a straight street of
Fig. 2 Video and image coding standards
IEE Proc.-Commun., Vol. 151, No. 3, June 2004 271
slope H. The logscale diagram uses the wavelet approach ofVeitch and Abry [13], and computes the sample variance ofwavelet coefficients against octave in order to calculate twoparameters that represent LRD. We used the Daubechies 3wavelet to eliminate quadratic and linear trends, and reportthe estimated value of H via an automated procedure thatuses a goodness of fit metric to improve reliability [14].There are many other estimators that are used to estimatethe value of the Hurst parameter. An overview of a largenumber of the estimation methodologies can be found in[8, 15, 16]. Additional methods include:
� Absolute value method, where an aggregated series X(m) isdefined, using different block sizes m. The log–log plot ofthe aggregation level against the absolute first moment of
the aggregated series X(m) should yield a straight line ofslope (H�1), if the data is long-range dependent.
� Whittle estimator; this method is based on the minimisa-tion of a likelihood function, which is applied to theperiodogram of a series.
� Variance of residuals. A log–log plot of the aggregationlevel against the average of the variance of the residuals ofthe series should be a straight line with slope of H/2.
The ability of self-similar/LRD based modelling to fitvideo traffic data has been well documented over the pastfew years [2–4, 9, 17–20]. Further evidence recently points tothe need for higher-order statistics to compute the scaling
Fig. 3 Aggregated process of ‘Jurassic Park’ with and without rate control
Left and right hand columns illustrate the notion of scale invariance. The top graphs depict the first 500 frames of X ð1Þ: (left column) ‘Jurassic ParkI’– high quality single layer encoded video with no rate control, (right column) ‘Jurassic Park I’ – 64kbit/s single layer encoded video. The middle and
bottom graphs depict the first 500 frames of X ð12Þ and X ð192Þ respectively. Note the burstiness on the bottom graphs, even at large aggregation
272 IEE Proc.-Commun., Vol. 151, No. 3, June 2004
phenomena evident within real video traces. These notionsare based on multifractal formalisms and have been usedrecently to model VBR video traffic [20–22]. This is beyondthe scope of this paper. However, we are currentlyconducting research into this behaviour and will report onit in future work.
5 MPEG-4 single layer scalability
The trace files used in all our experiments are madeavailable thanks to researchers via the website [17]. Thevideo traces are all grabbed at the NTSC frame rate (30frames/s), and converted into both QCIF (176� 144) andCIF (352� 388) pels format. This video trace library [17]
not only consists videos of differing quality (i.e. low,medium, high), but also of differing scalability. We analysea select few videos to compute their behaviour via second-order statistics.
For single-layer encoding the group of pictures (GOP)pattern is set to IBBPBBPBBPBBI... That is, there are threeP frames between successive I frames. For encodingswithout rate control, the quantisation parameters are fixedthroughout the encoding. The trace files with rate controlare encoded via the TM5 rate control scheme [18], andpossess target bit rates of 64, 128 and 256kbit/s.
For rate-controlled traffic, the compression rates are fixedfor 128 and 256kbit/s, and are larger and variable at64kbit/s. For no rate control, the compression rates are far
Table 1: QCIF single layer video with no rate control
Quality Trace Meankbytes
CoV Peak/mean ratio H(R/S) H(VT) H(LD)
High Silence of the lambs 1.881 0.774 8.721 0.959 0.876 1.002
Jurassic Park I 3.268 0.660 5.950 0.933 0.628 1.051
Star wars IV 2.301 0.609 7.615 0.911 0.805 0.800
Total recall 2.852 0.548 5.411 0.909 0.751 0.992
Terminator I 2.934 0.624 8.318 0.941 0.815 0.958
Medium Silence of the lambs 0.333 1.663 25.386 0.853 0.865 1.064
Jurassic Park I 0.590 1.562 15.044 0.840 0.604 1.076
Star wars IV 0.413 1.488 24.175 0.865 0.802 0.961
Total recall 0.505 1.400 13.088 0.833 0.717 1.054
Terminator I 0.620 1.262 11.873 0.888 0.811 0.943
Low Silence of the lambs 0.214 0.873 13.356 0.849 0.851 0.659
Jurassic Park I 0.277 0.974 10.485 0.823 0.663 1.141
Star wars IV 0.248 0.920 17.289 0.791 0.777 0.970
Total recall 0.283 0.883 7.670 0.844 0.698 1.041
Terminator I 0.326 0.842 10.610 0.900 0.629 0.950
Table 2: QCIF single layer video with rate control
Quality Trace Meankbytes
CoV Peak/mean ratio H(R/S) H(VT) H(LD)
High Silence of the lambs 1.067 0.904 8.006 0.205 �0.059 �0.458
Jurassic Park I 1.067 1.106 9.345 0.155 0.032 �0.127
Star wars IV 1.067 0.927 9.659 0.157 �0.157 �0.157
Total recall 1.067 1.001 8.991 0.164 0.044 �0.151
Terminator I 1.067 1.009 11.874 0.199 0.163 �0.152
Medium Silence of the lambs 0.534 1.117 33.430 0.259 �0.714 �0.124
Jurassic Park I 0.534 1.295 20.774 0.441 �0.497 �0.084
Star wars IV 0.534 1.132 22.063 0.698 �0.347 �0.347
Total recall 0.534 1.182 19.649 0.291 �0.070 �0.355
Terminator I 0.534 1.130 31.122 0.414 �0.069 �0.415
Low Silence of the lambs 0.267 1.118 67.003 0.666 0.765 �0.085
Jurassic Park I 0.276 0.973 64.310 0.859 0.596 0.991
Star wars IV 0.269 1.086 69.354 0.722 0.391 0.391
Total recall 0.285 0.970 66.766 0.841 0.630 0.996
Terminator I 0.326 0.861 53.645 0.909 0.819 0.937
IEE Proc.-Commun., Vol. 151, No. 3, June 2004 273
higher at low quality than at medium and high. Figure 3illustrates the bursty nature of video traffic by looking at theaggregated process of ‘Jurassic Park’ with no rate control(left column) and with rate control at 64kbit/s (rightcolumn). The periodic patterns that can be seen in the topdiagrams are as a result of the GOP and large I-frame thatoccurs every 12 frames. Results of our analysis of singlelayer scalability MPEG-4 video are shown in Fig. 3 andTables 1–4.
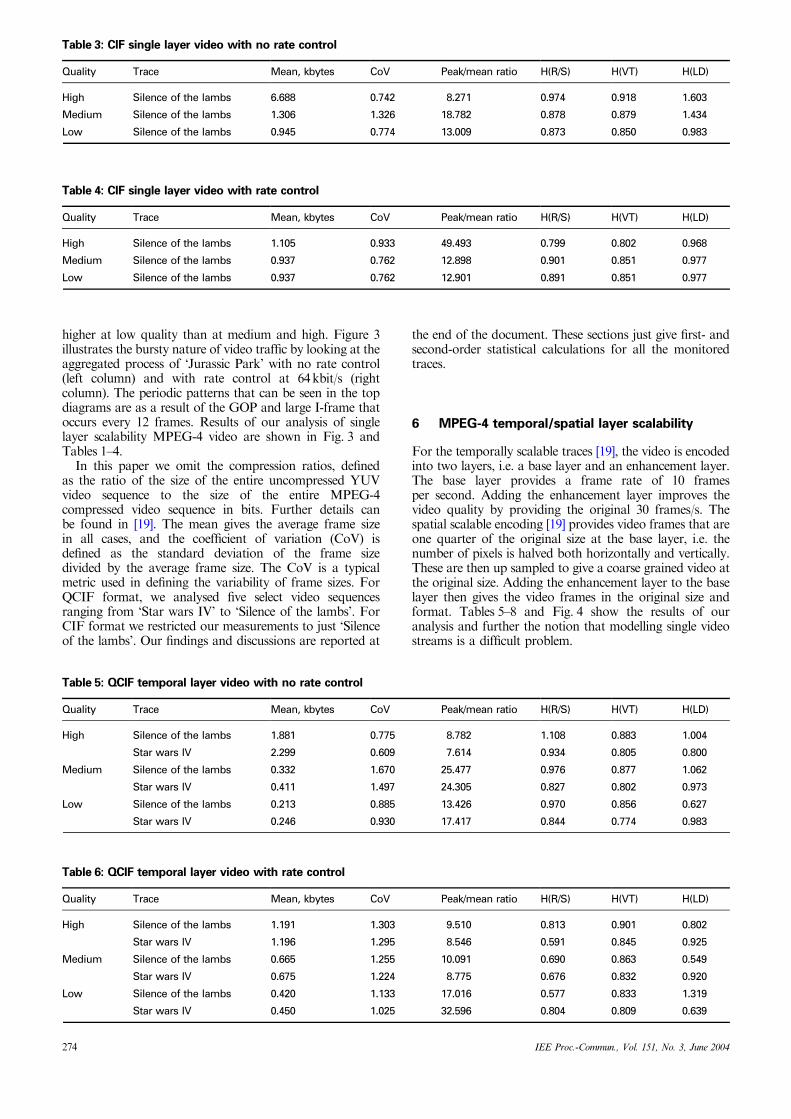
In this paper we omit the compression ratios, definedas the ratio of the size of the entire uncompressed YUVvideo sequence to the size of the entire MPEG-4compressed video sequence in bits. Further details canbe found in [19]. The mean gives the average frame sizein all cases, and the coefficient of variation (CoV) isdefined as the standard deviation of the frame sizedivided by the average frame size. The CoV is a typicalmetric used in defining the variability of frame sizes. ForQCIF format, we analysed five select video sequencesranging from ‘Star wars IV’ to ‘Silence of the lambs’. ForCIF format we restricted our measurements to just ‘Silenceof the lambs’. Our findings and discussions are reported at
the end of the document. These sections just give first- andsecond-order statistical calculations for all the monitoredtraces.
6 MPEG-4 temporal/spatial layer scalability
For the temporally scalable traces [19], the video is encodedinto two layers, i.e. a base layer and an enhancement layer.The base layer provides a frame rate of 10 framesper second. Adding the enhancement layer improves thevideo quality by providing the original 30 frames/s. Thespatial scalable encoding [19] provides video frames that areone quarter of the original size at the base layer, i.e. thenumber of pixels is halved both horizontally and vertically.These are then up sampled to give a coarse grained video atthe original size. Adding the enhancement layer to the baselayer then gives the video frames in the original size andformat. Tables 5–8 and Fig. 4 show the results of ouranalysis and further the notion that modelling single videostreams is a difficult problem.
Table 4: CIF single layer video with rate control
Quality Trace Mean, kbytes CoV Peak/mean ratio H(R/S) H(VT) H(LD)
High Silence of the lambs 1.105 0.933 49.493 0.799 0.802 0.968
Medium Silence of the lambs 0.937 0.762 12.898 0.901 0.851 0.977
Low Silence of the lambs 0.937 0.762 12.901 0.891 0.851 0.977
Table 3: CIF single layer video with no rate control
Quality Trace Mean, kbytes CoV Peak/mean ratio H(R/S) H(VT) H(LD)
High Silence of the lambs 6.688 0.742 8.271 0.974 0.918 1.603
Medium Silence of the lambs 1.306 1.326 18.782 0.878 0.879 1.434
Low Silence of the lambs 0.945 0.774 13.009 0.873 0.850 0.983
Table 5: QCIF temporal layer video with no rate control
Quality Trace Mean, kbytes CoV Peak/mean ratio H(R/S) H(VT) H(LD)
High Silence of the lambs 1.881 0.775 8.782 1.108 0.883 1.004
Star wars IV 2.299 0.609 7.614 0.934 0.805 0.800
Medium Silence of the lambs 0.332 1.670 25.477 0.976 0.877 1.062
Star wars IV 0.411 1.497 24.305 0.827 0.802 0.973
Low Silence of the lambs 0.213 0.885 13.426 0.970 0.856 0.627
Star wars IV 0.246 0.930 17.417 0.844 0.774 0.983
Table 6: QCIF temporal layer video with rate control
Quality Trace Mean, kbytes CoV Peak/mean ratio H(R/S) H(VT) H(LD)
High Silence of the lambs 1.191 1.303 9.510 0.813 0.901 0.802
Star wars IV 1.196 1.295 8.546 0.591 0.845 0.925
Medium Silence of the lambs 0.665 1.255 10.091 0.690 0.863 0.549
Star wars IV 0.675 1.224 8.775 0.676 0.832 0.920
Low Silence of the lambs 0.420 1.133 17.016 0.577 0.833 1.319
Star wars IV 0.450 1.025 32.596 0.804 0.809 0.639
274 IEE Proc.-Commun., Vol. 151, No. 3, June 2004
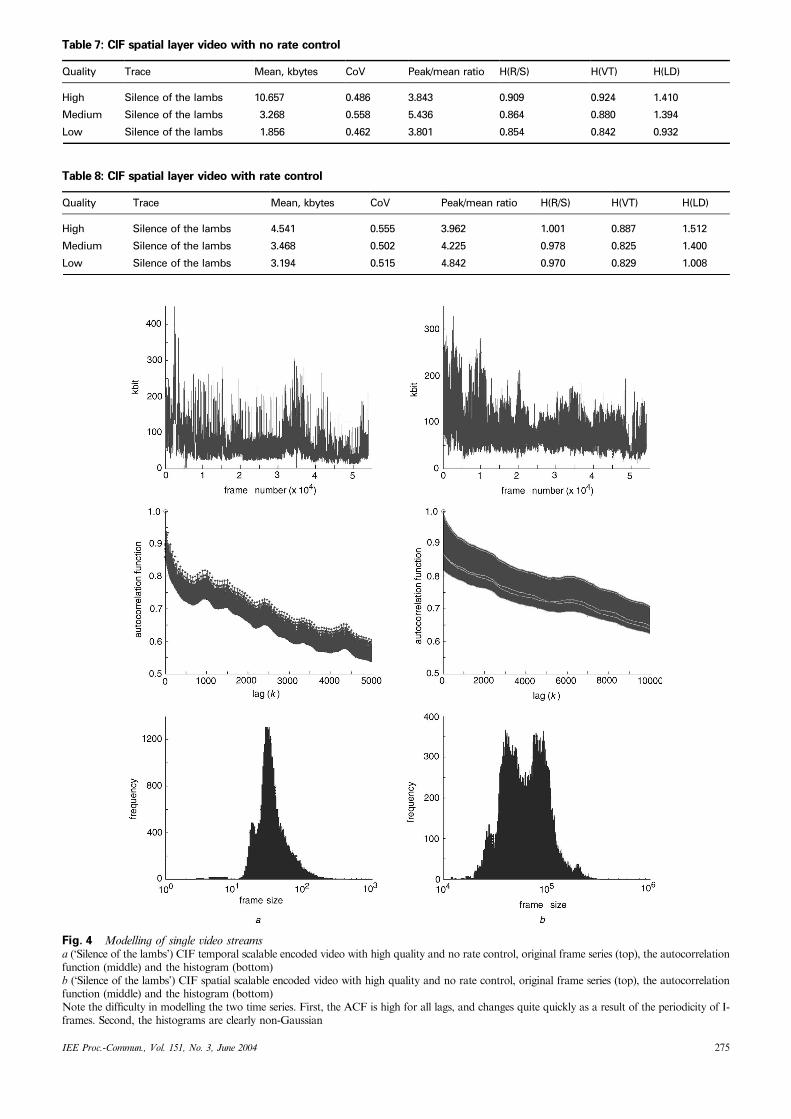
Table 8: CIF spatial layer video with rate control
Quality Trace Mean, kbytes CoV Peak/mean ratio H(R/S) H(VT) H(LD)
High Silence of the lambs 4.541 0.555 3.962 1.001 0.887 1.512
Medium Silence of the lambs 3.468 0.502 4.225 0.978 0.825 1.400
Low Silence of the lambs 3.194 0.515 4.842 0.970 0.829 1.008
Table 7: CIF spatial layer video with no rate control
Quality Trace Mean, kbytes CoV Peak/mean ratio H(R/S) H(VT) H(LD)
High Silence of the lambs 10.657 0.486 3.843 0.909 0.924 1.410
Medium Silence of the lambs 3.268 0.558 5.436 0.864 0.880 1.394
Low Silence of the lambs 1.856 0.462 3.801 0.854 0.842 0.932
Fig. 4 Modelling of single video streamsa (‘Silence of the lambs’) CIF temporal scalable encoded video with high quality and no rate control, original frame series (top), the autocorrelationfunction (middle) and the histogram (bottom)b (‘Silence of the lambs’) CIF spatial scalable encoded video with high quality and no rate control, original frame series (top), the autocorrelationfunction (middle) and the histogram (bottom)Note the difficulty in modelling the two time series. First, the ACF is high for all lags, and changes quite quickly as a result of the periodicity of I-frames. Second, the histograms are clearly non-Gaussian
IEE Proc.-Commun., Vol. 151, No. 3, June 2004 275
7 Multiplexed streams
The behaviour of individual video with different scalabilityand quality having been shown, the following experimentreports the results of concatenated video streams withdifferent quality and scalability. This analysis may give usmore of an insight into how multiplexed video streams willbehave on the future Internet. The first experiment was tocombine single layer encoded streams of ‘Jurassic Park I’ insuch a way that the peak of the aggregated frames did notexceed 500kbit. We also produced a ratio of low: medium:high quality in a manner that was based upon the mean bitrates of the individual streams. The mean bit rate of theaggregated stream was 16.65Mbit/s. For ‘Jurassic Park I’,the ratio was 11:5:1. As the I frames have the biggest framesizes, the streams were randomly added together, and weredelayed to ensure that the peak/mean ratio wasn’t excessiveat the first frame. The concatenated stream and its statisticsare depicted in Fig. 5 and Table 9.
The aggregate stream has a lower coefficient of variation(CoV), a lower peak to mean ratio (PMR) and results in afar smoother stream than the individual streams. Henceaggregating streams seems to have potential benefits.
However, on inspection of the Hurst parameter calcula-tions, two things are apparent. First, even though theaddition of all the streams has created reduced variationand decreased the peak to mean ratio, the Hurst parametercalculation via the rescaled range is higher than each of theindividual streams. Second and more important, thevariance–time plot estimation of the Hurst parameter doesnot differ significantly with aggregation. In fact, the value ofH (V–T) seems to follow the value of the dominantconnection. In this case, as there are 11 low quality streams,it is noted that the value and the shape of the aggregated V–T plot (Fig. 6) is very similar to that of the low qualitystream. Does this mean that the scaling is essentially similarto the dominant connection?
To investigate the behaviour further, we experimentedwith individual Jurassic Park streams with single layerscalability and used a ratio of 1:1:1. There is no needto make the scaling ratio greater than unity (i.e. 2:2:2),as it will simply yield the same values. Again a delayequal to one frame size is used. In this case the value ofthe H via the variance–time plot and rescaled rangeis 0.66 and 0.94 respectively as shown in Table 10.These values are practically the same for the highquality trace.
On inspection of the histograms of the frame sizes of theconcatenated ‘Jurassic Park’ sequences, the plots illustratethe difficulty of modelling low and medium qualityencodings. The greater variability for these streams resultsin non-Gaussian distributions. However, when concatenat-ing the streams as is shown overleaf, the multiplexed signaltends to show a more Gaussian like distribution, but at theprice of heavy tails.
Figure 7 shows the evidence for Gaussian distribution.The aggregate trace’s distribution looks very similar to thehigh quality trace.
Multiplexing various quality traces via a ratio governedby bit rate results in the Hurst parameter of the aggregatedtrace being similar to the dominant trace via the variance–time plot (in terms of value and shape). By offering equalratios of traces at differing quality, results in the trace withthe greater bit rate (high quality) become similar to that ofthe aggregated trace. There also seems to be no significantdifference in the value of H for both streams whencomputing its variation with aggregation level as shown inFig. 7. Note that the decay follows a power law (triangles,Fig. 8).
With appropriate choice of delay, aggregated streams ofdiffering quality with equal ratios and ratios based on meanbit rate can result in a reduction in the variation of framesizes and peak to mean ratio.
Fig. 5 Concatenated ‘Jurassic Park I’
Fig. 6 Concatenated ‘Jurassic Park I’ (V–T plot)
Table 9: Concatenated ‘Jurassic Park I’ (11:5:1)
Quality Mean CoV PMR H (R/S) H (VT)
Agg. 1 8.67 0.478 5.28 0.99 0.62
High 3.27 0.660 5.95 0.93 0.66
Medium 0.59 1.562 15.04 0.84 0.60
Low 0.28 0.974 10.49 0.82 0.63
Table 10: Unit ratio ‘Jurassic Park I’ (1:1:1)
Quality Mean CoV PMR H (R/S) H (VT)
Agg. 2 4.13 0.587 5.91 0.94 0.66
High 3.27 0.660 5.95 0.93 0.66
Medium 0.59 1.662 15.04 0.84 0.60
Low 0.28 0.974 10.49 0.82 0.63
276 IEE Proc.-Commun., Vol. 151, No. 3, June 2004
8 Discussion
For QCIF single layer encoded video, the coefficient ofvariation and the peak-to-mean ratio of frame sizes increaseas the video quality decreases from high to medium quality,thus suggesting that video traffic of this nature is bursty(Table 1). However this increase is reversed as the qualitydecreases from medium to low quality, for both the
coefficient of variation and peak-to-mean ratio. Thisindicates a complex behaviour within the encodingmethod.
One repercussion of this behaviour is that video tracescannot be scaled by a simple ratio in order to simulate thetraffic corresponding to higher (or lower) video quality andhigher (or lower) bit rate. This suggests that downscalinghigh quality video traces to simulate low bit rate video will
Fig. 7 Concatenated QCIF single scalable video (‘Jurassic Park I’) with no rate controlTop left: One low quality traceMiddle left: One medium quality traceBottom left: One high quality traceMiddle right: Concatenated traceThe concatenated trace comprises of 11 low quality traces, five medium quality traces and one high quality trace. The concatenated trace isconverging to a Gaussian-like distribution. With appropriate choice and further traces added, it is assumed that the histogram would show a morebell-like shape. Its major contribution is the high quality trace
IEE Proc.-Commun., Vol. 151, No. 3, June 2004 277
result in smaller traffic variability than is actually present inlow quality encoded video.
When rate control is applied (Table 2), at low quality (64kbit/s) the peak-to-mean ratios are large in comparison tothose with no rate control (Table 1). Rate controlledencoding also yields a higher peak bit rate than observedwith no rate control. As target bit rate increases the peak-to-mean ratio consistently decreases indicating that the trafficbecomes burstier and behaves differently from the non-ratecontrolled encoding.
When comparing CIF and QCIF (Tables 1–4), the onlymajor difference is the mean frame size generated. The CoVand peak-to-mean ratio are roughly the same. For temporalscalable video, the same patterns are observed as withsingle-scalable video (e.g. large values of CoV for mediumquality traces). The autocorrelation function as shown inFig. 3 is still very high at large lags, suggesting a high degreeof persistence, and hence large values of H.
For spatial scalable video, the mean bit rates are farhigher than the other types of scalable video. However, thepeak-to-mean ratio and CoV are much smaller andconstant for all quality video. This suggests that scaling ofhigh–low quality spatial scalable video is possible as thevariability is similar at different quality levels. More analysisof different traces would be necessary to ensure that this isthe case. Difficulties are observed in modelling individualtraces as can be seen in the histogram in Fig. 4. As withtemporal scalable video the high degree of persistence isprevalent. The autocorrelation function is very high for lagsup to 5000.
With regard to the estimation techniques the period-ogram was eliminated as it gave very biased estimates. Thewavelet approach seemed to give over ambitious estimates,and is down to the assumption that the time series that isinput is Gaussian. Clearly, the traces are not such, andconsequently great care should be taken if these approachesare to be used with video traffic. We also observed that thescales consistent with LRD from the logscale diagram werefrom j¼ 5 to 10, and there was a knee around scale j¼ 4 orj¼ 5 as shown in Figs. 9–11. This would correspond to achange in scaling at 16 or 32 frames (0.5–1 s). The rescaledrange also gives large estimates, and when evaluating thechange of H with aggregation (Fig. 8), it results in anexponential decay, yet it is stable at around aggregationlevel 256.
The variance–time plot yielded smaller values than any ofthe other methods. For some traces there were large valuesof H at low aggregation which became reduced at aroundm¼ 256 (note the two slopes that can be seen in Fig. 6 for
Fig. 9 Logscale diagram of ‘Silence of the lambs’, high qualitywith no rate controlF’F CIF spatial scalableFmF CIF temporal scalableF~F QCIF single layer encoded
Fig. 10 Logscale diagram of ‘Silence of the lambs’ with ratecontrol (temporal scalable)F.F QCIF 256kbit/sF’F QCIF 128kbit/sF~F QCIF 64kbit/s
Fig. 11 Logscale diagram of cumulative rate process (bits) of‘Star wars IV’, high quality, QCIF format, single layer encodedvideo with no rate control
278 IEE Proc.-Commun., Vol. 151, No. 3, June 2004
each trace). One interesting finding was that V–T plotestimates of H were negative for high and medium qualityQCIF single layer video with rate control.
When multiplexing traffic streams with ratios based onthe mean bit rate, it was found that the histogram of theconcatenated trace (Fig. 7) approached a more Gaussiandistribution. The peak-to-mean ratio and the CoV reduceddramatically, yet the estimation of H via R/S increased. Theestimate via the V–T plot followed that of the domineeringconnection. For unit ratio, the value of H was largelyinfluenced by the high quality trace. The reader should notethat the experiments ensured that the traces were addedafter delay to ensure that the first I-frames from all thetraces did not result in a large peak-to-mean ratio. Theseresults in Fig. 7 show that potential streaming of videotraffic can be aided by knowledge of the statisticalproperties of concatenated traces.
9 Conclusions
The scale invariant features of MPEG-4 video traffic can bethought of as a means of more clearly visualising the termburstiness than a normal temporal trace. Increased bursti-ness results in lower levels of resource utilisation for a fixedquality of service, and therefore to higher costs. This paperfollows on from work done in [18, 19], by evaluating thebehaviour of aggregated streams for performance evalua-tion. The results depicted in the figures and tables indicatethat distribution is non-Poisson, as indicated by the Hurstparameter, but it does not provide a consistent picture orproper characterisation, of the video traffic. The period-ogram in particular gave misleading results with this type ofvideo traffic. Consequently teletraffic modelling will needconsiderable further research and particular care will beneeded in reflecting the behaviour of the major protocolsand encodings likely to be used in future networks if realisticnetwork planning is to be undertaken. In particular a moreconsistent parameter is required that firmly relates to thequality of service parameters used in traffic engineering.
There now exists a huge library of video traces withdiffering quality, rate and no rate control, QCIF and CIFformat, single and temporal scalability etc. [17]. Furtheranalysis of such streams should improve our understandingof the way video will behave on the future Internet andwireless networks.
10 References
1 Koenen, R.: ‘MPEG-4 multimedia for our time’, IEEE Spectr., 1999,36, (2), pp. 26–33
2 Garrett, M.W.: ‘Contributions toward real-time services on packetnetworks’. PhD thesis, Columbia University, May 1993
3 Rose, O.: ‘Statistical properties of MPEG video traffic and theirimpact on traffic modelling in ATM systems’. Technical Report 101,University of Wuerzburg, Institute of Computer Science, Germany,Feb. 1995
4 Krunz, M., Sass, R., and Hughes, H.: ‘Statistical characteristics andmultiplexing of MPEG streams’. Proc. IEEE INFOCOM’ 95, April1995, pp. 455–462
5 ‘MPEG-4: the next generation’. Full PDF is available at http://www.apple.com/mpeg4/
6 Koenen, R. (Ed.): ‘Overview of the MPEG-4 standard’ ISO/IEC14496, May/June 2000
7 Leland, W.E., Taqqu, M., Willinger, W., andWilson, D.: ‘On the self-similar nature of ethernet traffic’. Proc. ACM SIGCOMM ’93, 1993,pp. 183–193
8 Beran, J.: ‘Statistics for long memory processes’ (Chapman and Hall,1994)
9 Beran, J., Sherman, R., Taqqu, M.S., and Willinger, W.: ‘Long-rangedependence in variable-bit-rate video traffic’, IEEE Trans. Commun.,1995, 43, (2/3/4), pp. 1566–1579
10 Krunz, M.: ‘On the limitations of the variance-time test for inferenceof long-range dependence’. Proc. IEEE INFOCOM’ 01, Anchorage,AK, USA, April 2001, Vol. 3, pp. 1254–1260
12 Mandlebrot, B.B., and Taqqu, M.S.: ‘Robust R/S analysis of long runserial correlation’. Proc. 42nd Session of the ISI Book 2, Manilla,1979, pp. 69–104
13 Abry, P., and Veitch, D.: ‘Wavelet analysis of long-range-dependenttraffic’, IEEE Trans. Inf. Theory, 1998, 44, (1), pp. 2–15
14 Abry, P., and Veitch, D.: ‘A wavelet-based joint estimator of theparameters of long-range dependence’, IEEE Trans. Inf. Theory, 1999,45, (3), pp. 878–897 ( Matlab Code is available at www.emulab.ee.mu.oz.au/Bdarryl)
15 Taqqu,M.S., and Teverovsky, V.: ‘On estimating the intensity of long-range dependence in finite and infinite variance time series’. Preprint,Boston University, USA, 1996
16 Mian, S., Ghassempoory, M., and Bentall, M.: ‘Mathematical analysisof network traffic’. Proc. IEEE SCOReD Conf., July 2002
17 ‘Video traces for network performance evaluation’, www.peach.eas.asu.edu/
18 Fitzek, F., and Reisslein, M.: ‘MPEG-4 and H.263 traces for networkperformance evaluation’. extended version Tech. Report TKN-00-06,Tech. Univ. Berlin, Dept. Elec. Engineering, Germany, Oct. 2000
19 Reisslein, M., Lassetter, J., Ratnam, S., Lotfallah, O., Fitzek, F., andPanchanathan, S.: ‘Traffic and quality characterisation of scalableencoded video: a large-scale trace-based study, Part 1: Overviews anddefinitions’, http://www.eas.asu.edu/trace, December 2002
20 Mian, S.: ‘Traffic modelling: the advent of fractals’, Commun. Eng.,2003, pp. 32–35
21 Riedi, R.H., Crouse, M.S., Ribeiro, V.J., and Baraniuk, R.: ‘Amultifractal wavelet model with applications to network traffic’, IEEETrans. Inf. Theory, 1998, 45, (3), pp. 992–1018
22 Gao, J., and Rubin, I.: ‘Multiplicative multifractal modelling oflong-range dependent traffic’, Int. J. Commun. Syst., 2001, 14,pp. 783–801