59
Analysis of New Jersey’s Census-Based Special Education Funding System Prepared for the New Jersey Department of Education By Augenblick, Palaich and Associates October 2011

Analysis of New Jersey’s Census-Based
Special Education Funding System
Prepared for the
New Jersey Department of Education
By
Augenblick, Palaich and Associates
October 2011

i
Contents
I. Introduction ............................................................................................................................................... 1
II. Comprehensive Database ......................................................................................................................... 3
III. Literature Review ..................................................................................................................................... 5
Incidence of Disabilities ........................................................................................................................ 5
Defining High Cost Disabilities .............................................................................................................. 6
High Cost Disability Types ..................................................................................................................... 6
Conclusions ........................................................................................................................................... 8
IV. Other States ............................................................................................................................................. 9
Delaware ................................................................................................................................................. 10
Florida ..................................................................................................................................................... 10
Ohio ......................................................................................................................................................... 11
Pennsylvania ........................................................................................................................................... 11
V. Data Analysis ........................................................................................................................................... 12
Low Incidence Categories ....................................................................................................................... 13
High Cost Categories ............................................................................................................................... 15
Second Phase .......................................................................................................................................... 17
VI. Interviews .............................................................................................................................................. 40
First Round of Interviews ........................................................................................................................ 40
Second Round of Interviews ................................................................................................................... 42
Conclusions ............................................................................................................................................. 46
VI. Conclusion .............................................................................................................................................. 47
Scope and Goal ....................................................................................................................................... 47
Complicating Issues ................................................................................................................................. 47
ii
Findings ................................................................................................................................................... 48
Next Steps ............................................................................................................................................... 49
APPENDIX A- Literature Review Work Cited ............................................................................................... 52
APPENDIX B- First Round Interview Questions ........................................................................................... 53
APPENDIX C- Protocol for Second Round of Interviews (NJ Visits or Calls) ................................................ 55

1
I. Introduction
This report summarizes the work done by Augenblick, Palaich and Associates (APA) for the New Jersey
Department of Education (DOE) in undertaking a study analyzing New Jersey’s census-based special
education funding system.
As part of the School Funding Reform Act of 2008, New Jersey changed how special education was
funded. Prior to 2008, special education students in New Jersey were funded based on their level of
need. Each student was placed into one of four need tiers, with higher per pupil funding associated with
the higher need tiers. A study done in 2003 by Center for Special Education Finance (CSEF) showed that
New Jersey had higher per pupil spending for special education than the national average. 1 The study
suggested switching to a census-based special education funding model might help New Jersey control
its spending. In 2008, the state made the switch to a census-based model.
Under a census-based funding model all districts are funded for the same percentage of special
education students. For the 2008-09 through 2010-11 school years the funding percentage was 14.69%.
(This percentage does not include students receiving only speech services, who are funded separately.)
Each district’s special education funding, excluding extraordinary aid2, is calculated by multiplying the
district’s resident student population by 14.69% to determine the number of special education students
to fund. This funded count is then multiplied by the special education per pupil funding amount to
determine the total special education funding allotted to the district. The new system then wealth
equalizes two thirds of this amount, splitting it up into a state and local share, and then funds the
remaining third entirely from the state. Wealth equalization is a process commonly used in school
funding formulas that determines what percentage of funding the state pays based inversely on the
relative wealth of each individual district (the wealthier the district, the lower percentage the state
pays). It is important to note that districts also receive extraordinary aid for special education students
who are extremely expensive to serve. This aid is beyond the basic special education funding.
When this funding structure change was put into law a review of its impact was mandated. In the
spring of 2010 the DOE released a Request for Qualifications (RFQ) to undertake the study of the
impacts of the change with the specific mandate to the commissioner for “an independent study of the
special education census funding methodology to determine if adjustments in the special education
funding formulas were needed in future years to address the variations in incidence of students with
severe disabilities requiring high cost programs and to make recommendations for any such
adjustments.”3 It is important to keep in mind that the study was not meant to look at the
appropriateness of the total level of special education funding in the state. APA replied to the RFQ and
was awarded the contract in September of 2010 to undertake the study.
1 Page 2 of the “Special Education Funding” RFQ
2 The state reimburses districts for a portion of the costs of a child with extraordinary needs. This is defined as a
student whose education costs exceed $40,000. 3 Page 3 of the “Special Education Funding” RFQ

2
APA’s proposal created a multi-tiered approach to examining the questions raised in the RFQ. The main
focus was to identify those disability categories that carried high costs to districts but that generally
occurred at a low incidence level. Once those categories were determined, APA proposed to identify
districts that had higher than normal rates of these disability categories and to assess what impact the
new funding system was having on these districts. Once the impact of the new system was understood,
in relationship to these high cost-low incidence categories, recommendations would be made.
APA proposed to undertake a number of tasks as part of the study, which included:
1. Creating a comprehensive district-level database of special education counts and financial data;
2. Reviewing the research literature about which disability categories are high cost and low
incidence;
3. Reviewing a few other states’ special education funding systems and how they account for high
cost, low incidence categories;
4. Identifying the low incidence, high cost special education categories using information gleaned
from the literature and state reviews and the analysis of the comprehensive database;
5. Conducting two sets of interviews with district representatives -- the first focused on broad
questions about the new system and the second more targeted to the specific high cost, low
incidence categories;
6. Making recommendations based upon the findings of the literature and state reviews, the data
analysis and the interviews.
This report discusses each of these tasks in detail and concludes with recommendations.

3
II. Comprehensive Database
APA’s proposal focused on having a data-driven approach for the study of New Jersey’s change to a
census-based special education funding system. In order to undertake this approach a district-level
database needed to be created. The original response to the RFQ from APA indicated that the full work
of the study could not be undertaken until the needed data had been collected by APA with the help of
the DOE.
As soon as the project started, a data request was made to the DOE for the needed data. The request
included data for each district on:
• Number of students in each disability category;
• Number of students in each disability by type of placement;
• Age range, grade level range or school level of students;
• Special education revenues by source (state, local, and federal);
• Special education expenditures;
• Demographic data including enrollment, number of students eligible for free and reduced price
lunch, and number of English language learners;
• Grade span of the district;
• Information on the wealth of the district, such as property value per student; and
• Information on the location of the district (rural, urban or suburban).
The data was requested for the 2007-08 and 2008-09 school years, which were the last year of the old
special education funding system and the first year of the new funding system.
APA personnel made a trip to NJ to meet with department staff to finalize the request and to
understand the different data that were available.
It became clear early in the data collection process that not all needed data was readily available. What
was easy to obtain included basic demographic data, such as resident and attending enrollments, the
number of total resident special education students, and the number of free and reduced price lunch
students, the number of English language learner students, expenditures, revenues, grade span, and
some wealth data. Certain student-level disability information was not possible to obtain. Funding in
New Jersey is based on the district of residence of the student. At the same time, the expenditures for a
special education student are reported by the district of attendance. This created the need for two
different student-level datasets, with one dataset needed to identify students by their district of
residence and the other by their district of service.
The belief was that one current data collection, NJ SMART, would provide a student-level database that
would include both resident and attendance data for each student. The databases themselves are not

4
housed within the DOE but rather are housed with a state contractor that manages the data collection
and databases. The DOE requested data from the contractor for both years. There was a delay in the
start of the work as the DOE and contractor worked to create a database with the specific data points
APA needed.
Once the individual student data was received it became apparent that the student level information did
not contain the type of resident district information APA had requested. The individual student data
provided by DOE included the district of residency based on where the student resides. In some cases
this is different from the district that receives state aid and holds financial responsibility for the student.
For example, a regional high school district receives state aid as a separate district but the students are
recorded as resident enrollment of the respective constituent K-8 districts of the regional district. This
wrinkle created difficulties in linking the enrollment data to the financial data. Additionally, the student
level data was available for the 2008-09 and 2009-10 school years, not the 2007-08 and 2008-09 school
years as the special education data in 2007-08 was not collected in the same fashion.
Despite the limitations of the data described above, APA was able to create a district-level database.

5
III. Literature Review
Part of APA’s study was to undertake a literature review looking at available information on low
incidence, high cost categories of special education. Under the Individuals with Disabilities Education
Act (IDEA), the United States Department of Education defines a ‘child with a disability’ as a child who
has mental retardation, hearing impairment (including deafness), speech/language, visual impairment, a
serious emotional disturbance, orthopedic impairment, autism, traumatic brain injury, another health
impairment, a specific learning disability, deaf-blindness, or multiple disabilities, and who as a result,
needs special education and related services (Muller & Markowitz, 2004). The most recent data
available (2007-08) indicates that among children age 3 to 21, approximately 6,606,000 receive special
education services under IDEA (U.S. Department of Education, National Center for Education Statistics,
2009).
Incidence of Disabilities
Using federal data, it is possible to identify the disability categories which occur most frequently and
least frequently in students. The most common student disabilities are learning disabilities, comprising
39% of all disabilities, speech/language disabilities, comprising 22% of all disabilities, and mental
retardation and emotional disturbances, respectively comprising 7.6% and 6.7% of all disabilities (U.S.
Department of Education, National Center for Education Statistics, 2009). The least common student
disabilities were visual impairments, with 0.4% of all disabilities, traumatic brain injury, with 0.4%, and
deaf-blindness, with a value under 0.0% (U.S. Department of Education, National Center for Education
Statistics, 2009). The following table presents the percent of students with disabilities in each disability
category in 2007-08.
Disability Category Percent of Students
with Disabilities
Autism 4.5%
Emotional Disturbance 6.7%
Hearing Impairment/Deafness 1.2%
Mental Retardation 7.6%
Multiple Disabilities 2.1%
Orthopedic Impairment 1.0%
Other Health Impairment 9.7%
Specific Learning Disability 39.0%
Speech/Language Impairment 22.0%
Traumatic Brain Injury 0.4%
Visual Impairment/Blindness 0.4%
Source: (U.S. Department of Education, National Center for Education Statistics, 2009)

6
Defining High Cost Disabilities
IDEA does not explicitly define ‘severe’, ‘high need’, or ‘high cost’ student disabilities. Many states,
however, have developed their own definitions, which vary across states (Parrish, Harr, Anthony,
Merickel, & Esra, 2003). In a review of rules and regulations in 12 states, one literature review found
that nine of the states define a student with disabilities as high-cost once a district’s per pupil
expenditures for that student surpass a precise dollar amount (Griffith, 2008). This study defined high
cost per pupil expenditures as ranging from $10,000 in New York to $50,000 in Vermont. The other
three states studied define a student as high cost when the per pupil expenditure for that student
surpasses a cost relative to their average general or special education costs (Griffith, 2008). For
example, high cost may be defined as ‘3 times the cost of educating a general education student’
(Griffith, 2008).
One of the best sources of expenditure data associated with student disabilities is available from the
Special Education Expenditure Project (SEEP), a nationally-representative study conducted by the Center
for Special Education Finance. According to one SEEP report, policy makers often use the criterion of
“medical” or “non-medical” to distinguish between high cost and/or severe disabilities and those that
are low cost and/or not severe (Parrish, Gerber, Kaleba, & Brock, 2000). Severity and cost can also vary
as a dimension of a disability category. For example, students with limited hearing impairments typically
have less costly, less severe disabilities than those who are completely deaf. Two students with the
same disability may receive different levels of services and therefore require very different expenditure
levels. Thus, it may not always be appropriate to classify a particular disability as more severe or high
cost. Nonetheless, it is possible to identify expenditure patterns associated with different disability
categories.
High Cost Disability Types
A 2004 SEEP report examined the characteristics of high cost special education students, defining these
‘high cost’ students as those in the top five percent of the expenditure distribution for special education
students (Chambers, Kidron, & Spain, 2004). The researchers found that the high cost special education
students cost 4.2 times more to educate at the elementary level and 3.5 times more at the secondary
level (Chambers, Kidron, & Spain, 2004).
In a breakdown of the high cost special education students, the study found some striking patterns. Four
disability categories accounted for 76.8 percent of all high cost special education students; nearly a third
of students in this high cost category had multiple disabilities (32.3%), 16.2% had emotional
disturbances, 17.2% had autism, and 11.1% had hearing impairments/deafness (Chambers, Kidron, &
Spain, 2004). The following table shows the full breakdown of high cost special education students by
disability category.

7
Disability Category Percent of High Cost
Special Education
Students
Autism 17.2%
Emotional Disturbance 16.2%
Hearing Impairment/Deafness 11.1%
Mental Retardation 7.1%
Multiple Disabilities 32.3%
Orthopedic Impairment 3.0%
Other Health Impairment 2.0%
Specific Learning Disability 0.0%
Traumatic Brain Injury 2.0%
Visual Impairment/Blindness 8.1%
Source: (Chambers, Kidron, & Spain, 2004).
Using 1999-2000 data, SEEP researchers calculated the average per student expenditure associated with
each disability category. Across all disability categories, they found an average expenditure level of
$12,525, with a range of $1,606 per special education student (Chambers, Shkolnik, & Perez, 2003). The
following table presents the results of their analysis.
Disability Category Average
Expenditure
Range in Costs
Autism $18,790 $5,762
Emotional Disturbance $14,147 $4,484
Hearing Impairment/Deafness $15,992 $4,578
Mental Retardation $15,040 $2,176
Multiple Disabilities $20,095 $3,462
Orthopedic Impairment $14,993 $3,190
Other Health Impairment $13,229 $2,896
Specific Learning Disability $10,558 $1,502
Speech/Language Impairment $10,958 $5,140
Traumatic Brain Injury $16,542 $6,040
Visual Impairment/Blindness $18,811 $6,594
Source: (Chambers, Shkolnik, & Perez, 2003)
The SEEP analysis indicated that students with certain disabilities tend to be more costly than students
with other disabilities. In particular, students with multiple disabilities, visual impairments/blindness,
autism, or traumatic brain injuries on average are more costly to educate than students with other
disabilities. However, there is substantial variation in the costs of students in some of the disability
categories, such as the categories of autism, traumatic brain injury, speech/language impairments, and

8
visual impairments/blindness. This suggests that the severity of the disability within the disability
category has a large impact on costs. Students with slight visual impairments may require only minimal
accommodations, while a blind student may require much more comprehensive services.
Conclusions
Combining the 2007-08 disability data and the 1999-2000 SEEP data, and classifying each set of data into
low, moderate, and high levels enables us to create the following table:
Disability Category Incidence of
Disability
(2007-08)
Percent of High
Expenditure Special
Education Students
(1999-2000)
Average Costs
(1999-2000)
Autism Low High High
Emotional Disturbance Moderate High Moderate
Hearing Impairment/Deafness Low Moderate Moderate
Mental Retardation Moderate Moderate Moderate
Multiple Disabilities Low High High
Orthopedic Impairment Low Low Moderate
Other Health Impairment Moderate Low Moderate
Specific Learning Disability High Low Low
Speech/Language Impairment High NA Low
Traumatic Brain Injury Low Low Moderate
Visual Impairment/Blindness Low Moderate High
Although simplistic, this table allows us to identify the disability categories that are mostly likely to be
low-incidence, high cost. Students with autism or multiple disabilities are most likely to fall into this
category. Students with hearing impairments/deafness or visual impairments/blindness may also be
relatively likely to fall in the low-incidence, high cost category. However, within these disability
categories, there is substantial variation in average costs. In fact, some researchers have found that
expenditures vary more within an expenditure category than across disability categories (Parrish,
Gerber, Kaleba, & Brock, 2000). Consequently, it would be inaccurate to classify an entire disability
category as high cost. Researchers and policy makers should exercise caution in how they use this data
to inform policy decisions.

9
IV. Other States
States fund special education in a variety of ways. A CSEF report identifies the following types of
funding systems:
• Pupil Weights – aid is allocated on a per pupil basis. The amount of aid distributed is based on a
weight that represents the additional cost of a student. For example, if a student costs 50%
more than an average student then the weight would be .5. States can use one weight for all
special education students or they may use multiple weights to represent different levels of
need for different types of special education students.
• Flat Grant – Under a flat grant approach a state takes the total available special education funds,
divides them by the total number of special education students to determine the per special
education funding amount. Districts are then funded by multiplying their total number of
special education students by the per pupil amount.
• Census-based – The census-based approach assumes that all districts have the same percent of
special education students. It also does not differentiate for specific differences in student
needs/costs. Effectively, the census-based approach funds special education by allocating an
additional dollar per pupil dollar amount to every student in the state. In practice, many states
set a fixed percent of special education students that will be funded and then multiply that
percent times a district enrollment figure to determine the special education count. This special
education count is then multiplied by a per pupil funding amount to determine total special
education funding.
• Resource-Based – The resource-based model funds specific resource levels versus funding a per
pupil dollar figure. Resources are often based on staff/student ratios and can include funding
for teachers, aides, and other resources. States can vary the ratios based on the level of need of
the specific disability category or service level needed.
• Percentage Reimbursement – In states that use percentage reimbursement, districts are
reimbursed by the state for a set percentage of their allowable actual special education
expenditures.
• Variable Block Grant – The variable block grant approach refers to state funding systems that
are at least in part based on ensuring similar funding to some base year amount.
Even when states use similar funding approaches, they can be applied differently. One state that uses
pupil weights may use only one weight while another state might have multiple weights associated with
different levels of need.
As part of the study APA looked at the funding systems in four states: Delaware, Florida, Ohio, and
Pennsylvania.

10
Delaware
Delaware uses a resource-based approach to funding special education. Overall state education aid is
primarily provided on the basis of allotting teachers and using a statewide teacher salary schedule to
determine the total cost of teachers. Special education is differentiated from regular education on the
basis of the ratios of teachers to students that are used to calculate the number of teachers that a
district may employ. For regular education, the ratio is one teacher per 20 students. Three different
ratios are used for special education: (1) one teacher to 8.4 students for “basic” special education; one
teacher to 6 students for “intensive” special education; and one teacher to 2.6 students for “complex”
special education.
If the ratio for regular education were thought of as 1.000, then the ratio for “basic” special education
would be 2.381, the ratio for “intensive” special education would be 3.333, and the ratio for “complex”
special education would be 7.6923. In effect these ratios create relative add-on weights for special
education that are simply one unit less than the ratio; therefore the weight for “basic” special education
is 1.3810, the weight for “intensive” special education is 2.3333, and the weight for “complex” special
education is 6.6923. It should be noted that if the salaries for special education teachers were
systematically higher than those for regular teachers, and the actual cost of special education was based
on multiplying numbers of teachers times their salaries, then the weights would be higher (and if the
salaries for special education teachers were systematically lower than those for regular teachers, the
weights would be lower). See Delaware Revised Statutes Title 14, Chapter 1703.
Florida
Florida was the first state to use pupil weights as the basis of allocating state aid for special education;
since then numerous weights were used to consider the differential costs associated with students with
different disabilities. Recently, however, the approach was modified in such a way that most students in
special education receive the same weighting as students in regular programs (with weights used to
reflect cost differences between kindergarten, elementary school, middle school, and high school). A
few students in special education receive much higher weights to reflect the higher cost of providing
services to them; these two add-on weights are 3.523 (Level IV) and 4.935 (Level V).
In 2011, there were 2,375,362 unweighted students, 19,260 Level IV special education students and
4,897 Level V special education students; therefore, special education students eligible for added
weighting represent about one percent of all students, which is far lower than the national average
proportion of all students in special education programs (about 13 percent). Applying the special
education weights produced 92,021 weighted special education students out of a grand total of
2,849,223 weighted students (including all weights).

11
Ohio
Ohio uses a weighted resource-based approach to determine the numbers of special education teachers
needed by school districts, who then earn revenue based on salary levels that are applied to them. Six
categories of weights are used: a.=2906; b=.7374; c=1.7716; d=2.3643; e=3.2022; and f=4.7205. The
number of teachers is based on multiplying each weight by the number of students in that weighted
group, adding up the sums across the six weights, multiplying the sum by .90 and dividing the product by
20. In addition, teacher aides are allotted on the basis of 25 percent of the number of teachers. For
example, in a district that had 3,000 students in special education programs (categorized into the six
groups as 1,200, 900, 500, 180, 150, and 70 students respectively), the total number of teachers allotted
would be 141 and the total number of teacher aides would be 35. Obviously, the .90 factor simply
reduces the value of the weights, reducing the numbers of teachers and aides below what they would
have been if the factor had not been used.
Pennsylvania
Pennsylvania uses a census-based approach to allocate most of its funds for special education. Under
the system, districts receive funding based on 16 percent of all students in the district. The 16 percent
of students are multiplied by the special education weight. Based on actual revenue provided the
weight is about 1.03 which is based on the fact that the state paid $1.026 billion for special education
and $5.226 billion in basic support in 2010-11 and assuming that state support represents about 35
percent of all support for school districts and that local districts supplement special education to the
same extent that they supplement basic support. Pennsylvania does provide additional extraordinary
aid for very high cost students.
Of the four states described above, three of the states differentiate special education funding based on
the need of the special education student. Two do this within resource based funding systems and one
does this using a pupil weights system. Only Pennsylvania’s census-based funding system does not have
any sort of adjustment for different levels of need. The census-based approach does not lend itself to
this type of differentiation.
12
V. Data Analysis
APA’s data analysis work was divided into two phases. The initial data analysis was designed to identify
disability categories that would be considered low incidence, or categories that have a small percentage
of all special education students, and to identify which of these low incidence categories also had high
per pupil costs. Finally, APA hoped to identify districts to interview for the second round of interviews
by identifying districts with low incidence, high cost students.
The second phase of the analysis was designed to identify differences between districts with different
characteristics. This included looking at total percentage differences and differences in types of
students served and how students are served.
As was mentioned in the introduction APA requested data from the DOE that included:
• Number of students in each disability category;
• Number of students in each disability by type of placement;
• Age range, grade level range or school level of students;
• Special education revenues by source (state, local, and federal);
• Special education expenditures;
• Demographic data including enrollment, number of students eligible for free and reduced price
lunch, and number of English language learners;
• Grade span of the district;
• Information on the wealth of the district, such as property value per student; and
• Information on the location of the district (rural, urban or suburban).
As was also mentioned in the introduction, there was some difficulty receiving some of the data. In the
end, APA was able to create a district level database that included:
• Identifying information - county name, county number, district number, district name, DFG
group and district type. (District type includes elementary districts, secondary districts, K-12
districts, etc.)
• Demographic data – resident enrollment, attending enrollment, number of at-risk students, and
number of ELL students
• Special education student data – total resident special education count, total attending special
education count, attending special education students by disability category, and attending
special education students by placement.
• Expenditures – total general fund expenditures, total special education expenditures, special
education expenditures by disability categories and per pupil special education expenditures by
categories and total per pupil education spending.
It was hoped that the data would be collected for the 2007-08 and 2008-09 school years. These two
school years represent the last year of the tier special education funding system and the first year of the

13
new census-based system. The individual student data was only available for the 2008-09 and 2009-10
school years. This data was the only student level special education database available for attending
students. The attending student data was important in APA’s efforts to understand spending and thus
we shifted our database to the 2008-09 and 2009-10 school years.
Low Incidence Categories
From the literature review, APA gained an understanding of the disability categories that are generally
considered low incidence. APA used the district level database to see if New Jersey’s special education
distributions were similar to the research. The New Jersey disability categories examined were:
• Auditorily Impaired
• Autistic
• Cognitively Impaired – Mild
• Cognitively Impaired – Moderate
• Cognitively Impaired – Severe
• Communication Impaired
• Emotionally Disturbed
• Multiply Disabled
• Deaf-Blindness
• Orthopedically Impaired
• Other Health Impaired
• Preschool Child with a Disability
• Specific Learning Disability
• Traumatic Brain Injury
• Visually Impaired
The special education category of Eligible for Speech-Language Services was not examined as part of this
analysis although it was examined in later analyses.
The database included information for 594 school districts. The 594 school districts enrolled 1,367,769
resident students and 1,344,739 attending students. Resident special education students totaled
202,510 and attending special education students totaled 180,952. Table V-1 shows the percentage of
NJ attending students in each of the fifteen disability categories in both 2008-09 and 2009-10.

14
TABLE V-1
PROPORTIONAL DISTRIBUTION OF ATTENDING STUDENTS
BY DISABILITY IN 2008-09 AND 2009-10
Disability
Auditorily Impaired Autistic Cog - Mild
Cog-
Mod Cog-Sev
2008-09 0.1% 0.7% 0.3% 0.1% 0.0%
2009-10 0.1% 0.8% 0.3% 0.1% 0.0%
Disability
Communication
Impaired
Emotionally
Disturbed
Multiply
Disabled
Deaf-
Blind
Orthopedically
Impaired
2008-09 1.2% 0.6% 1.4% 0.0% 0.3%
2009-10 1.4% 0.6% 1.4% 0.0% 0.0%
Disability
Other Health Preschool
Specific
Learning TBI Visually Impaired
2008-09 2.0% 0.7% 5.7% 0.1% 0.0%
2009-10 2.3% 0.8% 5.9% 0.1% 0.0%
In 2008-09 the Cognitively Impaired – Severe, Deaf-Blind and Visually Impaired – all had 0.0% of
attending students categorized in them. The category with the highest percentage was Specific
Learning Disability, with 5.7% of attending students. The low and high categories stay the same in 2009-
10 and the range is 0.0% for the low and 5.9% for the high. A disability category with 0.0% students
does not have zero students in it across the state; rather, there are just so few students that the
percentage is below 0.0%. Eleven of the fifteen categories had less than one percent of all NJ students
in them. They are:
• Auditorily Impaired
• Autistic

15
• Cognitively Impaired – Mild
• Cognitively Impaired – Moderate
• Cognitively Impaired – Severe
• Emotionally Disturbed
• Deaf-Blindness
• Orthopedically Impaired
• Preschool Child with a Disability
• Traumatic Brain Injury
• Visually Impaired
The list above is very similar to the list of low incidence disability categories in the literature review
section. New Jersey’s disability categories do not directly correspond to the list in the literature review
but they are close to being the same. The one category that is on the list above but not on the literature
review list is Preschool Child with a Disability. Obviously this category only relates to preschool children
and the students would generally be found in elementary and K-12 districts in New Jersey. Secondary
and vocational districts in New Jersey would not be expected to have any preschool students. The list
above was a good starting point for identifying low incidence disability categories. Still, just because a
category is low incidence it does not mean that it is high cost. The next step of the analysis was to
attempt to identify the high cost categories.
High Cost Categories
APA worked with the DOE to identify the expenditures for special education from the DOE databases. In
our initial meetings with the DOE, APA reviewed the expenditure categories that the DOE collected for
special education. The expenditures for special education were complex but did include detailed level
expenditure data for a number of disability categories. Expenditure data was not collected for every
New Jersey disability category and the names of the categories were not always the same but
expenditures for the following categories were listed:
• Auditorily Impaired
• Autistic
• Behavior Impaired
• Cognitively Impaired – Mild
• Cognitively Impaired – Moderate
• Cognitively Impaired – Severe
• Multiply Disabled
• Visually Impaired
APA also collected additional expenditure categories in an effort to identify the total special education
expenditures for each district. The expenditures were for students attending the district and APA’s plan
was to examine the per pupil expenditures for the expenditure categories available. Per pupil

16
expenditures would be created using the total expenditures in each category and then dividing them by
the number of attending students in each of the available categories.
Once APA received the expenditure data, it became apparent that this analysis might not be possible. It
appeared that few districts identified expenditures by categories in a consistent manner. Table V-2
shows the number of districts that identified expenditures into a specific category and the range of per
pupil amounts within each category. The table shows that no expenditure category has more than
46.5% of districts categorizing expenditures into it. Even in this category, Multiple Disabilities in 2009-
10, the range of per pupil amounts categorized is from a low of $80 per pupil up to $192,951 per pupil.
The Cognitively Impaired – Severe expenditures had no expenses identified for any districts in either
2008-09 or 2009-10. A number of the expenditure categories had less than 10% of the districts
categorizing the costs into the disability specific expenditure categories.
TABLE V-2
PER PUPIL EXPENDITURE INFORMATION BY DISABILITY CATEGORY 2008-09 AND 2009-10
Auditory
per
Pupil
Autism
per Pupil
Behavior
per Pupil
Cog -
Mild per
Pupil
Cog -
Mod -
Per Pupil
Cog -
Severe
per
Pupil
Multiple
per Pupil
Visual
per Pupil
2008-09
Districts 6 176 154 59 24 0 268 19
Minimum $191 $2 $62 $142 $46 $0 $55 $52
Maximum $5,820 $309,704 $477,156 $425,050 $107,892 $0 $171,697 $144,857
Average $1,973 $18,008 $17,390 $32,511 $31,117 $12,669 $22,863
Percentage
of Districts 1.0% 29.6% 25.9% 9.9% 4.0% 0.0% 45.1% 3.2%
2009-10
Districts 31 182 148 52 26 0 276 15
Minimum $39 $27 $77 $51 $454 $0 $80 $950
Maximum $53,145 $110,503 $62,538 $408,963 $116,106 $0 $192,951 $155,458
Average $20,269 $15,162 $13,493 $28,128 $28,202 $13,713 $26,642
Percentage
of Districts 5.2% 30.6% 24.9% 8.8% 4.4% 0.0% 46.5% 2.5%
The lack of districts utilizing the categories and the wide variation in per pupil figures within the
categories made APA uncomfortable with the specific disability category information. We decided not
to use it further until we had a chance to talk to districts about the data.

17
Second Phase
Demographics
The initial analysis of low incidence high cost students was used to help with the second round of
interviews described below. After the initial statewide analysis was undertaken, a more detailed
analysis was done of the data to examine differences associated with district type and district DFG type
(being used as a measure of district wealth.) APA received a “district type” indicator for each of the 594
districts used in this analysis. For this analysis APA examined all districts together and then looked at
elementary districts, secondary districts, K-12 districts, other districts, and districts with only resident
students separately. We combined K-6 and K-8 districts into one elementary group and combined the 7-
12 and 9-12 districts into one secondary group. A number of districts only had resident students but no
attending students (these are non-operating districts); these districts were grouped together. All the
districts that did not fit into the other four categories were grouped into the “other” category.
The districts were also examined based on their DFG category. DFG categories were used to represent
district wealth in this analysis. The DFG categories range from A to J with A being the least wealthy
districts and J being the wealthiest districts. The eight categories were combined into four categories
for the analysis. The four categories are DFGs A/B, C-D/D-E, F-G/G-H, and I/J. A few districts did not
have a DFG and they were grouped into a fifth category for analysis. Tables V-3A through V-9B are
shown at the end of this chapter.
Tables V-3A and V-3B show the layout of the 594 districts by district type and DFG type. Of the 594
districts, 284 districts are elementary districts, 47 are secondary districts, 220 are K-12 districts, 21 are
other districts, and 22 are non-operating districts. The total resident enrollment of the 594 districts was
1,367,769 students in 2008-09 and 1,370,035 in 2009-10. In each year, the elementary districts had
resident enrollment of about 250,000 students and the secondary districts had resident enrollment of
about 95,000 students. The K-12 districts had nearly 1,000,000 resident students in both years. Other
districts had around 25,000 resident students each year and the non-operating districts had around
2,000 students.
The total attending enrollment for 2008-09 was 1,344,739 students with the 2009-10 attending
enrollment at 1,348,084. In each year, the elementary districts had attending enrollment of about
230,000 students and the secondary districts had attending enrollment of about 95,000 students. The
K-12 districts had nearly 1,000,000 resident students in both years. Other districts had around 25,000
resident students each year and the non-operating districts had no attending students.
Tables V-3A and V-3B also show the number of districts per DFG group. Of the 594 districts, 105 districts
were A/B districts, 151 districts were C-D/D-E districts, 164 districts were F-G/G-H districts, 128 were I/J
districts, and 46 districts had no DFG designation. The A/B districts had the most resident and attending
students in both years with around 370,000 students. The smallest DFG group was the I/J group with

18
around 290,000 resident and attending students in both years. Districts with no DFG designation had a
little over 30,000 resident and attending students in both years.
In 2008-09, 91 percent of the A/B group’s attending students went to K-12 districts; no other group had
more than 73 percent of the students going to K-12 districts. Over 30 percent of I/J attending students
went to elementary districts with only seven percent of A/B students attending an elementary district.
The C-D/D-E and F-G/G-H districts had similar attendance patterns by district type with around 70
percent of students attending K-12 districts, around 20 percent attending elementary districts, and 10
percent attending secondary districts. The non DFG districts had almost no students attending
elementary or secondary districts and only 16 percent attending K-12 districts. The rest seem to attend
other types of districts including vocational districts. These figures are very similar in 2009-10.
Tables V-4A and V-4B examine the total number of resident and attending special education and speech
students. The special education figures include students classified in the 15 disability categories
described earlier in the report. In the second phase of the analysis we have included the speech only
students in parts of the analysis. In 2008-09 and 2009-10, there were a little over 202,000 resident
special education students. The attending special education count was around 180,000 students in
2008-09 and went up to a little over 185,000 students in 2009-10. Looking at both the resident and
attendance figures shows that the attending count was around 90 percent of the resident count; this
means a number of special education students were being served in districts outside of the 594 districts
included in the analysis. Total speech only students show a similar trend in both years with the
attending count 87.4 percent of the resident count in 2008-09 and 93.6 percent in 2009-10. These ratios
were similar when looking at the data by district type except for the secondary district speech-only
students and the special education students in other districts. Though the total number of students in
either resident or attending counts was very low, it is still interesting that the attending count was only
around 50 percent of the resident count in 2008-09, rising to around 68 percent in 2009-10. The other
districts had over 5,310 resident special education students in 2008-09 but only had about 68 percent of
this count in attending special education students. The figure was around 67 percent for 2009-10.
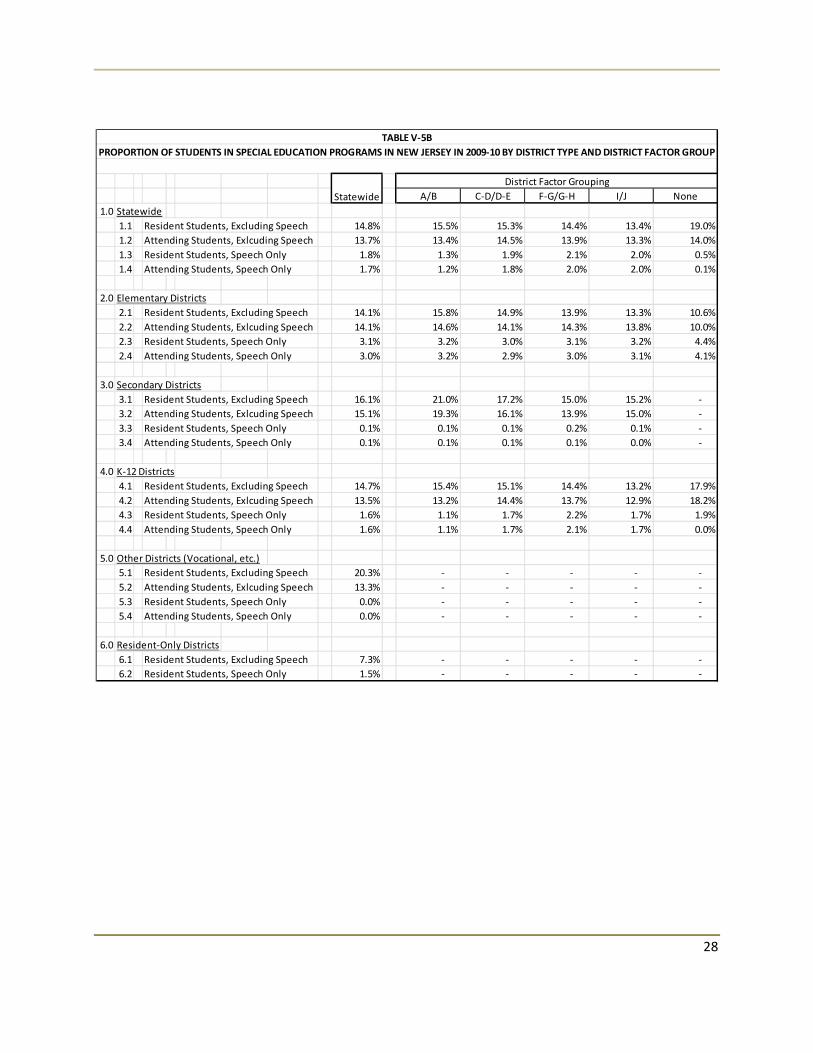
Tables V-5A and V-5B take the figures from Tables V-4A and V-4B and convert the student counts into
percentages. The tables show the percentages for resident special education students, attending special
education students, resident speech students and attending speech students. The statewide average
resident special education percentage was 14.8 percent for both years, very close to the funded
percentage in the census-based funding system. The K-12 districts had 14.7 percent of the resident
students in special education in both 2008-09 and 2009-10. Elementary districts had percentages below
the state average for both years. The secondary and other districts had resident percentages above the
state average, while the other districts had rates well above the average. The resident-only districts had
a very low count of special education students and the percentages vary greatly over the two years.
Looking at the statewide DFG breakdowns for both years shows that the percentage of resident special
education students was highest in the poorest districts and decreased as the districts become wealthier.
The non DFG districts actually had the highest resident special education percentages. This trend

19
continued in the elementary, secondary, and K-12 districts for both years. It is important to note that
districts are fiscally responsible for resident special education students and must pay for the services
these students receive.
The attending special education percentage statewide went down from the 14.8 percent resident
percentage for both 2008-09 and 2009-10 to 13.5 percent attending special education students in 2008-
09 and 13.7 percent in 2009-10. The pattern seen for resident special education percentages being
highest in the A/B DFG districts and lowest in the I/J districts does not continue when looking at the
attending special education percentages. In fact, no clear pattern can be seen as the figures go up and
down across the DFG groups at the state level and when looking at the district types.
Tables V-6A and V-6B break out the attending special education students by disability category and by
district type. A few categories showed differences by type of district. The first is autism, with a
statewide average for 2008-09 of 0.7 percent and 0.8 percent for 2009-10. The K-12 districts in each
year had the same percentage of autism students as the statewide average. Elementary districts had
higher percentages and the secondary and other districts had lower percentages. A similar pattern was
seen in the Communication Impaired category. The state average was 1.2 percent in 2008-09 and 1.4
percent in 2009-10. K-12 districts had the same percentage as the statewide average. Elementary
districts were above the statewide average and secondary and other districts were below the average.
The pattern changes for the Emotionally Disturbed and Specific Learning Disability categories. For
Emotionally Disturbed, the secondary districts had a percentage of 0.8 percent in 2008-09 while the
state average was only 0.6 percent in that year. The figures were 0.9 percent and 0.6 percent
respectively for 2009-10. The K-12 districts had the state average percentage and the elementary and
other districts had lower percentages. Secondary and other districts had much higher percentages of
Specific Learning Disabilities than the statewide average and the other district types. The statewide
averages for the category were 5.7 percent in 2008-09 and 5.9 percent in 2009-10. The secondary and
other districts had percentages over 8 percent in both years.
The Preschool Child with a Disability category is the other category with obvious differences based on
the types of children eligible for the services and the types of children districts serve. The statewide
average for the category was 0.7 percent in 2008-09 and 0.8 percent in 2009-10. Elementary districts
had the highest percentages of these students and the K-12 districts had around the statewide average.
By definition, the secondary districts had no students in the category; the other districts also showed 0.0
percent for the category.
Tables V-7A and V-7B show the same data broken out by DFG group versus district type. Most of the
categories show little or no difference between the DFG groups. As was mentioned above, the
statewide averages for Autism were 0.7 percent in 2008-09 and 0.8 percent in 2009-10. The
percentages for the DFG groups show the lowest figures in the A/B DFG group and in the districts with
no DFG designation. The percentages grow from the A/B group up through the I/J DFG group. This
trend exists in both years.

20
The Cognitive Impairment – Mild category had a statewide average of 0.3 percent for both 2008-09 and
2009-10. The distribution across DFG groups in both years shows the highest percentages in the K-12
districts, 0.6 percent in 2008-09 and 0.5 percent in 2009-10. The non DFG districts had an average of 0.4
percent in each of the two years. The other DFG groups did not have a percentage over 0.2 percent in
either year.
DFG groups A/B and C-D/D-E along with the non DFG districts had higher Multiply Disabled percentages
in both years than the state average. The I/J DFG group had lower percentages in each year. Similarly,
the I/J group had lower percentages of Specific Learning Disability percentages in both years. The non
DFG group districts had much higher percentages of Specific Learning Disability students than any other
grouping with around 8.0 percent. The statewide average was 5.7 percent in 2008-09 and 5.9 percent in
2009-10. In Other Health Impairments the percentages trend similarly to the autism figures. The A/B
DFG districts and the non DFG districts had the lowest percentages. The percentages increase up from
the A/B group and was highest in the I/J DFG districts. The increase was over one percentage point in
both years.
Tables V-8A and V-8B look at the types of services students are receiving by the district type. The tables
only focus on the six through 21 year-old categories. The Pre-School information is hard to compare
since the secondary and other districts had no students and thus we have excluded it. The types of
service include:
• Six through twenty-one year olds
o At least eighty percent in the classroom
o Forty to eighty percent in the classroom
o Less than forty percent in the classroom
o Public Separate
o Private day program
o Private residential program
o Home
o Correctional
The 6-21 categories are easier to compare. For both years the secondary districts had much higher
percentages of students being served in the classroom over 80 percent of the time. The other districts
had a much higher percentage of students being served between 40 percent and 80 percent of the time
in the classroom than the district type groups in both 2008-09 and 2009-10. The other districts also had
percentages in both years of students being served in public separate programs. The statewide average
was 1.25 percent in 2008-09 and 0.9 percent in 2009-10. Other districts had 3.2 percent in public
separate programs in 2008-09 and 2.8 percent in 2009-10.
The average percentage of students served in private day programs was 4.0 percent for both years.
Elementary districts had higher percentages served in these programs in both years; 5.5 percent and 6.2
percent respectively. The other districts had very low percentages of students served in private day

21
programs with only 0.4 percent served this way in both years. Secondary districts had 0.6 percent and
0.7 percent of students served at home in the two years. This was higher than the 0.3 percent average
for providing services at home for the state.
Tables V-9A and V-9B show the type of service by DFG grouping. When looking at the service type data
by DFG group there seemed to be two types of trends within the data. The percentages of students
being served at least 80 percent in the classroom and in private day programs seemed to be lowest in
the A/B DFG group and the non DFG group. When just looking at districts with DFG designations, the
percentages were lowest in the A/B group and then increased until the figures were the highest in the
I/J DFG group. The 80 percent category in 2008-09 grew from 39.6 percent of students served in the
A/B group to 51.4 percent in the I/J DFG group, for 2009-10 the figures were 38.3 percent and 52.8
percent. The private day program figures grew from 3.1 percent in the A/B group to 5.4 percent in the
I/J DFG group in 2008-09 and 2.4 percent to 5.5 percent in 2009-10.
The opposite trend is apparent for students served less than 40 percent in the classroom, in public
separate programs, and at home. The I/J districts had the lowest percentages and the percentages rose
up to the A/B DFG districts. In 2008-09 the figures for less than 40 percent in the classroom were at a
low in the I/J districts at 7.1 percent and rose to 23.3 percent in the A/B districts. For 2009-10 the
figures rose from 7.2 percent to 24.9 percent. The public separate programs percentages rose from 0.8
percent in the I/J districts to 1.9 percent in the A/B districts in 2008-09 and .7 to 1.3 in 2009-10. For
services at home, the percentages were relatively flat in 2008-09 but from .2 percent to .5 percent
between the I/J districts and the A/B districts. The non DFG districts had high percentages of students
served less than 40 percent in the classroom and in public separate program but about average home
service percentages. The non DFG districts also had a well above average percentage of students served
between forty and 80 percent of the time in the classroom.
Expenditures
As part of the second phase of the analysis APA reexamined expenditure data. As we discussed earlier,
APA was not comfortable using the disability level expenditure data; the expenditure disability
categories do not account for all services provided to students within specific categories. For the second
phase we examined total per pupil special education expenditures instead. We created a total special
education per pupil amount based on attending special education students. APA used total special
education expenditures, excluding tuition payments, to create a total special education spending
amount. Expenditure categories for salaries were multiplied by a district specific benefit rate, received
from the DOE, to account for benefit costs. The total special education spending amount was divided by
special education attending students to create the per pupil special expenditure figure.
Once we had created the per pupil special education expenditure figures, we wanted to better
understand how such spending was related to three particular characteristics of school districts: (1) their
enrollment size; (2) their type, in terms of being an elementary, secondary, or K-12 district, and (3) their
socio-economic situation, as reflected by their District Factor Group (DFG). To start, we examined

22
relationships between spending and each of the three characteristics separately, grouping districts into
categories and examining average spending for each group. Ultimately, we undertook regression
analysis in an attempt to understand how the three characteristics might be related to one another and
spending.
We began the analysis by looking at the same 594 districts used in the demographic analysis above.
Some districts had no expenditure information or had unusually low or high per pupil expenditures
when compared to the other districts. We eliminated districts for which per student spending was more
than 1.5 standard deviations above or below the statewide average. Between districts with missing data
and those eliminated using this approach, we were left with 558 districts in 2008-09 and 539 districts in
2009-10 to include in the expenditure analysis. It is also the case that some districts are not classified as
elementary, secondary, or K-12 and some districts are not assigned a DFG value; those districts were
also eliminated from the analysis when we focused on a particular characteristic.
Tables V-10A through V-12B indicate the relationships between the three characteristics (enrollment
size, district type, and DFG) and per student spending for special education as follows: Tables V-10A and
V-10B show enrollment size; Tables V-11A and V-11B show district type; Tables V-12A and V-12B show
DFG; all A tables are for 2008-09; and all B tables for 2009-10. Note that 594 districts are included when
looking at enrollment size, 551 districts are included when looking at district type, and 548 districts are
included when looking at DFG values.
We show one other variable in the tables – the average “need” of districts is based on assigning weights
to students with different disabilities. We used three weights to reflect the relative cost of serving
students with different disabilities (with the disabilities being placed into groups based on the literature
review discussed in section two of this report): high cost disabilities (autistic, cognitive impairment –
severe, deaf-blind, emotionally disturbed, multiply disabled and traumatic brain injury) were weighted
at 4.0; moderate cost disabilities (auditorily impaired, cognitive impairment - moderate, other health
impaired, orthopedically impaired, preschool child with a disability, and visually impaired) were
weighted at 2.0; and low cost disabilities (communication impaired, cognitive impairment - mild, and
specific learning disability) were weighted at .5. We assigned these weights because we could not
develop any basis for assigning a relative cost by disability based on our review of spending data by
disability (figures simply did not make sense, which may reflect any of a number of issues discussed
previously) and yet we wanted to see whether there was a relationship between average spending for
special education by district and the nature of the disabilities assigned to students being served by the
districts.
Tables V-10A and V-10B show the relationship between district enrollment size and both districts
average spending for special education and need in 2008-09 and 2009-10. A lot of districts in New
Jersey are relatively small; more than 40 percent of all districts had fewer than 1,000 students and fewer
than 15 percent of all districts had more than 5,000 students. Spending was highest in the smallest
districts, which also had needs that were slightly above average (in 2009-10, on average the 117 districts
with less than 500 students spent about nine percent more than the statewide average and had needs

23
that were about four percent higher than average. In that same year, average spending for special
education was lowest in districts with between 1,000 and 2,000 students (spending was about five
percent below average while needs were about three percent below average). In fact, spending
generally decreased as enrollment size increased for districts with enrollments under 5,000 students;
however, spending began to rise in districts over 5,000 students, with districts with more than 10,000
students spending above state average but having needs that were below the state average.
Tables V-11A and V-11B show the relationship between district type (elementary, secondary, or K-12
district) and both average per student spending for special education and need. Clearly, most districts
are organized as either elementary or K-12 districts. Per student spending for special education was
highest in the elementary districts, where need was also relatively high, and lowest in secondary
districts, where need was relatively low. For K-12 districts, spending was slightly below the statewide
average and need was around statewide average.
Tables V-12A and V-12B show the relationship between district DFG and both average per student
spending for special education and need. While districts were split relatively evenly across the DFGs, the
districts designated as A or B in terms of DFG were larger than average while districts in the other
groups were of average size (that is, the groups contained larger and smaller districts which, on average,
were just about the statewide average in terms of size). Interestingly, the average need of all DFG
groups was similar. But spending was somewhat higher in the DFG groups with higher socio-economic
status – despite having similar needs and being of similar size, wealthier districts spent a bit more for
special education.
The data in these tables suggests that: (1) smaller districts spent more than larger districts on special
education; (2) elementary districts spent more on special education than districts organized as
secondary or K-12 districts did; and (3) wealthier districts spent more on special education than less
wealthy school districts did. These patterns are general ones that appear to exist but that cannot be
substantiated by statistical evidence. We used a statistical technique, multiple regression, to see
whether enrollment size, district type, and DFG could predict differences in per student spending on
special education when considered simultaneously and found that those factors could not explain such
differences. Patterns apparent when districts are placed in groups simply do not exist when taking the
information for each individual district into consideration.
The data analysis information is combined with the literature review information and the state program
information from earlier in the report along with the interview information described next to create the
final conclusions and recommendations.

24
A/B C-D/D-E F-G/G-H I/J None
1.0 Statewide
1.1 Number of Districts 594 105 151 164 128 46
1.2 Number of Resident Students 1,367,769 373,589 302,507 365,081 293,282 33,311
1.3 Number of Attending Students 1,344,739 366,496 297,088 361,047 288,879 31,231
2.0 Elementary Districts
2.1 Number of Districts 284 48 78 82 74 2
2.2 Number of Resident Students 250,483 28,940 61,740 68,646 90,788 369
2.3 Number of Attending Students 229,608 24,730 54,624 63,517 86,300 438
3.0 Secondary Districts
3.1 Number of Districts 47 5 14 17 11 -
3.2 Number of Resident Students 95,399 7,805 24,661 40,474 22,460 -
3.3 Number of Attending Students 95,828 7,604 24,772 40,463 22,990 -
4.0 K-12 Districts
4.1 Number of Districts 220 52 59 65 43 1
4.2 Number of Resident Students 994,368 336,844 216,107 255,961 180,034 5,423
4.3 Number of Attending Students 993,555 334,162 217,692 257,067 179,590 5,044
5.0 Other Districts (Vocational, etc.)
5.1 Number of Districts 22 - - - - -
5.2 Number of Resident Students 25,439 - - - - -
5.3 Number of Attending Students 25,749 - - - - -
6.0 Resident-Only Districts
6.1 Number of Districts 21 - - - - -
6.2 Number of Resident Students 2,081 - - - - -
6.3 Number of Attending Students - - - - - -
Statewide
District Factor Grouping
TABLE V-3A
DISTRIBUTION OF DISTRICTS AND STUDENTS IN NEW JERSEY IN 2008-09 BY DISTRICT TYPE AND DISTRICT FACTOR GROUP

25
A/B C-D/D-E F-G/G-H I/J None
1.0 Statewide
1.1 Resident Students, Excluding Speech 202,510 59,087 46,403 51,428 38,776 6,817
1.2 Attending Students, Exlcuding Speech 180,952 49,464 41,761 47,969 37,496 4,262
1.3 Resident Students, Speech Only 24,145 5,231 5,265 7,863 5,626 160
1.4 Attending Students, Speech Only 21,104 3,820 4,946 6,989 5,333 16
2.0 Elementary Districts
2.1 Resident Students, Excluding Speech 34,929 4,583 9,143 9,245 11,915 43
2.2 Attending Students, Exlcuding Speech 31,078 3,519 7,380 8,616 11,519 44
2.3 Resident Students, Speech Only 7,864 1,024 1,868 2,234 2,727 11
2.4 Attending Students, Speech Only 6,777 810 1,477 1,966 2,514 10
3.0 Secondary Districts
3.1 Resident Students, Excluding Speech 15,322 1,637 4,295 6,032 3,359 -
3.2 Attending Students, Exlcuding Speech 13,929 1,473 3,956 5,385 3,115 -
3.3 Resident Students, Speech Only 147 14 38 78 17 -
3.4 Attending Students, Speech Only 74 8 31 20 15 -
4.0 K-12 Districts
4.1 Resident Students, Excluding Speech 146,589 52,868 32,965 36,152 23,502 1,103
4.2 Attending Students, Exlcuding Speech 132,320 44,472 30,425 33,968 22,862 593
4.3 Resident Students, Speech Only 16,101 4,193 3,359 5,551 2,882 116
4.4 Attending Students, Speech Only 14,247 3,002 3,438 5,003 2,804 -
5.0 Other Districts (Vocational, etc.)
5.1 Resident Students, Excluding Speech 5,310 - - - - -
5.2 Attending Students, Exlcuding Speech 3,609 - - - - -
5.3 Resident Students, Speech Only 11 - - - - -
5.4 Attending Students, Speech Only 6 - - - - -
6.0 Resident-Only Districts
6.1 Resident Students, Excluding Speech 362 - - - - -
6.2 Attending Students, Exlcuding Speech 16 - - - - -
6.3 Resident Students, Speech Only - - - - - -
6.4 Attending Students, Speech Only 22 - - - - -
Statewide
District Factor Grouping
TABLE V-4A
DISTRIBUTION OF STUDENTS IN SPECIAL EDUCATION PROGRAMS IN NEW JERSEY IN 2008-09 BY DISTRICT TYPE AND DISTRICT FACTOR GROUP

26
A/B C-D/D-E F-G/G-H I/J None
1.0 Statewide
1.1 Resident Students, Excluding Speech 202,518 58,367 46,191 52,383 39,115 6,463
1.2 Attending Students, Exlcuding Speech 185,318 49,392 43,026 49,966 38,432 4,502
1.3 Resident Students, Speech Only 24,254 4,783 5,605 7,784 5,919 163
1.4 Attending Students, Speech Only 22,710 4,360 5,322 7,236 5,766 26
2.0 Elementary Districts
2.1 Resident Students, Excluding Speech 35,243 4,619 9,198 9,461 11,925 41
2.2 Attending Students, Exlcuding Speech 32,123 3,612 7,722 8,992 11,753 44
2.3 Resident Students, Speech Only 7,775 924 1,862 2,121 2,851 17
2.4 Attending Students, Speech Only 6,937 797 1,586 1,889 2,647 18
3.0 Secondary Districts
3.1 Resident Students, Excluding Speech
3.2 Attending Students, Exlcuding Speech 15,301 1,610 4,203 6,055 3,435 -
3.3 Resident Students, Speech Only 14,509 1,461 3,966 5,614 3,468 -
3.4 Attending Students, Speech Only 118 11 30 65 12
80 10 29 32 9 -
4.0 K-12 Districts
4.1 Resident Students, Excluding Speech
4.2 Attending Students, Exlcuding Speech 146,495 52,139 32,791 36,868 23,756 943
4.3 Resident Students, Speech Only 135,132 44319 31338 35360 23211 904
4.4 Attending Students, Speech Only 16,316 3,848 3,713 5,598 3,056 101
15,685 3,553 3,707 5,315 3,110 -
5.0 Other Districts (Vocational, etc.)
5.1 Resident Students, Excluding Speech
5.2 Attending Students, Exlcuding Speech 5,328 - - - - -
5.3 Resident Students, Speech Only 3,548 - - - - -
5.4 Attending Students, Speech Only 13 - - - - -
8 - - - - -
6.0 Resident-Only Districts
6.1 Resident Students, Excluding Speech 151 - - - - -
6.2 Attending Students, Exlcuding Speech 32 - - - - -
Statewide
District Factor Grouping
TABLE V-4B
DISTRIBUTION OF STUDENTS IN SPECIAL EDUCATION PROGRAMS IN NEW JERSEY IN 2009-10 BY DISTRICT TYPE AND DISTRICT FACTOR GROUP

27
A/B C-D/D-E F-G/G-H /IJ None
1.0 Statewide
1.1 Resident Students, Excluding Speech 14.8% 15.8% 15.3% 14.1% 13.2% 20.5%
1.2 Attending Students, Exlcuding Speech 13.5% 13.5% 14.1% 13.3% 13.0% 13.6%
1.3 Resident Students, Speech Only 1.8% 1.4% 1.7% 2.2% 1.9% 0.5%
1.4 Attending Students, Speech Only 1.6% 1.0% 1.7% 1.9% 1.8% 0.1%
2.0 Elementary Districts
2.1 Resident Students, Excluding Speech 13.9% 15.8% 14.8% 13.5% 13.1% 11.7%
2.2 Attending Students, Exlcuding Speech 13.5% 14.2% 13.5% 13.6% 13.3% 10.0%
2.3 Resident Students, Speech Only 3.1% 3.5% 3.0% 3.3% 3.0% 3.0%
2.4 Attending Students, Speech Only 3.0% 3.3% 2.7% 3.1% 2.9% 2.3%
3.0 Secondary Districts
3.1 Resident Students, Excluding Speech 16.1% 21.0% 17.4% 14.9% 15.0% -
3.2 Attending Students, Exlcuding Speech 14.5% 19.4% 16.0% 13.3% 13.5% -
3.3 Resident Students, Speech Only 0.2% 0.2% 0.2% 0.2% 0.1% -
3.4 Attending Students, Speech Only 0.1% 0.1% 0.1% 0.0% 0.1% -
4.0 K-12 Districts
4.1 Resident Students, Excluding Speech 14.7% 15.7% 15.3% 14.1% 13.1% 20.3%
4.2 Attending Students, Exlcuding Speech 13.3% 13.3% 14.0% 13.2% 12.7% 11.8%
4.3 Resident Students, Speech Only 1.6% 1.2% 1.6% 2.2% 1.6% 2.1%
4.4 Attending Students, Speech Only 1.4% 0.9% 1.6% 1.9% 1.6% 0.0%
5.0 Other Districts (Vocational, etc.)
5.1 Resident Students, Excluding Speech 20.9% - - - - -
5.2 Attending Students, Exlcuding Speech 14.0% - - - - -
5.3 Resident Students, Speech Only 0.0% - - - - -
5.4 Attending Students, Speech Only 0.0% - - - - -
6.0 Resident-Only Districts
6.1 Resident Students, Excluding Speech 17.4% - - - - -
6.2 Resident Students, Speech Only 0.0% - - - - -
Statewide
District Factor Grouping
TABLE V-5A
PROPORTION OF STUDENTS IN SPECIAL EDUCATION PROGRAMS IN NEW JERSEY IN 2008-09 BY DISTRICT TYPE AND DISTRICT FACTOR
28
A/B C-D/D-E F-G/G-H I/J None
1.0 Statewide
1.1 Resident Students, Excluding Speech 14.8% 15.5% 15.3% 14.4% 13.4% 19.0%
1.2 Attending Students, Exlcuding Speech 13.7% 13.4% 14.5% 13.9% 13.3% 14.0%
1.3 Resident Students, Speech Only 1.8% 1.3% 1.9% 2.1% 2.0% 0.5%
1.4 Attending Students, Speech Only 1.7% 1.2% 1.8% 2.0% 2.0% 0.1%
2.0 Elementary Districts
2.1 Resident Students, Excluding Speech 14.1% 15.8% 14.9% 13.9% 13.3% 10.6%
2.2 Attending Students, Exlcuding Speech 14.1% 14.6% 14.1% 14.3% 13.8% 10.0%
2.3 Resident Students, Speech Only 3.1% 3.2% 3.0% 3.1% 3.2% 4.4%
2.4 Attending Students, Speech Only 3.0% 3.2% 2.9% 3.0% 3.1% 4.1%
3.0 Secondary Districts
3.1 Resident Students, Excluding Speech 16.1% 21.0% 17.2% 15.0% 15.2% -
3.2 Attending Students, Exlcuding Speech 15.1% 19.3% 16.1% 13.9% 15.0% -
3.3 Resident Students, Speech Only 0.1% 0.1% 0.1% 0.2% 0.1% -
3.4 Attending Students, Speech Only 0.1% 0.1% 0.1% 0.1% 0.0% -
4.0 K-12 Districts
4.1 Resident Students, Excluding Speech 14.7% 15.4% 15.1% 14.4% 13.2% 17.9%
4.2 Attending Students, Exlcuding Speech 13.5% 13.2% 14.4% 13.7% 12.9% 18.2%
4.3 Resident Students, Speech Only 1.6% 1.1% 1.7% 2.2% 1.7% 1.9%
4.4 Attending Students, Speech Only 1.6% 1.1% 1.7% 2.1% 1.7% 0.0%
5.0 Other Districts (Vocational, etc.)
5.1 Resident Students, Excluding Speech 20.3% - - - - -
5.2 Attending Students, Exlcuding Speech 13.3% - - - - -
5.3 Resident Students, Speech Only 0.0% - - - - -
5.4 Attending Students, Speech Only 0.0% - - - - -
6.0 Resident-Only Districts
6.1 Resident Students, Excluding Speech 7.3% - - - - -
6.2 Resident Students, Speech Only 1.5% - - - - -
Statewide
District Factor Grouping
TABLE V-5B
PROPORTION OF STUDENTS IN SPECIAL EDUCATION PROGRAMS IN NEW JERSEY IN 2009-10 BY DISTRICT TYPE AND DISTRICT FACTOR GROUP

29
Auditorily
Impaired Autistic Cog - Mild Cog- Mod Cog-Sev
Communication
Impaired
Emotionally
Disturbed
Multiply
Disabled
1.0 Statewide 0.1% 0.7% 0.3% 0.1% 0.0% 1.2% 0.6% 1.4%
2.0 Elementary Districts 0.1% 0.9% 0.2% 0.0% 0.0% 1.6% 0.4% 1.4%
3.0 Secondary Districts 0.1% 0.4% 0.2% 0.0% 0.0% 0.6% 0.8% 1.6%
4.0 K-12 Districts 0.1% 0.7% 0.3% 0.1% 0.1% 1.2% 0.6% 1.4%
5.0 Other Districts (Vocational, etc.) 0.1% 0.1% 0.5% 0.1% 0.0% 0.6% 0.5% 1.5%
Deaf-Blind
Orthopedically
Impaired
Other
Health Preschool
Specific
Learning TBI
Visually
Impaired
1.0 Statewide 0.0% 0.3% 2.0% 0.7% 5.7% 0.1% 0.0%
2.0 Elementary Districts 0.0% 0.1% 2.3% 1.2% 5.2% 0.1% 0.0%
3.0 Secondary Districts 0.0% 0.0% 2.3% 0.0% 8.3% 0.1% 0.0%
4.0 K-12 Districts 0.0% 0.4% 1.9% 0.7% 5.5% 0.2% 0.0%
5.0 Other Districts (Vocational, etc.) 0.0% 0.0% 1.6% 0.0% 8.9% 0.1% 0.0%
Disability
Disability
TABLE V-6A
PROPORTIONAL DISTRIBUTION OF ATTENDING STUDENTS BY DISABILITY IN NEW JERSEY IN 2008-09 BY DISTRICT TYPE

30
Auditorily
Impaired Autistic Cog - Mild Cog- Mod Cog-Sev
Communication
Impaired
Emotionally
Disturbed
Multiply
Disabled
1.0 Statewide 0.1% 0.8% 0.3% 0.1% 0.0% 1.4% 0.6% 1.4%
2.0 Elementary Districts 0.1% 1.0% 0.2% 0.1% 0.0% 1.7% 0.5% 1.4%
3.0 Secondary Districts 0.1% 0.4% 0.2% 0.0% 0.0% 0.8% 0.9% 1.6%
4.0 K-12 Districts 0.1% 0.8% 0.3% 0.1% 0.0% 1.4% 0.6% 1.3%
5.0 Other Districts (Vocational, etc.) 0.1% 0.2% 0.4% 0.1% 0.0% 0.7% 0.4% 1.3%
Deaf-Blind
Orthopedically
Impaired
Other
Health Preschool
Specific
Learning TBI
Visually
Impaired
1.0 Statewide 0.0% 0.0% 2.3% 0.8% 5.9% 0.1% 0.0%
2.0 Elementary Districts 0.0% 0.1% 2.5% 1.3% 5.2% 0.0% 0.0%
3.0 Secondary Districts 0.0% 0.0% 2.6% 0.0% 8.4% 0.1% 0.0%
4.0 K-12 Districts 0.0% 0.0% 2.2% 0.8% 5.8% 0.1% 0.0%
5.0 Other Districts (Vocational, etc.) 0.0% 0.0% 1.6% 0.0% 8.5% 0.0% 0.0%
Disability
Disability
TABLE V-6B
PROPORTIONAL DISTRIBUTION OF ATTENDING STUDENTS BY DISABILITY IN NEW JERSEY IN 2009-10 BY DISTRICT TYPE

31
Auditorily
Impaired Autistic Cog - Mild Cog- Mod Cog-Sev
Communication
Impaired
Emotionally
Disturbed
Multiply
Disabled
1.0 Statewide 0.1% 0.7% 0.3% 0.1% 0.0% 1.2% 0.6% 1.4%
2.0 District Factor Groups A-B 0.1% 0.4% 0.6% 0.2% 0.1% 1.1% 0.7% 1.7%
3.0 District Factor Groups C-D and D-E 0.1% 0.7% 0.2% 0.1% 0.0% 1.4% 0.6% 1.7%
4.0 District Factor Groups F-G and G-H 0.1% 0.8% 0.2% 0.0% 0.0% 1.3% 0.6% 1.3%
5.0 District Factor Groups I-J 0.1% 0.9% 0.1% 0.1% 0.0% 1.3% 0.4% 1.1%
6.0 District Factor Groups None 0.1% 0.2% 0.4% 0.1% 0.0% 0.7% 0.5% 1.7%
Deaf-Blind
Orthopedically
Impaired
Other
Health Preschool
Specific
Learning TBI
Visually
Impaired
1.0 Statewide 0.0% 0.3% 2.0% 0.7% 5.7% 0.1% 0.0%
2.0 District Factor Groups A and B 0.0% 0.8% 1.4% 0.5% 5.4% 0.3% 0.0%
3.0 District Factor Groups C-D and D-E 0.0% 0.1% 2.1% 0.8% 6.2% 0.1% 0.0%
4.0 District Factor Groups F-G and G-H 0.1% 0.1% 2.2% 0.9% 5.9% 0.1% 0.0%
5.0 District Factor Groups I and J 0.0% 0.1% 2.6% 0.8% 5.3% 0.1% 0.0%
6.0 District Factor Groups None 0.0% 0.0% 1.6% 0.2% 8.1% 0.1% 0.0%
Disability
Disability
TABLE V-7A
PROPORTIONAL DISTRIBUTION OF ATTENDING STUDENTS BY DISABILITY IN NEW JERSEY IN 2008-09 BY DISTRICT FACTOR GROUP
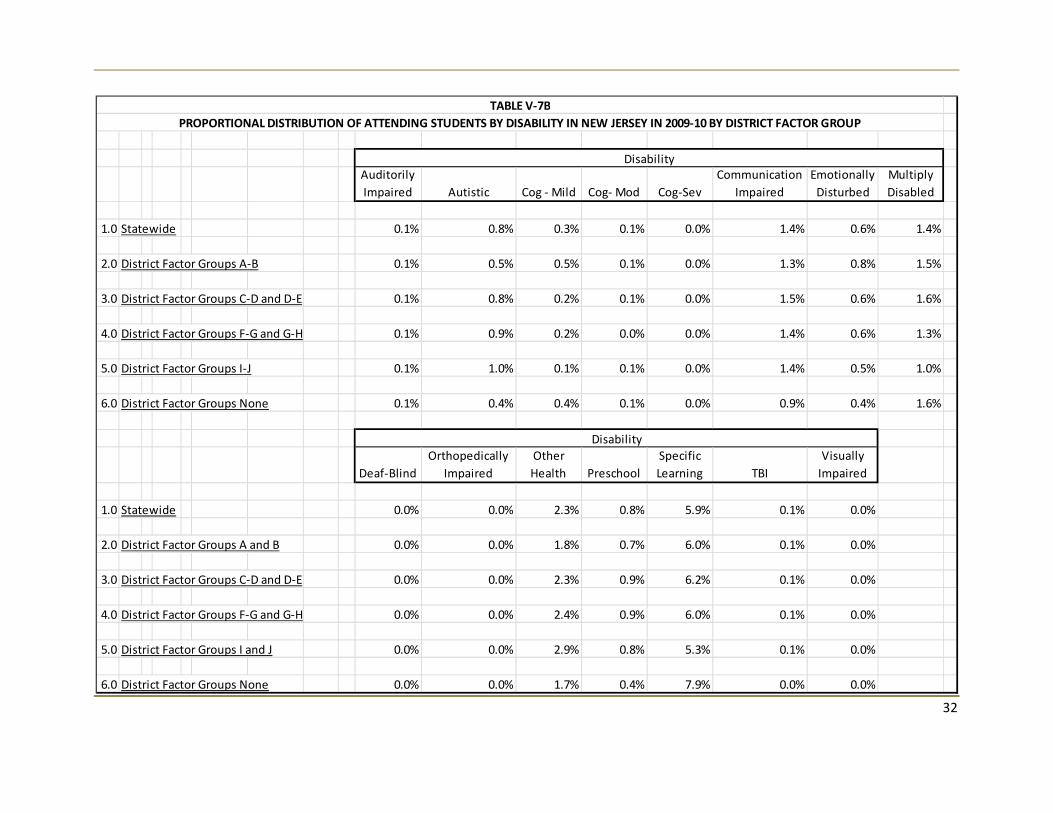
32
Auditorily
Impaired Autistic Cog - Mild Cog- Mod Cog-Sev
Communication
Impaired
Emotionally
Disturbed
Multiply
Disabled
1.0 Statewide 0.1% 0.8% 0.3% 0.1% 0.0% 1.4% 0.6% 1.4%
2.0 District Factor Groups A-B 0.1% 0.5% 0.5% 0.1% 0.0% 1.3% 0.8% 1.5%
3.0 District Factor Groups C-D and D-E 0.1% 0.8% 0.2% 0.1% 0.0% 1.5% 0.6% 1.6%
4.0 District Factor Groups F-G and G-H 0.1% 0.9% 0.2% 0.0% 0.0% 1.4% 0.6% 1.3%
5.0 District Factor Groups I-J 0.1% 1.0% 0.1% 0.1% 0.0% 1.4% 0.5% 1.0%
6.0 District Factor Groups None 0.1% 0.4% 0.4% 0.1% 0.0% 0.9% 0.4% 1.6%
Deaf-Blind
Orthopedically
Impaired
Other
Health Preschool
Specific
Learning TBI
Visually
Impaired
1.0 Statewide 0.0% 0.0% 2.3% 0.8% 5.9% 0.1% 0.0%
2.0 District Factor Groups A and B 0.0% 0.0% 1.8% 0.7% 6.0% 0.1% 0.0%
3.0 District Factor Groups C-D and D-E 0.0% 0.0% 2.3% 0.9% 6.2% 0.1% 0.0%
4.0 District Factor Groups F-G and G-H 0.0% 0.0% 2.4% 0.9% 6.0% 0.1% 0.0%
5.0 District Factor Groups I and J 0.0% 0.0% 2.9% 0.8% 5.3% 0.1% 0.0%
6.0 District Factor Groups None 0.0% 0.0% 1.7% 0.4% 7.9% 0.0% 0.0%
Disability
Disability
TABLE V-7B
PROPORTIONAL DISTRIBUTION OF ATTENDING STUDENTS BY DISABILITY IN NEW JERSEY IN 2009-10 BY DISTRICT FACTOR GROUP

33
Over 80%
in
Classroom
40% to 80%
in
Classroom
Less than
40% in
Classroom
Public
Separate Private Day
Private
Residential
Public
Residential Home
Correctional
Facility
1.0 Statewide 44.4% 27.6% 15.0% 1.3% 4.0% 0.1% 0.0% 0.3% 0.0%
2.0 Elementary Districts 45.2% 27.7% 9.6% 0.7% 5.5% 0.2% 0.0% 0.1% 0.1%
3.0 Secondary Districts 55.5% 27.4% 12.8% 1.2% 2.0% 0.1% 0.0% 0.6% 0.0%
4.0 K-12 Districts 43.2% 27.3% 16.5% 1.4% 3.9% 0.1% 0.0% 0.3% 0.0%
5.0 Other Districts (Vocational, etc.) 39.1% 38.8% 18.4% 3.2% 0.4% 0.0% 0.0% 0.1% 0.0%
Type of Service Delivery
TABLE V-8A
PROPORTIONAL DISTRIBUTION OF ATTENDING STUDENTS BY TYPE OF SERVICE DELIVERY IN NEW JERSEY IN 2008-09 BY DISTRICT TYPE

34
Over 80%
in
Classroom
40% to 80%
in
Classroom
Less than
40% in
Classroom
Public
Separate Private Day
Private
Residential
Public
Residential Home
Correctional
Facility
1.0 Statewide 45.2% 26.9% 14.9% 0.9% 4.0% 0.1% 0.0% 0.3% 0.0%
2.0 Elementary Districts 45.4% 26.8% 9.4% 0.6% 6.2% 0.2% 0.0% 0.1% 0.0%
3.0 Secondary Districts 57.9% 27.7% 10.3% 0.8% 2.0% 0.1% 0.1% 0.6% 0.0%
4.0 K-12 Districts 44.0% 26.6% 16.8% 0.9% 3.7% 0.1% 0.0% 0.3% 0.0%
5.0 Other Districts (Vocational, etc.) 43.2% 38.4% 15.2% 2.8% 0.4% 0.0% 0.0% 0.1% 0.0%
Type of Service Delivery
PROPORTIONAL DISTRIBUTION OF ATTENDING STUDENTS BY TYPE OF SERVICE DELIVERY IN NEW JERSEY IN 2009-10 BY DISTRICT TYPE
TABLE V-8B

35
Over 80%
in
Classroom
40% to 80%
in
Classroom
Less than
40% in
Classroom
Public
Separate Private Day
Private
Residential
Public
Residential Home
Correctional
Facility
1.0 Statewide 44.4% 27.6% 15.0% 1.3% 4.0% 0.1% 0.0% 0.3% 0.0%
2.0 District Factor Groups A-B 39.6% 25.6% 23.3% 1.9% 3.1% 0.1% 0.0% 0.5% 0.0%
3.0 District Factor Groups C-D and D-E 41.7% 28.9% 16.6% 1.4% 3.2% 0.1% 0.0% 0.3% 0.0%
4.0 District Factor Groups F-G and G-H 46.3% 28.6% 11.2% 0.7% 4.7% 0.1% 0.0% 0.3% 0.1%
5.0 District Factor Groups I-J 51.4% 26.7% 7.1% 0.8% 5.4% 0.2% 0.0% 0.2% 0.0%
6.0 District Factor Groups None 38.4% 35.6% 20.0% 2.7% 1.2% 0.0% 0.0% 0.2% 0.0%
Type of Service Delivery
PROPORTIONAL DISTRIBUTION OF ATTENDING STUDENTS BY TYPE OF SERVICE DELIVERY IN NEW JERSEY IN 2008-09 BY DISTRICT FACTOR GROUP
TABLE V-9A

36
Over 80%
in
Classroom
40% to 80%
in
Classroom
Less than
40% in
Classroom
Public
Separate Private Day
Private
Residential
Public
Residential Home
Correctional
Facility
1.0 Statewide 45.2% 26.9% 14.9% 0.9% 4.0% 0.1% 0.0% 0.3% 0.0%
2.0 District Factor Groups A-B 38.3% 25.5% 24.9% 1.3% 2.4% 0.0% 0.0% 0.3% 0.0%
3.0 District Factor Groups C-D and D-E 43.5% 28.0% 15.8% 0.9% 3.2% 0.1% 0.0% 0.3% 0.0%
4.0 District Factor Groups F-G and G-H 47.7% 27.8% 10.6% 0.5% 5.1% 0.1% 0.0% 0.2% 0.0%
5.0 District Factor Groups I-J 52.8% 25.5% 7.2% 0.7% 5.5% 0.2% 0.0% 0.2% 0.0%
6.0 District Factor Groups None 40.1% 33.2% 17.2% 2.2% 3.2% 0.0% 0.0% 0.1% 0.0%
Type of Service Delivery
PROPORTIONAL DISTRIBUTION OF ATTENDING STUDENTS BY TYPE OF SERVICE DELIVERY IN NEW JERSEY IN 2009-10 BY DISTRICT FACTOR GROUP
TABLE V-9B
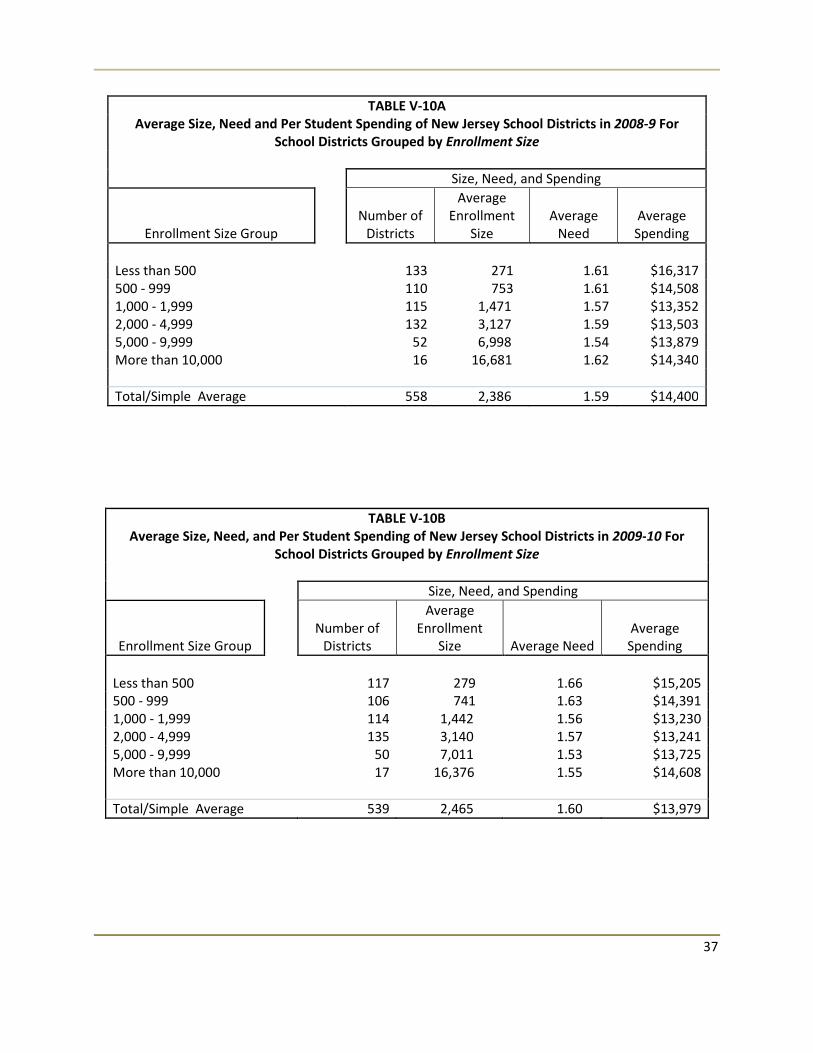
37
TABLE V-10A
Average Size, Need and Per Student Spending of New Jersey School Districts in 2008-9 For
School Districts Grouped by Enrollment Size
Size, Need, and Spending
Enrollment Size Group
Number of
Districts
Average
Enrollment
Size
Average
Need
Average
Spending
Less than 500
133 271 1.61 $16,317
500 - 999
110 753 1.61 $14,508
1,000 - 1,999
115 1,471 1.57 $13,352
2,000 - 4,999
132 3,127 1.59 $13,503
5,000 - 9,999
52 6,998 1.54 $13,879
More than 10,000
16 16,681 1.62 $14,340
Total/Simple Average 558 2,386 1.59 $14,400
TABLE V-10B
Average Size, Need, and Per Student Spending of New Jersey School Districts in 2009-10 For
School Districts Grouped by Enrollment Size
Size, Need, and Spending
Enrollment Size Group
Number of
Districts
Average
Enrollment
Size Average Need
Average
Spending
Less than 500
117 279 1.66 $15,205
500 - 999
106 741 1.63 $14,391
1,000 - 1,999
114 1,442 1.56 $13,230
2,000 - 4,999
135 3,140 1.57 $13,241
5,000 - 9,999
50 7,011 1.53 $13,725
More than 10,000
17 16,376 1.55 $14,608
Total/Simple Average 539 2,465 1.60 $13,979
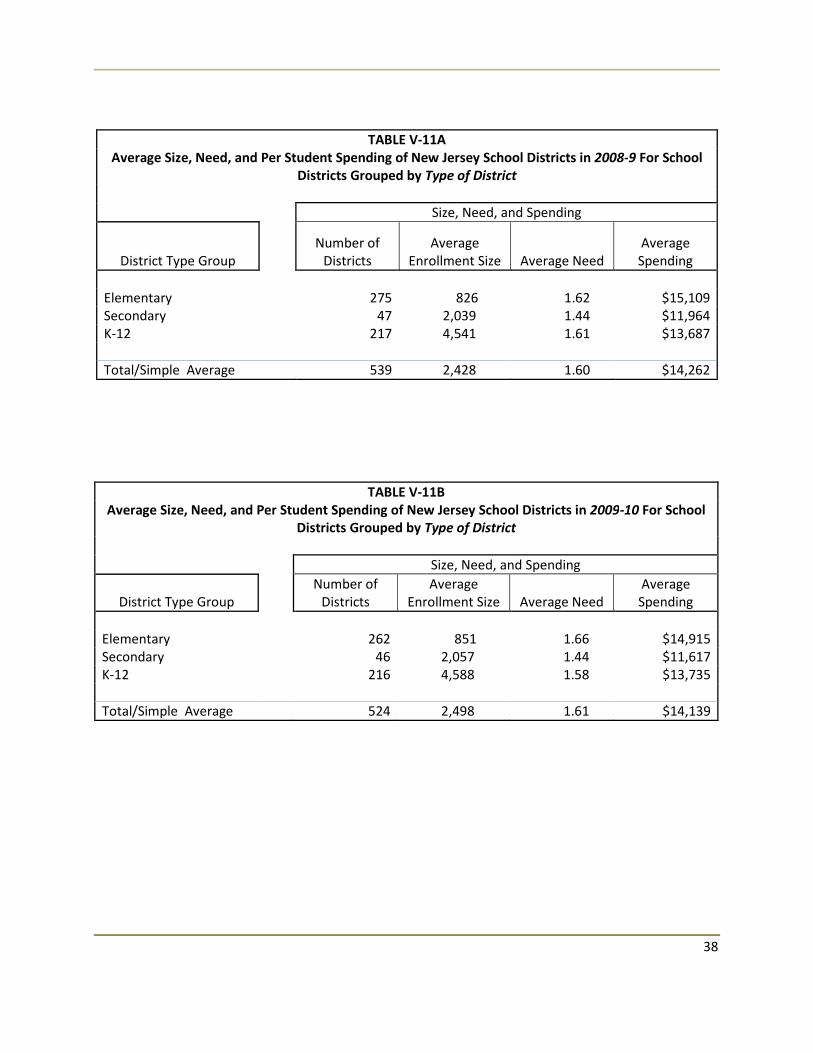
38
TABLE V-11A
Average Size, Need, and Per Student Spending of New Jersey School Districts in 2008-9 For School
Districts Grouped by Type of District
Size, Need, and Spending
District Type Group
Number of
Districts
Average
Enrollment Size Average Need
Average
Spending
Elementary
275 826 1.62 $15,109
Secondary
47 2,039 1.44 $11,964
K-12
217 4,541 1.61 $13,687
Total/Simple Average 539 2,428 1.60 $14,262
TABLE V-11B
Average Size, Need, and Per Student Spending of New Jersey School Districts in 2009-10 For School
Districts Grouped by Type of District
Size, Need, and Spending
District Type Group
Number of
Districts
Average
Enrollment Size Average Need
Average
Spending
Elementary
262 851 1.66 $14,915
Secondary
46 2,057 1.44 $11,617
K-12
216 4,588 1.58 $13,735
Total/Simple Average 524 2,498 1.61 $14,139

39
TABLE V-12A
Average Size, Need, and Per Student Spending of New Jersey School Districts in 2008-9 For School
Districts Grouped by District Factor Group (DFG)
Size, Need, and Spending
District Factor Group
(DFG)
Number of
Districts
Average
Enrollment Size Average Need
Average
Spending
A, B
101 3,615 1.59 $13,751
C-D, D-E
147 2,014 1.60 $13,889
F-G, G-H
162 2,186 1.61 $14,373
I, J
126 2,283 1.60 $14,878
Total/Simple Average 536 2,431 1.60 $14,242
TABLE V-12B
Average Size, Need, and Per Student Spending of New Jersey School Districts in 2009-10 For School
Districts Grouped by District Factor Group (DFG)
Size, Need, and Spending
District Factor Group
(DFG)
Number of
Districts
Average
Enrollment Size Average Need
Average
Spending
A, B
100 3,685 1.62 $13,884
C-D, D-E
142 2,050 1.61 $13,544
F-G, G-H
156 2,289 1.60 $14,314
I, J
123 2,329 1.61 $14,767
Total/Simple Average 521 2,501 1.61 $14,128

40
VI. Interviews
An important part of the study was interviewing district personnel regarding the change in funding
structure. Two rounds of interviews were undertaken for the study. The first round of interviews
involved district special education personnel and focused on understanding the impacts of the funding
change on district practices and finances. The second round of interviews involved both district special
education personnel and district finance personnel; their focus included the areas discussed in the first
round of interviews as well as an understanding of the actual data APA had for each district.
Prior to presenting the results of the interviews, it is important to note the climate that they were
conducted in. The interviewees were identified both by the DOE and through APA data analysis.
Regardless of how participant districts were identified, it proved to be difficult to get districts to
participate in the interviews. Underlying this problem seemed to be the perceived relationship between
the districts and the state. Though many districts simply did not return calls and emails requesting
interviews, those that did often mentioned that the consistent budget cuts have created some animosity
about participating in state run studies. They also mentioned that they found it difficult to find the time
to participate in outside studies. At least one district mentioned participation in a court case against the
state as reason not to participate. Ultimately, we were able to get a third of all districts we contacted to
participate.
The following figure illustrates the number of districts that we contacted and the number that ultimately
participated:
# of Districts Contacted # of Districts that Participated
First Round 20 7
Second Round 16 6
Total 36 13
First Round of Interviews
For the first round of interviews APA asked the DOE for a list of districts to interview; a list of twenty
districts with district personnel to contact was provided of which seven districts participated. An
interview protocol was created, which is shown in Appendix A. The interviews focused on few key areas
including:
• Changes from the old system to the new system
• High Cost, Low Incidence students
• Best practices

41
District special education representatives were first asked about their understanding of the change from
the old tier funding system to the new census funding system. It quickly became apparent that most of
the interviewees had some understanding that funding had changed, but very few had full
understanding of the specifics of the change and only one representative could articulate the change
without prompting. Primarily, interviewees spoke about receiving reduced funding and pressure within
their district to reduce costs. However, it unclear whether the changes in funding experienced was
related to the change in the funding system or general state budget reductions.
The interviewees generally did not agree with the underlying assumption of the census-based approach
that all districts have the same percentage of special education students. The majority of
representatives also disagreed with the underlying premise that the distribution of need is the same
across districts. Many interviewees described specific special circumstances in their district or in
districts where they used to work that resulted in the district either having a higher percentage of
special education students or having a higher number of high need students. One example is a district
located adjacent to a military base. The interviewees mentioned that the military sends families with
high needs children to that base and thus the district gets a large number of high needs students.
Interviewees felt that districts often developed reputations for either generally serving special education
students well or serving a specific category of special education students well. When this happens,
families hear about it and will specifically pick the district to move into in order to access the special
education services. This can create a higher concentration of high needs students in some districts.
Interviewees also mentioned that in some circumstances districts with higher levels of poverty can end
up having higher percentages of students being served in special education.
No district had changed how it provided special education services due to the change in the funding
system. All interviewees mentioned that the new funding system had not changed how many students
were identified, the process for identifying students, the types of services students received, or where
the students are served. It was repeatedly pointed out that the identification of students and the
identification of the appropriate services for students is a complex process that operates independent of
financial resource needs. Further, representatives noted that the level of service required for students
was mandated by law and student IEPs so it was not something they could change once students were
identified. There is a process in place in all districts and the teams making the special education
decisions are not connected to the funding systems put in place by the state.
All representatives that had been in their district more than a year discussed the recent pressure in their
districts to bring out-of-district placement students back to be served in district. Most felt that bringing
the students back in had saved the districts money and allowed them to have a better understanding of
how well they were serving these students. A number of districts had started new programs in district
to serve students who would have formerly been sent out of the district. Overall, representatives noted
that this was a positive development in their districts.
As mentioned previously, the majority of special education staff members interviewed in the first set of
interviews were able to describe changes in funding but at the same time were unable to describe the

42
structural change in the funding system. In fact, APA believes that much of the information about the
fiscal impacts that we received in the first round of interviews was actually related to the recent budget
cuts not the structural change in the funding system. The difficulty in separating the two became very
apparent during the second round of interviews when finance personnel were included in the
discussions. Still, round one interviewees were concerned that districts with high percentages of special
education students or high levels of high need students would be underfunded by the new system.
APA also asked the district personnel to identify the disability categories that are often high cost for
districts. Many of the interviewees mentioned that it is hard to identify specific categories since not all
students in a specific category are served the same way. Students can range in need within a category.
With this caveat in mind, the categories of autism, emotional disturbance and multiple disabilities came
up in some combination in every interview as generally high cost categories. Of particular note, every
representative discussed autism as a growing category and one of the disability groups that districts are
currently building more in house programs to serve.
The districts talked about moving as many students back into the home districts as one of the practices
being used along with additional mainstreaming of students. Representatives spoke about serving
students in the least restrictive and most inclusive environment possible as what was best practice for
students and their highest priority. As was mentioned above, bringing students back into the district can
sometimes save money and allows the districts better control over the services for the students. Some
referred to getting more “bang for their buck” when doing so. There are still students that need to be
sent out of district but limiting these placements has become a priority for many, if not most, districts
due to the high cost of tuition.
Second Round of Interviews
For the second round of interviews, APA planned to visit districts across New Jersey to interview both
special education personnel and finance personnel in person. An interview protocol was created, which
is shown in Appendix B. The interviews were designed to focus on some of the same areas as the first
round of interviewees along with a focus on the data APA had been analyzing which included:
• Changes from the old system to the new system
• High Cost, Low Incidence students
• Data on student counts
• Data on student spending
APA used the statewide district level database to identify school districts to interview. We selected
eleven districts from different parts of the state, districts with different DFG categories (as an indicator
of differences in wealth), districts with different grade configurations, and districts with different
percentages of special education students. Once we had identified the districts, the DOE wrote letters
to each district encouraging them to participate. The turnaround time for setting up the in person
interviews was tight and APA struggled to get district participation. The reasons for the lack of

43
participation varied. Some districts were willing to participate but could not do it during the times APA
would be in their area. Other districts did not feel comfortable participating. They either had conflicts,
such as participation in a lawsuit against the state, or simply did not feel it would be a good use of
district personnel’s time. Other districts simply never responded to repeated phone calls and emails
requesting an interview.
Faced with a very limited number of confirmed participants, APA canceled the onsite visits and turned to
the DOE to create a new list of districts that would be willing to participate in a webinar-based
interview. The three districts that had either scheduled an onsite visit or had shown willingness to
participate previously were included.
The second round of interviews produced similar information from the first round of interviews on a
number of key topics including:
• The belief that the new funding system’s underlying philosophy does not work for every district.
The funding system assumes the same percentage and general levels of student need for every
district, but every representative we spoke with explained that there was significant variation in
the proportion of special education students served in districts as well as variation in the
categories of students served. Many districts serve either higher than average total percentages
of special education students or serve pockets of very high need students.
• All interviewees reiterated that there is a general disconnect between those individuals making
special education identification and service decisions and the state funding system. Those
individuals responsible for making these decisions about students do not even necessarily know
or understand the funding system. This would make it difficult to believe changes in the funding
system would change the behavior of those staff. One person referred to the “myth” of Child
Study teams being influenced by the funding. The person reiterated that the teams do not
necessarily understand the system or know about the changes.
• The number of students identified, the types of students identified or the services provided to
students has not changed based on the new funding system. It was repeated in each of the
interviews that the identification of students and the determination of the types of services the
students need are not tied to the state funding system. These decisions are made and then
funding has to be found to pay for those decisions.
• Interviewees continued to mention the push to bring students back from out of district
placement. They mentioned that it not only often leads to a cost savings for the districts but
frequently is better for the student. Districts have created programs in house to serve students
who used to be sent to out of district placements.
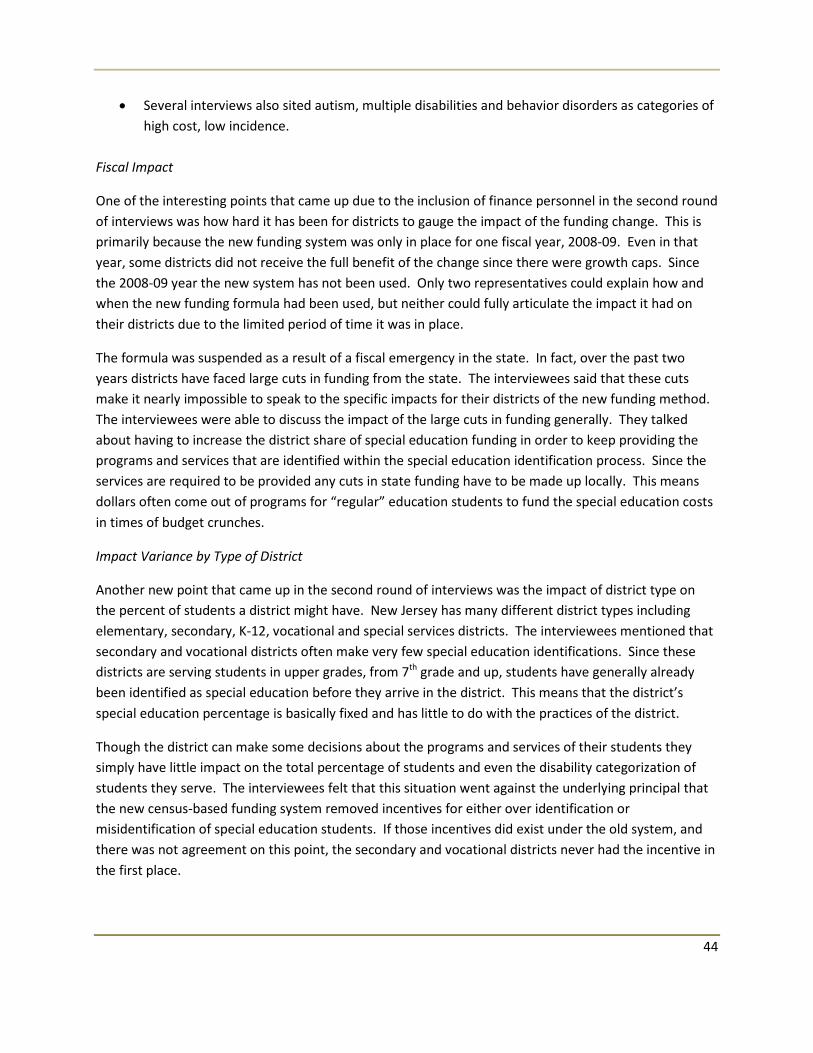
44
• Several interviews also sited autism, multiple disabilities and behavior disorders as categories of
high cost, low incidence.
Fiscal Impact
One of the interesting points that came up due to the inclusion of finance personnel in the second round
of interviews was how hard it has been for districts to gauge the impact of the funding change. This is
primarily because the new funding system was only in place for one fiscal year, 2008-09. Even in that
year, some districts did not receive the full benefit of the change since there were growth caps. Since
the 2008-09 year the new system has not been used. Only two representatives could explain how and
when the new funding formula had been used, but neither could fully articulate the impact it had on
their districts due to the limited period of time it was in place.
The formula was suspended as a result of a fiscal emergency in the state. In fact, over the past two
years districts have faced large cuts in funding from the state. The interviewees said that these cuts
make it nearly impossible to speak to the specific impacts for their districts of the new funding method.
The interviewees were able to discuss the impact of the large cuts in funding generally. They talked
about having to increase the district share of special education funding in order to keep providing the
programs and services that are identified within the special education identification process. Since the
services are required to be provided any cuts in state funding have to be made up locally. This means
dollars often come out of programs for “regular” education students to fund the special education costs
in times of budget crunches.
Impact Variance by Type of District
Another new point that came up in the second round of interviews was the impact of district type on
the percent of students a district might have. New Jersey has many different district types including
elementary, secondary, K-12, vocational and special services districts. The interviewees mentioned that
secondary and vocational districts often make very few special education identifications. Since these
districts are serving students in upper grades, from 7th grade and up, students have generally already
been identified as special education before they arrive in the district. This means that the district’s
special education percentage is basically fixed and has little to do with the practices of the district.
Though the district can make some decisions about the programs and services of their students they
simply have little impact on the total percentage of students and even the disability categorization of
students they serve. The interviewees felt that this situation went against the underlying principal that
the new census-based funding system removed incentives for either over identification or
misidentification of special education students. If those incentives did exist under the old system, and
there was not agreement on this point, the secondary and vocational districts never had the incentive in
the first place.
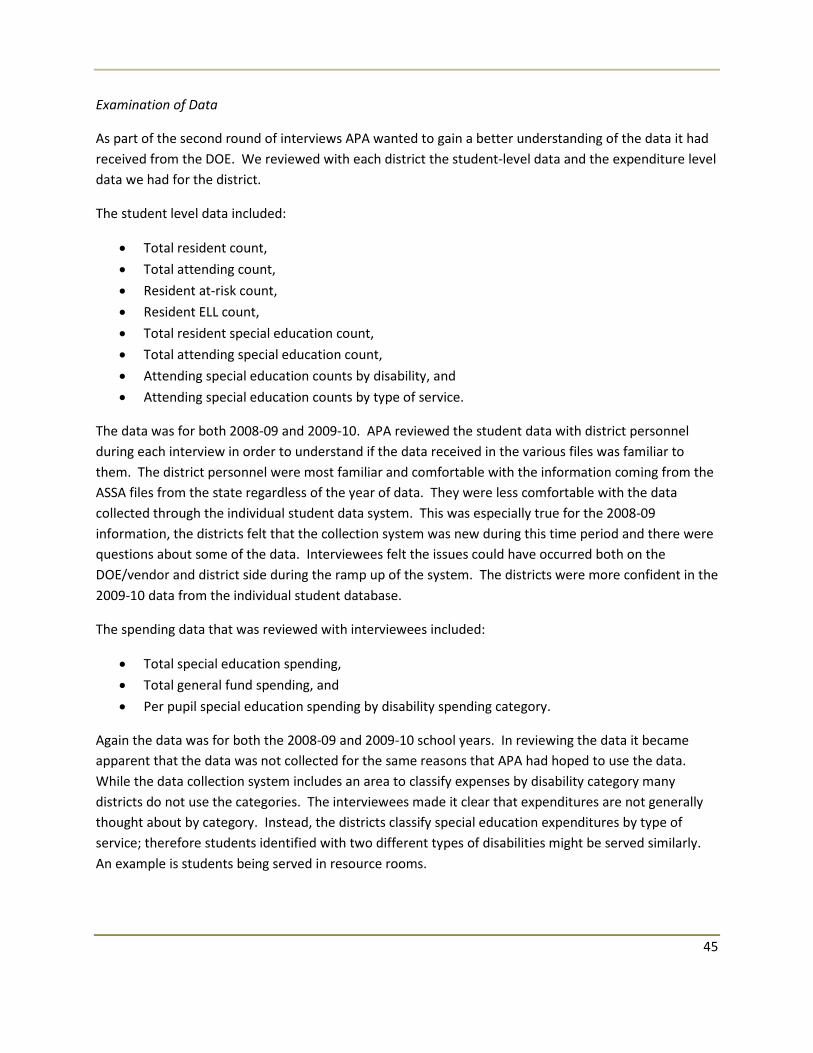
45
Examination of Data
As part of the second round of interviews APA wanted to gain a better understanding of the data it had
received from the DOE. We reviewed with each district the student-level data and the expenditure level
data we had for the district.
The student level data included:
• Total resident count,
• Total attending count,
• Resident at-risk count,
• Resident ELL count,
• Total resident special education count,
• Total attending special education count,
• Attending special education counts by disability, and
• Attending special education counts by type of service.
The data was for both 2008-09 and 2009-10. APA reviewed the student data with district personnel
during each interview in order to understand if the data received in the various files was familiar to
them. The district personnel were most familiar and comfortable with the information coming from the
ASSA files from the state regardless of the year of data. They were less comfortable with the data
collected through the individual student data system. This was especially true for the 2008-09
information, the districts felt that the collection system was new during this time period and there were
questions about some of the data. Interviewees felt the issues could have occurred both on the
DOE/vendor and district side during the ramp up of the system. The districts were more confident in the
2009-10 data from the individual student database.
The spending data that was reviewed with interviewees included:
• Total special education spending,
• Total general fund spending, and
• Per pupil special education spending by disability spending category.
Again the data was for both the 2008-09 and 2009-10 school years. In reviewing the data it became
apparent that the data was not collected for the same reasons that APA had hoped to use the data.
While the data collection system includes an area to classify expenses by disability category many
districts do not use the categories. The interviewees made it clear that expenditures are not generally
thought about by category. Instead, the districts classify special education expenditures by type of
service; therefore students identified with two different types of disabilities might be served similarly.
An example is students being served in resource rooms.

46
Conclusions
From the interviews several key points were mentioned by the majority of representatives we spoke
with:
• Every interviewee did not agree with the underlying assumption of the census-based approach
that all districts should/do have the same percentage of special education students and that the
levels of need are similar across districts.
• Further, no representatives believed the change in the special education funding has had an
impact on how districts identify special education students or on the types of services the
districts provide to the special education students. Interviewees did not believe that the staff
members responsible for making student identifications and programming decisions had
changed their behavior due to the funding change or that they even knew about changes to
funding. They believe there are strict rules and regulations regarding special education
identification and services, and districts adhere to them.
• Interviewees believed that when state funding decreases districts must use local funds to
continue to pay for the services that special education students require. These services cannot
simply be reduced due to a decrease in funding.
• Interviewees suggested that the limited time that the new funding system was implemented
makes it very difficult to fully understand its impact on districts and if it is working well for
districts. Only two representatives were able to discuss the specifics of the funding change at
length. Generally, districts are more concerned and familiar with the recent budget cuts and
have not really thought about the impact of the new system.

47
VI. Conclusion
This chapter will: (1) review the scope and goal of the work; (2) discuss the complicating factors that
arose during the study; (3) Identify some key findings from the analyses; and (4) layout the next steps
New Jersey needs to undertake.
Scope and Goal
As was mentioned in the introduction of the report, the scope of the work was based on a legislative
mandate to the Commissioner of Education to undertake “an independent study of the special
education census funding methodology to determine if adjustments in the special education funding
formulas are needed in future years to address the variations in incidence of students with severe
disabilities requiring high cost programs and to make recommendations for any such adjustments.”4
APA’s goal was to determine if the new system created issues for districts serving high numbers of low
incidence, high cost students and, if so, create recommendations to address these issues.
Complicating Issues
APA’s study included three types of research: (1) we reviewed relevant literature and other states’
procedures; (2) we undertook a variety of data analyses; and (3) we conducted selected interviews with
district personnel. While undertaking the data analyses and the interviews, a number of problems
arose. These issues created complications for the study that ranged from small nuisances to large
hurdles that made it difficult to answer the underlying question of the study.
APA’s data collection focused on two types of information: demographic data and expenditure data. We
worked closely with the DOE to identify the data sources and to quickly collect the data. As data was
gathered, it became apparent that much of the data had not been collected in a manner that allowed us
to complete the study in the manner we intended. Data can be collected for many different reasons and
before data collection systems are set up, the uses for the data are often defined; we discovered that
while lots of information was being collected, it was not relevant to the questions we were trying to
answer.
This was true of the data set that APA was using to analyze student level special education data. We had
planned to use the data to examine the distribution of special education students by disability category
and service type for both resident and attending students. The individual student data APA received
from the DOE did not include the residency information APA had hoped to use. This difference in
coding of residency did not allow us to compare the differences in types of disability categories and
types of service between resident and attending students. Therefore, our analyses could only focus on
information associated with attending students.
4 Page 3 of the “Special Education Funding” RFQ

48
The expenditure data APA received were incomplete and unreliable. In reviewing the data points
collected in the expenditure data collection with the DOE, we were excited to learn that expenditures
for a number of specific disability categories were being collected. Once we received the data, however,
it became clear that the districts were not reporting these disability category expenditures lines
consistently. As Table V-2 in the data analysis section shows, many districts reported no expenditures at
all into the categories and when expenditures were reported the per pupil amounts were inconsistent
and difficult to interpret.
During our interviews with districts, it became clear that district finance personnel did not think about
special education spending in relationship to the disabilities of students and, therefore, they did not
report such expenditures. Instead, the district finance personnel took the lead from the special
education staff members who focus on the types of services and programs students need, and
categorize expenditures based on the type of program or services students receive, not by disability
category. The expenditure data supported these statements; while the disability categories were used
infrequently, the resource room expenditure category was used consistently and had reasonable dollar
amounts associated with it.
Beyond challenges in data analysis, there were some additional complications that arose with the
interviews. The first complication was simply getting a large and diverse set of districts to participate.
Districts were reluctant to participate in either set of interviews. Second, the limited time frame
available to conduct the second set of interviews made it difficult to obtain a large number of
participants.
During the interviews, the largest obstacle to the study became apparent. Interviewees consistently
mentioned that though the special education funding system had changed, it was only fully
implemented for one year, after which large cuts had been made in funding. The lack of sustained
implementation, along with significant funding cuts, made it very hard for the districts to talk about the
impacts of the new system. Because of the way the new system was implemented, it also becomes
difficult over time to attribute any changes in how special education services are provided to the change
in the funding system. The districts have effectively said the new system has not really been
incorporated into any type of planning since it has not been fully implemented.
Findings
Even with the complicating factors mentioned earlier in the chapter, including the lack of sustained
implementation of the formula that masks the effects of it to both service providers and researchers,
APA is able to identify two key findings based on the literature review, the state program review, the
data analysis, and the interviews.
Our first finding is that there are clear differences in the percentages and types of students served in
different districts across the state. The census-based approach funds all districts similarly regardless of
district size, district type, or DFG grouping. The demographic and expenditure data analyses show

49
differences in the types of special education students being served and the amounts being spent when
district size, district type and DFG groupings are examined. Interviewees also pointed out that
significant differences in numbers of special education students served and their needs exist among the
state’s school districts.
The demographic data analysis, seen in Tables V-5A through V-9B, shows numerous inconsistencies
between types of districts and DFG groupings. Some district types serve higher percentages of students
and some district types serve more students in certain disability categories. Tables V-10A through V-12B
shows the differences in per pupil special education expenditures. District size, district type, and district
DFG group are related to the amount spent per pupil. For example, elementary districts spent more
than either K-12 or secondary districts in both years.
The second finding is that certain special education categories have higher costs than other categories
and that the distribution of students by special education category is not consistent across all districts in
the state. Interviewees told us that certain special education students are very costly to serve. The
demographic data analysis showed that there is real variation by district type and DFG group in the
percentage of disabilities in districts and in the percent of students being served by type of service
provided, which vary in cost. New Jersey’s previous special education funding approach tried to take the
differences in cost of serving students into account when determining special education funding levels.
The new system does not do this.
The literature review suggested that that there are certain special education disabilities that have higher
per student costs. Interviewees also identified certain high cost disability categories. The interviewees
found it more important to talk about the fact that certain students in certain types of programs were
higher cost and that not all students in specific categories had similar costs. Our state program review
also shows that three of the four states examined make some adjustment for higher cost students. New
Jersey only makes an adjustment once the costs reach the extraordinary aid thresholds.
APA drew two tentative conclusions from the existing data: (1) New Jersey might need to consider
funding special education based on the actual enrollment of special education students in districts and
(2) the state might need to consider some differentiation of funding for higher cost students before the
extraordinary aid threshold is reached. Since the existing data is insufficient to suggest moving forward
on these tentative conclusions we suggest New Jersey take the steps listed below. These steps will
allow the state low to gain an understanding of the specific changes that need to be made to the
system.
Next Steps
In order to move forward with any changes to the system New Jersey must fully understand the impacts
of the new funding system. To do this the state must: (1) fully implement the new special education
funding system; (2) collect data in a manner that allows for analysis of both where special education
students are being funding/served and the costs of serving different types of special education students;

50
and (3) undertake an analysis of special education enrollment patterns and costs associated with
students across district sizes and types.
The state’s implementation of the new special education funding system was derailed after only one
year. Even within the first year of “full” implementation, districts whose potential increase in funding
exceeded a certain amount had their increases capped. This means that the new system has never been
fully implemented for all districts. The lack of implementation has hindered all stakeholders
understanding of the system. Some districts that have always relied heavily on the local dollars have
continued to do so, while those districts without the large local resources struggle to back-fill the loss of
state dollars. This difference in available dollars while the system is not being implemented makes other
information, specifically what is being spent on students, suspect. Districts with resources might be
spending what is truly needed to serve students while expenditure data for those without these
resources might not reflect all the resources the district would like to spend to serve the students if
dollars were available. A fully implemented system will allow for better comparisons of expenditure
data in the future.
As we said earlier in the report, data collection systems are often designed in consideration of the type
of analysis one wants to do after collecting the data. APA was able to acquire a lot of data around
special education, both student information and expenditure information. Unfortunately, the data was
not readily available in a way that lent itself to APA’s analysis. Future data collections need to allow for
this data to be readily available for this type of analysis of the special education funding system. This
would be accomplished by ensuring that information is available for each special education student by
the district they would be funded in if special education funding were student-based. It appears the
census-based funding system shifted the need for this type of data collection. While funding decisions
are not made on this information, it would be helpful to understand the movements of students across
the districts. This would be especially true for the low incidence, high cost students this study focused
on. It is important to understand if certain districts have a high concentration of resident students in
certain disability categories. The districts have the financial burden for these students and must ensure
they are served appropriately which can have a high cost. The DOE has said it expects in the future that
the individual student level data will be available and formatted in a way that aligns with the analysis
APA was unable to undertake.
Expenditure data needs to be collected in a way that is both useful to the state in analyzing costs and of
interest to school districts. The inconsistent use of the disability category expenditure information was
related to the fact districts do not serve all students in a specific category in the same way. Instead of
thinking about costs by disability, the state may want to work with districts in creating an expenditure
tracking system that is more related to levels or types of service. This could mean not only looking at
expenditures by disability categories but also gaining more detail about the services provided,
particularly when services are provided in a resource room. It was clear that many of the expenditures
for higher cost students were occurring in resource room type settings and that these expenditures
were being categorized into this cost category.

51
Once the funding system has been implemented and the state data systems are collecting the pertinent
information, the state needs to undertake analyses to determine if the census-based funding system
causes funding inequities for districts, especially those with high percentages of low incidence, high cost
students. The findings discussed earlier in the chapter highlight the differences found in the distribution
of special education students across districts both by total percentage of special education students and
by the percent of typically high cost students. The underlying question that was not fully answered is
whether these differences mean the funding system, either the way students are funded and/or the
total amount of funding, need(s) to be changed.
The basis of the study was to ascertain if districts with high concentrations of low incidence, high cost
students are treated fairly by the census based system. APA was able to determine that these low
incidence, high cost students were not evenly distributed across serving districts. What has not been
fully studied, and needs to be addressed, is if this lack of even distribution is true for the resident
districts also, those responsible for the funding of the students. If the distributions are inconsistent,
either inconsistent across all types of districts or inconsistent between the types of districts, i.e. K-12
districts versus elementary districts versus secondary districts then funding inequities might exist.
Once it is determined if inconsistencies exist, the impact on district expenditures needs to be analyzed
to determine if the distribution differences cause fiscal issues also. The added costs for specific
categories or types of services associated with the high cost, low incidence students needs to be
examined. If the costs are truly higher for certain low incidence special education the impact to districts
needs to be understood. If on average, districts with higher rates of these high cost, low incidence
students also somehow have lower incidences of other special education students, then perhaps the
total cost of special education for the districts is not out of line with the use of the census based funding
formula. On the other hand, if these districts retain the general level of special education students
outside of the high cost, low incidence students than most likely the census based system is
underfunding these districts. The inverse is also true; districts with lower than average percentages of
the high cost, low incidence students may be benefitting from the census based system. Once again this
should be examined looking at all districts and then also by types of districts. The state needs to
understand if the census system places higher burdens on districts with these higher concentrations of
high cost, low incidence students.
If it is found that the census system creates these higher burdens then adjustments need to be made to
the special education funding system to addresses the inequities created by the census based funding.
This might include differentiating the current census based system by type of district or eliminating the
current system and funding districts based on actual special education students with regard to the
higher costs associated with certain students.

APPENDIX A- LITERATURE REVIEW WORK CITED
Chambers, J., Kidron, Y., & Spain, A. (2004). Characteristics of High-Expenditure Students with
Disabilities, 1999-2000. Palo Alto, CA: The Center for Special Education Finance at the American
Institutes for Research.
Chambers, J., Shkolnik, J., & Perez, M. (2003). Total Expenditures for Students with Disabilities, 1999-
2000: Spending Variation by Disability. Palo Alto, CA: The Center for Special Education Finance at the
American Institutes for Research.
Griffith, M. (2008). State Funding Programs for High-Cost Special Education Students. Denver, CO:
Education Commission of the States.
Muller, E., & Markowitz, J. (2004). Disability Categories: State Terminology, Defnitions & Eligibility
Criteria. Alexandria, VA: National Association of State Directors of Special Education.
Parrish, T., Gerber, M., Kaleba, D., & Brock, L. (2000). Adjusting Special Education Aid for Severity: The
Case of Census-Based Funding in California. Palo Alto, CA: The Center for Special Education Finance at
the American Institutes for Research.
Parrish, T., Harr, J., Anthony, J., Merickel, A., & Esra, P. (2003). State Special Education Finance Systems,
1999-2000. Palo Alto, CA: The Center for Special Education Finance at the American Institutes of
Research.
U.S. Department of Education, National Center for Education Statistics. (2009). Table 50: Children 3 to
21 Years Old Served Under Individuals with Disabilities Education Act, Part B, by Type of Disability:
Selected Years: 1976-77 through 2007-08. Digest of Education Statistics: 2009 . Washington, DC: Author.

APPENDIX B- First Round Interview Questions
I. Changes from old system to new system
a. What do you feel are the key changes from the old SpEd funding system to the new
census-based system?
i. Is the assumption of the new funding system – that the proportions of students
with different disabilities are similar across all districts – correct? If not, why
would the proportion vary across districts?
b. Do you feel the new system has changed the way districts identify SpEd students?
c. What do you think the strengths and weaknesses of the new system are?
d. Do you think the incentives provided by the new approach are correct?
i. To identify students.
ii. To classify students by disability?
iii. To provide appropriate services?
iv. To serve students in the district?
v. To provide services efficiently?
e. How would you change the system so it provided appropriate incentives?
f. How did the change from the old special education funding system to the new system
affect you?
i. Did it change the number of students receiving special education services?
More? Less?
ii. Did it change the process you use to classify students by disability?
iii. Did it change the services you provide? What services increased? What
services decreased?
iv. Did it change the proportion of services provided in regular classrooms, in other
ways in the district, or out of the district?
v. Did it lower state support?
vi. Did it require you to provide more local support?
II. High Cost, Low Incidence Students
a. What disability categories do you consider high cost and/or low incidence categories?
i. Have these categories changed over time?
ii. Do you feel these types of students are generally spread evenly across districts?
iii. Do you feel that most districts would consider these students high cost or is
their variation in service models that may lead to variation in costs?
iv. Do you feel that districts with different grade spans have different distribution
of students?
1. If so, does this change cost structures for these districts?

III. Best Practice
a. For the high cost and/or low incidence students, are there best practices to serve these
students?
b. Do you think some districts better serve these students than others?
i. If so, do you feel this can lead families to locate in these districts?
c. Do you feel districts can create high cost programs that are not necessary for the
appropriate service of students?

APPENDIX C- Protocol for Second Round of Interviews (NJ Visits or Calls)
1. Intro
a. Who we are
b. What we are doing for the NJDOE
c. How your district was selected
d. What we will cover in the conversation
i. Try to explain that we are trying to understand the new funding mechanism for
SpEd and understand there are cuts going on but want to focus on mechanism
e. Responses are anonymous
2. Changes from old system to new system
a. What do you feel are the key changes from the old SpEd funding system to the new
census-based system?
i. Is the assumption of the new funding system – that the proportions of students
with different disabilities are similar across all districts – correct? If not, why
would the proportion vary across districts?
b. Do you feel the new system has changed the way districts identify SpEd students?
c. What do you think the strengths and weaknesses of the new system are?
d. Do you have any thoughts on what the appropriate incentives are for SpEd funding
system?
e. How did the change from the old special education funding system to the new system
affect you?
i. Did it change the number of students receiving special education services?
More? Less?
ii. Did it change the process you use to classify students by disability?
iii. Did it change the services you provide? What services increased? What
services decreased?
iv. Did it change the proportion of services provided in regular classrooms, in other
ways in the district, or out of the district?
v. Did it lower state support?
vi. Did it require you to provide more local support?
3. Counts of students being served
a. Want to review data we were provided about counts of students participating in special
education programs.
b. Show resident and served counts by disability group and verify and changes over time
(note anything of interest).
i. Discuss private placements
ii. Note any changes in schools with different grade spans.

c. Discuss number of students in programs assumed to be high cost.
i. Does type of district have impact (e.g. K-12, Elementary, Secondary)?
ii. District is running a special program (e.g., autism)?
iii. Near a hospital with a particular specialty
iv. Just happened?
4. Spending on students being served
a. Want to better understand how much is being spent to serve students in special
education programs and revenues used to support spending.
b. Show spending information.
i. What makes certain disabilities high or low?
ii. Any unusual changes over time?
iii. Based on your experience, are these figures comparable to other places?
c. Show revenue information (state, federal, and assumed local, where local = total minus
state and federal).
i. Has local changed? If so, why?
ii. How does special ed compare to other areas?
5. Views about special education funding
a. Sufficient revenue to do job properly?
b. Too much reliance on local revenue?
c. Too much being spent on private placements?
d. Census-based system working?


