Analysis of Nitrate Concentrations in Groundwater of Chhota Udepur taluka, Gujarat
Daksh H Soni, Civil Engg. Dept., Faculty of Tech. and Engg. M. S. University of Baroda.
Mukesh A Modi, Assistant Professor, Civil Engg. Dept., Faculty of Tech. and Engg. M. S. University of Baroda.
Abstract—Water available in subsurface zone also known as Groundwater is most important resource of water especially in
central Gujarat for its vast use in purposes such as drinking,
agricultural, and industrial in the taluka of Chhota Udepur in
Chhota Udepur district, Gujarat. The need of the hour is the
access to unpolluted groundwater which can further be used in
drinking and agricultural. For these purposes the quality of
groundwater has to be within the permissible limit suggested by
the Bureau of Indian Standards IS 10500-2012. The study area
consists of dolomite mining and hard stone for construction
industries which contributes major concentration of Fluoride and
Nitrate in the ground water. The anthropogenic activities such as
overuse of pesticides consisting of ammonia and phosphates
interacts with groundwater and due to continuous withdrawal of
water from under laying aquifer, nitrate concentration transports
from these non-point sources to shallow groundwater. Arc GIS
software has been used to represent the concentrations of nitrate
from the available data and after analysis, the potentially
hazardous areas have been pointed out. Study reveals that nitrate
concentrations in the study area are due to waste-water and solid
waste disposals in landfills surrounding the rivers of Orsang and
Hiren. These tributaries of Narmada River act as a natural
boundary to the present unconfined aquifer system. This research work delineate nitrate contaminations in
groundwater of study area and the root causes behind it are such
that further contaminant transport modelling can be carried out
and remedial works could be suggested.
Keywords— Ground water, Nitrate, Contamination,
Geographic Information System
I. INTRODUCTION: Considering Groundwater as precious entity in the state of Gujarat, for its various uses in domestic, agriculture and industries, one has to be aware about the preservation of its quality. In the region of central Gujarat, a great number of groundwater contamination problems have materialized in last twenty years. Nitrate and Fluoride with high Salinity, and effluence from industrial discharges have caused contamination of aquifers (Krishnan, 2006). The taluka of Chhota Udepur is mainly a rural area which relies on water available at shallow depth in subsurface zone in non-monsoon period. Insufficient knowledge of groundwater quality in the locality is one of the main reasons of it being polluted with above
mentioned contaminants. From the sub surface contamination wise reports of National Rural Drinking Water Programme (NRDWP),it was observed that Nitrate and Fluoride are the prime contaminants causing groundwater pollution. In many rural and suburban areas sewer less sanitation has become the appropriate method of providing sanitations in the recent time. The effluents from septic tank or cesspool are often rich in nitrogen which affects the ground and surface water. (Vaijnapurkar)Nitrate in sufficient concentration is handy in agricultural aspect thus promoting the use of ammonia and phosphate based fertilizers. However if fertilizers and pesticides are supplied in excess amounts, then unused quantity of nitrate concentrations could reach to groundwater due to their high dissolvable properties causing the pollution. This nitrate affected groundwater should not be used as potable water because it causes Methemoglobinemia (Cyanosis) also known as Blue Baby Syndrome. Thus, regular inspections of the under laying aquifer system, remedial measures and educating the locality about groundwater quality and its pollution is suggested. It is challenging to categorize the natural and synthetic sources of nitrogen contamination of ground water. Some chemical and microbiological methods such as nitrification and denitrification also influence the nitrate concentration in ground water(District Groundwater Brochure, 2011)
II. STUDY AREA: Chhota Udepur Taluka is located on the eastern side of Chhota Udepur district, Gujarat which shares borders with the state of Madhya Pradesh. The latitude and longitude of the locality is 22.09 and 74.05 and it is spread over 74926 square kilometres. The elevation of study area is 92 metres above mean sea level. From the Census data of the study area, it was noted that Chhota Udepur taluka consists of 144 villages with a total population of 241377.
8 degree in winter season. Average annual rainfall is 750 mm in the region during the monsoon season. Chhota Udepur Taluka consists of 27,687 hector area of forest and 5324 hector of barren land.(P.L.SHAH, 2016-2017) TheChhota Udepur taluka region is known for its rich agriculture with fine crops of cotton, horticulture and vegetables due to fertile alluvial soils and perennial availability of water but 95% ground water sources used as irrigation for cultivated area (District Groundwater Brochure, 2011)
A. Hydro-Geology of the study area: Land Use Patterns:
The net geographical area of Chhota Udepur Taluka watershed is about 3988.60 ha out of which 29% is forest area. Most of the villages in this area are surrounded by hilly and rocky mountains.
Table:1 Land use patterns of Chhota Udepur Taluka Villages
Fig: 1 State of Gujarat Map, Chhota Udepur District Map and Chhota Udepur Taluka Map
The rivers of Orsang and Hiren are passing through the taluka which are tributaries of Narmada River. These rivers contribute to the ground water present at shallow depth and acts as natural boundary for underlying aquifer system. Generally, a hot and dry atmosphere is found for the study region. It goes as high as 45 degree centigrade in summer and as low as
About 51% of land is under agriculture which is completely rain‐ fed; mainly a Kharifcrop is taken. About 14% of the total land is classified under wasteland of which 41% is cultivable and rest is not fit for agriculture. (DETAILED PROJECT REPORT (DPR) IWMP- 8 (SELVA), 2010-2011)
III. DATA COLLECTION:
A. Following data were explored from GWRDC, Gandhinagar
Table:2 Groundwater Head of some Villages of Chhota Udepur Taluka
Groundwater Head (mbgl)
Taluka Village Geology R.L.(M) Latitude Longitude May 09 Oct 09 May 15 Oct 15
B. Graphical representation of Nitrate Concentrations in Villages of Chhota Udepur Taluka obtained from NRDWP
reports
C. Animal Husbandry and Livestock: (Detail Project Report, IWMP-5, Chhota Udepur-2P)
Livestock is owned by all almost all the farmer for drought and Table: 3 Animal Husbandry and Livestock
Sr.no. Livestock Number of cattle
agriculture purposes. Partly some people in the community depend on goat rearing for their livelihood. Cows and 1 buffalo 2360 buffaloes are of local breed. Lack of rain and surface water has
2 cow 2230 reduced the fodder and pasture availability for their animals.
3 bullock 2408
Particularly for the study area, animal husbandry is causing
improper dumping of animal waste which seeps through 4 goat 2476 pervious layers and pollutes shallow groundwater.
5 hen 1706
D. Villages of Taluka Showing Groundwater table(m) and its availability
Table:4 Villages of Taluka Showing Groundwater table(m) and its availability
Sr.No. Village Groundwater table(m) Source of Drinking Water Availability
1 Mandalva 15 Handpump, Well 8 Months, 4 Months
2 Ranikheda 16.04 Handpump, Well 8 Months, 4 Months
3 Limbani 17.5 Handpump, Well 8 Months, 4 Months
4 Bandibhint 15.4 Handpump, Well 8 Months, 4 Months
5 Dholisimel 20.35 Handpump, Well 8 Months, 4 Months
6 Dungerbhint 16.42 Handpump, Well 8 Months, 4 Months
7 Dobachapura 19.02 Handpump, Well 8 Months, 4 Months
8 Kevdi 18.15 Handpump, Well 8 Months, 4 Months
9 Mithibor 15 Handpump, Well 8 Months, 4 Months
10 Kakadkubd 17.1 Handpump, Well 8 Months, 4 Months
11 Marchipani 20.15 Handpump, Well 8 Months, 4 Months
12 Rinchhvel 12.3 Handpump, Well 8 Months, 4 Months
After the collection of secondary data from various resources, Geographical Information System (ArcGIS) was used for data analysis and geographic representation. First step was to properly segregate all available data and make a spread sheet showing the latitudes and longitudes of various collected samples. The sheet was then imported in ArcGIS and a point file was created. Geo referenced image of Chhota Udepur taluka was overlapped with existing point file and a combined shape file was created. Raster analysis was used from Geo-processing tool bar and an output raster was formed showing the concentrations of Nitrate at respective locations. From the Arc tool box, spatial analysis tool was selected and IDW(Inverse Distance Weighted) method of interpolation was performed to spatially distribute Nitrate Concentrations. A. Contour map of Groundwater head:
Fig :2MAY 2009 Groundwater contour
occurring. Shades of Blue are showing shallower groundwater levels and Shades of Red are showing deeper groundwater levels in the ranges of 5 to 8 meters and 9 to 15 meters.
Fig :4MAY 2015 Groundwater contour
Fig :5OCTOBER 2015 Groundwater Contour
V. ANALYSIS AND RESULT DISCUSSION:
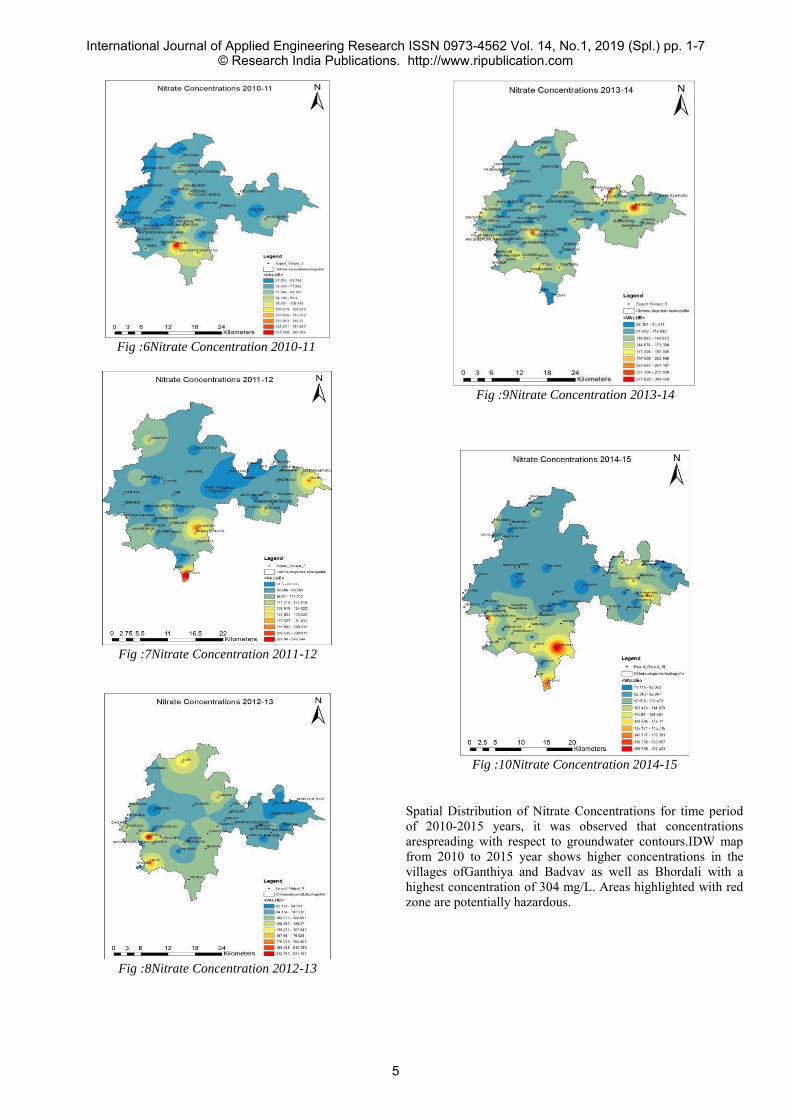
IDW maps from 2010 to 2015 year wise showing special distribution of Nitrate Concentrations. Following maps were created in Geographic Information System with the help of Spatial Analysis tools and Interpolation methods.
Fig :3OCTOBER 2009 Groundwater Contour From the pre monsoon (May-09) and post monsoon (October- 09) it is observed that a gradual rise in groundwater level is
Spatial Distribution of Nitrate Concentrations for time period of 2010-2015 years, it was observed that concentrations arespreading with respect to groundwater contours.IDW map from 2010 to 2015 year shows higher concentrations in the villages ofGanthiya and Badvav as well as Bhordali with a highest concentration of 304 mg/L. Areas highlighted with red zone are potentially hazardous.
Studying the spatial distribution of available groundwater head data in the study area, it is concluded that, the villages Ferkuva, Khadakwada, Rangpur (Zoz), shows groundwater at shallow depth whereas in the villages of Ozadi, Lagami, Ambala and Achheta, shows groundwater level at comparatively greater depth, in the pre and post monsoon of the year 2009. In the year 2015 groundwater head is decreasing compared to the year of 2009. Spatial distribution of Nitrate concentrations in the taluka of Chhota Udepur, suggests that higher concentrations are occurring at the villages of Ferkuva, Raysangpura, Rangpur (Zoz), Motisadhli and Bhordali. It is as high as 304 mg/l in Bhordali in the year of 2013-14. These villages are located alongside the Orsang and Hiren tributaries. Anthropogenic activities and use of artificial fertilizers in excess amount could be the main reason of the higher Nitrate Concentrations. Also from the reports of CGWB (2015-16)(Tiwari, 2015-2016) and IWMP-5(Detailed Project Report, IWMP-5, 2010), high agricultural activity and animal husbandry seems to be contributing to higher nitrate concentrations. As a future scope of this research work, groundwater flow model and contaminant transport model can be developed using groundwater modeling systems for better understanding of hydrogeology of the area.
VII. ACKNOWLEDGEMENT
The Author/s are grateful to the Department of Chemical Engineering, Sal College of Engineering, Ahmedabad for giving us an opportunity to present our work in the National Seminar “Pollution control, Cleaner Production and Chemical Security Program-Issues & Concerns” Sept 19-20, 2018 jointly organized by Department of Chemical Engineering – SAL College of Engineering, Gujarat pollution Control Board, Indian Institute of Chemical Engineers-ARC & Institution of Engineers India)- Gujarat Centre. We are pleased to know that the Department of Chemical Engineering, SAL College of Engineering is helping us to publish our research paper in the journal “IJAER”. We also extend our gratitude to the Department for the same. Declaration:
We also declare that the presented work is done by us. Any of the staff members/ faculty members of the above mentioned organizers and that of SAL Education campus is not responsible for data or work presented in the paper. We publish our paper “Analysis of Nitrate Concentrations in Groundwater
of Chhota Udepur taluka, Gujarat” in the above said journal at our sole responsibility and resolve the issues if raised any time at ourselves.
VIII. REFERENCES
1. (2010). DETAILED PROJECT REPORT, IWMP-5. VADODARA: GUJARAT STATE WATERSHADE MANAGEMENT AGENCY. 2. (2011). DISTRICT GROUNDWATER BROCHURE. VADODARA. 3. (2012). IS 10500 : 2012 - DRINKING WATER — SPECIFICATION. NEW DELHI: B U R E A U O F I N D I A N S T A N D A R D S. 4. (2017). NATIONAL RURAL DRINKING WATER PROGRAMME (NRDWP REPORTS). VADODARA. 5. CENSUS 2011. (N.D.). RETRIEVED OCTOBER 1, 2018, FROM
WWW.CENSUS2011.CO.IN: HTTPS://WWW.CENSUS2011.CO.IN>SUBDISTRICT 6. KARTHIKA, I. N. ((2018)). PHYSICO-CHEMICAL STUDY OF THE GROUND WATER QUALITY AT SELECTED LOCATIONS IN PERIYAKULAM,THENI DISTRICT, TAMILNADU, INDIA. MATERIALS TODAY:
PROCEEDINGS 5 , 422–428. 7. KRISHNAN, S. (2006). GROUNDWATER AND WELL-WATER QUALITY IN ALLUVIAL AQUIFER OF CENTRAL GUJARAT. IWMI-TATA WATER POLICY PROGRAM. 8. P.L.SHAH. (2016-2017). DISTRICT INDUSTRIAL POTENTIALITY SURVEY REPORT. CHHOTA UDEPUR DISTRICT: MSME-DEVELOPMENT INSTITUTE, AHMEDABAD. 9. SELVAKUMAR, S. (2017). HYDROGEOCHEMICAL CHARACTERISTICS AND GROUNDWATER CONTAMINATION IN THE RAPID URBAN DEVELOPMENT AREAS OF COIMBATOR, INDIA. WATER RESOURCES AND INDUSTRY - ELSEVIER, 26-33. 10. TIWARI, H. N. (2015-2016). GROUNDWATER YEAR BOOK. GUJARAT STATE AND UT OF DAMAN & DIU: CENTRAL GROUND WATER BOARD, INDIA. 11. VAIJNAPURKAR, S. M. (N.D.). OCCURANCE OF NITRATES IN DRINKING WATER OF GUJARAT. ME (PH) THESIS AT BVM ENGG., COLLEGE, V. V. NAGAR.
Daksh H Sonireceived the B.E. degree in Civil Engineering from Hansaba College Of Engineering and Technology, Sidhpur in 2016 affiliated with Gujarat Technological University.
Currently he is pursuing his Masters in Civil engineering with specialization in Hydraulic Structures in The M S University of Baroda.
Mukesh A. Modireceived the B.E.degree from S.V.N.I.T., Surat and M.E. degree from L.D. College of Engineering, Ahmedabad and pursuing PhD in Civil Engineering from The M.S. University of Baroda.
He obtained his Master degree with specialization in Water Resources Management in 2004. He served L.E. College, Morbi for a short period and then joined Faculty of Technology & Engineering, The M.S. University of Baroda in 2004. He has written several research papers and delivered many technical expert talks as well as lectures. He has been guiding many scholars for their Masters in the field of water resources engineering which includes Ground water Modeling, Irrigation water management, Water pollution and contamination studies and ground water vulnerabilities.