99
Analysis of Options for Funding Universal Preschool in Sonoma County Updated Report Emily Weinberg Susan Muenchow Karen Manship Kathleen Jones APRIL 2016

Analysis of Options for Funding
Universal Preschool
in Sonoma County
Updated Report
Emily Weinberg
Susan Muenchow
Karen Manship
Kathleen Jones
APRIL 2016


2800 Campus Drive, Suite 200
San Mateo, CA 94403
650-843-9100
www.air.org
Copyright © 2016 American Institutes for Research. All rights reserved.
5920_04/16
Analysis of Options for Funding
Universal Preschool in Sonoma County
Updated Report
April 2016
Emily Weinberg
Susan Muenchow
Karen Manship
Kathleen Jones


Contents Page
Purpose and Background ................................................................................................................ 1
Findings From Other Preschool Initiatives Implemented Across the United States:
Summary of Key Features .............................................................................................................. 3
Primary Funding Mechanisms .................................................................................................. 3
Other Sources of Funding for Children Enrolled in the Preschool Initiatives .......................... 4
Funding Levels.......................................................................................................................... 6
Preschool Initiative Expenditures per Child ............................................................................. 8
Implementation Status ............................................................................................................ 10
Target Population and Number Children Served .................................................................... 11
Hours and Days of Operation ................................................................................................. 13
Family Fees ............................................................................................................................. 14
Providers or Facilities ............................................................................................................. 15
Administering Entity ............................................................................................................... 17
Phase-In Plan .......................................................................................................................... 18
Teacher Qualifications, Other Quality Measures, and Provision for Professional
Development and Tuition Reimbursement for Personnel ....................................................... 19
Political Leadership ................................................................................................................ 27
Analysis of Potential Funding Sources ......................................................................................... 29
Sales Tax ................................................................................................................................. 29
Property Tax............................................................................................................................ 30
Set-Asides ............................................................................................................................... 31
Pay for Success ....................................................................................................................... 31
Federal Title I .......................................................................................................................... 34
Partnerships with Local Businesses ........................................................................................ 34
Cost Estimates and Phase-In Plans ............................................................................................... 36
Cost per Child for Universal Preschool .................................................................................. 36
Cost of Upgrading the Quality of Existing Subsidized Slots .................................................. 38
Phase-In Plan Scenarios for Universal Preschool ................................................................... 39
Four-Year-Olds in High-Priority Census Tracts ..................................................................... 44
Four-Year-Olds in High-Priority ZIP Codes .......................................................................... 46

Three- and Four-Year-Olds Below 300 Percent of the Federal Poverty Level in High-Priority
Census Tracts, at 85 Percent Participation Rate ..................................................................... 48
Three- and Four-Year-Olds Below 300 Percent of the Federal Poverty Level in High-Priority
ZIP Codes, at 85 Percent Participation Rate ........................................................................... 50
Three- and Four-Year-Olds Below 300 Percent of the Federal Poverty Level in High-Priority
Census Tracts, at 70 Percent Participation Rate ..................................................................... 52
Three- and Four-Year-Olds Below 300 Percent of the Federal Poverty Level in High-Priority
ZIP Codes, at 70 Percent Participation Rate ........................................................................... 54
Three- and Four-Year-Olds Countywide at 70 Percent Participation Rate ............................ 56
Three- and Four-Year-Olds Countywide at 70 Percent Participation Rate, Free for Children
Below 300 Percent FPL, and a 25 Percent Tuition Credit for Children at or Above 300
Percent FPL ............................................................................................................................. 58
Cost Estimate and Phase-In Plan for Expanding Access to Home Visiting Programs for
Children Ages 0–3 Years ........................................................................................................ 59
Recommendations for Funding and Phasing in Universal Preschool in Sonoma County ............ 61
What Is the Ultimate Goal?..................................................................................................... 61
Free Versus Sliding-Scale Support ......................................................................................... 62
Leverage Existing Revenue Sources ....................................................................................... 63
Need for Additional Revenue ................................................................................................. 64
Finding New Revenue for Facilities ....................................................................................... 66
Mount a Public Education Campaign ..................................................................................... 68
Evidence-Based Framework ................................................................................................... 69
Making Connections ............................................................................................................... 69
Program Services .................................................................................................................... 70
Phase in the Program .............................................................................................................. 70
Summary ................................................................................................................................. 71
References ..................................................................................................................................... 72
Appendix A. Methodology ........................................................................................................ A–1
Appendix B. Interviews Conducted ............................................................................................ B–1
Appendix C. Detailed Budgets for Preschool per Child Cost Estimates .................................... C–1
Appendix D. Highest Priority Schools and Associated ZIP Codes and High-Risk Priority
Areas per A Portrait of Sonoma County and Associated Census Tracts ................................... D–1


American Institutes for Research Analysis of Options for Funding Universal Preschool in Sonoma County—1
Purpose and Background
The purpose of this report, as prepared by American Institutes for Research (AIR), is to help
Sonoma County develop a plan “to make universal preschool a reality” as recommended in
A Portrait of Sonoma County (Burd-Sharps & Lewis, 2014). In line with Strategies to Reduce
Poverty in Sonoma County (Blue Sky Consulting Group, 2014), this report also offers guidance
on how to phase in access to quality preschool, beginning in the areas of highest unmet need.
This document is intended to replace an earlier version of the report submitted in October 2015;
this April 2016 version provides different and more refined phase-in scenarios based on new
information and assumptions.
Specifically, this report will do the following:
Describe the key features, including funding levels, phase-in plans, and finance
mechanisms, of 12 city and other regional preschool initiatives being implemented across
the United States.
Analyze potential funding options.
Provide two estimates for the per-child cost of providing full-day (i.e., eight hours), full-
year (12 months) preschool in Sonoma County: one based on the current expenditures for
programs meeting the minimum standards for Title 5 State Preschool or Head Start in
California, and one with an increase in compensation to a living wage intended to help
recruit and retain qualified staff.
Present eight options for phasing in universal access to quality preschool in the county
across a five- to 10-year period, beginning in the areas of highest need and the least
access to preschool.
Make recommendations for funding and phasing in access to quality preschool for all
children in Sonoma County.
Research findings highlight the benefits of expanding access to high-quality preschool,
especially for children who are disadvantaged, to improve the long-term outcomes for children
and their families. For children at risk of falling behind in school, quality early learning and care
programs can help improve their readiness for school and school success, with better attendance,
higher test scores, and reduced grade-level retention (Karoly & Bigelow, 2005; Reynolds,
Temple, & Ou, 2007). Other lasting benefits include higher rates of high school completion,
greater likelihood of attending college, and higher lifetime earnings (Reynolds & Ou, 2011). By
reducing grade retention, the use of special education and welfare, and involvement in crime,
these quality programs can save between $4 and $17 for every dollar invested (Reynolds et al.,
2007; Schweinhart et al., 2005). Of particular interest, given the demographics of California and
Sonoma County in particular, is that high-quality preschool programs have been found to benefit
children from Latino backgrounds whose mothers have little education, have low incomes, and
are linguistically isolated (Karoly, Ghosh-Dastidar, Zellman, Perlman, & Fernyhough, 2008).
Although the benefits of preschool are less dramatic for children from more advantaged
backgrounds, attending a quality program is associated with higher achievement in elementary
school for children from all income groups (Gormley & Phillips, 2005). The educational benefits

American Institutes for Research Analysis of Options for Funding Universal Preschool in Sonoma County—2
of quality programs for preschool-aged children who are not disadvantaged are substantial,
perhaps 75 percent as large as those for children from low-income families (Pianta, Barnett,
Burchinal, & Thornburg, 2009). An important caveat, however, is that only quality programs
have been found to produce improved child outcomes, and no evidence exists that preschool
programs of average quality lead to the same results (Barnett, 2008). Moreover, shortfalls in the
quality of early learning and care programs have been found to affect children in all income
groups in California (Karoly et al., 2008).
As noted in other recent reports on Sonoma County, critical gaps currently exist in the
availability of high-quality preschool, particularly in low-income and less populated areas of the
county. According to A Portrait of Sonoma County (Burd-Sharps & Lewis, 2014), only about 50
percent of Sonoma County’s three- and four-year-old children are enrolled in preschool; among
Latinos, the rate falls to 39 percent. From 2009 to 2013, state budget cuts led to a loss of 600
state-subsidized slots and the closure of many preschool classrooms in Sonoma County; although
opportunities now exist to restore these slots thanks to a Preschool Facilities Grant Fund created
by the Board of Supervisors and First 5 Sonoma County (County of Sonoma, 2015), districts and
community preschool providers are finding it difficult to fund and develop the new classrooms to
house the services for children who are subsidy eligible (Nilsson Consulting, 2014).
Even middle-income families have difficulty affording center-based preschools, with the average
cost per child estimated at one third of the median annual income in the county (Burd-Sharps &
Lewis, 2014). Moreover, given that the quality of service is fundamental to achieving the
potential benefits of preschool, it is important to offer sufficient compensation to attract and
retain qualified preschool personnel. According to the State of California Employment
Development Department (2015), the median hourly wage for child care personnel in the Santa
Rosa-Petaluma metro area is just $12.97, but the median hourly wage for a Santa Rosa
elementary schoolteacher is $29 (Salary.com, 2015).
Building on Sonoma County’s interest in universal preschool, and the body of work already
conducted in the county supporting it, this report provides a plan to expand access to preschool
and to raise the quality of service to a level sufficient to achieve the promised benefits of
preschool.

American Institutes for Research Analysis of Options for Funding Universal Preschool in Sonoma County—3
Findings From Other Preschool Initiatives Implemented
Across the United States: Summary of Key Features
We examined 12 city and other regional preschool initiatives being implemented across the
United States. Of these, nine are working toward eventually providing universal access: Boston,
Massachusetts; Denver, Colorado; Los Angeles, California; New York City, New York; San
Antonio, Texas; San Francisco, California; Seattle, Washington; Washington, D.C. (the District
of Columbia); and West Sacramento, California. Of the remaining three initiatives, two—Elk
Grove Unified School District (California) and the Chicago Child-Parent Centers (CPCs;
Illinois)—have aimed to provide access to preschool to children in certain Title I school
catchment areas but do not bill themselves as universal preschool programs. The other
initiative—Salt Lake (Utah)—is targeted to a low-income, disadvantaged population of children.
In the sections that follow, we summarize the key features across the preschool initiatives that
were examined: primary funding mechanisms, other sources of funding for enrolled children,
funding levels, expenditure per child, implementation status, the number of children served,
target population, hours and days of operation, family fees, types of providers or provisions for
facilities, administering entity, phase-in plan, teacher qualifications, other quality measures,
provision for professional development, and political leadership.
Primary Funding Mechanisms
The primary funding mechanism for most of the preschool initiatives is a tax or a set-aside. For
example, the primary funding mechanism in Denver and San Antonio is a dedicated sales tax,
and Seattle’s primary funding mechanism is a property tax levy. San Francisco’s primary
funding mechanism is a set-aside in the city budget, called the Public Education Enrichment
Fund (PEEF; San Francisco Public Schools, 2015), which is financed by a portion of the local
property tax. Washington, D.C., and Boston have similar primary funding mechanisms in that
both cities use a combination of district and city funds as their primary funding mechanisms.
Other primary funding sources for the preschool initiatives include First 5 California (e.g., Power
of Preschool grants) and, in the case of New York City, a recent state grant.
We chose to include Elk Grove because of its Title I–funded preschool program. Salt Lake also
was included in our analysis because its Pay for Success bond provides preschool services to a
select group of children. CPCs were included because they are an example of an initiative that
uses both Title I and Pay for Success as sources of funding for their preschool initiative. Table 1
briefly describes the primary funding mechanisms for each initiative.
American Institutes for Research Analysis of Options for Funding Universal Preschool in Sonoma County—4
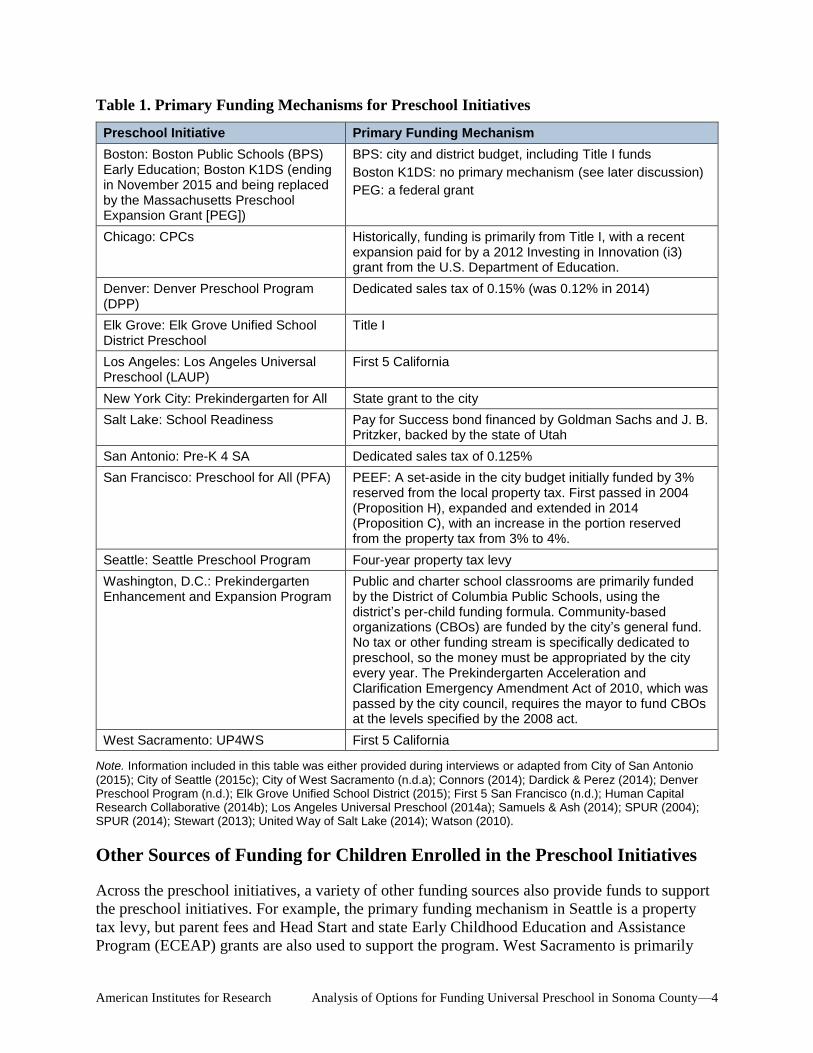
Table 1. Primary Funding Mechanisms for Preschool Initiatives
Preschool Initiative Primary Funding Mechanism
Boston: Boston Public Schools (BPS) Early Education; Boston K1DS (ending in November 2015 and being replaced by the Massachusetts Preschool Expansion Grant [PEG])
BPS: city and district budget, including Title I funds
Boston K1DS: no primary mechanism (see later discussion)
PEG: a federal grant
Chicago: CPCs Historically, funding is primarily from Title I, with a recent expansion paid for by a 2012 Investing in Innovation (i3) grant from the U.S. Department of Education.
Denver: Denver Preschool Program (DPP)
Dedicated sales tax of 0.15% (was 0.12% in 2014)
Elk Grove: Elk Grove Unified School District Preschool
Title I
Los Angeles: Los Angeles Universal Preschool (LAUP)
First 5 California
New York City: Prekindergarten for All State grant to the city
Salt Lake: School Readiness Pay for Success bond financed by Goldman Sachs and J. B. Pritzker, backed by the state of Utah
San Antonio: Pre-K 4 SA Dedicated sales tax of 0.125%
San Francisco: Preschool for All (PFA) PEEF: A set-aside in the city budget initially funded by 3% reserved from the local property tax. First passed in 2004 (Proposition H), expanded and extended in 2014 (Proposition C), with an increase in the portion reserved from the property tax from 3% to 4%.
Seattle: Seattle Preschool Program Four-year property tax levy
Washington, D.C.: Prekindergarten Enhancement and Expansion Program
Public and charter school classrooms are primarily funded by the District of Columbia Public Schools, using the district’s per-child funding formula. Community-based organizations (CBOs) are funded by the city’s general fund. No tax or other funding stream is specifically dedicated to preschool, so the money must be appropriated by the city every year. The Prekindergarten Acceleration and Clarification Emergency Amendment Act of 2010, which was passed by the city council, requires the mayor to fund CBOs at the levels specified by the 2008 act.
West Sacramento: UP4WS First 5 California
Note. Information included in this table was either provided during interviews or adapted from City of San Antonio
(2015); City of Seattle (2015c); City of West Sacramento (n.d.a); Connors (2014); Dardick & Perez (2014); Denver Preschool Program (n.d.); Elk Grove Unified School District (2015); First 5 San Francisco (n.d.); Human Capital Research Collaborative (2014b); Los Angeles Universal Preschool (2014a); Samuels & Ash (2014); SPUR (2004); SPUR (2014); Stewart (2013); United Way of Salt Lake (2014); Watson (2010).
Other Sources of Funding for Children Enrolled in the Preschool Initiatives
Across the preschool initiatives, a variety of other funding sources also provide funds to support
the preschool initiatives. For example, the primary funding mechanism in Seattle is a property
tax levy, but parent fees and Head Start and state Early Childhood Education and Assistance
Program (ECEAP) grants are also used to support the program. West Sacramento is primarily

American Institutes for Research Analysis of Options for Funding Universal Preschool in Sonoma County—5
funded by First 5 California, but additional support comes from First 5 Yolo, private donations,
federal Community Development Block Grant (CDBG) funds, a portion of a 0.5 percent city
sales tax, district funds, and in-kind donations from the city. San Antonio’s primary funding
mechanism is a dedicated sales tax of 0.125 percent, but additional support comes from state and
local matching funds, the federal Child and Adult Care Food Program, local donors, and parent
fees. However, Denver’s primary funding mechanism is the only source of funding for the tuition
subsidies it provides. Table 2 briefly describes the other sources of funding for children enrolled
in each initiative.
Table 2. Other Sources of Funding for Children Enrolled in Preschool Initiatives
Preschool Initiative Other Sources of Funding
Boston: Boston K1DS; PEG
Boston K1DS: a combination of city and district money, Race to the Top grant funds, and foundation grants
PEG: foundation grants, Head Start, Temporary Assistance to Needy Families vouchers, and other government subsidies
Chicago: CPCs Pay for Success bond funded by Goldman Sachs, Northern Trust, and the Pritzker Family Foundation
Denver: DPP DPP receives all its revenue for the preschool initiative from the sales tax. Providers may receive funding from other sources, such as state and federal subsidies and parent fees.
Elk Grove: Elk Grove Unified School District Preschool
Individual classrooms are funded by Head Start, Title 5 State Preschool, and Title I. Teachers can and do teach in classrooms funded by different streams, but classrooms are kept segregated by funding source.
Los Angeles: LAUP Parent fees, Race to the Top grant funds, Quality Rating and Improvement System (QRIS) block grants, and private donations. Also, many of the participating programs receive grants from Head Start, Title 5 State Preschool, and other state and federally funded programs.
New York City: Prekindergarten for All
Additional funds from local sources and other state grants
Salt Lake: School Readiness
Providers included in the Pay for Success bond also serve other children through Title I and parent fees. However, these other sources of funding (e.g., Title I and parent fees) are not used to fund children in the Pay for Success program.
San Antonio: Pre-K 4 SA Although 85% of the funds come from the sales tax, additional funding sources include state and local matching funds for a small portion of the children served, a Child and Adult Care Food Program grant, local donors, and parent fees.
San Francisco: Preschool for All (PFA)
Received about $10 million total in First 5 California funds from 2005 through 2015. Developer impact fees and federal CDBG funds are used for facilities.
Seattle: Seattle Preschool Program
Parent fees for four-year-old children living above 300% of the federal poverty level (three-year-old children living above 300% of the federal poverty level are not eligible for the program); also leverages Head Start money and state ECEAP grants.
Washington, D.C.: Prekindergarten Enhancement and Expansion Program
Public schools also receive Head Start funding and funding for children with special needs.

American Institutes for Research Analysis of Options for Funding Universal Preschool in Sonoma County—6
Preschool Initiative Other Sources of Funding
West Sacramento: UP4WS
First 5 Yolo, private donations, CDBG funds, a portion of a 0.5% city sales tax, district funds, and in-kind donations from the city. First 5 California funding will no longer available after 2015, so the current model is not sustainable. Currently searching for alternative funding sources. Developer impact fees are used for facilities.
Note. Information included in this table was either provided during interviews or adapted from Barnett, Carolan, Squires, Clarke Brown, & Horowitz (2015); Boston Public Schools (2015); City of Seattle (2015c); City of West Sacramento (n.d.a); City of West Sacramento Engineering Department (2015); Denver Preschool Program (n.d.); Elk Grove Unified School District (2015); First 5 San Francisco (n.d.); Los Angeles Universal Preschool (2014a); Yolo Elections Office (n.d.a, n.d.b).
Funding Levels
Across the preschool initiatives, the level of funding varies widely depending on the sources of
revenue, with the amount of funding sought influenced by the size of the population to be served,
the quality of the program, the number of hours and days of service, and the proportion of the
total expenditure for preschool that the initiative aims to finance.
In general, the programs with the most stable funding levels have a dedicated funding
mechanism for preschool (e.g., sales tax, property tax, or set-aside from a general fund). Federal
Title I funds and other district funds can be a major source of revenue, as in Chicago, Boston,
and Elk Grove, which require school board action every year. But even those programs with a
dedicated funding mechanism rely on other sources of revenue. In the largest initiatives (e.g.,
New York City; Washington, D.C.; and Boston), local and state policies often work together,
resulting in state action that provides funds for local initiatives or requiring localities to make
good on the funding levels for preschool they have promised.
As might be expected, of the 12 initiatives we examined, New York City has the highest funding
level and provides services to the most children, with 53,000 preschool slots for four-year-old
children in 2015 financed primarily by $300 million in the city’s education budget coming from
a recent state appropriation for universal preschool. This special allocation from the state was
awarded in a compromise between the state and the city after the New York City mayor’s efforts
to raise the income tax to finance universal preschool were unsuccessful.
The District of Columbia’s preschool initiative has the next highest funding level, with more
than $191 million from sources including a set-aside in the city budget spent on more than
12,000 preschool children, representing 86 percent of the three- and four-year-old children in the
city. City council legislation requires the mayor to fund the preschool at the level intended.
San Francisco’s PFA has one of the more stable funding sources for preschool. As of 2014, it
generated $27 million per year and served approximately 4,000 children. First enacted in 2004,
Proposition H created PEEF, from which one third is reserved for universal preschool. The
initiative was reauthorized in 2014, extended for 25 years, and expanded from a 3 percent set-
aside of local property taxes to a 4 percent set-aside.
The funding level sought for an initiative also varies depending on the quality requirements and
intensity of the program. For example, the fourth highest funding level for the preschool

American Institutes for Research Analysis of Options for Funding Universal Preschool in Sonoma County—7
initiatives examined for this study is in San Antonio, where the sales tax increase generates
$31 million per year. The program currently aims to provide high-quality care to only
2,000 children in four centers, representing about 10 percent of the four-year-old children in the
city. Although some expansion is underway, plans for major growth await a future election.
Initiatives that require lead teachers in a preschool classroom to have a bachelor’s degree (i.e.,
San Antonio, Seattle, District of Columbia, Boston, New York City, Elk Grove, and Chicago) or
fund full-day preschool services (i.e., San Antonio, Seattle, District of Columbia, Boston, and
New York City) tend to have higher funding levels. In addition, for some initiatives, the funding
level covers the full cost of the program (i.e., San Antonio, Boston, Elk Grove, and Salt Lake),
whereas the funding level covers only a portion of the cost of preschool for most children
enrolled in other initiatives. Other sources of funding, such as parent fees, and other public
programs, such as Head Start and state-funded preschool, are used to make up the difference
(i.e., Denver, Los Angeles, Seattle, and San Francisco). Table 3 briefly describes the funding
level for each initiative.
Table 3. Funding Level for Preschool Initiatives
Preschool Initiative Funding Level
Boston: BPS Early Education; PEG
BPS: $24 million per year
PEG: $14 million across four years
Chicago: CPCs Primarily funded through Title I, with an additional $17 million across four years from a Pay for Success bond
Denver: DPP $13 million per year from a sales tax increase (forecast to increase to $19 million)
Elk Grove: Elk Grove Unified School District Preschool
$1.3 million annually in Title I funds
Los Angeles: LAUP $48.6 million from First 5 LA, $1.5 million in donations, and approximately $25 million from other sources in fiscal year (FY) 2014
New York City: Prekindergarten for All
$300 million state grant in 2014 to fund full-day preschools; additional funds to expand half-day programs to full-day programs
Salt Lake: School Readiness
Initial investment of $1 million for the first year and $3 million per year for the remainder of the five-year period (Not all of the $3 million is designated for this Pay for Success bond; some funds are designated for grants to improve preschool quality at other providers around the state, in hopes of attracting future Pay for Success funding.)
San Antonio: Pre-K 4 SA $31 million per year for eight years from a sales tax increase, plus state and local matching funds of $3 million per year. State funding covers less than 25% of the costs for eligible children. Funds from the sales tax cover professional development and facilities costs, which San Antonio does not include in its per child expenditure.
San Francisco: PFA $27.2 million annually from PEEF
Seattle: Seattle Preschool Program
$58 million across four years from a property tax increase

American Institutes for Research Analysis of Options for Funding Universal Preschool in Sonoma County—8
Preschool Initiative Funding Level
Washington, D.C.: Prekindergarten Enhancement and Expansion Program
The total prekindergarten spending by the district in FY 2014 was $191,016,442, according to National Institute for Early Education Research report but may not include funds for CBOs.
West Sacramento: UP4WS For FY 2015: $913,000 from First 5 California, $100,000 from the city (dedicated sales tax), $100,000 from First 5 Yolo; $1.3 million each from the district and the county; CDBG funds; and grants from corporations and nonprofit organizations
Note. Information included in this table was either provided during interviews or adapted from Barnett et al. (2015); City of San Antonio (2015); City of Seattle (2015c); Connors (2014); Dardick & Perez (2014); Denver Preschool Program (n.d.); Elk Grove Unified School District (2015); First 5 San Francisco (n.d.); Human Capital Research Collaborative (2014b); Los Angeles Universal Preschool (2014a); Samuels & Ash (2014); SPUR (2014); Stewart (2013).
Preschool Initiative Expenditures per Child
Preschool initiative expenditures per child vary across the preschool initiatives depending on the
quality requirements and the intensity of the program. For example, San Antonio, Seattle, the
District of Columbia, and Boston all fund a full-day (at least six-hour) program with relatively
high-quality standards or requirements, and their expenditures per child per year range from
$13,000 to $15,372. In contrast, although it has relatively high-quality standards, Elk Grove
supports only a partial-day program, and the expenditure per child per year is $6,500. Salt Lake’s
program has the lowest expenditure per child per year because it provides a partial-day, school-
year program; in addition, its teachers are considered hourly employees, so the expenditure per
child does not include benefits for the personnel.
The per-child expenditure for four initiatives (San Antonio, Boston, Elk Grove, and Salt Lake)
covers the full cost of the program. For example, in San Antonio, the preschool initiative
expenditure per child of $14,500 covers the cost of the program, but professional development
funds are not considered part of the per child costs, even though the main funding mechanism
(e.g., sales tax) funds professional development. In Boston, the preschool initiative expenditure
per child is $10,000–$15,000 per year depending on whether overhead is included, and this
covers the full cost of the program. In Elk Grove, Title I funds the full cost per child per year for
a half-day program. The Salt Lake Pay for Success bond covers the full cost of the program for
the children participating in the bond-supported program.
In contrast to initiatives that provide the full cost of the program, the expenditures per child in
Denver, Los Angeles, San Francisco, and Seattle provide a fraction of the full cost of providing
either a full- or half-day program. For example, Denver provides up to $680 per month per child
to participating providers based on a number of factors, including family income, the quality
rating of the providers, and the receipt of other government subsidies. In Denver, the monthly per
child expenditure does not cover the full cost of providing full-day preschool for any children. In
Los Angeles, the proportion of the full cost covered by LAUP depends primarily on the level of
support the program receives from other sources of publicly funded early care and education,
such as Head Start, Title 5 State Preschool, and state and federally subsidized child care. Table 4
briefly describes the expenditures per child for each initiative.

American Institutes for Research Analysis of Options for Funding Universal Preschool in Sonoma County—9
Table 4. Expenditure per Child for Preschool Initiatives
Preschool Initiative Expenditure per Child
Boston: BPS Early Education; PEG
BPS: $10,000–$15,000 per year per child in FY 2015, depending on whether overhead is included
PEG: $8,000–$16,000 per year per child, depending on whether the child is receiving a government subsidy
Chicago: CPCs Information not available
Denver: DPP $29–$680 per month for full-day programs, depending on family income and provider quality (FY 2016); expenditures are prorated for half- and extended-day programs. Providers vary in terms of the number of months that they provide preschool. Thus, annual per child expenditures could range from $290 to $6,800 for a 10-month program or $348–$8,160 for a 12-month program. During the 2014–15 school year, the average tuition credit was $303 per month for a student attending a full-day program, or approximately $3,030 for a 10-month program.
Elk Grove: Elk Grove Unified School District Preschool
$6,500 per year from Title I funds in FY 2016
Los Angeles: LAUP $96–$495 per month, depending on ZIP code of residence and whether the child is receiving a government subsidy (FY 2014). Los Angeles provides only school-year programs, so the annual per child expenditures for a 10-month program could be approximately $960–$4,950.
New York City: Prekindergarten for All
Funds a full-day school-year program at no cost to families; unable to confirm a per child expenditure
Salt Lake: School Readiness
$1,550 per year for four-year-old children, approximately $900 per year for three-year-old children in 2015
San Antonio: Pre-K 4 SA $14,500 per year for FY 2014–FY 2021 (does not include facilities or professional development costs)
San Francisco: PFA PFA reimburses from $4,950 to $6,000 per year per four-year-old child in FY 2016, based on lead teacher qualifications. In settings where child care subsidies support eligible child enrollment, PFA reimbursements are deducted from the applicable subsidy earnings (such as Alternative Payment Program vouchers, California Department of Education, or Head Start) for that child’s enrollment. In these cases, PFA does not fund the child’s enrollment; rather, PFA funds an “enhancement” to the program, supplementing the subsidy.
Seattle: Seattle Preschool Program
Approximately $13,000 per year for FY 2016–FY 2020
Washington, D.C.: Prekindergarten Enhancement and Expansion Program
$15,372 per year in 2014
West Sacramento: UP4WS Information not available
Note. Information included in this table was either provided during interviews or adapted from Barnett et al. (2015); City of Seattle (2015c); Denver Preschool Program (n.d.); Elk Grove Unified School District (2015); First 5 San Francisco (n.d.); Human Capital Research Collaborative (2014b); Los Angeles Universal Preschool (2014a); New York City Office of the Mayor (2014).

American Institutes for Research Analysis of Options for Funding Universal Preschool in Sonoma County—10
Implementation Status
The preschool initiatives are at varying stages of implementation. For example, in fall 2015, Seattle
was just preparing to launch the first year of its program. In contrast, Denver, Elk Grove, Los
Angeles, San Francisco, the District of Columbia, and West Sacramento are all fully implemented
to the extent that their funding levels will support. Other initiatives are still working to expand
access, such as Boston and San Antonio, and Chicago is attempting both to restore services that
were lost in the past decade and to expand. Table 5 briefly describes the implementation status of
each initiative.
Table 5. Implementation Status of Preschool Initiatives
Preschool Initiative Implementation Status
Boston: BPS Early Education; Boston K1DS
BPS: fully implemented
K1DS: ending its three-year run in November 2015
PEG: preparing a request for proposal for partner organizations and will launch in fall 2015. The city of Boston is considering expansion through a mixed delivery system to provide universal access.
Chicago: CPCs Began in 1967, reached its peak with 25 centers and 1,500 children (prekindergarten–Grade 3) in the 1980s, but cut back to 10 centers serving 670 preschool children by 2009. The 2012 grant allowed the district to reopen six centers and expand others. The Pay for Success initiative will allow another expansion to begin in 2015, adding six classrooms for 374 four-year-old children, increasing to 2,000 children in four years.
Denver: DPP The school-year program is fully implemented with 5,000 children served (about 54% of all eligible children) as of 2013. The 2014 increase allowed additional funding to go toward summer programs.
Elk Grove: Elk Grove Unified School District Preschool
Fully implemented as of 2007
Los Angeles: LAUP Fully implemented as of 2014
New York City: Prekindergarten for All
Fully implemented as of the 2015–16 school year; any four-year-old child who wants to participate in prekindergarten will have that opportunity.
Salt Lake: School Readiness About to begin the third year of a five-year program. Year 1 was the “proof of concept” year, guaranteed by the United Way of Salt Lake and Salt Lake County. Starting in the second year (2014–15), the Pay for Success loan has been guaranteed by the state of Utah.
San Antonio: Pre-K 4 SA About to begin the third year of an eight-year plan
San Francisco: PFA Fully implemented as of 2014
Seattle: Seattle Preschool Program
Prepared for launch in the 2015–16 school year
Washington, D.C.: Prekindergarten Enhancement and Expansion Program
Universal access implemented by 2013–14; focus is now moving to quality improvement.
West Sacramento: UP4WS Fully implemented as of 2010
Note. Information included in this table was either provided during interviews or adapted from City of San Antonio (2015); City of Seattle (2015c); City of West Sacramento (n.d.a); Denver Preschool Program (n.d.); Elk Grove Unified

American Institutes for Research Analysis of Options for Funding Universal Preschool in Sonoma County—11
School District (2015); First 5 San Francisco (n.d.); Harris (2012); Human Capital Research Collaborative (2014b); Los Angeles Universal Preschool (2014a); Nyhan (2013); Samuels & Ash (2014); Seattle Department of Education and Early Learning (2015).
Target Population and Number Children Served
The majority of the preschool initiatives target services to four-year-old children. For example,
Denver, San Antonio, Seattle, San Francisco, Los Angeles, and New York City all primarily
target their four-year-old populations. However, in addition to providing preschool for four-year-
old children, Seattle will provide preschool for three-year-old children who are at 300 percent of
federal poverty level and below. In San Francisco, the reauthorization of PEEF includes a goal of
serving all children in San Francisco less than 6 years old while still giving priority to four-year-
old children. West Sacramento has broadened the goal of its initiative to provide services for
children birth to 5 years old but focused first on providing universal access to four-year-old
children. Given the projected loss of First 5 California funds to support services, the extent of the
expansion in West Sacramento is unclear. The District of Columbia, Salt Lake, and Elk Grove all
provide preschool to three- and four-year-old children.
The preschool initiatives also differ in the extent to which they serve all children in the locality
or, put another way, in the percentage of theoretically eligible children they serve. New York
City is unusual because it aimed from the outset to make preschool available to all four-year-old
children in the city, regardless of family income. Most of the preschool initiatives, however, have
started out by expanding or improving preschool in low-performing school neighborhoods. In
Denver, the program is now fully implemented and serves 54 percent of its four-year-old
children, yet the city estimates that a majority of its funds still go to children who are
disadvantaged. San Francisco, also fully implemented, set a goal of serving 65 percent of its
four-year-old children. Of the children enrolled in San Francisco’s PFA, more than 70 percent
are enrolled in a program that is subsidized by the state or federal government (e.g., Head Start,
Title 5 State Preschool). Boston estimates that its BPS program serves about one half of the four-
year-old children in the city.
Salt Lake does not have a goal of serving children beyond those with high needs, and, in that
sense, it does not really fit our definition of a universal preschool program. San Antonio has so
far limited funds to children who are disadvantaged. CPCs, by virtue of their location within
Title 1 school boundaries, primarily serve low-income families.
Of course, some of the variation in the number of children or the percentage of eligible
population served is explained by the program’s implementation status. Some initiatives chose to
start small and gradually expand to serve their target populations. Seattle, for example, will serve
about 270 children during the first year (2015–16) of its preschool program, with plans to expand
to 2,000 by 2018–19. San Antonio will serve about 3,700 children by 2017, still a relatively
small percentage of the four-year-old children in the city (18.5 percent of approximately 20,000
four-year-old children). Table 6 briefly describes the target population and the number of
children served for each initiative.

American Institutes for Research Analysis of Options for Funding Universal Preschool in Sonoma County—12
Table 6. Target Population and Number of Children Served of Preschool Initiatives
Preschool Initiative
Target Population Number of Children Served
Boston: BPS Early Education; Boston K1DS
Four-year-old children living in Boston, with some slots available to three-year-old children with special needs
BPS: open to all regardless of income
PEG: 200% of the federal poverty level
BPS: 2,400 in 2014, which is about one half the four-year-old population
K1DS: 400 children
PEG: 300–400 children
Chicago: CPCs Children ages 3 through Grade 3 living within Title I school boundaries of the Chicago Public Schools
The goal is 2,000 slots for three- and four-year-old children, starting with 374 four-year-old children in 2015.
Denver: DPP Four-year-old children living in Denver
About 5,000 in 2015 (54% of the four-year-old population)
Elk Grove: Elk Grove Unified School District Preschool
Three- and four-year-old children living within Title I school boundaries of the Elk Grove district, with priority to older children
In the 2015–16 school year, 200 children in 10 classrooms at eight school sites
Los Angeles: LAUP
Four-year-old children who are residents of Los Angeles County
11,000 in 2014
New York City: Prekindergarten for All
Four-year-old children living in the five boroughs
53,000 four-year-olds in full-day programs, 2014–15 school year
Salt Lake: School Readiness
Three- and four-year-old children who are eligible for free and reduced lunch; Granite School District also considers additional risk factors (e.g., parents with less than a high school education).
Six hundred in 2013–14, 750 per year in 2014–16, 1,000 per year from 2016 to the end of the grant period. (Granite School District serves approximately 3,000 children overall in its preschool programs, and the director of the program estimates that the district serves about 50% of the three- to four-year-old population in district boundaries.)
San Antonio: Pre-K 4 SA
Four-year-old children living in San Antonio, with universal access as goal but currently limited to four high-needs areas
Seven hundred in 2013–14 and 1,500 in 2014–15; plans to ramp up to 3,700 per year by 2017.
San Francisco: PFA
Four-year-old children living in San Francisco; universal access with a special focus on low-income neighborhoods
4,000 (in 2014–15)
Seattle: Seattle Preschool Program
Three- and four-year-old children living in Seattle; open to all four-year-old children and to three-year-old children at 300% of the federal poverty level and below; targets neighborhoods with low-performing schools.
About 270 in 2015–16, ramping up to 2,000 by 2018–19

American Institutes for Research Analysis of Options for Funding Universal Preschool in Sonoma County—13
Preschool Initiative
Target Population Number of Children Served
Washington, D.C.: Prekindergarten Enhancement and Expansion Program
Three- and four-year-old children living in the District of Columbia
A total of 12,426 in 2013–14 (86% of all three- and four-year-old children in the District of Columbia); the district has the capacity to serve 95% of the preschool-age population.
West Sacramento: UP4WS
Access to affordable preschool for all four-year-olds. Eventual goal of offering access to all children 0–5 years old living in West Sacramento, with subsidies to children from low-income families.
Approximately 160 infants and toddlers and 200 three-year-old children in 2015; unable to determine the total number of four-year-old children served because enrollment in partner programs is not tracked. However, according to the city, access to affordable preschool for all four-year-old children is now in place.
Note. Information included in this table was either provided during interviews or adapted from Boston Public Schools (n.d., 2015); City of San Antonio (2015); City of Seattle (2015c); City of West Sacramento (n.d.a); Denver Preschool Program (n.d.); Elk Grove Unified School District (2015); First 5 San Francisco (n.d.); Los Angeles Universal Preschool (2014a); New York City Office of the Mayor (2014); Office of the State Superintendent of Education (n.d.); Seattle Department of Education and Early Learning (2015).
Hours and Days of Operation
Among the preschool initiatives, three main categories of preschool exist in terms of hours of
operation: (1) half-day programs that operate up to four hours per day; (2) full-day programs that
operate up to 6.5 hours per day (the typical school day); and (3) full-day programs that operate
eight to 10 hours per day, which is more similar to the schedules of working parents. Half-day
programs are usually operated in two sessions: morning and afternoon. Some of the initiatives
examined offer exclusively half- or full-day (defined as up to 6.5 hours) preschool, whereas
others provide parents with the option of either half- or full-day preschool. The initiatives that
either offer up to 6.5 hours or require it from their providers are San Antonio, Seattle, the District
of Columbia, Boston, and New York City. The initiatives offering only half-day programs are
Los Angeles, Salt Lake, Elk Grove, and Chicago. Denver, West Sacramento, and San Francisco
support both half-day and full-day (defined as up to 6.5 hours) programs at varying levels. None
of the initiatives we studied defined a full day as eight or more hours, although San Antonio is
notable for providing free extended care services both before and after hours to those families
who need it.
Most of the initiatives examined operate or fund preschool only during the school year, although
a few, such as Denver, provide some funding for programs that operate during the summer. Most
of the programs profiled offer preschool classes five days per week. Salt Lake is an exception,
with classes provided four days per week to four-year-old children and two days per week for
three-year-old children. Table 7 briefly describes the hours and days of operation for each
initiative.

American Institutes for Research Analysis of Options for Funding Universal Preschool in Sonoma County—14
Table 7. Hours and Days of Operation of Preschool Initiatives
Preschool Initiative Hours and Days of Operation
Boston: BPS Early Education; Boston K1DS (PEG)
BPS: school day (six hours), school year only
K1DS/PEG: full day (10 hours), year round
Chicago: CPCs Half day, school year
Denver: DPP Full-day and partial-day programs; varies depending on providers; expanded to summer programs in June 2015
Elk Grove: Elk Grove Unified School District Preschool
Partial-day, school-year programs; morning, afternoon, and twilight sessions
Los Angeles: LAUP Half-day, school-year programs, with morning and afternoon sessions; exact hours depend on the providers.
New York City: Prekindergarten for All
Full-day (six hours and 20 minutes) programs, five days per week, school year
Salt Lake: School Readiness Half-day, school-year program: four days per week for four-year-old children and two days per week for three-year-old children; morning and afternoon sessions
San Antonio: Pre-K 4 SA Full-day program (8 a.m.–3 p.m.) with extended care hours (7:15 a.m.–6 p.m.) from late August through early June; no summer program
San Francisco: PFA Offers half- and full-day programs; exact schedule and child care options, including summer hours, depend on the provider.
Seattle: Seattle Preschool Program
Full-day program, six hours per day, five days per week; school-year and year-round programs
Washington, D.C.: Prekindergarten Enhancement and Expansion Program
Full-day (6.5 hours), school-year programs, five days per week
West Sacramento: UP4WS Partial-day and full-day, school-year and full-year programs, some with extra child care hours
Note. Information included in this table was either provided during interviews or adapted from Boston Public Schools (n.d., 2015); City of San Antonio (2015); City of Seattle (2015c); City of West Sacramento (n.d.a); Denver Preschool Program (n.d.); Elk Grove Unified School District (2015); First 5 San Francisco (n.d.); Los Angeles Universal Preschool (2014b); New York City Office of the Mayor (2014); Office of the State Superintendent of Education (n.d.).
Family Fees
Of the 12 preschool initiatives profiled, 50 percent charge fees to at least some parents who
participate, and 50 percent do not charge any fees. In Salt Lake, parents whose children are
eligible to participate in the Pay for Success program are not charged fees, although there may be
fee-paying children in the same classrooms. All programs that charge fees apply a sliding scale
based on income, and most are free to children meeting defined eligibility guidelines, such as
living at a certain percentage of the federal poverty level or eligibility for free or reduced-price
lunch. Typically, parent fees are paid directly to the preschool provider, whether that is the
initiative itself (San Antonio) or a partner provider (e.g., Denver, San Francisco, and Los
Angeles). Table 7 briefly describes the family fees for each initiative.

American Institutes for Research Analysis of Options for Funding Universal Preschool in Sonoma County—15
Table 8. Family Fees for Preschool Initiatives
Preschool Initiative Family Fees
Boston: BPS Early Education; Boston K1DS
None
Chicago: CPCs None
Denver: DPP Sliding scale based on income and quality level of preschool chosen (higher quality preschools receive larger subsidy)
Elk Grove: Elk Grove Unified School District Preschool
None
Los Angeles: LAUP None for children receiving a government subsidy; parent investment fee for others, based on ZIP code (waivers granted for eligible parents)
New York City: Prekindergarten for All
None
Salt Lake: School Readiness
None for children covered by the Pay for Success bond. Families that do not qualify for participation through Title I can pay the full fee of $1,550 (for the four-year-old program) if slots are available in the district. Families also pay full fees if they live outside the district or are not eligible for the Pay for Success funding.
San Antonio: Pre-K 4 SA
Free to children who meet Texas eligibility requirements (e.g., eligible for free or reduced-price lunch) and live in participating districts; sliding scale tuition to children chosen by lottery, including qualifying children living outside participating districts
San Francisco: PFA No fee for half-day programs; full-day programs are discounted, usually at approximately 25%. Parents who can afford to pay are encouraged to donate their credit back to the preschool program to serve as a scholarship fund. Note: Programs are directly reimbursed per eligible enrollment.
Seattle: Seattle Preschool Program
Free to children from families at 300% of the federal poverty level, sliding scale for all others
Washington, D.C.: Prekindergarten Enhancement and Expansion Program
None
West Sacramento: UP4WS Sliding scale based on income for city-run programs
Note. Information included in this table was either provided during interviews or adapted from Boston Public Schools
(2015); City of San Antonio (2015); City of Seattle (2015c); Denver Preschool Program (n.d.); Elk Grove Unified School District (2015); First 5 San Francisco (n.d.); Los Angeles Universal Preschool (2014b); New York City Office of the Mayor (2014); Office of the State Superintendent of Education (n.d.).
Providers or Facilities
The preschool initiatives we examined fall into two broad categories: mixed delivery systems
and single provider systems. In a mixed-delivery system, preschool services are delivered by
different types of providers, such as public schools, private schools, for-profit schools,
community nonprofit centers, faith-based organizations, charter schools, or family child care
homes. In a single provider system, all providers are of the same type or there is only one
provider as in a district.

American Institutes for Research Analysis of Options for Funding Universal Preschool in Sonoma County—16
Of the preschool initiatives we profiled, only BPS Early Education, Elk Grove Unified School
District, and CPCs operate on a single provider system, in each case a public district, although
Boston is moving toward a mixed-delivery model. The remaining nine initiatives operate on
some level of mixed delivery or, in the case of San Antonio, will be launching its mixed delivery
component in the 2016–17 school year. Not every initiative is open to all types of partner
providers. For example, some initiatives do not currently partner with family child care providers
(including Seattle, the District of Columbia, and New York City). In almost all cases, partner
providers are required to go through a competitive application process and meet certain quality
standards (see Table 9 for more details). Two of these mixed delivery preschool initiatives (San
Antonio and West Sacramento) operate their own preschool classrooms and fund (or plan soon to
fund) partner providers.
Table 9. Providers or Facilities for Preschool Initiatives
Preschool Initiative Providers/Facilities
Boston: BPS Early Education; Boston K1DS (PEG)
BPS: Currently public schools only, although looking at expanding to a mixed delivery system
K1DS/PEG: Community providers chosen through a competitive process
Chicago: CPCs Selected Chicago Public Schools Title I schools
Denver: DPP Two hundred fifty partner preschools, including public, private, community, and faith-based organizations
Elk Grove: Elk Grove Unified School District Preschool
Elk Grove Unified School District Title I schools
Los Angeles: LAUP Public, private, community, charter, and home-based providers
New York City: Prekindergarten for All
District schools and community providers provide services. Participating community providers are referred to as New York City Early Education Centers, which are selected through a competitive application process. District schools offer classes at both regular elementary schools and at prekindergarten centers that exclusively serve preschool children.
Salt Lake: School Readiness Six programs, operated by Granite School District (Salt Lake City), Park City School District, a nonprofit community organization (YMCA), two for-profits organizations (Smart Kids & Lit’l Scholars), and one charter school (Guadalupe). Most children (624 in 2015–16) are served by Granite School District.
San Antonio: Pre-K 4 SA
Currently four model centers built and operated by Pre-K 4 SA; will expand to qualified public and private providers starting in 2016.
San Francisco: PFA Qualified public, private, and family providers receive grants based on the number of qualifying children served and based on the availability of funding; priority funding for underserved neighborhoods.
Seattle: Seattle Preschool Program Public and private providers; schools and providers apply for eligibility. CBOs are selected though a competitive process, and public schools may contract directly without competing.
Washington, D.C.: Prekindergarten Enhancement and Expansion Program
District of Columbia Public Schools, charter schools, and CBOs

American Institutes for Research Analysis of Options for Funding Universal Preschool in Sonoma County—17
Preschool Initiative Providers/Facilities
West Sacramento: UP4WS Two centers operated by the city; partner providers, including the district and CBOs, operate other centers.
Note. Information included in this table was either provided during interviews or adapted from Boston Public Schools (n.d., 2015); City of San Antonio (2015); City of Seattle (2015c); Denver Preschool Program (n.d.); Elk Grove Unified School District (2015); First 5 San Francisco (n.d.); Human Capital Research Collaborative (2014b); Los Angeles Universal Preschool (2014b); Office of the State Superintendent of Education (n.d.).
Administering Entity
Preschool initiatives can be administered through various types of agencies, such as a district, an
office or agency within the local government (typically a local district or local education
agency), or an independent nonprofit organization. The initiatives in our study are split almost
evenly among these different types of agencies. Boston, Elk Grove, and Chicago are initiatives
operated by a district. Seattle, West Sacramento, the District of Columbia, and New York City
are initiatives administered by a city agency. Denver, San Antonio, and Los Angeles are
initiatives administered by a nonprofit organization. Until recently, San Francisco’s initiative has
been administered by First 5 San Francisco, but it is being transferred to a city government
office. The Salt Lake initiative is different from the others because no single, overarching
administrator manages the initiative. Six providers operate their programs independently; the
United Way of Salt Lake, a nonprofit organization, facilitates communication between the
programs, the investors, and the backing agency.
Except for the public districts and two other initiatives (West Sacramento and San Antonio), the
administering agency does not operate any preschool classrooms. Instead, this agency is typically
responsible for distributing funds and managing quality initiatives. Table 10 briefly describes the
administering entity for each initiative.
Table 10. Administering Entity for Preschool Initiatives
Preschool Initiative Who Administers
Boston: BPS Early Education; Boston K1DS
BPS
Chicago: CPCs Chicago Public Schools
Denver: DPP DPP, an independent nonprofit organization under contract to the city
Elk Grove: Elk Grove Unified School District Preschool
Elk Grove Unified School District
Los Angeles: LAUP LAUP is an independent nonprofit created by First 5 Los Angeles.
New York City: Prekindergarten for All
New York City Department of Education
Salt Lake: School Readiness United Way of Salt Lake is the intermediary for the Pay for Success bond. Individual providers operate the programs.
San Antonio: Pre-K 4 SA Pre-K 4 SA is nonprofit organization legally separate from the city but works closely with the mayor’s office.
San Francisco: PFA Initially First 5 San Francisco, transitioning to the city-run Office of Early Care and Education

American Institutes for Research Analysis of Options for Funding Universal Preschool in Sonoma County—18
Preschool Initiative Who Administers
Seattle: Seattle Preschool Program
Department of Education and Early Learning, City of Seattle
Washington, D.C.: Prekindergarten Enhancement and Expansion Program
Division of Early Learning, part of the Office of the State Superintendent of Education
West Sacramento: UP4WS Early Learning Services Division, City of West Sacramento
Note. Information included in this table was either provided during interviews or adapted from Boston Public Schools (n.d., 2015); City of San Antonio (2015); City of Seattle (2015c); City of West Sacramento (n.d.a); Denver Preschool Program (n.d.); Elk Grove Unified School District (2015); First 5 San Francisco (n.d.); Los Angeles Universal Preschool (2014a); Office of the State Superintendent of Education (n.d.).
Phase-In Plan
The length of the phase-in plans for the preschool initiatives varies widely. Some initiatives (e.g.,
San Francisco) phased in gradually during a 10-year period. Other initiatives (e.g., Denver, New
York City) attempted to serve their target populations during the first year of implementation.
Interestingly, most of the initiative directors we interviewed, including those who had attempted
a rapid implementation, advised a gradual phase-in to allow time for quality improvement and
obtaining sufficient facilities. Table 11 briefly describes the phase-in plans for each initiative.
Table 11. Phase-In Plans for Preschool Initiatives
Preschool Initiative
Phase-In Plan
Boston: BPS Early Education; Boston K1DS
BPS: In 2005, the city of Boston provided 700 free preschool slots, mostly in inclusive classrooms. By 2010, 85% of the elementary schools had at least one preschool classroom, with more than 2,000 slots for four-year-old children. As of 2015, 95% of the elementary schools have a preschool classroom, with 2,400 slots available. Currently cannot expand further because of space and budget limitations.
PEG: Starting with 15–20 classrooms in fall 2015, depending on possible foundation funding. May expand further if the city decides to fund a mixed delivery program to increase slots in BPS.
Chicago: CPCs Information not available
Denver: DPP None; open to all Denver four-year-old children at the start of operations.
Elk Grove: Elk Grove Unified School District Preschool
Started as a twilight program in conjunction with adult education programs in six schools. As the adult education program was phased out, preschool moved into more classrooms during the day. In the 2015–16 school year, the district will have 10 Title I–funded classrooms in eight schools. All of these schools also have other preschool classrooms funded by Head Start or Title 5 State Preschool.
Los Angeles: LAUP
In 2002, adopted a goal of universal preschool for four-year-old children by 2014. Received a Power of Preschool grant in 2006 and started by targeting areas of greatest need by ZIP code. In 2007, created 4,034 new slots and 4,360 upgraded slots.
New York City: Prekindergarten for All
During the 2014–15 school year, expanded existing slots from half day to full day, added new slots, and improved the quality of existing full-day slots.
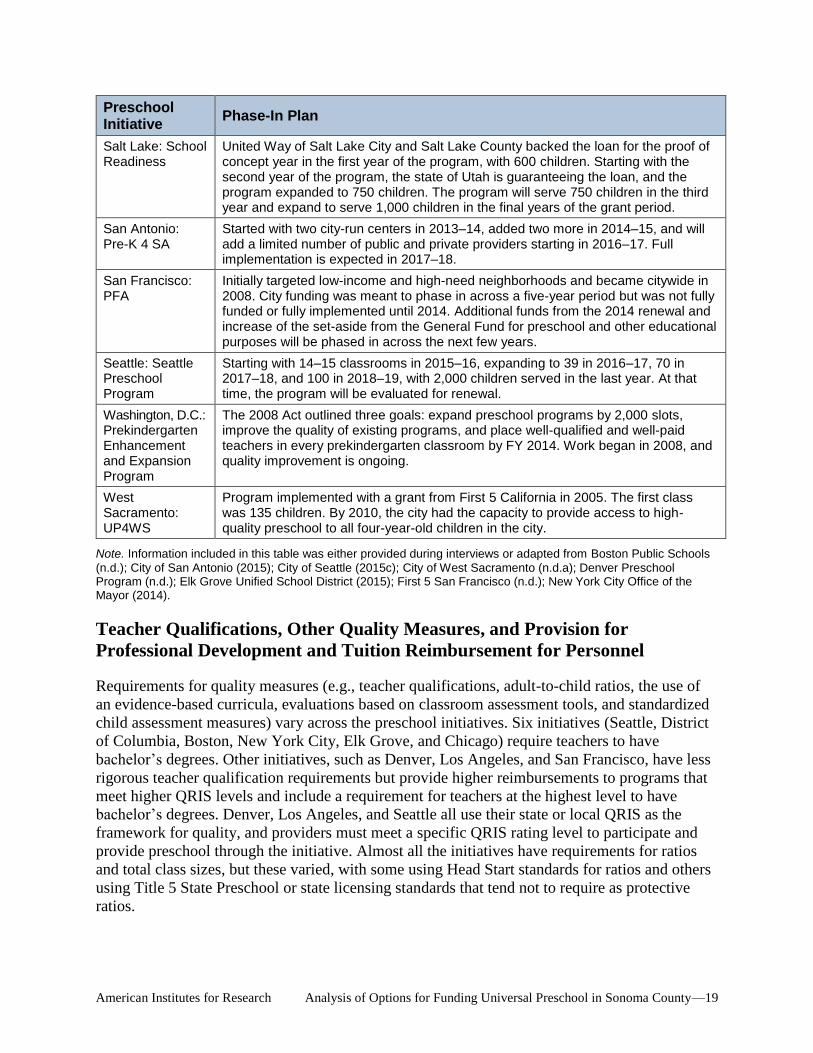
American Institutes for Research Analysis of Options for Funding Universal Preschool in Sonoma County—19
Preschool Initiative
Phase-In Plan
Salt Lake: School Readiness
United Way of Salt Lake City and Salt Lake County backed the loan for the proof of concept year in the first year of the program, with 600 children. Starting with the second year of the program, the state of Utah is guaranteeing the loan, and the program expanded to 750 children. The program will serve 750 children in the third year and expand to serve 1,000 children in the final years of the grant period.
San Antonio: Pre-K 4 SA
Started with two city-run centers in 2013–14, added two more in 2014–15, and will add a limited number of public and private providers starting in 2016–17. Full implementation is expected in 2017–18.
San Francisco: PFA
Initially targeted low-income and high-need neighborhoods and became citywide in 2008. City funding was meant to phase in across a five-year period but was not fully funded or fully implemented until 2014. Additional funds from the 2014 renewal and increase of the set-aside from the General Fund for preschool and other educational purposes will be phased in across the next few years.
Seattle: Seattle Preschool Program
Starting with 14–15 classrooms in 2015–16, expanding to 39 in 2016–17, 70 in 2017–18, and 100 in 2018–19, with 2,000 children served in the last year. At that time, the program will be evaluated for renewal.
Washington, D.C.: Prekindergarten Enhancement and Expansion Program
The 2008 Act outlined three goals: expand preschool programs by 2,000 slots, improve the quality of existing programs, and place well-qualified and well-paid teachers in every prekindergarten classroom by FY 2014. Work began in 2008, and quality improvement is ongoing.
West Sacramento: UP4WS
Program implemented with a grant from First 5 California in 2005. The first class was 135 children. By 2010, the city had the capacity to provide access to high-quality preschool to all four-year-old children in the city.
Note. Information included in this table was either provided during interviews or adapted from Boston Public Schools
(n.d.); City of San Antonio (2015); City of Seattle (2015c); City of West Sacramento (n.d.a); Denver Preschool Program (n.d.); Elk Grove Unified School District (2015); First 5 San Francisco (n.d.); New York City Office of the Mayor (2014).
Teacher Qualifications, Other Quality Measures, and Provision for
Professional Development and Tuition Reimbursement for Personnel
Requirements for quality measures (e.g., teacher qualifications, adult-to-child ratios, the use of
an evidence-based curricula, evaluations based on classroom assessment tools, and standardized
child assessment measures) vary across the preschool initiatives. Six initiatives (Seattle, District
of Columbia, Boston, New York City, Elk Grove, and Chicago) require teachers to have
bachelor’s degrees. Other initiatives, such as Denver, Los Angeles, and San Francisco, have less
rigorous teacher qualification requirements but provide higher reimbursements to programs that
meet higher QRIS levels and include a requirement for teachers at the highest level to have
bachelor’s degrees. Denver, Los Angeles, and Seattle all use their state or local QRIS as the
framework for quality, and providers must meet a specific QRIS rating level to participate and
provide preschool through the initiative. Almost all the initiatives have requirements for ratios
and total class sizes, but these varied, with some using Head Start standards for ratios and others
using Title 5 State Preschool or state licensing standards that tend not to require as protective
ratios.

American Institutes for Research Analysis of Options for Funding Universal Preschool in Sonoma County—20
The preschool initiatives also vary in the degree to which they provide professional development
or tuition reimbursement to encourage teachers to obtain more education. San Antonio, Boston,
and Salt Lake offer the most in terms of professional development. These three initiatives
provide regular coaching and professional development. San Antonio also offers tuition credits
to preschool teachers taking courses leading toward degrees.
Finally, many of the preschool initiatives require that programs receive an independent
assessment of quality using the Early Childhood Environment Rating Scale (ECERS) or the
Classroom Assessment Scoring System (CLASS). Scores on these assessments are factored into
the overall quality rating of the program in Denver, Los Angeles, San Francisco, and Seattle,
with the assessment also used as a foundation for professional development.
Table 12 briefly describes teacher qualifications, other quality measures, and provision for
professional development or tuition reimbursement as an incentive for professional development
for each initiative.

American Institutes for Research Analysis of Options for Funding Universal Preschool in Sonoma County—21
Table 12. Teacher Qualifications, Other Quality Measures, and Provision for Professional Development and Tuition
Reimbursement for Preschool Initiatives
Preschool Initiative
Teacher Qualifications Other Quality Measures Provision for Professional Development or Tuition Reimbursement
Boston: BPS Early Education; Boston K1DS
BPS: Teachers must meet same requirements as K–12 teachers (bachelor’s degree and credential with plans to receive a master’s degree within five years).
K1DS: Teachers must have a bachelor’s degree in early childhood education.
BPS: Working toward National Association for the Education of Young Children (NAEYC) accreditation for all district-operated classrooms (currently 30 are accredited). Staff-to-child ratio of 2:22, negotiated by union contract because teachers have master’s degrees.
K1DS/PEG: Must be licensed by the state and either NAEYC accredited or working toward accreditation; staff-to-child ratio of 2:20.
All programs: Must use standard curriculum, OWL and Building Blocks, which is aligned with BPS kindergarten curriculum. Teacher coaching and observations. Required to allow time for professional development.
Professional development opportunities offered through the public school system and paid for by PEG. BPS also offers extensive curriculum training and coaching, with one coach per every 10 classrooms.
Chicago: CPCs Each center has one head teacher with certification and a bachelor’s degree or higher. Classroom teachers also must be certified with a bachelor’s degree. Assistants have an associate’s degree, 60 hours in early childhood education, or a Child Development Associate credential.
Class size limited to 17 with at least two teaching staff. Curriculum is aligned with the associated elementary school program. Parent engagement standards include at least 2.5 hours per week of participation.
Provides coaching and at least two professional development sessions per year.

American Institutes for Research Analysis of Options for Funding Universal Preschool in Sonoma County—22
Preschool Initiative
Teacher Qualifications Other Quality Measures Provision for Professional Development or Tuition Reimbursement
Denver: DPP No single requirement exists, although teacher qualifications are taken into account by the Colorado Shines QRIS, and programs must have a Level 3 QRIS rating or be taking specific measures to reach that rating to participate in the initiative.
Programs are evaluated and rated by Colorado Shines, NAEYC, or the National Association of Family Child Care. Programs must have a Level 3 Colorado Shines QRIS rating or be taking specific measures to reach that rating. Teacher qualifications, adult-to-child ratios, classroom size, curriculum, and other quality measures are considered as part of the rating process.
Each program receives a quality improvement plan from DPP. Depending on need, DPP invests in coaching, tuition, or other professional development activities.
Elk Grove: Elk Grove Unified School District Preschool
Credentialed teachers with a bachelor’s degree and 12 hours of early childhood education; newly hired assistants are required to have 48 college units or an associate’s degree. Five teachers without bachelor’s degrees were grandfathered into the system.
Individual classrooms meet standards for their specific funding source: Head Start classrooms meet Head Start standards, and Title 5 State Preschool classrooms meet state standards. Title I classrooms meet state licensing requirements, with a classroom size of 20 and a staff-to-child ratio of 1:10.
Professional development opportunities are provided through Race to the Top funds.
Los Angeles: LAUP
The lead teacher must hold a Child Development Teacher permit,a and assistants must have a Child Development Assistant permit. For QRIS Level 4 programs, lead teachers must have an associate’s degree in early childhood education or a related field; for QRIS Level 5 programs, lead teachers must have a bachelor’s degree.
Staff-to-child ratio of 1:8, with at least one adult qualifying as a lead teacher. NAEYC-accredited programs with at least a five-star rating may operate at 1:20. The maximum class size is 24. Programs must follow one of eight approved curricula or follow the Montessori or Reggio Emilia approach. Quality certification through QRIS is required, and higher rated programs receive higher reimbursements.
Program support specialists offer training opportunities and facilitate learning communities for teachers.

American Institutes for Research Analysis of Options for Funding Universal Preschool in Sonoma County—23
Preschool Initiative
Teacher Qualifications Other Quality Measures Provision for Professional Development or Tuition Reimbursement
New York City: Prekindergarten for All
All teachers must have a bachelor’s degree and either early childhood certification or be on track to get it within three years. No grace period exists after the three years are passed.
All programs are evaluated using ECERS and CLASS evaluations. Class sizes and ratios are based on Department of Health regulations. The curriculum must meet New York State Common Core requirements for preschool, and programs must meet requirements for parent engagement. All programs must be licensed and receive regular safety inspections.
Professional development and trainings offered by the New York City Department of Education throughout the school year, as well as on-site support at both the classroom and the program levels. Past partnership with City University of New York (CUNY) helps teachers become certified. CUNY’S Early Childhood Professional Development Institute advises teachers and provides professional development resources.
Salt Lake: School Readiness
Lead teachers must have at least a Child Development Associate credential or an associate’s degree in early childhood education or a related field. Many lead teachers have bachelor’s degrees. Assistant teachers often have Child Development Associate credentials, but only a high school diploma is required.
Adult-to-child ratio of 1:10 is required. The We Can! Early Childhood Curriculum is an evidence-based curriculum. Special education consultants, speech-language pathologists, and other service providers provide additional support.
Teachers receive monthly evidence-based professional development and coaching. No monetary support is provided for teachers to attain bachelor’s degrees, but the program provides release time and other in-kind support for teachers working on their degrees.
San Antonio: Pre-K 4 SA
Teachers must be certified in early childhood education. Most have bachelor’s degrees; some have master’s degrees. Assistants must have Child Development Associate credential or an associate’s degree. All are required to have at least three years of early childhood teaching experience (most have much more).
Classroom ratio of 2:20, with eight floating assistants. Unable to confirm additional quality measures.
Offers coaching and tuition credits. Holds free on-site training sessions that also are open to preschool teachers throughout the state of Texas.

American Institutes for Research Analysis of Options for Funding Universal Preschool in Sonoma County—24
Preschool Initiative
Teacher Qualifications Other Quality Measures Provision for Professional Development or Tuition Reimbursement
San Francisco: PFA
The minimum qualifications for a lead teacher include a California Child Development Permit at the teacher level (24 units of early childhood education and child development including core courses plus 16 general education units); the second teacher must be at least an associate teacher, and the third teacher must be at least an assistant teacher. Each site also must have a program director with a bachelor’s degree or a site director with a California Commission on Teacher Credentialing Site Supervisor Permit for agencies operating multiple sites. Program or site directors must have 24 early childhood education and child development units (including core) plus six units of administration and two units of adult supervision. Family child care programs are exempt from the program director qualifications but must meet the lead teacher qualifications.
All preschool classrooms must have a minimum score of 4.50 on ECERS or the Family Child Care Environment Rating Scale (FCCERS) and must maintain a score of 4.00 across the entire facility. Curriculum documentation also must be provided. Classroom size of no more than 24, staff-to-child ratio of 1:8 (or 1:10 for Head Start or Title 5 State Preschool).
Professional development supports are developed by citywide trend data from CLASS/ECERS, and cohorts are formed as professional learning communities (project, dual language, science, and curriculum). Sites may choose from a menu of options and must commit to setting aside funding from their PFA budget for release time of staff (one session per month). Also provides on-site coaching. Every participating program must have a quality improvement plan that is linked to their professional development and the PFA budget.

American Institutes for Research Analysis of Options for Funding Universal Preschool in Sonoma County—25
Preschool Initiative
Teacher Qualifications Other Quality Measures Provision for Professional Development or Tuition Reimbursement
Seattle: Seattle Preschool Program
Lead teachers: Bachelor’s degree in early childhood education or a bachelor’s degree and a Washington State teaching certificate with a P–3 endorsement.
Assistant teachers: Associate’s degree in early childhood education or two years of coursework in early childhood education meeting Washington State Core Competencies for Early Care and Educational Professionals.
Teachers have four years to meet these requirements. Tuition support is provided.
All programs must have a QRIS rating of at least 3. A six-hour day is required. The maximum class size is 20, with a 1:10 adult-to-child ratio. Programs must offer one of two approved curriculums (High Scope or Creative), and curriculum training is required.
Tuition assistance is available. High Scope and Creative curriculum training is offered at no cost to providers, along with other professional development opportunities and on-site coaching.
Washington, D.C.: Prekindergarten Enhancement and Expansion Program
Must have bachelor’s degree or (for nonpublic schools) an associate’s degree with plans to get a bachelor’s degree by September 2017.
Assistant teachers must have associate’s degree, 48 credits, or a paraprofessional credential.
A Child Development Associate credential is acceptable only for nonpublic schools. Charter schools do not have specific teacher requirements.
Classroom sizes no larger than 20 for four-year-old children and 16 for three-year-old children. Staff-to-child ratio of 2:16 for three-year-old children and 2:20 for four-year-old children. Mixed-age classrooms follow the standards for three-year-olds. Participating CBO programs must be nationally accredited. All programs operated by public schools or CBOs use a curriculum aligned with the District of Columbia Public Schools early learning standards and perform required developmental screenings. Charter schools are not bound by these requirements, but they undergo regular reviews by the District of Columbia Public School Charter Board.
Offers free and low-cost training sessions, including free Child Development Associate credential trainings with books and other materials included. The University of the District of Columbia also offers a scholarship fund, initially funded by the Initiative, which covers the cost of classes and books for teachers seeking certification or advanced degrees.

American Institutes for Research Analysis of Options for Funding Universal Preschool in Sonoma County—26
Preschool Initiative
Teacher Qualifications Other Quality Measures Provision for Professional Development or Tuition Reimbursement
West Sacramento: UP4WS
Master teachers or program directors (i.e., site directors) will possess (or be in the process of obtaining) bachelor’s degrees in early childhood education and child development. Assistant teachers will possess associate’s degrees with 24 core early childhood education units. Any teaching staff not meeting the above requirements must follow a written plan to satisfy them by 2015.
All programs must receive passing scores on ECERS, FCCERS, or the Infant/Toddler Environment Rating Scale, as determined by the city of West Sacramento, and must complete CLASS evaluations. Teacher-to-child ratio of 2:20 or 3:24 at preschools (lower for toddlers and infants). Programs that exceed minimum requirements receive higher reimbursements.
None specifically, but partner organizations often use funds from UP4WS for professional development purposes.
Note. Information included in this table was either provided during interviews or adapted from Barnett et al. (2015); Boston Public Schools (n.d., 2015); City of
Seattle (2015c); City of West Sacramento (n.d.b); Denver Preschool Program (n.d.); Elk Grove Unified School District (2015); First 5 San Francisco (n.d.); Human Capital Research Collaborative (2014a); Los Angeles Universal Preschool (2014b).
aThe Child Development Permit is a document that authorizes service in the care, development, and instruction of children in a child care and development program. It verifies that the individual has fulfilled the requirements established by the Commission on Teacher Credentialing for assisting, teaching, or supervising in a child development program in the state of California. A provider must have a permit to be eligible for child care and development teaching or administrative positions funded by California Department of Education’s Child Development Division.

American Institutes for Research Analysis of Options for Funding Universal Preschool in Sonoma County—27
Political Leadership
Almost every initiative we studied had a local politician or other leader who took on preschool as
a cause. In several cases, a city mayor or other elected official acted as an advocate for the
preschool program. For example, Mayors John Hickenlooper and Michael Hancock of Denver,
Julián Castro of San Antonio, Ed Murray of Seattle, and Christopher Cabaldon of West
Sacramento, as well as City Council President Tim Burgess of Seattle and County Supervisor
Tom Ammiano of San Francisco, were particularly instrumental in helping pass ballot initiatives
relating to preschool programs in their cities. Mayors also have influenced the creation of
preschool initiatives in other ways, such as Bill de Blasio of New York City encouraging the
state legislature to drastically increase funding for the state’s universal preschool program or
Mayors Tom Menino and Martin Walsh working with the local district to expand preschool
opportunities in Boston (Table 13).
Community organizers and education advocates also provide key leadership in many localities.
Particularly potent is the combination of advocacy with elected leaders, as in Salt Lake City,
where the local United Way and local education leaders worked together to convince the state to
back Pay for Success initiatives, or in Washington, D.C., where then-Council Chair Vincent
Gray joined with advocacy groups to help pass the 2008 city council measure that funded
universal preschool in that city.
Table 13. Political Leadership for Preschool Initiatives
Preschool Initiative Political Leadership
Boston: BPS Early Education; Boston K1DS
Former Mayor Thomas Menino and current Mayor Martin Walsh
Chicago: CPCs Original CPCs: former CPS Superintendent Lorraine Sullivan
Pay for Success expansion: Mayor Rahm Emanuel
Denver: DPP Former Mayor John Hickenlooper (now governor of Colorado; initial program) and current Mayor Michael Hancock (2014 expansion)
Elk Grove: Elk Grove Unified School District Preschool
Elizabeth Pinkerton, long-time district teacher and administrator, and Dave Gordon, district superintendent from 1995 to 2004
Los Angeles: LAUP LAUP board and leadership team
New York City: Prekindergarten for All
Mayor Bill de Blasio
Salt Lake: School Readiness
United Way of Salt Lake, Voices for Utah Children, Salt Lake County Mayor Ben McAdams, State Representative Greg Hughes
San Antonio: Pre-K 4 SA Mayor Julián Castro, local business leaders
San Francisco: (PFA Community organizers, former County supervisor Tom Ammiano
Seattle: Seattle Preschool Program
City Council President Tim Burgess and Mayor Ed Murray
Washington, D.C.: Prekindergarten Enhancement and Expansion Program
Former District of Columbia Council Chair Vincent Gray (later mayor), current Mayor Muriel Bowser, and various community organizations and nonprofit organizations

American Institutes for Research Analysis of Options for Funding Universal Preschool in Sonoma County—28
Preschool Initiative Political Leadership
West Sacramento: UP4WS
Mayor Christopher Cabaldon
Note. Information included in this table was either provided during interviews or adapted from Boston Public Schools (2015); City of Seattle (2015b); City of West Sacramento (n.d.a); Connors (2014); Dardick & Perez (2014); Denver Preschool Program (n.d.); Elk Grove Unified School District (2015); First 5 San Francisco (n.d.); Goldsmith (2008); Haskins (2014); New York City Office of the Mayor (2014); United Way of Salt Lake (2014); U.S. Conference of Mayors (2014a, 2014b); Watson (2010).

American Institutes for Research Analysis of Options for Funding Universal Preschool in Sonoma County—29
Analysis of Potential Funding Sources
Both benefits and challenges are associated with the various funding sources for financing
universal preschool. The following sections briefly review the attributes of the primary funding
mechanisms used by the preschool initiatives we studied, including sales taxes, property taxes,
set-asides from city budgets, Pay for Success bonds, and Title I. We also discuss business
involvement in direct funding as well as advocacy for publicly funded early care and education
initiatives.
Sales Tax
Denver, San Antonio, and West Sacramento fund their preschool programs—at least in part—
through a voter-approved, dedicated sales tax. According to the stakeholders interviewed,
Denver successfully imposed a sales tax in 2006, after two prior efforts failed, by undertaking an
extensive public education campaign that promoted the value of preschool to its citizens. The
initial 2006 measure in Denver passed narrowly, winning 50.6 percent of the vote (50 percent
was required for the measure to pass; Murray, 2014). A renewal and expansion of the preschool
measure in 2014 won by a much more comfortable margin, garnering 55 percent of the vote
(Robles, 2014).
San Antonio’s tax passed in 2012 with 53 percent of the vote (Baugh & Cesar, 2012). West
Sacramento’s sales tax was a general sales tax, and only some of the revenues are dedicated to
preschool services (City of West Sacramento, 2006). The tax passed with 64.5 percent of the
vote (Yolo Elections Office, n.d.a), and the advisory measure connected to it passed with
82.3 percent of the vote (Yolo Elections Office, n.d.b).
California has a complicated tax structure, with strict rules about how taxes may be raised. Taxes
are levied at the state, county, and city levels, and cities may impose additional taxes. Currently,
counties and cities may impose additional sales taxes of up to 2 percent (Roberts, 2015).
However, if both county and city taxes are imposed, the revenue is collected only once, with the
city collecting its percentage on purchases made within city limits, and the county collecting its
percentage on purchases made in the county but outside city limits (Institute for Local
Government, 2008).
In California, sales taxes may be raised only by ballot measure. Government agencies may
impose two types of taxes: general taxes and special taxes. General taxes are imposed to raise
general-purpose revenue, which may be used toward any legal purpose. To be considered a
general tax, no restrictions may be placed on the use of the revenue. A general tax increase must
be approved by a simple majority of the affected voters. Special taxes are imposed to raise
money for a specific purpose and can be used only toward the specified purpose. A special tax
must be approved by a two-thirds majority of the affected voters (Institute for Local Government,
2008). In 1996, California voters passed Proposition 218, which gives local voters broad
authority to file suit and challenge local taxes and fees (Legislative Analyst’s Office, 1996).
Because a general tax requires a simple majority of the vote, it is typically considered the easier
way to pass a tax measure. However, general taxes are more likely to be challenged in the courts,
especially if they are written in such a way that they could be confused with a special tax. With a

American Institutes for Research Analysis of Options for Funding Universal Preschool in Sonoma County—30
general tax, voters have no guarantee that the additional funding would be used for any specific
purpose. In contrast, a special tax is typically considered more difficult to pass than a general tax
because it requires a two-thirds majority, but with this type of tax, the voters are assured that the
funds will be used for a specific purpose.
Although Sonoma County historically votes to support education and other government
initiatives, according to the stakeholders interviewed, two recent tax increase measures failed on
the ballot. Measure M, which was on the November 2014 ballot, was a 0.125 percent sales tax
that would have provided support for the county library system. The measure faced no organized
opposition, but it still failed to pass because it required a two-thirds majority for passage
(Ballotpedia, 2014). The other recent tax increase failure was Measure A on the June 2015 ballot.
In part because of the failure of Measure M, the supporters of Measure A wrote it as a general
tax. Measure A was a general sales tax that, if approved, would have authorized the county to
levy an additional sales tax of 0.25 percent, increasing the county’s sales tax rate from
8.25 percent to 8.5 percent. County officials estimated the tax would have raised $20 million per
year in additional revenue. The plan for the revenue involved 44 percent going to the county and
the remainder going to cities within the county. County officials indicated that with approval of
the measure, the county would have had the funds needed to repair and maintain the county’s
12,383 miles of roads. The specific purposes listed in the ballot questions, however, also
included transit services and public safety. Opponents critiqued Measure A because of its general
purpose, arguing that because the county sold the sales tax as a way to repair the roads, it should
have fully restricted its purpose to roads. Opponents also argued that there was no guarantee that
the county would have used Measure A tax revenue for roads and might have diverted the
revenue to pay off debt from the county’s public pensions (Ballotpedia, 2015; Gullixson, 2015;
Hart, 2015). The measure was soundly rejected, gaining only 37.3 percent of the vote
(Ballotpedia, 2015). Had the measure passed, local taxpayer associations were planning to
challenge it in court, based on their belief that it was really a special tax, not a general tax, and
should have required a two-thirds majority (Kennedy, 2015).
In part because of the failure of Measure A and the previous failure of Measure M, the local
stakeholders we interviewed expressed concerns about the prospects of a voter-supported tax
increase winning on the ballot in Sonoma County. However, these same stakeholders also
reported that they believed that tax money is the only stable, sustainable way to pay for expanded
preschool, without increased funding from the state or federal government. In addition, the
stakeholders involved in other preschool initiatives, including Denver, San Antonio, and San
Francisco, agreed that a sales tax increase was a sustainable way of funding preschool expansion.
While stakeholders in these local initiatives noted that one disadvantage of a sales tax increase is
that revenue decreases when the economy is in a down cycle, they also noted that officials can
factor possible economic downturns into the tax percentage increase to ensure a more stable
revenue stream.
Property Tax
Another type of local tax that has been used to fund preschool initiatives is a property tax.
Property taxes are assessed on owners of real property, including both residential and
commercial properties. In California, general property taxes are limited to 1 percent, although
increases can be assessed for specific purposes. Similar to sales taxes used for specific purposes,

American Institutes for Research Analysis of Options for Funding Universal Preschool in Sonoma County—31
in California, such increases must be approved by two thirds of the voters (Institute for Local
Government, 2013). Seattle is funding its universal preschool program primarily through a
property tax increase. According to the stakeholders interviewed, the city has a history of using
the Families and Education Levy for education-related purposes (City of Seattle, 2015a). The tax
increase passed in 2014 with 67 percent of the vote (Beekman, 2014).
Set-Asides
A set-aside is another way that some preschool initiatives have been funded. A set-aside, also
known as an earmark, is a commitment from a local government to use money from its general
fund for a specific purpose. A set-aside can be a specified amount, a percentage of revenue, or a
combination of both. Some advantages of set-asides include their predictability from year to year
and their ability to get citizens involved in the voting process. The disadvantages include a lack
of flexibility as circumstances change or during a budget crisis (SPUR, 2008). San Francisco and
Washington, D.C. largely fund their universal preschool programs through set-asides, according
to the stakeholders interviewed for both initiatives. San Francisco’s set-aside was created by the
passage of Measure H in 2004, passing with more than 70 percent of the vote. San Francisco’s
set-aside from the general fund is actually financed by a 4 percent (initially 3 percent) set-aside
from property tax revenues but did not increase the property tax itself.
Although sales taxes and property taxes have been successful through ballot measures for
preschool initiatives in other states, the battle is likely to be greater for any local tax initiative to
win in California because of the two-thirds majority requirement. The two places in California
that have reached that level of support are San Francisco, which has a long history of supporting
similar efforts, and West Sacramento, where only a very small portion of the tax increase goes
toward providing preschool services. In San Francisco, the measure was part of a PEEF (Public
Education Enrichment Fund) for educating older children, which may have increased its chances
of passage.
Pay for Success
The benefits and challenges associated with other funding mechanisms, such as Pay for Success
bonds, abound. The following briefly reviews Pay for Success and its history as well as its use as
a funding source for the Salt Lake School Readiness initiative and CPCs.
Known in Australia and the United Kingdom as social impact bonds, Pay for Success is a new
funding model that partners government and other nonprofit agencies with private investment
firms. The investors pay for social intervention programs or improvements up front, and the
government agency returns the money with interest after the programs begin to provide savings
in other areas. The funds are repaid only if the savings are realized, based on specific metrics and
outcomes agreed on in advance. The first social impact bond was issued in September 2010 by
Social Impact UK, and the model has gained great interest in the United States during the last
few years (Government of the United Kingdom, 2013; Nonprofit Finance Fund, 2013).
Within the last few years, several Pay for Success initiatives have launched in the United States;
five have been funded as of February 2015. Two of these initiatives (Chicago and Salt Lake
City/Park City, Utah) are targeted to funding preschool education for children from low-income

American Institutes for Research Analysis of Options for Funding Universal Preschool in Sonoma County—32
families (Golden & Nagendra, 2015). Preschool education is an area of interest to Pay for
Success funders, in part because of a report from the National Bureau of Economic Research
(Heckman, Moon, Pinto, Savelyev, & Yavetz, 2009) showing a 7 percent to 10 percent return on
investment from the High/Scope Perry Preschool Program, which targeted African-American
youth who were disadvantaged.
Because private investors bear the lion’s share of the risk, Pay for Success initiatives are
attractive. Supporters of the model suggest that shifting the financial risk onto private investors
provides room for government agencies to experiment with new and different approaches
(Hoback, 2015). However, the model also has its critics. In its study on a proposed Pay for
Success initiative to fund prisoner reentry programs, the Maryland Department of Legislative
Services (2013) found that such a program, on its own, was unlikely to pay back enough
dividends to cover the costs of administering the initiative, much less reward investors. Hoback
(2015) cited Susan Brown, public policy director of the Minnesota Council on Nonprofits, who
expressed concerns about the time and expense of evaluating the programs to determine whether
the metrics are being met. Other issues raised include the difficulty of quantifying outcomes and
the risk of services being compromised by the incentive to hit specific targets (McHugh, Sinclair,
Roy, Huckfield, & Donaldson, 2013). A similar project in the United Kingdom was shown to
have decreased the quality of the services provided by a reentry organization called Pathways to
Work, when they shaped their policies to suit the terms of their contract with the investor rather
than the needs of their clients (Hudson, Phillips, Ray, Vegeris, & Davidson, 2010). Others, such
as Congressman Ross Hunter, see the interest rates charged by these private investors as too high
compared with traditional government-backed bonds (he cites a difference of 9 percent to
11 percent compared with rates as low as 4 percent; Hoback, 2015).
Using Pay for Success, Salt Lake has finished its second year of a program, called School
Readiness, to expand preschool access for three- and four-year-old children from low-income
families. Because School Readiness is the first attempt in the United States to fund early
childhood education on the Pay for Success model, the project has attracted national attention. It
will likely be considered a test case as to whether the Pay for Success scheme is a feasible way to
fund early childhood education programs (Lu, 2014; Meehan, 2013).
The impetus for using the Pay for Success model in Salt Lake was based on a study by Voices for
Utah Children (2011), which followed a cohort of children who attended high-quality Title I
preschools in Salt Lake City’s Granite School District. The study showed that these children used
special education services at a much lower rate, resulting in reduced costs for the district.
According to the stakeholders interviewed, because the preschool program provided such a well-
delineated return on investment, early childhood leaders in the city felt it would make an excellent
candidate for a Pay for Success bond. Goldman Sachs and philanthropic investor J. B. Pritzker
fronted the funds for the initial investment (Meehan, 2013). Initially, the state was unwilling to
pass a bill that would provide backing funds for the loan. United Way of Salt Lake and Salt Lake
County set up the initial contracts and put up backing funds ($1 million from the United Way and
$350,000 from the county) for the first year of the program, referred to as a “proof of concept”
year. This provided an example framework for the state, and the state came onboard, setting aside
the backing funding by passing HB 96 in 2014. HB 96 created the School Readiness Board, which
guarantees the Salt Lake Pay for Success project and offered competitive grants to other preschool
programs wanting to improve their quality standards in hopes of attracting future Pay for Success

American Institutes for Research Analysis of Options for Funding Universal Preschool in Sonoma County—33
funding. The bill appropriated $3 million for the grants and to back or guarantee the remaining
years of the School Readiness Pay for Success grant (Utah State Legislature, 2014). The Early
Intervention Research Unit of Utah State University will measure the outcomes. If the agreed-on
outcomes are not reached, the loan will not be repaid (United Way of Salt Lake, 2014).
The Salt Lake Pay for Success grant pays the full cost of a $1,550 per child, three-hour preschool
program for approximately 750 children from low-income families currently and will expand to
1,000 children during the final two years of the grant. The Salt Lake stakeholders interviewed
reported that the intent of this particular Pay for Success bond was not to serve every child from a
low-income family in Salt Lake. Instead, they are taking the opportunity to reach out to low-
income families and educate them on the importance of preschool and work with the Utah State
Legislature to expand preschool opportunities throughout the state. The director of preschool
services for Granite School District, one of the providers for the Pay for Success grant, estimated
that the district’s preschool program serves approximately 3,000 children, of which approximately
624 receive preschool services through the Pay for Success grant. In addition, she estimated that
the district’s preschool program serves only 50 percent of the eligible population in the district.
The CPC program in Chicago also is using Pay for Success to expand its program for three- and
four-year-old children. The program was founded in 1967 by a former superintendent of the
Chicago Public Schools, Lorraine Sullivan, and was designed to provide preschool to children
from low-income families not already being served by Head Start. It is known for being the first
preschool program to be funded with federal Title I dollars, as well as for the Chicago
Longitudinal Study, which tracks students to show the long-term impact of attending a high-
quality preschool (University of Minnesota, 2015). The program runs from age 3 through third
grade, with three- and four-year-old children attending half-day preschool at a center co-located
with an elementary school. The program also requires parent participation, both at home and in
the classroom. However, because of budget cuts, school closures, and declining enrollment, the
program had been slowly losing seats (Harris, 2012), down from a high of 25 centers and 1,500
three-year-old children through third graders served per year in the 1980s to only 10 centers with
670 preschool slots in 2009 (Nyhan, 2013). In 2011, the city was part of a consortium that
received an i3 grant to expand the CPC model to more cities, primarily in the Midwest.
Chicago’s portion of the $15 million five-year grant provided services to 1,200 children at 15
sites starting in fall 2012 (Human Capital Research Collaborative, 2011). To build on this
expansion, in October 2014, Chicago Mayor Rahm Emanuel announced a $17 million social
impact bond that would fund an additional 2,600 CPC slots across three years (Connors, 2014).
Goldman Sachs and Northern Trust are the primary funders. The program is administered by the
Chicago Public Schools and will be evaluated by a consortium of three local nonprofit groups
(Dardick & Perez, 2014). The new slots will be opened in six schools, including two existing
CPC locations, three locations added in the 2012 expansion, and one entirely new location.
Capital construction costs will be funded by the city and the state of Illinois, not the social
impact bond (Human Capital Research Collaborative, 2014b).
As with Salt Lake, the Chicago CPC Pay for Success grant is already garnering national interest,
but it also has its critics. Rick Cohen (2014) pointed out that the CPC program already has a
proven record of success (a 20-year longitudinal study from a team from the University of
Rochester showed more than $7 returned per dollar invested; see Reynolds, Temple, White, Ou,
& Robertson, 2011) and suggests that the city would be better served by paying for the program

American Institutes for Research Analysis of Options for Funding Universal Preschool in Sonoma County—34
up front rather than giving the money back to investors later on. Other fiscal evaluations suggest
that the cost of administering the bond may outweigh the savings to the city (Sanchez, 2014).
Overall, the Pay for Success model in the United States may have limits as a primary or long-
term funding source for a large-scale preschool initiative. First, Pay for Success requires an
initial private investor willing to assume the risk of funding the initiative without guarantee of
repayment. In addition, it is important to note that Salt Lake uses Pay for Success funding to pay
for a very small percentage of the four-year-old population, and in Chicago, the Pay for Success
bond is not the primary source of funding. However, it will be important to keep an eye on the
Salt Lake and Chicago “experiments” to see if Pay for Success does expand to support a larger
scale initiative. At a minimum, the Pay for Success model may play an important role in raising
public awareness of the importance of early education, thereby contributing to increased support
for more stable public funding for preschool.
Federal Title I
One of the oldest sources of public funding for preschool initiatives is federal Title I funds,
which are used in Chicago and Elk Grove. In 2014–15, the Elk Grove Unified School District
designated approximately 8.5 percent of its Title I funds to provide preschool services in Title I–
eligible schools. The provision of Title I funds allowed the Elk Grove district to serve children
just above the income eligibility limits for other publicly subsidized programs and provide
compensation to preschool teachers equivalent to that of K–12 personnel.
The advantages of using Title I funds for preschool include the flexibility of the funding source;
in schools with schoolwide Title I programs, the funds can be used for any child, regardless of
family income, attending a Title I school, to improve the quality of service and compensation for
personnel and extend the hours or days of service.
The primary disadvantage of Title I as a funding source for preschool, unless federal Title I
funds are increased overall, is that the federal government has provided these funds to schools to
support students in all grades, from prekindergarten to Grade 12. In 2006–07, less than 1 percent
(approximately 0.6 percent) of California’s Title I funds were allocated for preschool (Karoly,
Reardon, & Cho, 2007), compared with 3 percent nationally (U.S. Department of Education,
2014). During the recent Great Recession, it is likely that even schools that had been using Title I
for preschool-age children faced pressure to use the funds to fill deficits in services for older
children. That said, Title I remains an important part of preschool finance in CPCs, perhaps the
most thoroughly evaluated preschool program showing one of the highest returns on investment.
Using Title I funds to support preschool in combination with another funding mechanism, as in
Chicago, may be a workable approach.
Partnerships with Local Businesses
Another potential approach for obtaining support for preschool is to develop partnerships with
local businesses. Business support might be direct, as in the provision of on-site programs for
preschool-age children or infants and toddlers or the provision of employee benefits to pay for
preschool or child care, or indirect, by engaging business support for a preschool initiative
supported by public funds. For example, chambers of commerce provided key support for

American Institutes for Research Analysis of Options for Funding Universal Preschool in Sonoma County—35
preschool initiatives in Denver (Goldsmith, 2008) and San Antonio (Baugh & Cesar, 2012), by
not only endorsing the measures but also helping to craft them, with representatives serving on
working groups and task forces from the early stages of the process.
Many chamber of commerce organizations encourage their members to provide support for their
employees’ child care needs. The Santa Rosa Chamber of Commerce is one local leader in this
area. Through its WHEEL Plus program, and in partnership with First 5 Sonoma County, the
Chamber promotes the importance of early childhood education to its members, and they sponsor
an annual tour of high-quality child care facilities, according to the vice president of public
policy for the Santa Rosa Chamber of Commerce. The Santa Rosa Chamber worked with local
businesses to apply for a grant from First 5 Sonoma County, which would have provided support
for companies to provide on-site child care. The proposal was not funded, but according to the
stakeholders interviewed, the Chamber continues to be interested in supporting efforts to expand
child care programs in the county.
Sonoma County stakeholders who were interviewed identified a lack of employers large enough
to provide a sustainable population of children of the right age to make it cost effective to hire
staff at the ratios required for child care licensure as the key barrier to employers providing on-
site child care for their employees. One potential solution suggested was finding ways to
encourage employers located near each other, such as in an office park, to work together to fund
a child care center.
One large Sonoma County employer, Graton Resort & Casino in Rohnert Park, proposed to offer
on-site child care to its employees (Mason, 2008), but this does not seem to have become a
reality. However, many casinos host or provide on-site child care facilities for their employees.
Two Las Vegas casinos—the Venetian and Texas Station—opened the first such facilities in
2000. The centers were owned and operated by Children’s Choice Learning Centers, a for-profit
company (purchased by Bright Horizons in 2013) that paid for the centers’ construction and
operation. The casinos donated the land, and the Venetian subsidized parent fees at 20 percent
below market rates (Strow, 2000). Some states, such as Massachusetts, have passed laws
authorizing municipalities to require casinos to build child care centers (Timmins, 2013).
Another potential employer to target for providing child care to its employees is Kaiser
Permanente. Many hospitals provide on-site or subsidized child care to their employees. Large
hospitals with on-site employee child care centers include Stanford Hospital and Florida Hospital
Waterman (Galt, 2013), as well as Rex Hospital at the University of North Carolina–Chapel Hill
and Riverside Methodist Hospital in Columbus, Ohio (Fields, Rodak, Roney, & Tawoda, 2012).
Although it seems unlikely that businesses will be a primary operator of preschools, there may be
opportunities for Sonoma County to work with the business community to expand access to
preschool, and having business support for a locally funded preschool initiative could well be
invaluable in garnering larger community support for such an initiative.

American Institutes for Research Analysis of Options for Funding Universal Preschool in Sonoma County—36
Cost Estimates and Phase-In Plans
Cost per Child for Universal Preschool
To determine the funds necessary to support universal preschool in Sonoma County, it is first
important to determine the expenditure per child necessary for such an initiative. Based on
direction from Sonoma County Department of Health Services, Health Policy, Planning and
Evaluation staff, the goal was to estimate the cost of a full-day, full-year program that would
serve three- and four-year-old children to meet the objective of promoting school readiness while
also operating on a schedule that would meet the needs of working parents.
To estimate the current per-child cost of such a program serving three- and four-year-old
children in Sonoma County, we began by reviewing the budgets and staffing patterns for a
sample of the county’s preschool programs, including Head Start and Title 5 State Preschool, the
two publicly funded programs whose standards are generally thought to represent the minimum
level of quality necessary to promote improved early learning and increase child outcomes
(Karoly & Bigelow, 2005). The standards for these two programs also relate to California’s five-
level Race to the Top QRIS framework. Although Sonoma County was not one of the original 16
counties piloting the framework, having such a framework may help the county qualify for the
new California State Preschool Block Grants. Federal Head Start Performance Standards roughly
translate to a Level 4 rating on the QRIS framework, whereas Title 5 State Preschool standards
translate approximately to a QRIS Level 3 rating. As we saw in the descriptions of the 12
preschool initiatives, several initiatives, such as those in Denver, Los Angeles, and San
Francisco, currently use QRIS Level 3 ratings as one of the entry-level requirements for
receiving preschool initiative funding.
Staffing patterns and adult-to-child ratios in preschool classrooms were similar, although not
identical across the programs in Sonoma County that we studied. For example, whereas Title 5
State Preschool allows a group size of 24 with a staff-to-child ratio of 1:8 for preschool children,
the maximum group size in Head Start is 20 for four-year-olds with 17 for three-year-olds, with
staff-to-child ratios for the two age groups of 1:10 and 1:8.5, respectively. Taking these
differences into account, we assumed a group size of 20 children with at least two adults—two
teachers—all day, plus 1.8 full-time equivalent teaching assistants (i.e., the teaching assistants
are present most of the day but typically not in the early morning or late afternoon when fewer
children are in full-day programs). These specifications—a group size of 20 and 1:10 adult-to-
child ratio—also conform to Tier 3 and 4 requirements in California’s emerging QRIS system.
Although per-child costs were similar across these Sonoma-based programs we studied, centers
allocated nonteaching staff resources differently. For example, following federal requirements,
the Head Start program hired a family outreach worker to work with families and promote family
engagement. Whereas this feature was lacking in other preschool programs we studied, some had
a facilities specialist and a fiscal specialist, positions that might exist for the overall
administration of Head Start across the county but not in an individual center.
As indicated above, based on direction from Sonoma County staff and local stakeholders, we
assumed a full-day (eight-hour), full-year (12-month) program. It is important to note that
although the budgets we developed defined “full day, full year” in this manner, this is not the

American Institutes for Research Analysis of Options for Funding Universal Preschool in Sonoma County—37
definition we later found to be used in most of the local preschool initiatives (outside of Sonoma
county) that we examined (described previously in the report), which typically define a full day
as up to the school day length of 6.5 hours and operate on a school-year (10-month) versus 12-
month basis. This difference in definition is important as the longer number of hours and days of
preschool services proposed in Sonoma substantially increases the cost.
Based on the standards and assumptions outlined previously, we found that the cost of a full-day,
full-year preschool program using current salaries for staff in Sonoma County would be $11,590
per child. Of these costs, approximately 44 percent are for instructional staff salaries, 11 percent
for other staff salaries, 18 percent for staff benefits, and 27 percent for nonpersonnel costs.
Further details of the costs included in the per child cost estimate are noted in Appendix C.
Based on direction from Sonoma County, raising the wages of the staff across the board to a
living wage was the main approach for improving quality, with the intent of retaining as well as
recruiting future qualified employees.
We estimated the cost per child if wages are increased to a living wage by setting $15 per hour as
the minimum wage. For the lowest paid employee, a teacher assistant, this represented an
increase of 15.74 percent; therefore, all teaching staff were given this same percentage raise in
the living wage budgets. Nonteaching administrative staff (e.g., fiscal specialists, family outreach
workers, and facilities specialists) are already paid a living wage. In developing the living wage
budgets, because teachers are given notable raises and because it seemed important to recognize
the roles the nonteaching staff play in establishing a quality program, we provided an increase
for them as well. However, because the nonteaching staff as a group were already earning more
than $15 per hour, we selected a 5 percent raise instead of 15.74 percent. This process resulted in
a per-child cost of $13,143.
The per-child cost if wages were raised to living wages—$13,143—breaks out by budget
category in approximately the same manner as the current salaries cost per child, given that
nonpersonnel costs and benefits are estimated as a percentage of salaries. Further details of the
costs included in the per child cost estimate are noted in Appendix C.
At first glance, the estimated costs per child of a preschool initiative in Sonoma County—
$11,590 if staff were paid current salaries, $13,143 if salaries were raised to the living wage—
seem to be in the upper half of the 12 initiatives we studied. The per-child estimated expenditure
at living wage salaries in Sonoma would be about the same as the per-child cost in Seattle,
although still lower than that in Boston, San Antonio, or Washington, D.C. However, it is
important to note that the Sonoma program would offer eight hours and 12 months of service,
whereas most of the other initiatives, including those in Seattle, San Antonio, and Washington,
D.C., operate on a school-day, school-year calendar, and some of the programs, as in Elk Grove
and LAUP, support only part-day services at a per-child cost of about half that estimated for the
full-day program in Sonoma. Thus, a significant portion of the estimated per-child cost in
Sonoma would actually go toward the provision of what would be considered extended-day,
extended-year services in some of the other local preschool initiatives we examined (outside of
Sonoma county and described previously in the report).

American Institutes for Research Analysis of Options for Funding Universal Preschool in Sonoma County—38
Although the total estimated per-child cost for the Sonoma program may seem substantial
compared with existing State Preschool reimbursement rates, the portion of the expenditure
available to finance a level of quality sufficient to promote school readiness is less than that of
many of the other initiatives we studied, such as in Boston, San Antonio, and Washington, D.C.
For example, the per-child expenditure in those cities is higher largely because of the level of
teacher compensation. Our review found that offering compensation for lead teachers that was
close to that of elementary school teachers with similar qualifications was a key factor in
retaining qualified preschool teachers. Although increasing wages may help retain personnel,
$15 per hour is still a long way from the median wage for an elementary school teacher in Santa
Rosa (the Sonoma county seat) ($29 per hour; Salary.com, 2015), and this disparity may make
retaining highly qualified staff difficult. Salary increases may have to be greater to attract and
retain teachers who are more qualified. Also, for the purposes of further increasing program
quality, the county may wish to consider the cost of implementing other quality elements, such
as classroom assessments, professional development, coaching and mentors, a research-based
curriculum, and more robust support for family engagement.
Various factors could increase or decrease the per-child cost of preschool. Major factors that might
increase the cost are raising the compensation for lead teachers who have bachelor’s degrees to be
commensurate or closer to those of K–12 teachers, hiring a staff person to address family
engagement, introducing a new evidence-based curriculum, offering teachers tuition
reimbursement to obtain additional training, and conducting assessments of classroom quality to
guide program improvement. The major factor that would decrease the cost of the program would
be to offer services fewer hours a day and for fewer months a year (e.g., six hours per day and 10
months per year) as in most of the preschool initiatives we examined. Based on AIR’s previous
research, a program operating six hours a day for 175 days per year costs one third less than a
program that operates 250 days per year and nine hours per day (Lam & Muenchow, 2009). Thus,
reducing hours per day and days per year might yield sufficient savings to help Sonoma County
provide some of the quality elements found in other preschool initiatives without raising the
expenditure per child beyond that found for a living wage in this report.
Cost of Upgrading the Quality of Existing Subsidized Slots
For a mixed-delivery system for preschool as envisioned by the Sonoma stakeholders we
interviewed, it is important to take into account not only the cost of creating new preschool slots
to serve additional children but also the cost of upgrading the quality of existing subsidized slots
(such as State Preschool and CalWORKS slots) expected to participate in the program. The
purpose of the upgrade is to help the program reach quality standards (such as for teacher
salaries, teacher–child ratios, curricula, and professional development) established for Sonoma’s
countywide program. Building on the existing number of publicly subsidized preschool slots
captures some of the public dollars already invested in these programs, reduces the number of
new facilities that need to be created, makes use of the existing labor force, and helps to create a
delivery system that meets the needs of diverse families. Including these other publicly
subsidized programs also creates an opportunity to create a more unified system and to simplify
family entrance to the programs.
However, it is important to provide a level playing field where all participating providers who
meet the same standards of quality receive the same payment or reimbursement for the same

American Institutes for Research Analysis of Options for Funding Universal Preschool in Sonoma County—39
number of hours of service. Currently, many of the existing subsidized programs, most notably
State Preschool, receive only about 60 percent ($9,025 in 2014–15) of the proposed
reimbursement at the living wage ($13,143) for the universal preschool program in Sonoma
County.
We estimate the initial cost to upgrade the subsidized slots at current salaries is $2,565 per child
in the first year. We derived this number by subtracting the 2014–15 State Preschool
Reimbursement Rate ($9,025) from AIR’s estimate of the real cost of preschool in Sonoma
County ($11,590) at current salaries. We estimate that it will increase each year as the real cost
of preschool increases 3 percent per year, a standard cost-of-living adjustment.
With staff compensation raised to the living wage, we estimate that the cost to upgrade existing
subsidized slots is $4,118 per child in the first year. We derived this number by subtracting the
2014–15 State Preschool Reimbursement Rate ($9,025) from AIR’s estimate of the real cost of
preschool in Sonoma County at living wage salaries ($13,143). The upgrade will be part of the
ongoing operational expense; hence, we estimate that it will also increase each year as the real
cost of preschool increases 3 percent each year, a standard cost-of-living adjustment.
For the purposes of this estimate, we assume that the cost to upgrade existing subsidized
programs such as Head Start, the Alternative Payment Program, and CalWORKS is on average
the same as the cost for upgrading State Preschool. Based on our experience in other counties
estimating the cost of upgrading programs, it may require somewhat less to upgrade Head Start,
because it is typically better funded than State Preschool. However, some of the Head Start funds
are spent on comprehensive health and other services beyond the scope of the proposed universal
preschool program. Hence, the actual Head Start funds available for educational purposes are
often not much greater than that for State Preschool. Similarly, some child care centers
associated with CalWORKS appear to receive higher reimbursements than State Preschool, but
the CalWORKS programs may also provide more hours and days of service. Hence, for planning
purposes, we thought it best to apply the average upgrade rate to all subsidized slots to ensure
that adequate resources are available.
Phase-In Plan Scenarios for Universal Preschool
Below we show the estimated total cost and phase-in plans for eight scenarios.
Table 14 summarizes provides the following information for each scenario:
Population of children
Number of children currently enrolled in publicly supported slots
Unmet Need (Number of new or newly publicly supported slots needed)
Length of phase-in
Total cost in final year—current salaries
Total cost in final year—living wage salaries

American Institutes for Research Analysis of Options for Funding Universal Preschool in Sonoma County—40
Tables 15 through 30 present the individual scenarios as follows:
1. Serving all four-year-olds in the high-priority census tracts (Tables 15 and 16)
2. Serving all four-year-olds in the high-priority ZIP codes (Tables 17 and 18)
3. Serving three and four-year-olds below 300 percent of the federal poverty level (FPL) at
85 percent participation rate in the high-priority census tracts (Tables 19 and 20)
4. Serving three and four-year-olds below 300 percent FPL at 85 percent participation rate
in the high-priority ZIP codes (Tables 21 and 22)
5. Serving three and four-year-olds below 300 percent FPL at 70 percent participation rate
in the high-priority census tracts (Tables 23 and 24)
6. Serving three and four-year-olds below 300 percent FPL at 70 percent participation rate
in the high-priority ZIP codes (Tables 25 and 26)
7. Serving all three- and four-year-olds countywide at 70 percent participation rate (Tables
27 and 28)
8. Serving all three- and four-year-olds countywide at 70 percent participation rate; children
below 300 percent FPL would receive free preschool and those above would receive
discounted tuition (Tables 29 and 30)
The length of the phase-in period for each scenario depends on the number of new slots needed.
For all scenarios in which more than 1,000 new slots are needed, we used a 10-year phase-in; for
all scenarios in which fewer than 1,000 new slots are needed, we used a five-year phase-in.
Defining unmet need is one of the most challenging aspects of developing scenarios for phasing
in universal preschool. On the one hand, a plan utilizing a mixed-delivery system would most
likely build on the existing supply of both private pay and publicly subsidized providers. In many
of the local preschool initiatives we studied, existing preschool providers, both public and
private, were invited to submit applications to participate in the new local initiative. Building on
the private as well as public supply reduces costs for construction of new facilities and offers
families a wider selection of programs. However, one of the purposes of a universal preschool
initiative is to help families currently struggling to pay for preschool. Expecting some families to
pay the full price for a program that others receive for free seems unrealistic if not inconsistent
with the concept of universal preschool. In the mixed-delivery initiatives we studied, such as
Denver, San Francisco, and Seattle, all of the children attending participating private centers
receive discounted or free tuition.
Thus, in estimating the expense of a universal preschool program, it is important to include the
expense of both the new slots to be created and of existing private-pay slots that will now receive
full or partial public support. In the following scenarios, therefore, we determined that the safest
way to estimate unmet need—the number of new slots that will need to be created and the
number of existing private-pay slots that will now receive public support—was to subtract only
existing subsidized slots (Head Start, Title 5, CalWORKS Stages 2 and 3, and Alternative
Payment programs) from the target population to be funded for each scenario. In this way, we
allow for the possibility that the private-pay slots will become part of the new universal
preschool system, but we account for the cost of providing public funding for them. We also

American Institutes for Research Analysis of Options for Funding Universal Preschool in Sonoma County—41
consider the cost of upgrading the existing subsidized slots to the quality standards described
previously. Each table therefore presents the estimated total cost of creating the new slots and
providing public support to existing private-pay slots in the target population of children, and of
upgrading the existing subsidized slots to the level of the proposed Sonoma program.
The last scenario (Tables 29 and 30) uses the same approach but with one important difference:
In this scenario we assume, after a 70 percent participation rate, that preschool will be free to
three- and four-year-olds below 300 FPL while offering discounted—as opposed to free—tuition
to the more than 3,000 children estimated to be above that income level countywide and likely
participants in the program. Because developing a specific sliding fee scale was beyond the
scope of this project, we estimated that, on average, the children above 300 percent of FPL
would receive a tuition credit valued at 25 percent of the real cost. In practice, children closest to
300 percent of FPL would receive a larger discount and children far above that level would
receive much less. This approach reduces the countywide estimated cost in the final year of the
phase-in, at 70 percent participation, at current salaries, from approximately $104 million to
$69.5 million.
Finally, as outlined in the list of scenarios above, we estimated the cost of serving children in
different geographic areas and different income levels at several different participation rates.
Based on our review of the 12 locally initiated preschool initiatives conducted for this Sonoma
project, the level of participation depends largely on the design of the program—whether it is
free, the hours of service, transportation, and the quality. In neighborhoods where participation in
existing preschool programs is especially low, such as in Latino neighborhoods in Sonoma
County, the level of outreach to encourage participation may be important. In Washington, D.C.,
where preschool is free to all three- and four-year-olds, 86 percent of the children participate in
publicly subsidized preschool. In Denver, Colorado, where all four-year-olds are eligible, but
where only the lowest income families receive free preschool and the remainder pay a portion of
the cost based on a sliding fee scale, 54 percent participate. Some of the scenarios below in high-
need areas in Sonoma County assume a 100 percent participation rate; the remainder assume
between 70 percent and 85 percent participation.
Table 14. Summary of Total Costs for Last Year Of Phase-In for Each Scenario (Current
Salaries and Increasing Salaries to a Living Wage) Calculating Unmet Need by Subtracting
Only Existing Subsidized Preschool Slots (Head Start, Title 5, CalWORKS, and
Alternative Payment Program), Including Upgrading Existing Subsidized Slots in the Total
Costs
Phase-In Scenario
Population of
Children
Existing Subsidized
Slots ONLY
Number of
Resulting New Slots
Needed
(Unmet Need)
Length of
Phase-in
Current Salaries
Total Cost in Final Year
Living Wage Total Cost in
Final Year
1. All four-year-olds in the high-priority census tracts
1,280 395 885 5 years $13,131,591 $15,369,941

American Institutes for Research Analysis of Options for Funding Universal Preschool in Sonoma County—42
Phase-In Scenario
Population of
Children
Existing Subsidized
Slots ONLY
Number of
Resulting New Slots
Needed
(Unmet Need)
Length of
Phase-in
Current Salaries
Total Cost in Final Year
Living Wage Total Cost in
Final Year
2. All four-year-olds in the high-priority ZIP codes
5,302 1,270 4,032 10 years
$68,713,520 $79,461,921
3. Three- and four-year-olds below 300% FPL at 85% participation rate in the high-priority census tracts
1,172
(85% of 1,379)
283 889 5 years $12,733,626 $14,783,116
4. Three- and four-year-olds below 300% FPL at 85% participation rate in the high-priority ZIP codes
5,575
(85% of 6,558)
2,013 3,562 10 years
$65,660,627 $76,804,339
5. Three- and four-year-olds below 300% FPL at 70% participation rate in the high-priority census tracts
965
(70% of 1,379)
283 682 5 years $10,033,495 $11,721,001
6. Three- and four-year-olds below 300% FPL at 70% participation rate in the high-priority ZIP codes
4,591
(70% of 6,558)
2,013 2,578 10 years
$50,780,871 $59,929,783
7. All three- and four-year-olds countywide at 70% participation rate
8,091
(70% of 11,558)
2,013 6,078 10 years
$104,182,375 $120,584,735

American Institutes for Research Analysis of Options for Funding Universal Preschool in Sonoma County—43
Phase-In Scenario
Population of
Children
Existing Subsidized
Slots ONLY
Number of
Resulting New Slots
Needed
(Unmet Need)
Length of
Phase-in
Current Salaries
Total Cost in Final Year
Living Wage Total Cost in
Final Year
8. All three- and four-year-olds countywide at 70% participation rate, free for children below 300% FPL, and a 25% tuition credit for all children at or above 300% FPL
8,091
(70% of 11,558)
2,013 3,021
(below 300% FPL)
3,057
(at or above 300% FPL)
10 years
$69,507,175 $81,260,933
The notes for each scenario provide the data sources for determining the target population and
the children already served. Data on the number of existing subsidized slots in each scenario
were obtained from AIR’s Early Learning Needs Assessment Tool (ELNAT), which includes
Head Start enrollment by ZIP code from an AIR survey of Head Start grantees and state-
subsidized enrollment by ZIP codes from the California Department of Education’s 801A
reports, or from data on the number of place-based subsidized slots and alternative payment
vouchers from the Child Care Planning Council Report Supplement, 2015, for the high-priority
census tracts. The number of children was estimated using American Community Survey Public
Use Microdata Sample (PUMS) data.
The first table in each pair represents the total cost at current staff salaries and the second shows
the total cost if staff salaries were to be increased to a living wage, as described above.

American Institutes for Research Analysis of Options for Funding Universal Preschool in Sonoma County—44
Four-Year-Olds in High-Priority Census Tracts
Table 15. All Four-Year-Olds in the High-Priority Census Tracts at Current Salaries
Total number of children 1,280
Total number of slots to add (unmet need)
885
Year 1 Year 2 Year 3 Year 4 Year 5
New or newly publicly funded slots
40 120 200 240 285
Continuing slots created in prior years
40 160 360 600
Cost per child (increasing 3% per year)
$11,590 $11,937 $12,295 $12,664 $13,044
Number of existing subsidized slots
395 395 395 395 395
Cost per child to upgrade existing subsidized slots to desired quality (increasing 3% per year)
$2,565 $2,912 $3,270 $3,639 $4,019
Total cost each year $1,476,569 $3,060,278 $5,718,098 $9,035,992 $13,131,591
Note. The total number of children (four-year-olds) was calculated by taking one third of “children 2 to under 5” category, Tables 10–14, Child Care Planning Council Report Supplement, 2015. Unmet need was calculated by subtracting all existing subsidized slots identified in the “Number of place-Based subsidized spaces” and “Number of children with Alternative Payment vouchers” table rows from the Child Care Planning Council Report Supplement tables for each high-priority census tract.

American Institutes for Research Analysis of Options for Funding Universal Preschool in Sonoma County—45
Table 16. All Four-Year-Olds in the High-Priority Census Tracts at Living Wage
Total number of children 1,280
Total number of slots to add (unmet need)
885
Year 1 Year 2 Year 3 Year 4 Year 5
New or newly publicly funded slots
40 120 200 240 285
Continuing slots created in prior years
40 160 360 600
Cost per child (increasing 3% per year)
$13,143 $13,538 $13,944 $14,362 $14,793
Number of existing subsidized slots
395 395 395 395 395
Cost per child to upgrade existing subsidized slots to desired quality (increasing 3% per year)
$4,118 $4,513 $4,919 $5,337 $5,768
Total cost each year $2,152,431 $3,948,454 $6,962,585 $10,725,281 $15,369,941
Note. The total number of children (four-year-olds) was calculated by taking one third of “children 2 to under 5” category, Tables 10–14, Child Care Planning Council Report Supplement, 2015. Unmet need was calculated by subtracting all existing subsidized slots identified in the “Number of place-based subsidized spaces” and “Number of children with Alternative Payment vouchers” table rows from the Child Care Planning Council Report Supplement tables for each high-priority census tract.

American Institutes for Research Analysis of Options for Funding Universal Preschool in Sonoma County—46
Four-Year-Olds in High-Priority ZIP Codes
Table 17. All Four-Year-Olds in the High-Priority ZIP Codes at Current Salaries
Total number of children 5,302
Total number of slots to add (unmet need)
4,032
Year 1 Year 2 Year 3 Year 4 Year 5
New or newly publicly funded slots
80 120 200 300 400
Continuing slots created in prior years
80 200 400 700
Cost per child (increasing 3% per year)
$11,590 $11,937 $12,295 $12,664 $13,044
Number of existing subsidized slots
1,270 1,270 1,270 1,270 1,270
Cost per child to upgrade existing subsidized slots to desired quality (increasing 3% per year)
$2,565 $2,912 $3,270 $3,639 $4,019
Total cost each year $4,184,110 $6,085,952 $9,071,448 $13,486,701 $19,452,800
Year 6 Year 7 Year 8 Year 9 Year 10
New or newly publicly funded slots
460 500 580 660 732
Continuing slots created in prior years
1,100 1,560 2,060 2,640 3,300
Cost per child (increasing 3% per year)
$13,435 $13,839 $14,254 $14,681 $15,122
Number of existing subsidized slots
1,270 1,270 1,270 1,270 1,270
Cost per child to upgrade existing subsidized slots to desired quality (increasing 3% per year)
$4,410 $4,814 $5,229 $5,656 $6,097
Total cost each year $26,560,538 $34,620,456 $44,270,043 $55,631,632 $68,713,520
Note. The total number of children (four-year-olds) was calculated by using three-year averages from the 2012
American Community Survey Public Use Microdata Sample (PUMS) data, disaggregated by ZIP based on Missouri Census Data Center ZIP code to (Public Use Microdata Area [PUMA]) allocation factors, for all ZIP codes associated with Sonoma County’s highest-need elementary schools. Unmet need was calculated by subtracting total enrollment for three- and four-year-olds in all subsidized programs (Head Start, Title 5, CalWORKS, and Alternative Payment programs) in each of these ZIP codes, with Head Start enrollment from AIR’s survey of Head Start grantees and state-supported enrollment from the California Department of Education 801A enrollment reports as of October 2012, as contained in AIR’s Early Learning Needs Assessment Tool (ELNAT).

American Institutes for Research Analysis of Options for Funding Universal Preschool in Sonoma County—47
Table 18. All Four-Year-Olds in the High-Priority ZIP Codes at Living Wage
Total number of children 5,302
Total number of slots to add (unmet need)
4,032
Year 1 Year 2 Year 3 Year 4 Year 5
New or newly publicly funded slots
80 120 200 300 400
Continuing slots created in prior years
80 200 400 700
Cost per child (increasing 3% per year)
$13,143 $13,538 $13,944 $14,362 $14,793
Number of existing subsidized slots
1,270 1,270 1,270 1,270 1,270
Cost per child to upgrade existing subsidized slots to desired quality (increasing 3% per year)
$4,118 $4,513 $4,919 $5,337 $5,768
Total cost each year $6,281,615 $8,438,419 $11,824,156 $16,831,323 $23,597,245
Year 6 Year 7 Year 8 Year 9 Year 10
New or newly publicly funded slots
460 500 580 660 732
Continuing slots created in prior years
1,100 1,560 2,060 2,640 3,300
Cost per child (increasing 3% per year)
$15,237 $15,694 $16,165 $16,649 $17,149
Number of existing subsidized slots
1,270 1,270 1,270 1,270 1,270
Cost per child to upgrade existing subsidized slots to desired quality (increasing 3% per year)
$6,212 $6,669 $7,140 $7,624 $8,124
Total cost each year $31,657,855 $40,798,297 $51,741,520 $64,626,258 $79,461,921
Note. The total number of children (four-year-olds) was calculated by using three-year averages from the 2012 American Community Survey Public Use Microdata Sample (PUMS) data, disaggregated by ZIP based on Missouri Census Data Center ZIP code to (Public Use Microdata Area [PUMA]) allocation factors, for all ZIP codes associated with Sonoma County’s highest-need elementary schools. Unmet need was calculated by subtracting total enrollment for three- and four-year-olds in all subsidized programs (Head Start, Title 5, CalWORKS, and Alternative Payment programs) in each of these ZIP codes, with Head Start enrollment from AIR’s survey of Head Start grantees and state-supported enrollment from the California Department of Education 801A enrollment reports as of October 2012, as contained in AIR’s Early Learning Needs Assessment Tool (ELNAT).

American Institutes for Research Analysis of Options for Funding Universal Preschool in Sonoma County—48
Three- and Four-Year-Olds Below 300 Percent of the Federal Poverty Level
in High-Priority Census Tracts, at 85 Percent Participation Rate
Table 19. Three- and Four-Year-Olds Below 300 Percent FPL at 85 Percent Participation
Rate in the High-Priority Census Tracts at Current Salaries
Total number of children 1,172
Total number of slots to add (unmet need)
889
Year 1 Year 2 Year 3 Year 4 Year 5
New or newly publicly funded slots
80 120 200 240 249
Continuing slots created in prior years
80 200 400 640
Cost per child (increasing 3% per year)
$11,590 $11,937 $12,295 $12,664 $13,044
Number of existing subsidized slots
283 283 283 283 283
Cost per child to upgrade existing subsidized slots to desired quality (increasing 3% per year)
$2,565 $2,912 $3,270 $3,639 $4,019
Total cost each year $1,652,923 $3,211,598 $5,843,634 $9,134,971 $12,733,626
Note. To estimate the total number of children (three- and four-year-olds) below 300 percent FPL in the high-priority census tracts, we used the Child Care Planning Council 2015 report supplement reports of “children from low-income families” (under 70 percent state median income) and “children in families earning just over the eligibility limit,” which together provide the total number of children in families earning $75,000. Because 300 percent FPL for a family of four is $71,550, we multiplied this total by 90 percent to approximate the number of children in the high-priority census tracts below $71,500, or 300 percent of poverty. We then multiplied this population estimate of the number of children below 300 percent FPL by 85 percent, the assumed participation rate. To calculate unmet need, we used data on the number of children enrolled in subsidized slots, with Head Start enrollment obtained from AIR’s survey of Head Start grantees and state-supported enrollment from the 801A reports from the California Department of Education and in all licensed care, for the ZIP code(s) associated with each census tract to estimate the percentage of overall slots that are subsidized. We then applied these percentages to total child care supply in each census tract to estimate the number of subsidized slots and subtracted these from total population.

American Institutes for Research Analysis of Options for Funding Universal Preschool in Sonoma County—49
Table 20. Three- and Four-Year-Olds Below 300 Percent FPL at 85 Percent Participation
Rate in the High-Priority Census Tracts at Living Wage
Total number of children 1,172
Total number of slots to add (unmet need)
889
Year 1 Year 2 Year 3 Year 4 Year 5
New or newly publicly funded slots
80 120 200 240 249
Continuing slots created in prior years
80 200 400 640
Cost per child (increasing 3% per year)
$13,143 $13,538 $13,944 $14,362 $14,793
Number of existing subsidized slots
283 283 283 283 283
Cost per child to upgrade existing subsidized slots to desired quality (increasing 3% per year)
$4,118 $4,513 $4,919 $5,337 $5,768
Total cost each year $2,216,919 $3,984,552 $6,969,442 $10,702,019 $14,783,116
Note. To estimate the total number of children (three and four-year-olds) below 300 percent FPL in the high-priority census tracts, we used the Child Care Planning Council 2015 report supplement reports of “children from low-income families” (under 70 percent state median income) and “children in families earning just over the eligibility limit,” which together provide the total number of children in families earning $75,000. Because 300 percent FPL for a family of four is $71,550, we multiplied this total by 90 percent to approximate the number of children in the high-priority census tracts below $71,500, or 300 percent of poverty. We then multiplied this population estimate of the number of children below 300 percent FPL by 85 percent, the assumed participation rate. To calculate unmet need, we used data on the number of children enrolled in subsidized slots, with Head Start enrollment obtained from AIR’s survey of Head Start grantees and state-supported enrollment from the 801A reports from the California Department of Education and in all licensed care, for the ZIP code(s) associated with each census tract to estimate the percentage of overall slots that are subsidized. We then applied these percentages to total child care supply in each census tract to estimate the number of subsidized slots and subtracted these from total population.

American Institutes for Research Analysis of Options for Funding Universal Preschool in Sonoma County—50
Three- and Four-Year-Olds Below 300 Percent of the Federal Poverty Level
in High-Priority ZIP Codes, at 85 Percent Participation Rate
Table 21. Three- and Four-Year-Olds Below 300 Percent FPL at 85 Percent Participation
Rate in the High-Priority ZIP Codes at Current Salaries
Total number of children 5,575
Total number of slots to add (unmet need)
3,562
Year 1 Year 2 Year 3 Year 4 Year 5
New or newly publicly funded slots
80 120 200 240 300
Continuing slots created in prior years
80 200 400 640
Cost per child (increasing 3% per year)
$11,590 $11,937 $12,295 $12,664 $13,044
Number of existing subsidized slots
1,935 1,935 1,935 1,935 1,935
Cost per child to upgrade existing subsidized slots to desired quality (increasing 3% per year)
$2,565 $2,912 $3,270 $3,639 $4,019
Total cost each year $5,889,520 $8,022,573 $11,246,217 $15,146,910 $20,038,452
Year 6 Year 7 Year 8 Year 9 Year 10
New or newly publicly funded slots
360 400 500 600 762
Continuing slots created in prior years
940 1,300 1,700 2,200 2,800
Cost per child (increasing 3% per year)
$13,435 $13,839 $14,254 $14,681 $15,122
Number of existing subsidized slots
1,935 1,935 1,935 1,935 1,935
Cost per child to upgrade existing subsidized slots to desired quality (increasing 3% per year)
$4,410 $4,814 $5,229 $5,656 $6,097
Total cost each year $26,000,265 $32,839,574 $41,475,490 $52,052,415 $65,660,627
Note. The total number of children (three- and four-year-olds) below 300 percent FPL in high-priority ZIP codes was calculated by using three-year averages from the 2012 American Community Survey Public Use Microdata Sample (PUMS) data, disaggregated by ZIP based on Missouri Census Data Center ZIP code to (Public Use Microdata Area (PUMA)) allocation factors, for all ZIP codes associated with Sonoma County’s highest-need elementary schools. This total was multiplied by 85 percent, the assumed participation rate. Unmet need was calculated by subtracting total enrollment for three- and four-year-olds in all subsidized programs (Head Start, Title 5, CalWORKS, and Alternative Payment programs) in each of these ZIP codes, with Head Start enrollment from AIR’s survey of Head Start grantees, and state-supported enrollment from the California Department of Education 801A enrollment reports as of October 2012, as contained in AIR’s ELNAT.

American Institutes for Research Analysis of Options for Funding Universal Preschool in Sonoma County—51
Table 22. Three- and Four-Year-Olds Below 300 percent FPL at 85 percent Participation
Rate in the High-Priority ZIP Codes at Living Wage
Total number of children 5,575
Total number of slots to add (unmet need)
3,562
Year 1 Year 2 Year 3 Year 4 Year 5
New or newly publicly funded slots
80 120 200 240 300
Continuing slots created in prior years
80 200 400 640
Cost per child (increasing 3% per year)
$13,143 $13,538 $13,944 $14,362 $14,793
Number of existing subsidized slots
1,935 1,935 1,935 1,935 1,935
Cost per child to upgrade existing subsidized slots to desired quality (increasing 3% per year)
$4,118 $4,513 $4,919 $5,337 $5,768
Total cost each year $9,020,240 $11,439,252 15,095,062 $19,518,687 $25,065,996
Year 6 Year 7 Year 8 Year 9 Year 10
New or newly publicly funded slots
360 400 500 600 762
Continuing slots created in prior years
940 1,300 1,700 2,200 2,800
Cost per child (increasing 3% per year)
$15,237 $15,694 $16,165 $16,649 $17,149
Number of existing subsidized slots
1,935 1,935 1,935 1,935 1,935
Cost per child to upgrade existing subsidized slots to desired quality (increasing 3% per year)
$6,212 $6,669 $7,140 $7,624 $8,124
Total cost each year $31,827,057 $39,583,253 $49,376,911 $61,371,793 $76,804,339
Note. The total number of children (three- and four-year-olds) below 300 percent FPL in high-priority ZIP codes was calculated by using three-year averages from the 2012 American Community Survey Public Use Microdata Sample (PUMS) data, disaggregated by ZIP based on Missouri Census Data Center ZIP code to (Public Use Microdata Area [PUMA]) allocation factors, for all ZIP codes associated with Sonoma County’s highest-need elementary schools. This total was multiplied by 85 percent, the assumed participation rate. Unmet need was calculated by subtracting total enrollment for three- and four-year-olds in all subsidized programs (Head Start, Title 5, CalWORKS, and Alternative Payment programs) in each of these ZIP codes, with Head Start enrollment from AIR’s survey of Head Start grantees, and state-supported enrollment from the California Department of Education 801A enrollment reports as of October 2012, as contained in AIR’s ELNAT.

American Institutes for Research Analysis of Options for Funding Universal Preschool in Sonoma County—52
Three- and Four-Year-Olds Below 300 Percent of the Federal Poverty Level
in High-Priority Census Tracts, at 70 Percent Participation Rate
Table 23. Three- and Four-Year-Olds Below 300 Percent FPL at 70 Percent Participation
Rate in the High-Priority Census Tracts at Current Salaries
Total number of children 965
Total number of slots to add (unmet need)
682
Year 1 Year 2 Year 3 Year 4 Year 5
New or newly publicly funded slots
40 80 120 200 242
Continuing slots created in prior years
40 120 240 440
Cost per child (increasing 3% per year)
$11,590 $11,937 $12,295 $12,664 $13,044
Number of existing subsidized slots
283 283 283 283 283
Cost per child to upgrade existing subsidized slots to desired quality (increasing 3% per year)
$2,565 $2,912 $3,270 $3,639 $4,019
Total cost each year $1,189,342 $2,256,621 $3,876,382 $6,602,133 $10,033,495
Note. To estimate the total number of children (three- and four-year-olds) below 300 percent FPL in the high-priority census tracts, we used the Child Care Planning Council 2015 report supplement reports of “children from low-income families” (under 70 percent state median income) and “children in families earning just over the eligibility limit,” which together provide the total number of children in families earning $75,000. Because 300 percent FPL for a family of four is $71,550, we multiplied this total by 90 percent to approximate the number of children in the high-priority census tracts below $71,500, or 300 percent of poverty. We then multiplied this population estimate of the number of children below 300 percent FPL by 70 percent, the assumed participation rate. To calculate unmet need, we used data on the number of children enrolled in subsidized slots, with Head Start enrollment obtained from AIR’s survey of Head Start grantees and state-supported enrollment from the 801A reports from the California Department of Education and in all licensed care, for the ZIP code(s) associated with each census tract to estimate the percentage of overall slots that are subsidized. We then applied these percentages to total child care supply in each census tract to estimate the number of subsidized slots and subtracted these from total population.

American Institutes for Research Analysis of Options for Funding Universal Preschool in Sonoma County—53
Table 24. Three- and Four-Year-Olds Below 300 Percent FPL at 70 Percent Participation
Rate in the High-Priority Census Tracts at Living Wage
Total number of children 965
Total number of slots to add (unmet need)
682
Year 1 Year 2 Year 3 Year 4 Year 5
New or newly publicly funded slots
40 80 120 200 242
Continuing slots created in prior years
40 120 240 440
Cost per child (increasing 3% per year)
$13,143 $13,538 $13,944 $14,362 $14,793
Number of existing subsidized slots
283 283 283 283 283
Cost per child to upgrade existing subsidized slots to desired quality (increasing 3% per year)
$4,118 $4,513 $4,919 $5,337 $5,768
Total cost each year $1,691,189 $2,901,550 $4,738,457 $7,829,626 $11,721,001
Note. To estimate the total number of children (three- and four-year-olds) below 300 percent FPL in the high-priority census tracts, we used the Child Care Planning Council 2015 report supplement reports of “children from low-income families” (under 70 percent state median income) and “children in families earning just over the eligibility limit,” which together provide the total number of children in families earning $75,000. Because 300 percent FPL for a family of four is $71,550, we multiplied this total by 90 percent to approximate the number of children in the high-priority census tracts below $71,500, or 300 percent of poverty. We then multiplied this population estimate of the number of children below 300 percent FPL by 70 percent, the assumed participation rate. To calculate unmet need, we used data on the number of children enrolled in subsidized slots, with Head Start enrollment obtained from AIR’s survey of Head Start grantees and state-supported enrollment from the 801A reports from the California Department of Education and in all licensed care, for the ZIP code(s) associated with each census tract to estimate the percentage of overall slots that are subsidized. We then applied these percentages to total child care supply in each census tract to estimate the number of subsidized slots and subtracted these from total population.

American Institutes for Research Analysis of Options for Funding Universal Preschool in Sonoma County—54
Three- and Four-Year-Olds Below 300 Percent of the Federal Poverty Level
in High-Priority ZIP Codes, at 70 Percent Participation Rate
Table 25. Three- and Four-Year-Olds Below 300 Percent FPL at 70 Percent Participation
Rate in the High-Priority ZIP Codes at Current Salaries
Total number of children 4,591
Total number of slots to add (unmet need)
2,578
Year 1 Year 2 Year 3 Year 4 Year 5
New or newly publicly funded slots
80 120 140 180 220
Continuing slots created in prior years
80 200 340 520
Cost per child (increasing 3% per year)
$11,590 $11,937 $12,295 $12,664 $13,044
Number of existing subsidized slots
1,935 1,935 1,935 1,935 1,935
Cost per child to upgrade existing subsidized slots to desired quality (increasing 3% per year)
$2,565 $2,912 $3,270 $3,639 $4,019
Total cost each year $5,889,520 $8,022,573 $10,508,497 $13,627,207 $17,429,630
Year 6 Year 7 Year 8 Year 9 Year 10
New or newly publicly funded slots
300 320 380 420 418
Continuing slots created in prior years
740 1,040 1,360 1,740 2,160
Cost per child (increasing 3% per year)
$13,435 $13,839 $14,254 $14,681 $15,122
Number of existing subsidized slots
1,935 1,935 1,935 1,935 1,935
Cost per child to upgrade existing subsidized slots to desired quality (increasing 3% per year)
$4,410 $4,814 $5,229 $5,656 $6,097
Total cost each year $22,507,051 $28,134,484 $34,918,809 $42,656,406 $50,780,871
Note. The total number of children (three- and four-year-olds) below 300 percent FPL in high-priority ZIP codes was calculated by using three-year averages from the 2012 American Community Survey Public Use Microdata Sample (PUMS) data, disaggregated by ZIP based on Missouri Census Data Center ZIP code to (Public Use Microdata Area [PUMA]) allocation factors, for all ZIP codes associated with Sonoma County’s highest-need elementary schools. This total was multiplied by 70 percent, the assumed participation rate. Unmet need was calculated by subtracting total enrollment for three- and four-year-olds in all subsidized programs (Head Start, Title 5, CalWORKS, and Alternative Payment programs) in each of these ZIP codes, with Head Start enrollment from AIR’s survey of Head Start grantees and state-supported enrollment from the California Department of Education 801A enrollment reports as of October 2012, as contained in AIR’s Early Learning Needs Assessment Tool (ELNAT).

American Institutes for Research Analysis of Options for Funding Universal Preschool in Sonoma County—55
Table 26. Three- and Four-Year-Olds Below 300 Percent FPL at 70 Percent Participation
Rate in the High-Priority ZIP Codes at Living Wage
Total number of children 4,591
Total number of slots to add (unmet need)
2,578
Year 1 Year 2 Year 3 Year 4 Year 5
New or newly publicly funded slots
80 120 140 180 220
Continuing slots created in prior years
80 200 340 520
Cost per child (increasing 3% per year)
$13,143 $13,538 $13,944 $14,362 $14,793
Number of existing subsidized slots
1,935 1,935 1,935 1,935 1,935
Cost per child to upgrade existing subsidized slots to desired quality (increasing 3% per year)
$4,118 $4,513 $4,919 $5,337 $5,768
Total cost each year $9,020,240 $11,439,252 $14,258,443 $17,795,251 $22,107,431
Year 6 Year 7 Year 8 Year 9 Year 10
New or newly publicly funded slots
300 320 380 420 418
Continuing slots created in prior years
740 1,040 1,360 1,740 2,160
Cost per child (increasing 3% per year)
$15,237 $15,694 $16,165 $16,649 $17,149
Number of existing subsidized slots
1,935 1,935 1,935 1,935 1,935
Cost per child to upgrade existing subsidized slots to desired quality (increasing 3% per year)
$6,212 $6,669 $7,140 $7,624 $8,124
Total cost each year $27,865,538 $34,247,392 $41,941,233 $50,716,142 $59,929,783
Note. The total number of children (three- and four-year-olds) below 300 percent FPL in high-priority ZIP codes was calculated by using three-year averages from the 2012 American Community Survey Public Use Microdata Sample (PUMS) data, disaggregated by ZIP based on Missouri Census Data Center ZIP code to (Public Use Microdata Area [PUMA]) allocation factors, for all ZIP codes associated with Sonoma County’s highest-need elementary schools. This total was multiplied by 70 percent, the assumed participation rate. Unmet need was calculated by subtracting total enrollment for three- and four-year-olds in all subsidized programs (Head Start, Title 5, CalWORKS, and Alternative Payment programs) in each of these ZIP codes, with Head Start enrollment from AIR’s survey of Head Start grantees and state-supported enrollment from the California Department of Education 801A enrollment reports as of October 2012, as contained in AIR’s Early Learning Needs Assessment Tool (ELNAT).
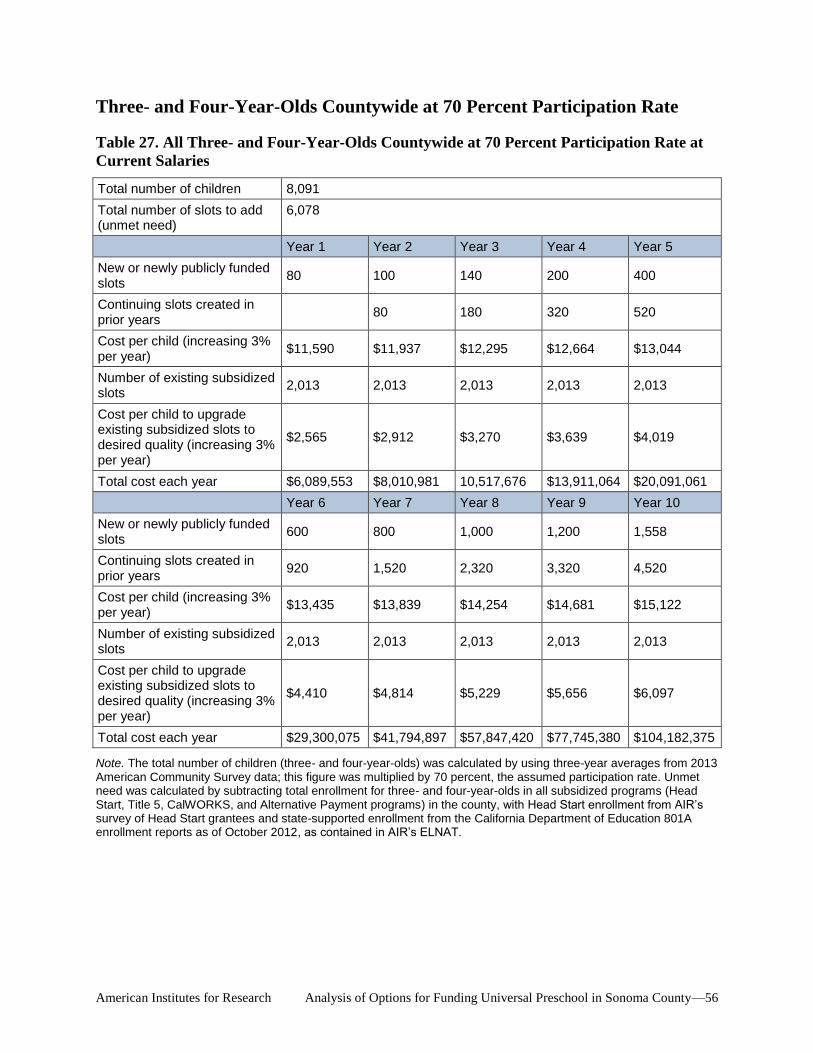
American Institutes for Research Analysis of Options for Funding Universal Preschool in Sonoma County—56
Three- and Four-Year-Olds Countywide at 70 Percent Participation Rate
Table 27. All Three- and Four-Year-Olds Countywide at 70 Percent Participation Rate at
Current Salaries
Total number of children 8,091
Total number of slots to add (unmet need)
6,078
Year 1 Year 2 Year 3 Year 4 Year 5
New or newly publicly funded slots
80 100 140 200 400
Continuing slots created in prior years
80 180 320 520
Cost per child (increasing 3% per year)
$11,590 $11,937 $12,295 $12,664 $13,044
Number of existing subsidized slots
2,013 2,013 2,013 2,013 2,013
Cost per child to upgrade existing subsidized slots to desired quality (increasing 3% per year)
$2,565 $2,912 $3,270 $3,639 $4,019
Total cost each year $6,089,553 $8,010,981 10,517,676 $13,911,064 $20,091,061
Year 6 Year 7 Year 8 Year 9 Year 10
New or newly publicly funded slots
600 800 1,000 1,200 1,558
Continuing slots created in prior years
920 1,520 2,320 3,320 4,520
Cost per child (increasing 3% per year)
$13,435 $13,839 $14,254 $14,681 $15,122
Number of existing subsidized slots
2,013 2,013 2,013 2,013 2,013
Cost per child to upgrade existing subsidized slots to desired quality (increasing 3% per year)
$4,410 $4,814 $5,229 $5,656 $6,097
Total cost each year $29,300,075 $41,794,897 $57,847,420 $77,745,380 $104,182,375
Note. The total number of children (three- and four-year-olds) was calculated by using three-year averages from 2013 American Community Survey data; this figure was multiplied by 70 percent, the assumed participation rate. Unmet need was calculated by subtracting total enrollment for three- and four-year-olds in all subsidized programs (Head Start, Title 5, CalWORKS, and Alternative Payment programs) in the county, with Head Start enrollment from AIR’s survey of Head Start grantees and state-supported enrollment from the California Department of Education 801A enrollment reports as of October 2012, as contained in AIR’s ELNAT.

American Institutes for Research Analysis of Options for Funding Universal Preschool in Sonoma County—57
Table 28. All Three- and Four-Year-Olds Countywide at 70 Percent Participation Rate at
Living Wage
Total number of children 8,091
Total number of slots to add (unmet need)
6,078
Year 1 Year 2 Year 3 Year 4 Year 5
New or newly publicly funded slots
80 100 140 200 400
Continuing slots created in prior years
80 180 320 520
Cost per child (increasing 3% per year)
$13,143 $13,538 $13,944 $14,362 $14,793
Number of existing subsidized slots
2,013 2,013 2,013 2,013 2,013
Cost per child to upgrade existing subsidized slots to desired quality (increasing 3% per year)
$4,118 $4,513 $4,919 $5,337 $5,768
Total cost each year $9,341,462 $11,520,479 $14,363,225 $18,211,534 $25,220,030
Year 6 Year 7 Year 8 Year 9 Year 10
New or newly publicly funded slots
600 800 1,000 1,200 1,558
Continuing slots created in prior years
920 1,520 2,320 3,320 4,520
Cost per child (increasing 3% per year)
$15,237 $15,694 $16,165 $16,649 $17,149
Number of existing subsidized slots
2,013 2,013 2,013 2,013 2,013
Cost per child to upgrade existing subsidized slots to desired quality (increasing 3% per year)
$6,212 $6,669 $7,140 $7,624 $8,124
Total cost each year $35,663,617 $49,833,511 $68,038,055 $90,603,562 $120,584,735
Note. The total number of children (three- and four-year-olds) was calculated by using three-year averages from 2013 American Community Survey data; this figure was multiplied by 70 percent, the assumed participation rate. Unmet need was calculated by subtracting total enrollment for three- and four-year-olds in all subsidized programs (Head Start, Title 5, CalWORKS, and Alternative Payment programs) in the county, with Head Start enrollment from AIR’s survey of Head Start grantees and state-supported enrollment from the California Department of Education 801A enrollment reports as of October 2012, as contained in AIR’s ELNAT.

American Institutes for Research Analysis of Options for Funding Universal Preschool in Sonoma County—58
Three- and Four-Year-Olds Countywide at 70 Percent Participation Rate,
Free for Children Below 300 Percent FPL, and a 25 Percent Tuition Credit
for Children at or Above 300 Percent FPL
Table 29. All Three- and Four-Year-Olds Countywide at 70 Percent Participation Rate,
Free for Children Below 300 Percent FPL, and a 25 Percent Tuition Credit for Children at
or Above 300 Percent FPL at Current Salaries
Total number of children 8,091
Total number of slots to add or partially public support (unmet need)
6,078
Total number of slots to add for children below 300% FPL at full cost
3,021
Total number of slots for children at or above 300% FPL to receive tuition credit
3,057
Year 1 Year 2 Year 3 Year 4 Year 5
New or newly partially public supported slots
80 100 140 200 260
Continuing slots created in prior years 80 180 320 520
Cost per child (increasing 3% per year) $11,590 $11,937 $12,295 $12,664 $13,044
Number of existing subsidized slots 2,013 2,013 2,013 2,013 2,013
Cost per child to upgrade existing subsidized slots to desired quality (increasing 3% per year)
$2,565 $2,912 $3,270 $3,639 $4,019
25% of cost for each child at or above 300% FPL
$8,857,006 $9,122,716 $9,396,397 $9,678,289 $9,968,638
Total cost each year $14,946,559 $17,133,697 $19,914,074 $23,589,353 $28,233,523
Year 6 Year 7 Year 8 Year 9 Year 10
New or newly partially publicly supported slots
300 380 420 500 641
Continuing slots created in prior years 780 1,080 1,460 1,880 2,380
Cost per child (increasing 3% per year) $13,435 $13,839 $14,254 $14,681 $15,122
Number of existing subsidized slots 2,013 2,013 2,013 2,013 2,013
Cost per child to upgrade existing subsidized slots to desired quality (increasing 3% per year)
$4,410 $4,814 $5,229 $5,656 $6,097
25% of cost for each child at or above 300% FPL
$10,267,697 $10,575,728 $10,893,000 $11,219,790 $11,556,384
Total cost each year $33,656,180 $40,469,515 $48,215,156 $57,547,262 $69,507,175
Note. The total number of children (three- and four-year-olds) was calculated by using three-year averages from 2013 American Community Survey data; this figure was multiplied by 70 percent, the assumed participation rate. Unmet need was calculated by subtracting total enrollment for three- and four-year-olds in all subsidized programs (Head Start, Title 5, CalWORKS, and Alternative Payment programs) in the county, with Head Start enrollment from AIR’s survey of Head Start grantees and state-supported enrollment from the California Department of Education 801A enrollment reports as of October 2012, as contained in AIR’s ELNAT.

American Institutes for Research Analysis of Options for Funding Universal Preschool in Sonoma County—59
Table 30. All Three- and Four-Year-Olds Countywide at 70 Percent Participation Rate,
Free for Children Below 300 Percent FPL, and a 25 Percent Tuition Credit for Children at
or Above 300 Percent FPL at Living Wage
Total number of children 8,091
Total number of slots to add or partially publicly support (unmet need)
6,078
Total number of slots to add for children below 300% FPL at full cost
3,021
Total number of slots to add for children at or above 300% FPL to receive tuition credit
3,057
Year 1 Year 2 Year 3 Year 4 Year 5
New or newly publicly supported slots 80 100 140 200 260
Continuing slots created in prior years 80 180 320 520
Cost per child (increasing 3% per year) $13,143 $13,538 $13,944 $14,362 $14,793
Number of existing subsidized slots 2,013 2,013 2,013 2,013 2,013
Cost per child to upgrade existing subsidized slots to desired quality (increasing 3% per year)
$4,118 $4,513 $4,919 $5,337 $5,768
25% of cost for each child at or above 300% FPL
$10,044,387 $10,345,719 $10,656,091 $10,975,773 $11,305,047
Total cost each year $19,385,850 $21,866,198 $25,019,315 $29,187,308 $34,454,081
Year 6 Year 7 Year 8 Year 9 Year 10
New or newly publicly supported slots 300 380 420 500 641
Continuing slots created in prior years 780 1,080 1,460 1,880 2,380
Cost per child (increasing 3% per year) $15,237 $15,694 $16,165 $16,649 $17,149
Number of existing subsidized slots 2,013 2,013 2,013 2,013 2,013
Cost per child to upgrade existing subsidized slots to desired quality (increasing 3% per year)
$6,212 $6,669 $7,140 $7,624 $8,124
25% of cost for each child at or above 300% FPL
$11,644,198 $11,993,524 $12,353,330 $12,723,929 $13,105,647
Total cost each year $40,603,706 $48,330,446 $57,114,477 $67,697,959 $81,260,933
Note. The total number of children (three- and four-year-olds) was calculated by using three-year averages from 2013 American Community Survey data; this figure was multiplied by 70 percent, the assumed participation rate. Unmet need was calculated by subtracting total enrollment for three- and four-year-olds in all subsidized programs (Head Start, Title 5, CalWORKS, and Alternative Payment programs) in the county, with Head Start enrollment from AIR’s survey of Head Start grantees and state-supported enrollment from the California Department of Education 801A enrollment reports as of October 2012, as contained in AIR’s ELNAT.
Cost Estimate and Phase-In Plan for Expanding Access to Home Visiting
Programs for Children Ages 0–3 Years
In addition to expanding to universal preschool, Sonoma County also has expressed an interest in
expanding evidence-based home visiting services such as the Nurse-Family Partnership (N-FP)
to families beginning at pregnancy to age 2. With its focus on both mother and baby, N-FP takes
a two-generation approach to reduce potential risk factors and enhance protective factors that

American Institutes for Research Analysis of Options for Funding Universal Preschool in Sonoma County—60
result in well-documented improvements in pregnancy and child health outcomes, as well as
economic self-sufficiency for the whole family (Nurse-Family Partnership, 2011).
Health Policy, Planning, and Evaluation staff from the Sonoma County Department of Health
Services provided us with the current cost per child of home visiting services through the N-FP
model, which is approximately $6,536 per family per year. Currently, the county is only able to
enroll approximately 11.25 percent of eligible families (first-time pregnant women who are
eligible for Medi-Cal or WIC), which is an active caseload of 240 families in a given year,
served by a team of eight nurses.
The county’s goal, however, is to serve up to 25 percent of eligible families. Given the nurse-to-
families ratios to which N-FP staff must adhere, the most feasible way to reach, or nearly reach,
this goal is to double the team of nurses. This will allow the program to serve a caseload of 480
families—or an estimated 22.5 percent of the eligible population—simultaneously. Because the
program provides services beginning at pregnancy until the child’s second birthday, most
families participate for more than one year. However, there is also some attrition in participation.
Accounting for both of these factors, enrolling 180 new families per year (double the current 90
families typically enrolled in a year) would yield an average caseload of 480 families at any one
time. The cost to serve these new families (180 new enrollees per year, for a total annual
caseload of 480 families) is estimated at approximately $3.1 million, an increase of about $1.6
million over current costs if implemented immediately. Given the current 35 percent federal
match, approximately $2 million of this cost is expected to fall on Sonoma County. It is
estimated that scaling up N-FP over five years (assuming a 3 percent annual increase) would cost
$3.5 million in the final year to serve 480 families.

American Institutes for Research Analysis of Options for Funding Universal Preschool in Sonoma County—61
Recommendations for Funding and Phasing in Universal
Preschool in Sonoma County
By examining the 12 preschool initiatives, interviewing Sonoma County stakeholders,
conducting cost analyses, and reviewing the pros and cons of various funding options, AIR offers
the following 10 recommendations for financing and phasing in universal access to quality
preschool in Sonoma County.
What Is the Ultimate Goal?
1. Clearly define the county’s ultimate goal as providing access to quality preschool for all
three- and four-year-old children in the county.
Defining universal or providing access to all is important. As will be discussed in this section,
providing access to all does not necessarily mean making preschool free to all. However, a
universal preschool initiative typically aims to allow all children regardless of family income to
participate. Some research indicates that children who are disadvantaged do better when enrolled
in preschool programs with peers from a variety of social and economic backgrounds (Schechter
& Bye, 2007). Thus, even though most universal preschool initiatives start by expanding and
enhancing services in low-income neighborhoods, they typically offer preschool services to all
children, regardless of family income, who live in those neighborhoods.
As emphasized throughout this report, it also is important to stress that the goal is to increase
access to a level of preschool quality that can be expected to enhance child outcomes. In some of
the preschool initiatives that we analyzed, such as San Francisco, a majority of the initiative
funds are used to enhance the quality of services partially funded by other public sources, not to
fund the entire per child cost.
In addition, it is wise to set a goal for serving both three- and four-year-old children, even if the
initial focus is on four-year-olds. Research indicates that two years of preschool lead to better
results than one year, especially for disadvantaged children, although the impact of the second
year may be less than the first (Yoshikawa et al., 2013). A two-year focus also provides flexibility
for shifting any new local funds that become available to support three-year-old children if a
federal or state measure at some point makes funds available to serve all four-year-old children.
Stakeholders in Seattle specifically noted that Sonoma County should be aware of what is
happening at the state and federal levels. They indicated that one reason not to start out “too big,
too fast” is that then you can build a system that responds to increased funding from state and
federal sources. During the last decade, multiple efforts have been made at the state level and, in
recent years, at the federal level, to expand access to preschool. The lack of success to date of
these efforts in obtaining sufficient funds even to serve all four-year-olds from economically
disadvantaged backgrounds underscores the interest in and need for local initiatives. Local
initiatives should be sufficiently flexible to incorporate and invest any new state and federal
dollars that eventually become available.
Finally, it may be important to focus on the word preschool. Clearly, preschool is not the only
form of early care and education that can make a case for public support. A strong evidence base

American Institutes for Research Analysis of Options for Funding Universal Preschool in Sonoma County—62
exists for other programs, such as home visiting and high-quality care for infants and toddlers.
However, efforts to obtain public support for one initiative for a broad array of services may be
less apt to succeed than a more narrowly defined program. In Denver, two efforts to mount a
ballot initiative for a broad array of services, which included home visiting and other forms of
child care as well as preschool, failed with less than 30 percent support. In response to these
disappointing results, advocates conducted polling and learned that the broad range of services
confused voters. However, the voters understood and resonated with the concept of preschool.
When the initiative was reframed to focus on preschool, it passed. Thus, as Sonoma County
considers a possible preschool initiative, it will be important to make sure that the wording and
the scope of the initiative make sense to the public asked to support the effort.
Free Versus Sliding-Scale Support
2. Plan to provide free preschool to families below 300 percent of the federal poverty level
and on a sliding scale to families above that income level.
Determining exactly how much financial assistance a universal preschool initiative can provide
and for which children depends, of course, on the type and level of revenue that is available. If a
universal preschool measure is supported as part of public school funding, as in Boston, it might
indeed be free to all. But many of the preschool initiatives we examined in some way provide
more financial help to children from lower income families and significantly less support for
children from higher income families.
Seattle, now launching its first year of implementation, will make preschool free to children from
families below 300 percent of the federal poverty level in 2015, or $72,750 for a family of four,
and the program will offer a sliding fee schedule for children from higher income families.
Denver, which began implementing its universal preschool initiative in 2007, offers preschool
tuition credits to families, with the credit ranging from $14 to $662 per month—depending on
family income, the level of service chosen (half day, full day, or extended day), and the quality
rating of the provider—toward the full cost of the program. By limiting the level of credit given
to higher income families, Denver is able to provide some assistance to 54 percent (5,000) of the
four-year-olds in the city at a cost of approximately $13 million.
AIR’s recommendation to provide free services in Sonoma County up to the Seattle level of
300 percent of the federal poverty level is based partly on the proportion of family income that
paying for the full cost of preschool would absorb. Paying the full $13,414 we estimate is
necessary to pay for full-day, full-year preschool for even one child would require 18 percent of
the income of a family of four at 300 percent of the federal poverty level, and 36 percent for two
preschool-age children. Families up to that income level may indeed have difficulty paying for a
quality preschool program.
Making full-day, full-year preschool free to all three and four year olds in families below 300
percent of the federal poverty level and on a sliding fee scale to families above that level would
cost about $69.5 million in the final year of phase-in at current salaries, or $81 million if salaries
were increased to a living wage.

American Institutes for Research Analysis of Options for Funding Universal Preschool in Sonoma County—63
If the revenue for universal preschool is not sufficient to provide services free to all children up
to 300 percent of the federal poverty level countywide, then the county might consider doing so
in high-priority census tracts where the level of need is the greatest. The county might also
consider offering free services to those up to 70 percent of the state median income, the current
income limit for eligibility for Title 5 State Preschool, or even 185 percent of the federal poverty
level, which is the maximum income for eligibility for free or reduced-price lunch. This would
make services free to a family of four with an income of up to $44,863.
Alternatively, the county might decide to provide free preschool to children from families up to
300 percent of the federal poverty level but to reduce the cost by supporting a school day, school
year (six hours, 10 months) rather than a full-day, full-year (eight to 10 hours, 12 months)
service. This option could significantly reduce the cost of the initiative. As in San Francisco,
families might still choose a full day of service, but the cost of the extended day would have to
be supported by other public or private sources, or by the family itself.
Determining the proportion of children who will be eligible for free preschool services, of
course, has implications for the sliding fee scale and how generous the county can be in helping
families with somewhat higher incomes afford quality preschool. Based on the 12 preschool
initiatives we examined, the level of support provided to families regardless of family income
varies greatly. In Seattle, families pay from 0 percent to 95 percent of the tuition cost of
preschool. Families living at or below 300 percent of federal poverty level pay no fees, whereas
families at or above 760 percent of the federal poverty level pay 95 percent of the tuition. In
contrast, preschool initiatives in Boston, the District of Columbia, and New York City do not
implement a sliding scale and actually make preschool free to all regardless of family income.
Leverage Existing Revenue Sources
3. Maximize leverage of existing state and federal revenue sources: Title 5 State Preschool,
Head Start, Transitional Kindergarten, and Title I.
To expand access to quality preschool, Sonoma County would do well to ensure that it is
obtaining all the existing state and federal revenue for preschool for which it is eligible.
As California attempts to restore Title 5 State Preschool slots that were cut during the Great
Recession, the Community Child Care Council of Sonoma County has applied for an additional
48 full-day restored slots, and North Bay Children’s Center has applied for 24 full-day restored
slots. In addition, because of the loss of facilities or the need to renovate them, the county and
First 5 Sonoma County created a grant fund of $655,000 to help address these facilities issues,
which had placed a total of 144 existing Head Start slots and 98 Title 5 State Preschool slots at
risk (Collier, 2015; Hansen, 2015).
Going forward, it will be important for the county to watch for any new Title 5 State Preschool
slots for which it may apply and follow the progress of AB 47 and next year’s state budget. If
implemented and funded, AB 47 in its August 2015 form calls on the state to make Title 5 State
Preschool available to all eligible four-year-old children, which, at 70 percent of the state median
income, would mean all four-year-old children living in families with incomes up to
approximately $53,974 for a family of four, per the 2011–2013 American Community Survey
American Institutes for Research Analysis of Options for Funding Universal Preschool in Sonoma County—64
(U.S. Census Bureau, 2014). If such an initiative were enacted, Sonoma County might gain up to
1,151 new state-funded preschool slots.1 However, the state measure would address only the
unmet need for four-year-old children. It would not provide support to many lower middle-
income families having difficulty paying for child care. This state measure also would probably
cover only about two thirds of the real cost of a full day of preschool estimated in this report,
even for preschools paying teachers less than a living wage. Finally, Governor Brown has not
signed similar measures in the past.
Equally important is to ensure that Sonoma County maximizes its use of Transitional
Kindergarten funds. Recent trailer language in the state budget bill now allows districts to enroll
four-year-old children in transitional kindergarten, with the caveat that districts will not receive
state average daily attendance funding until these children turn five years old later in the school
year. However, some districts, such as the Los Angeles Unified School District, have chosen to
serve more four-year-old children in Transitional Kindergarten rather than in State Preschool
because per-pupil funding for elementary school (which varies under the new local control
funding formula depending on the district’s specific demographics) is typically substantially
higher than the per-child reimbursement rates for Title 5 State Preschool programs. Children in
transitional kindergarten also are taught by a well-trained, credentialed teacher who aligns
instruction with the kindergarten curriculum, factors that may support better academic outcomes
for children later. The possibility that the state might further expand access to transitional
kindergarten highlights the wisdom of crafting a local initiative which would support three-year-
olds if more state funding becomes available for four-year-olds.
Finally, Sonoma County might convene superintendents of Title I schools to discuss the
possibility of their investing federal Title I funds in preschool. As seen in Elk Grove and in
Chicago, Title I funds can be spent on preschool for any child, regardless of income, attending a
Title I school, and can provide the funds necessary to support a schoolwide initiative that makes
preschool free to all in the school. The funds are flexible and can be spent to increase teacher
salaries and other quality improvements. According to our research, no school district in Sonoma
County currently invests Title I funds in preschool. However, it should be noted that in FY
2006–07, California only spent a statewide total of $12.6 million in Title I funds on preschool
programs (Karoly et al., 2007). The main obstacle to obtaining Title I funds, as stated above, for
preschool is simply the need to provide compensatory services to older children, even though
evidence proves that investments in services for younger children are more effective and help
reduce the need for compensatory education later on (Heckman et al., 2009).
Need for Additional Revenue
4. Recognize that existing state and federal revenues are not enough—and are unlikely ever
to be enough—to fund universal preschool in Sonoma County. Consequently, increased
local revenue is needed to make universal preschool a reality.
Based on AIR’s cost analysis and phase-in options for universal preschool in Sonoma County,
none of the existing state and federal sources would be sufficient to support a countywide
1 We estimated the number of eligible four-year-old children living at 70 percent of the state median income using
AIR’s Early Learning Needs Assessment Tool.

American Institutes for Research Analysis of Options for Funding Universal Preschool in Sonoma County—65
initiative. Even the least expensive options (scenarios 1, 3, and 5), limiting access to all four-
year-olds in the high-priority census tracts or to three- and four-year-olds below 300 percent of
the federal poverty level in the same census tracts, would cost between $10 million and $13
million at current salaries. Even if the Title I schools in these neighborhoods diverted all their
Title I funds from other age groups to focus on preschool services, which is highly unlikely,
these Title I funds likely would not be enough to fund the entire cost of the initiative. For
example, Elk Grove’s current Title I preschool program serves only 200 children in a part-day,
school-year program that is funded with $1.3 million annually from Title I funds. By using a
portion of the district’s Title I funds, Elk Grove can serve only a portion of its eligible preschool
population. The district uses Head Start funds to serve additional children. Financing a broader
initiative of $69 million or more—the cost to serve all children under 300 percent poverty at a 70
percent participation rate incorporating a sliding fee scale—would clearly require much greater
revenue than is currently available.
Determining the type of finance mechanism that would work best in Sonoma County is as much
a political decision as a research question. Based on our examination of preschool initiatives
across the United States, the mechanism might be a sales tax increase, which raises $13 million
per year in Denver and $31 million per year in San Antonio. Or it could be a property tax
increase, which is expected to raise $58 million over four years in Seattle. Alternatively, it could
be a set-aside from the county’s general fund, which generates $27.2 million per year for
preschool in San Francisco; because the funding for this set-aside actually comes from
dedicating 4 percent of the property tax revenue to the fund, it may be seen as an indirect way of
using property taxes to finance preschool without actually increasing the tax. Another option
could be, as in Washington, D.C., a combination of district funding, Head Start funds, and a set-
aside from the city’s general fund, which generates $191 million per year. California’s
requirement for a two-thirds majority to pass either a sales tax dedicated to a specific purpose or
a property tax poses a significant hurdle. As suggested later in these recommendations, Sonoma
County might be able to surmount this hurdle by mounting a public education campaign as done
in Denver after two prior ballot measures failed there. In addition, an additional sales tax might
not be enough on its own. For example, Sonoma County’s Measure A, the failed transportation
measure, was a 0.25 percent sales tax increase that county officials estimated would raise
$20 million per year. If the county proposed a similar sales tax measure, then it would likely
need to either reduce the hours of service to six versus eight hours of service or provide tuition
credits rather than the full cost of preschool for those above 300 percent of the federal poverty
level or begin by phasing in the program for only four-year-old children. A set-aside from the
county general fund, as in San Francisco, might be worthy of consideration, but no set-aside
currently exists for education, and the entire budget allocation from the county for the
Department of Health in 2014–15 was $41 million.
We also considered the merits of some newer, more innovative finance mechanisms. In Chicago,
although Title I remains the primary financing mechanism for the renowned CPCs, the initiative
is now receiving $17 million across a four-year period from a Pay for Success bond to expand
services. Similarly, Salt Lake is obtaining nearly $3 million per year from a Pay for Success
bond. Both of these bonds were initially financed by private entities, which will eventually
obtain the savings generated by the bonds. Hence, the Pay for Success approach requires finding
an entity to float the bond and makes a promise to pay back the investor with some percentage of
the total cost savings, based on meeting metrics agreed on under the terms of the loan.

American Institutes for Research Analysis of Options for Funding Universal Preschool in Sonoma County—66
Therefore, some of the savings realized by implementing a preschool program would be returned
to the investor rather than reinvested in expanding or upgrading the preschool services
themselves.
An interesting, smaller-scale finance mechanism that we discovered in the course of our
examination of preschool initiatives is in New Orleans, where a portion of golf course fees from
a facility near an Educare program (Educare, n.d.), is being reserved to help finance early care
and education services. Although the fees are expected to generate only $250,000–$350,000 per
year, a small fraction of the center’s total operating cost, the buy-in from the golf club members
may help increase public and business community awareness and support for this center and
perhaps could generate interest in the broader implementation of preschool services. Sonoma
County might investigate the possibility of requesting some limited support from golf course fees
or wine club memberships, especially where these activities are adjacent to preschool facilities.
It also may be important to rule out some revenue sources as the primary funding mechanism for
universal preschool. For many years, First 5 California and local First 5 commissions have
provided some of the most significant new funds for improving and expanding preschool
services in California. Although First 5 support continues to be the major source of funding for
LAUP and West Sacramento’s preschool initiative, the decline in Proposition 10 revenues from
the tobacco tax limits the amount of new preschool slots that First 5 dollars can support. In
addition, the First 5 California preschool grant funding that these two programs currently use as a
primary funding source is set to end in 2015. Already, West Sacramento, which relied on First 5
support as its major revenue for universal preschool, is looking for replacement funding.
In summary, most of the leaders of the preschool initiatives we examined, as well as the Sonoma
County stakeholders we interviewed, stressed that a dedicated new local funding stream is
essential for implementing a successful universal preschool initiative. A sales tax increase would
be an effective dedicated funding stream, but it will require a substantial public education
campaign to meet the two-thirds voter support requirement. A set-aside from the county general
fund, as in San Francisco, also would be effective, but we are unsure whether the current level of
revenue collected from the property tax for that fund would be sufficient to cover most of the
phase-in options provided in this report. AIR recommends that Sonoma County consider either
the sales tax increase or the set-aside from the general fund, but only if these measures are
accompanied by a substantial public education campaign. A Pay for Success bond would be an
appealing accompaniment to a dedicated public funding stream, but it is best viewed as less than
a primary funding mechanism for a countywide universal preschool initiative.
Finding New Revenue for Facilities
5. Adopt a separate funding source or reserve a specific percentage of any new revenue for
preschool facilities.
From the outset of our exploration of finance options for universal preschool in Sonoma County,
it has been clear that a lack of facilities poses a significant barrier to expanding services. Neither
Title 5 State Preschool nor Head Start supplies funds specifically for facilities. Consequently,
programs often obtain or rent space in schools for which schools are willing to donate the space
at a reduced or little cost during periods of declining enrollment, but then the programs may

American Institutes for Research Analysis of Options for Funding Universal Preschool in Sonoma County—67
reclaim the space when demands for enrolling older children increase. Thus, this year Sonoma
County had to request $305,000 from the Board of Supervisors plus $350,000 from First 5
Sonoma simply to create enough facilities to restore slots that were cut during the Great
Recession and for which the state of California is now making funds available to restore (Collier,
2015).
As part of the planning for universal preschool, AIR therefore recommends that at least
10 percent of any new revenue source for preschool be reserved for constructing and renovating
facilities. If Sonoma County decides to seek and is successful in obtaining a new revenue source
dedicated to preschool, then during at least the first two years of program implementation, a
much greater proportion of the funds might be invested in facility construction and renovation.
From our examination of other preschool initiatives, we learned that other programs faced
similar challenges as Sonoma County currently faces with regard to facilities for preschool. For
example, San Antonio and Seattle dealt with this issue specifically by setting aside money from
within their main funding mechanisms for facilities. West Sacramento and San Francisco are
examples of programs that used other funding sources outside the primary funding mechanism,
such as developer impact fees and CDBG funds, to pay for building and improving facilities.
Developer impact fees are fees typically assessed per unit and levied on new construction
projects. They are used to fund off-site capital projects and improvements that are necessary to
support the development and the people who will live or work there (Duncan Associates, n.d.).
Impact fees are most often associated with infrastructure, such as roads or sewer and water lines,
but they also can be used to fund school buildings, improvements, and expansions. For example,
San Francisco requires new office and hotel development projects to provide in-house child care
facilities or pay a fee to the city’s Child Care Capital Fund (City of San Francisco, 2010). West
Sacramento also levies a child care impact fee on new development. The city has used funds
from this fee to provide capital improvements to its partner providers and build two city-run
preschool classrooms. Per the Permit and Resource Management Department (2015), Sonoma
County already levies building permit fees that can include fees targeted toward school
improvements, depending on where the project is built.
CDBG funds are another type of funding mechanism that can be used for child care facilities.
These grants, administered by the U.S. Department of Housing and Urban Development (n.d.),
are primarily designated for low-income housing, but they also can be used to fund services that
aid in economic support, such as child care facilities. The two main types of CDBG funding are
entitlement programs and state programs. Entitlement programs consist of direct funding from
the federal government that is available to cities of 200,000 people or more as well as certain
urbanized counties. State programs, also known as the Small Cities CDBG program, offer funds
to cities and towns that do not qualify as entitlement areas. The city of San Francisco has used
CDBG funds to plan and build new preschools through the Low Income Investment Fund. The
city of West Sacramento also has used CDBG money to supplement preschool tuition grants
through the Small Cities CDBG program, but the restrictions placed on these funds can change,
so they cannot always be budgeted for this purpose.

American Institutes for Research Analysis of Options for Funding Universal Preschool in Sonoma County—68
Mount a Public Education Campaign
6. Invest in and mount a public education campaign to build the case for the additional
revenue needed.
Critical to the success of attempts to raise taxes to support a preschool initiative in Sonoma
County will be the development of a public education campaign. Denver provides a good
example of the importance of public awareness campaigns. Denver’s history of trying to get a
universal preschool program established goes back to the early 2000s, when two attempts at
passing an education sales tax failed miserably, garnering less than 30 percent of the vote each
time. When John Hickenlooper was elected mayor, he worked to build a coalition to draft a
proposal, and the city ran an extensive television education campaign that raised public
awareness and most likely led to the successful outcome. Even with the extensive campaign, the
November 2006 ballot measure was narrowly approved, by fewer than 2,000 votes. When the
initiative went back to the ballot in 2014, asking voters to extend the program until 2026 and
raise the tax to 0.15 percent, the city touted the positive results of the program, citing improved
third-grade standardized test scores from children who had been preschool students in the first
few years of the program. Voters approved the 2014 measure with 55 percent of the vote.
In our interviews with San Francisco stakeholders and Jolene Smith of First 5 Santa Clara, the
interviewees stressed the importance of conducting polling to determine the needs and the type
of education campaign required. These interviewees also indicated that the timing of the ballot
initiative also could contribute to its success or failure. For example, if the measure is on a ballot
at a time when there will most likely be low voter turnout, the likelihood of the measure passing
is small. If the measure is on a ballot at a time when there will likely be other measures for voters
to consider, the result also could be detrimental.
These interviewees also reported that the wording of the ballot initiative could impact the
outcome at the polls. For example, in Denver, according to the stakeholders interviewed, the first
two ballot measures failed because they were too broad, and the voters were unclear as to what
they were voting for. The first two measures in Denver were worded as birth to age 5 initiatives
and included child care, home visiting, and some health components.
Stakeholders across almost all the preschool initiatives also reported on the importance of
building partnerships as part of the planning process. In particular, stakeholders in Salt Lake,
Denver, San Francisco, Seattle, San Antonio, and Boston all noted working with districts and
community child care and advocacy groups. San Antonio and Denver also specifically included
representatives from the business community in the coalitions that developed the plans for their
programs.
Based on the experience of these other preschool initiatives, it will be important for Sonoma
County to strengthen its coalition of support for universal preschool. Assembling district
superintendents as well as local chambers of commerce would be helpful. As discussed earlier in
this report, most of the successful preschool initiatives have had a mayor, a school
superintendent, or other key local champion.
American Institutes for Research Analysis of Options for Funding Universal Preschool in Sonoma County—69
Evidence-Based Framework
7. Establish an evidence-based framework for quality programs that will achieve the
promised benefits of preschool.
All the preschool initiative leaders we interviewed stressed the importance of establishing a
framework for quality likely to achieve the promised benefits of investing in preschool, such as
reduced grade repetition, less use of special education and welfare, and higher rates of school
attendance and achievement. As one of the directors of Seattle’s new preschool program noted,
“It’s all about the quality.”
Most of the preschool initiatives we examined place a premium on enhancing lead teacher
requirements for preschool programs, often to a level of education required for K–12 teachers
with a level of compensation approaching if not equaling that of K–12 teachers. Other quality
elements of some programs include having a master-level teacher provide support to several
classrooms, having a robust family engagement component, assessing classrooms and providing
coaching to meet the shortfalls identified, and having a research-based curriculum. San Francisco
interviewees noted that they had to slow down the implementation of their initiative when they
discovered through classroom assessments that many of the participating programs required
significant improvement.
That said, some of the preschool initiatives, most notably Denver and San Francisco, set less
stringent entry-level requirements for preschool providers but provide incentives for the
programs to meet higher standards. In Denver, the entry-level requirement is to meet Level 3 of
the Colorado Shines QRIS. Denver offers higher reimbursement rates for preschool programs
that meet higher standards. Across the years, a higher proportion of participating programs have
met the higher requirements, and a greater proportion of families are choosing the higher rated
programs.
Given that 16 California counties, including Los Angeles and San Francisco, are already
adopting the Race to the Top QRIS, we recommend that Sonoma County consider this system as
a framework for its preschool initiative. Although the county is not one of the initial 16 counties
in the QRIS, the county might set entry-level requirements for provider participation at Level 3
on the Race to the Top QRIS, with higher reimbursement rates for programs meeting Level 4 or
Level 5 standards. Other important quality QRIS components include conducting classroom
assessments using ECERS and CLASS and providing coaching or professional development.
Making Connections
8. Attach preschool programs to elementary schools where possible but allow for the
participation of community preschool providers.
As noted in A Portrait of Sonoma County (Burd-Sharps & Lewis, 2014), attaching preschool
programs to elementary schools, such as in El Verano in Sonoma County, is an attractive model for
implementing new preschool programs. Doing so helps involve families early on in their children’s
education outside the home and may lead to their continuing engagement as their children advance

American Institutes for Research Analysis of Options for Funding Universal Preschool in Sonoma County—70
to kindergarten and beyond. Access to support services, such as a school nurse, early intervention,
and even transportation and food services, may be greater in a public school setting.
However, it also is wise to allow for the participation of community preschool providers in the
initiative. First, some families prefer to have their preschool-age children enrolled in the same
settings as their infants and toddlers. Second, some prefer a smaller setting or a program with a
specific curriculum. Finally, even when a local initiative is based on or receives strong support
from public schools, as in Boston, schools may run out of space to house the programs, and
additional services must be sought from community preschool providers.
Program Services
9. Plan for at least a full-day (six hours), school-year program to achieve educational goals,
with opportunities to obtain extended-day, extended-year services.
Most of the preschool initiatives we examined provide families the option of at least a six-hour,
school-year program (i.e., eight initiatives offer at least a six-hour, school-year program: San
Antonio, Seattle, the District of Columbia, Boston, New York, Denver, West Sacramento, and
San Francisco). Denver, West Sacramento, and San Francisco support both half-day and full-day
programs at varying levels, and families can choose full-day services but the cost of the extended
day is supported by other public or private sources or by the family itself.
The reasons for at least a six-hour day include that a partial-day schedule is simply inaccessible
for many working families and may pose a barrier to enrollment for some children who would
most benefit from the program. Although a longer day of eight to 10 hours may be necessary for
many families with preschool-age children, that length of day may be too long for most three-
and four-year-old children, and a supplementary extended-day program of a different type is
advisable for this age group.
As discussed in the cost estimate section of this report, AIR suggests that Sonoma County
consider using the expenditure per child we estimated for an initiative using the living wage to
pay preschool personnel but reduce the hours of service covered by the initiative to up to
6.5 hours, thereby freeing up some of the funds to improve the quality of service. Families
needing the longer hours of service would still be able to choose this option, with the additional
hours covered by parent fees or subsidized child care for eligible children.
Phase in the Program
10. Phase in the preschool initiative across 10 years to ensure program quality and allow
time for the construction of facilities, beginning in the areas of highest need.
Most of the preschool initiatives that we examined were phased in gradually; even in cases where
the implementation was more rapid, the stakeholders we interviewed recommended phasing in
gradually based on experience. For example, in San Francisco, city funding was meant to phase in
within five years, but the program was not fully funded or implemented until 2014, which was
actually a 10-year time frame. San Francisco interviewees also recommended phasing in
gradually based on their experience of conducting a needs assessment and realizing that it would

American Institutes for Research Analysis of Options for Funding Universal Preschool in Sonoma County—71
take more than five years to have enough providers that met the quality standards for the program.
In contrast, Denver and New York phased in rather quickly. For example, Denver began the
program with 250 providers at full implementation and allowed providers to join provisionally,
with improvement plans to increase quality. This is in contrast to San Francisco, where providers
were allowed to participate only after they had met the quality standards.
Based on our examination of preschool initiatives across the United States, AIR advises that
Sonoma County consider a 10-year phase-in period for the full implementation of its preschool
initiative. Hence, the county might begin by implementing the initiative in the census tracts with
the most children who are disadvantaged and the greatest unmet need, achieving this objective
by Year 5 of the initiative. Meanwhile, the initiative also could support the construction or the
renovation of facilities, coaching and other professional development for the staff, and overall
upgrading of the quality of service. Full implementation would be at 70 percent participation by
Year 10. None of the preschool initiatives we examined is at 100 percent participation.
Furthermore, as indicated in many parts of this report, the cost of full implementation may be
significantly reduced by several factors: increases in other funding streams, such as Title 5 State
Preschool and Transitional Kindergarten, providing less than eight to 10 hours or a full year (12
months) of service, and limiting the contribution of the initiative to higher income families by
implementing a sliding fee scale.
Summary
Based on AIR’s research on 12 preschool initiatives, a cost analysis, and interviews with area
stakeholders, making universal preschool a reality is feasible in Sonoma County. A successful
universal preschool initiative in the county would include the following steps:
Define the goal clearly as “access to quality preschool for all three- and four-year-olds.”
Offer free preschool up to 300 percent of the federal poverty level and on a sliding scale
to families above that level.
Establish a framework for quality.
Plan for at least a school-day, school-year calendar, with provisions for extended day and
year.
Make the most of existing state and federal funding.
Obtain a dedicated new funding source for preschool.
Adopt a separate funding source or reserve a specific percentage of any new revenue
source for facilities.
Attach preschool programs to elementary schools where possible but offer a mixed-
delivery system including community-based providers.
Conduct a public education campaign on the benefits of investing in quality preschool.
Phase in the preschool initiative across a period of up to 10 years, beginning in the
neighborhoods of greatest unmet need.

American Institutes for Research Analysis of Options for Funding Universal Preschool in Sonoma County—72
References
Ballotpedia. (2014). Sonoma County library sales tax increase, Measure M. Retrieved from
http://ballotpedia.org/Sonoma_County_Library_Sales_Tax_Increase,_Measure_M_%28
November_2014%29
Ballotpedia. (2015). Sonoma County general sales tax, Measure A. Retrieved from
http://ballotpedia.org/Sonoma_County_General_Sales_Tax,_Measure_A_%28June_2015
%29
Barnett, W. S. (2008). Preschool education and its lasting effects: Research and policy
implications. Boulder, CO: University of Colorado, School of Education, Education and
the Public Interest Center; Tempe, AZ: Arizona State University, College of Education,
Division of Educational Leadership and Policy Studies, Education Policy Research Unit.
Retrieved from http://nieer.org/resources/research/PreschoolLastingEffects.pdf
Barnett, W. S., Carolan, M. E., Squires, J. H., Clarke Brown, K., & Horowitz, M. (2015). District
of Colombia: The state of preschool 2014: State preschool yearbook. New Brunswick,
NJ: Rutgers University, National Institute for Early Education Research. Retrieved from
http://nieer.org/sites/nieer/files/DC_2014_0.pdf
Baugh, J., & Cesar, M. L. (2012, November 7). Local voters decide to put their money on Pre-K
4 SA. San Antonio Express News. Retrieved from
http://www.mysanantonio.com/elections/article/Voters-approve-Castro-s-Pre-K-plan-
4014635.php
Beekman, D. (2014, November 5). Seattle voters OK preschool measure. Seattle Times.
Retrieved from http://www.seattletimes.com/seattle-news/seattle-voters-ok-preschool-
measure/
Blue Sky Consulting Group. (2014). Strategies to reduce poverty in Sonoma County: An analysis
of the impact of a living wage and other poverty reduction strategies on Sonoma County.
Sacramento, CA: Author. Retrieved from http://sonoma-
county.granicus.com/MetaViewer.php?view_id=2&clip_id=505&meta_id=162878
Boston Public Schools. (n.d.). Department of Early Childhood. Retrieved from
http://bpsearlychildhood.weebly.com
Boston Public Schools. (2015). Boston K1DS: High quality pre-K in community-based early
education programs. Retrieved from http://bpsearlychildhood.weebly.com/boston-
k1ds.html
Burd-Sharps, S., & Lewis, K. (2014). A portrait of Sonoma County. Brooklyn, NY: Measure of
America: A Project of the Social Science Research Council. Retrieved from http://ssrc-
static.s3.amazonaws.com/wp-
content/uploads/2015/08/05141006/English_Complete_POSC.pdf

American Institutes for Research Analysis of Options for Funding Universal Preschool in Sonoma County—73
City of San Antonio. (2015). Pre-K San Antonio: About. Retrieved from
http://www.sanantonio.gov/Pre-K4SanAntonio/about.aspx
City of San Francisco. (2010). Article 4 of the San Francisco Planning Code: Development
impact fees and project requirements that authorize the payment of in-lieu fees: Sec. 414,
Child-care requirements for office and hotel development projects. Retrieved from
http://www.amlegal.com/nxt/gateway.dll/California/planning/article4developmentimpact
feesandprojectr?f=templates$fn=default.htm$3.0$vid=amlegal:sanfrancisco_ca$anc=JD_
414
City of Seattle. (2015a). Department of Education and Early Learning: About the families and
education levy. Retrieved from http://www.seattle.gov/education/about-us/about-the-levy
City of Seattle. (2015b). Seattle City Council: Seattle preschool program. Retrieved from
http://www.seattle.gov/council/issues/PreschoolforAll/default.html
City of Seattle. (2015c). The Seattle Preschool Program plan: Demonstration phase 2015–2018.
Retrieved from
http://www.seattle.gov/Documents/Departments/OFE/AboutTheLevy/EarlyLearning/SPP
_ProgramPlan2015-16_Final.pdf
City of West Sacramento Engineering Department. (2015). General notes & requirements,
permit information, fee schedules. Retrieved from
https://www.cityofwestsacramento.org/civica/filebank/blobdload.asp?BlobID=11479
City of West Sacramento. (n.d.a). History and information. Retrieved from
http://www.cityofwestsacramento.org/city/depts/cmo/up4ws/facts.asp
City of West Sacramento. (n.d.b). Quality preschool and childcare criteria. Retrieved from
http://www.cityofwestsacramento.org/city/depts/cmo/up4ws/quality.asp
City of West Sacramento. (2006). Measure K report. Retrieved from
https://www.cityofwestsacramento.org/civica/filebank/blobdload.asp?BlobID=2228
Cohen, R. (2014, October 17). Does “Pay for Success” actually pay off? The ROI of social
impact bonds. Nonprofit Quarterly. Retrieved from
http://nonprofitquarterly.org/2014/10/17/does-pay-for-success-actually-pay-off-the-roi-
of-social-impact-bonds/
Collier, M. (2015, June 10). Adjoining counties devise different strategies to expand preschool.
EdSource. Retrieved from http://edsource.org/2015/adjoining-counties-devise-different-
strategies-to-expand-preschool/81223
Connors, K. (2014). Chicago to expand pre-K program with hefty social-impact bond. Education
Week, 34(10), 7.

American Institutes for Research Analysis of Options for Funding Universal Preschool in Sonoma County—74
County of Sonoma. (2015, May 15). Sonoma County Board of Supervisors and First 5 Sonoma
Fund Preschool Facilities Grant Program [Press Release]. Retrieved from
http://sonomacounty.ca.gov/Board-of-Supervisors/Press-Releases/2015/BOS-and-First-5-
Sonoma-Fund-Preschool-Facilities-Grant-Program/
Dardick, H., & Perez, J. (2014, October 7). Emanuel to issue bond money to expand pre-K.
Chicago Tribune. Retrieved from http://www.chicagotribune.com/news/local/politics/ct-
emanuel-pre-k-bonds-1008-2-20141008-story.html
Denver Preschool Program. (n.d.). About DPP: FAQs. Retrieved from http://dpp.org/about-
us/faqs
Duncan Associates. (n.d.). Impact fees—general FAQ. Retrieved from
http://www.impactfees.com/faq/general.php
Educare. (n.d.). What is Educare? Retrieved from
http://www.educareschools.org/about/pdfs/What-is-Educare.pdf
Elk Grove Unified School District. (2015). Preschool programs. Retrieved from
http://www.egusd.net/students_parents/faqs/14-15/Preschool.pdf
Fields, R., Rodak, S., Roney, K., & Tawoda, T. (2012, April 2). 100 great places to work in
healthcare. Becker’s Hospital Review. Retrieved from
http://www.beckershospitalreview.com/lists/100-great-places-to-work-in-healthcare.html
First 5 San Francisco. (n.d.). First 5 San Francisco. Retrieved from http://www.first5sf.org/
Galt, J. (2013, July 24). Childcare for hospital employees: A “must have” that creates an
effective workplace. Global Healthcare. Retrieved from
http://www.healthcareglobal.com/hospitals/603/that-Creates-an-Effective-Workplace
Golden, M., & Nagendra, B. (2015). Pay for Success in the U.S.: Summaries of financed
projects. Greenville, SC: Institute for Child Success. Retrieved from
http://www.instituteforchildsuccess.org/pfs.php
Goldsmith, S. (2008, February 25). Management insights: Denver’s John Hickenlooper.
Governing Magazine. Retrieved from http://www.governing.com/columns/mgmt-
insights/Denvers-John-Hickenlooper.html
Gormley, W. T., & Phillips, D. (2005). The effects of universal Pre-K in Oklahoma: Research
highlights and policy implications. Policy Studies Journal, 33(1), 65–82.
Government of the United Kingdom. (2013). Knowledge box. London, UK: Cabinet Office,
Centre for Social Impact Bonds. Retrieved from
http://data.gov.uk/sib_knowledge_box/knowledge-box

American Institutes for Research Analysis of Options for Funding Universal Preschool in Sonoma County—75
Gullixson, P. (2015, May 17). The five biggest myths about Measure A. The Press Democrat.
Retrieved from http://www.pressdemocrat.com/opinion/paulgullixson/3942151-
181/gullixson-the-five-biggest-myths
Hansen, J. (2015, May 26). Roseland Head Start closure leaves hole in community. The Press
Democrat. Retrieved from http://www.pressdemocrat.com/news/3983816-181/roseland-
head-start-closure-leaves
Harris, R. (2012). Child-parent centers make a comeback. Retrieved from http://catalyst-
chicago.org/2012/11/child-parent-centers-make-comeback/
Hart, A. (2015, May 9). Sonoma County road tax proposal Measure A in hands of voters. The
Press Democrat. Retrieved from http://www.pressdemocrat.com/news/3878329-
181/sonoma-county-road-tax-proposal
Haskins, K. (2014, July 15). Building on what’s working in early education in Boston [Web log
post]. Retrieved from https://www.barrfoundation.org/blog/building-on-whats-working-
in-early-education-in-boston
Heckman, J. J., Moon, S. H., Pinto, R., Savelyev, P. A., & Yavetz, A. (2009). The rate of return
to the High/Scope Perry Preschool Program (NBER Working Paper 15471). Cambridge,
MA: National Bureau of Economic Research. Retrieved from
http://www.nber.org/papers/w15471.pdf
Hoback, J. (2015). Private money, public impact. State Legislators, 41(5), 26–29.
Hudson, M., Phillips, J., Ray, K., Vegeris, S., & Davidson, R. (2010). The influence of outcome-
based contracting on provider-led pathways to work (Research Report No. 638).
Norwich, UK: Department for Work and Pensions. Retrieved from
http://www.psi.org.uk/pdf/2010/rrep638.pdf
Human Capital Research Collaborative. (2011). Investing in Innovation “i3” grant will expand
Child-Parent Centers in the Midwest. Minneapolis, MN: University of Minnesota.
Human Capital Research Collaborative. (2014a). Midwestern Child Parent Center expansion
2014–2015 program guidelines. Retrieved from
https://humancapitalrc.org/~/media/files/midwestcpc/pdfs/programguidelines92914rev.pd
f?la=en
Human Capital Research Collaborative. (2014b). Chicago’s social impact bond for Child-Parent
Centers expands a proven school reform model. Minneapolis, MN: University of
Minnesota.
Institute for Local Government. (2008). Understanding the basics of county and city revenues.
Retrieved from http://www.counties.org/sites/main/files/file-
attachments/understanding_the_basics_of_county_and_city_revenues_ilg.pdf

American Institutes for Research Analysis of Options for Funding Universal Preschool in Sonoma County—76
Karoly, L. A., & Bigelow, J. H. (2005). The economics of investing in universal preschool
education in California. Santa Monica, CA: RAND Corp. Retrieved from
http://www.rand.org/content/dam/rand/pubs/monographs/2005/RAND_MG349.pdf
Karoly, L. A., Ghosh-Dastidar, B., Zellman, G. L., Perlman, M., & Fernyhough, L. (2008).
Prepared to learn: The nature and quality of early care and education for preschool-age
children in California. Santa Monica, CA: RAND Corporation. Retrieved from
http://www.rand.org/pubs/technical_reports/TR539
Karoly, L. A., Reardon, E., & Cho, M. (2007). Early care and education in the Golden State:
Publicly funded programs serving California’s preschool-age children. Santa Monica,
CA: RAND Corp. Retrieved from
http://www.rand.org/content/dam/rand/pubs/technical_reports/2007/RAND_TR538.pdf
Kennedy, R. (2015, May 25). Two views on Measure A: No. The Press Democrat. Retrieved
from http://www.pressdemocrat.com/opinion/3971418-181/two-views-on-measure-a
Lam, I., & Muenchow, S. (2009). Financing a full-day, full-year preschool program in
California: Strategies and recommendations. San Mateo, CA: American Institutes for
Research. Retrieved from http://www.earlylearningsystems.org/files/upload/Full-
Day_Preschool052009.doc
Legislative Analyst’s Office. (1996). Understanding Proposition 218. Retrieved from
http://www.lao.ca.gov/1996/120196_prop_218/understanding_prop218_1296.html
Los Angeles Universal Preschool. (2014a). 10 years, 10 reasons to celebrate: 2014 annual
report. Retrieved from
http://laup.net/documents/who_we_are/laup_annual_report_2014.pdf
Los Angeles Universal Preschool. (2014b). Operating guidelines. Retrieved from
http://laup.net/documents/for_providers/operating_guidelines/laup_operating_guidelines_
fy_2014_2015.pdf
Lu, A. (2014). Results-based financing for preschool catching on. Pew Charitable Trusts:
Stateline. Retrieved from http://www.pewtrusts.org/en/research-and-
analysis/blogs/stateline/2014/03/21/resultsbased-financing-for-preschool-catching-on
Maryland Department of Legislative Services. (2013). Evaluating social impact bonds as a new
reentry financing mechanism: A case study on reentry programming in Maryland.
Annapolis, MD: Maryland Department of Legislative Services, Office of Policy Analysis.
Retrieved from http://mgaleg.maryland.gov/Pubs/BudgetFiscal/2013-Evaluating-Social-
Impact-Bonds.pdf
Mason, C. (2008, January 17). Graton tribe’s plan described as both dream, nightmare. The Press
Democrat. Retrieved from
http://www.pressdemocrat.com/csp/mediapool/sites/PressDemocrat/News/story.csp?cid=
2170832&sid=555&fid=181

American Institutes for Research Analysis of Options for Funding Universal Preschool in Sonoma County—77
McHugh, N., Sinclair, S., Roy, M., Huckfield, L., & Donaldson, C. (2013). Social impact bonds:
A wolf in sheep’s clothing? Journal of Poverty & Social Justice, 21(3), 247–257.
Meehan, S. (2013, August 16). Pre-K program attracts investors out for returns. Education Week.
Retrieved from http://www.edweek.org/ew/articles/2013/08/07/37preschool_ep.h32.html
Murray, J. (2014, August 11). Denver City Council signs off on ballot measure to hike preschool
tax. Denver Post. Retrieved from http://www.denverpost.com/news/ci_26317331/denver-
city-council-vote-preschool-tax-increase-ballot
New York City Office of the Mayor. (2014). Ready to launch: New York City’s implementation
plan for free, high-quality, full-day universal pre-kindergarten. Retrieved from
http://www1.nyc.gov/assets/home/downloads/pdf/reports/2014/Ready-to-Launch-NYCs-
Implementation-Plan-for-Free-High-Quality-Full-Day-Universal-Pre-Kindergarten.pdf
Nilsson Consulting. (2014). Sonoma County Child Care Planning Needs Assessment Update
2014. Santa Rosa, CA: Child Care Planning Council of Sonoma County. Retrieved from
https://www.scoe.org/files/needs-assessment-update-2014.pdf
Nonprofit Finance Fund. (2013). Pay for Success learning hub. Retrieved from
http://payforsuccess.org/
Nurse-Family Partnership. (2011). Communities: A community healthcare program that delivers
positive change. Denver, CO: Author. Retrieved from
http://www.nursefamilypartnership.org/communities
Nyhan, P. (2013, December 9). i3 grant tests the potential & reach of one of the country’s oldest
PreK-3rd programs. EdCentral. Retrieved from http://www.edcentral.org/i3-grant-tests-
potential-reach-one-countrys-oldest-prek-3rd-programs/
Office of the State Superintendent of Education. (n.d.). Early learning. Retrieved from
http://osse.dc.gov/service/early-learning
Permit and Resource Management Department. (2015). Building permit fees. Retrieved from
http://www.sonoma-county.org/prmd/fees/building.htm
Pianta, R. C., Barnett, W. S., Burchinal, M., & Thornburg, K. R. (2009). The effects of preschool
education: What we know, how public policy is or is not aligned with the evidence base,
and what we need to know. Psychological Science in the Public Interest, 10(2), 49–88.
Reynolds, A. J., & Ou, S. (2011). Paths of effects from preschool to adult well-being: A
confirmatory analysis of the Child-Parent Center Program. Child Development, 82(2),
555–582.
Reynolds, A. J., Temple, J. A., & Ou, S. (2007). Impacts and implications of the Child-Parent
Center preschool program. Paper presented at the National Invitational Conference of the
Early Childhood Research Collaborative on Critical Issues in Cost-Effectiveness in
Children’s First Decade, Minneapolis, MN.

American Institutes for Research Analysis of Options for Funding Universal Preschool in Sonoma County—78
Reynolds, A. J., Temple, J. A., White, B. A., Ou, S. R., & Robertson, D. L. (2011). Age-26 cost-
benefit analysis of the Child-Parent Center early education program. Child Development,
82(1), 379–404. Retrieved from http://onlinelibrary.wiley.com/doi/10.1111/j.1467-
8624.2010.01563.x/pdf
Roberts, D. (2015). Bill raising sales tax cap passes CA Assembly. Retrieved from
http://calwatchdog.com/2015/05/29/bill-raising-sales-tax-cap-passes-ca-assembly/
Robles, Y. (2014, November 5). Preschool program will continue to fund tuition for Denver 4-
year-old children. The Denver Post. Retrieved from
http://www.denverpost.com/news/ci_26871578/preschool-program-will-continue-to-
fund-tuition-for-denver-4yearolds
Salary.com. (2015). Teacher, elementary school, Santa Rosa, CA. Retrieved from
http://swz.salary.com/SalaryWizard/Teacher-Elementary-School-Hourly-Salary-Details-
Santa%20Rosa-CA.aspx
Samuels, C. A., & Ash, K. (2014, April 7). N.Y.C. hustles to make use of pre-K windfall.
Education Week. Retrieved from
http://www.edweek.org/ew/articles/2014/04/07/28newyork.h33.html
San Francisco Public Schools. (2015). Public Education Enrichment Fund (PEEF). Retrieved
from http://www.sfusd.edu/en/about-sfusd/voter-initiatives/public-education-enrichment-
fund.html
Sanchez, M. (2014). For the record: Paying for preschool with social impact bonds. Chicago,
IL: Catalyst Chicago. Retrieved from http://catalyst-chicago.org/2014/11/record-paying-
preschool-social-impact-bonds/
Schechter, C., & Bye, B. (2007). Preliminary evidence for the impact of mixed-income
preschools on low-income children’s language growth. Early Childhood Research
Quarterly, 22(1), 137–146.
Schweinhart, L. J., Montie, J., Xiang, Z., Barnett, W. S., Belfield, C. R., & Nores, M. (2005).
Lifetime effects: The High/Scope Perry Preschool study through age 40 (Monographs of
the High/Scope Educational Research Foundation, 14). Ypsilanti, MI: High/Scope Press.
Seattle Department of Education and Early Learning. (2015). Seattle preschool program.
Retrieved from http://www.seattle.gov/education/child-care-and-preschool/seattle-
preschool-program
SPUR. (2004, March 1). Proposition H—public education fund. Retrieved from
http://www.spur.org/publications/voter-guide/2004-03-01/proposition-h-public-
education-fund
SPUR. (2008). Setting aside differences: Should the city budget be decided at the polls?
Retrieved from http://www.spur.org/publications/spur-report/2008-01-16/setting-aside-
differences

American Institutes for Research Analysis of Options for Funding Universal Preschool in Sonoma County—79
SPUR. (2014). San Francisco Voter Guide, November 2014. Retrieved from
http://www.spur.org/sites/default/files/publications_pdfs/SPUR_Voter_Guide_November
_2014_print.pdf#page=7
State of California Employment Development Department. (2015). Occupation profile:
childcare workers. Sacramento, CA: Author. Retrieved from
http://www.labormarketinfo.edd.ca.gov/cgi/databrowsing/occExplorerQSDetails.asp?sear
chCriteria=child+care&careerID=&menuChoice=&geogArea=0604000097&soccode=39
9011&search=Explore+Occupation
Stewart, K. (2013, June 15). Utah public preschool push gets $7 million from private investors.
Salt Lake Tribune. Retrieved from http://www.sltrib.com/strib/news/56457077-
78/preschool-education-program-united.html.csp
Strow, D. (2000, April 27). Venetian, Station Casinos tout employee child-care centers. Las
Vegas Sun. Retrieved from http://lasvegassun.com/news/2000/apr/27/venetian-station-
casinos-tout-employee-child-care-/
Timmons, A. (2013, May 5). In Massachusetts, casinos provide jobs, taxes, child care and
skating rinks. Concord Monitor. Retrieved from
http://www.concordmonitor.com/news/localstate/6016287-95/in-massachusetts-casinos-
provide-jobs-taxes-child-care-and-skating-rinks
United Way of Salt Lake. (2014). Pay for Success. Retrieved from http://www.uw.org/our-
work/cradle-to-kindergarten/pay-for-success.html
University of Minnesota. (2015). Chicago longitudinal study. Minneapolis, MN: University of
Minnesota, Institute of Child Development. Retrieved from
http://www.cehd.umn.edu/icd/research/cls/default.html
U.S. Census Bureau. (2014). State median income. Washington, DC: Author. Retrieved from
http://www.census.gov/hhes/www/income/data/statemedian/index.html
U.S. Conference of Mayors. (2014a). Denver Preschool Program. Retrieved from
http://usmayors.org/educationalexcellence/userfiles/Denver,%20CO%201.pdf
U.S. Conference of Mayors. (2014b). Universal preschool for West Sacramento (UP4WS).
Retrieved from
http://usmayors.org/educationalexcellence/userfiles/west%20sacramento,%20ca.pdf
U.S. Department of Education. (2014). Improving basic programs operated by local educational
agencies (Title I, Part A). Washington, DC: Author. Retrieved from
http://www2.ed.gov/programs/titleiparta/index.html
U.S. Department of Housing and Urban Development. (n.d.). Community Development Block
Grant Program—CDBG. Retrieved from
http://portal.hud.gov/hudportal/HUD?src=/program_offices/comm_planning/communityd
evelopment/programs

American Institutes for Research Analysis of Options for Funding Universal Preschool in Sonoma County—80
Utah State Legislature. (2014). Utah School Readiness initiative (H.B. 96). Retrieved from
http://le.utah.gov/~2014/bills/static/HB0096.html
Voices for Utah Children. (2011). A sustainable financing model: High quality preschool for at-
risk children. Retrieved from http://www.uw.org/site-migration-archive/our-
work/research-reports/a-sustainable-financing-model-for-high-quality-preschool-
evidence-from-the-granite-school-district-in-utah-updated-10-26-11.pdf
Watson, B. H. (2010). A case study of the pre-K for all campaign: How pre-K for all became the
law of the land in Washington, DC. New York, NY: Foundation for Child Development.
Retrieved from http://fcd-us.org/sites/default/files/Pre-
K%20for%20All%20DC%20Case%20Study.pdf
Yolo Elections Office. (n.d.a). West Sacramento 1/2c sales tax. Retrieved from
http://www.yoloelections.org/election-returns/archives/20021105/wsac_k
Yolo Elections Office. (n.d.b). West Sacramento Advisory Measure J, fund streets, parks repair.
Retrieved from http://www.yoloelections.org/election-returns/archives/20021105/wsac_j
Yoshikawa, H., Weiland, C., Brooks-Gunn, J., Burchinal, M., Espinosa, L., Gormley, W.,
Zaslow, M. (2013). Investing in our future: The evidence base on preschool education.
New York, NY: Foundation for Child Development and Ann Arbor, MI: Society for
Research in Child Development.
American Institutes for Research Analysis of Options for Funding Universal Preschool in Sonoma County—A-–1
Appendix A. Methodology
Our methodology included four main activities:
An examination of 12 preschool initiatives being implemented across the United States
Interviews with Sonoma County stakeholders
Interviews and a literature review related to facilities and funding mechanisms
The development of cost estimates and phase-in plans
The 12 preschool initiatives examined are in Denver, Colorado; San Antonio, Texas; Seattle,
Washington; Elk Grove, California; West Sacramento, California; Salt Lake County, Utah; San
Francisco, California; Washington, D.C.; Boston, Massachusetts; Los Angeles, California; New
York City, New York; and Chicago, Illinois. Our examination of these initiatives included a
thorough review of the initiative websites and documentation provided on these websites, such as
provider applications, evaluation reports, white papers, fact sheets, and other programmatic
documentation. In addition, we conducted at least one in-depth interview with key informants for
the following initiatives: Denver, San Antonio, Seattle, Elk Grove, West Sacramento, Salt Lake
County, and San Francisco. We conducted brief telephone conversations as well as e-mail
correspondence to confirm information included in this report for Boston, New York City, and
the District of Columbia. We were able to confirm information by means of e-mail alone for Los
Angeles. The information included in this report for Chicago is based solely on our review of the
CPC website and accompanying documentation. In addition, for the Educare model, we
reviewed the Educare website and accompanying documentation and conducted interviews with
two representatives from areas implementing the Educare model: Jolene Smith, chief executive
officer of First 5 Santa Clara, and Jermaine Smith, the development director for Educare New
Orleans.
We conducted interviews with a few Sonoma County stakeholders to help provide context and
budget information for the development of our cost estimates and phase-in plans as well as
information on the local context for making our recommendations on the funding options. We
conducted interviews with the following Sonoma County stakeholders: Melanie Dodson and Jim
Walters from the Community Child Care Council of Sonoma County; Lisa Grocott, the director
Head Start/Early Head Start for the Sonoma County Community Action Partnership; Susan
Gilmore, the founder and executive director of the North Bay Children’s Center; and Kelly Bass
Seibel, the vice president of public policy for the Santa Rosa Chamber of Commerce.
To provide detailed information on potential sources of funding for universal preschool,
including facilities, we reviewed documents and websites related to funding mechanisms being
used by the 12 preschool initiatives as well as the Educare centers in Santa Clara and New
Orleans. In addition, we interviewed Mary Garvey and Megan Golden from the Institute for
Child Success about their work related to Pay for Success bonds. We interviewed Candace
Wong, the director of California Child Development Programs for the San Francisco office of
the Low Income Investment Fund, about the fund’s work related to improving and building child
care facilities. We also interviewed Jolene Smith about the funding mechanism for the Santa

American Institutes for Research Analysis of Options for Funding Universal Preschool in Sonoma County—A-–2
Clara Educare facilities as well as the funding mechanisms for the Educare model program in
Santa Clara.
We developed two cost estimates for the purpose of this report. One cost estimate assumes
current salaries, and the other increases salaries to a living wage. For both cost estimates, we
collected budget information from three different programs that included Head Start, Title 5
State Preschool, and one private community-based provider.
We developed eight scenarios for meeting the unmet need for preschool in Sonoma County.
These scenarios include the cost to serve different segments of the three- and four-year-old
population (e.g., all children in high-priority areas) at both current salaries and living wages. To
develop these scenarios, we used two tools that our team had already developed for this type of
work: (1) the Early Learning Needs Assessment Tool, which brings together data from multiple
sources to identify the areas of highest need in the county, and (2) the Cost Estimator Tool, a
user-friendly tool to assess the cost of phasing in access to preschool. We supplemented the
information in these tools with American Community Survey data at the ZIP code level for
population estimates where necessary. We also used information from the Sonoma County Child
Care Planning Council’s supplement to the 2014 Child Care Needs Assessment to estimate the
number of preschool slots needed in high-priority census tracts.

American Institutes for Research Analysis of Options for Funding Universal Preschool in Sonoma County—B-–1
Appendix B. Interviews Conducted
The interviewees are listed alphabetically by last name.
Ailish Brady, senior advisor in the Division of Early Childhood Education at the New
York City Department of Education
Margaret Brodkin, chief executive officer of Margaret Brodkin and Associates and
founder of Funding the Next Generation
Kathy Bruck, chief executive officer for Pre-K 4 SA
Claudia Charter, program specialist for the Elk Grove Unified School District
Melanie Dodson, executive director for the Community Child Care Council of Sonoma
County
Chris Ellis, partnership director for Early Learning Outcomes at the United Way of Salt
Lake
Mary C. Garvey, associate director of Pay for Success financing at the Institute for
Child Success
Susan Gilmore, founder and executive director of the North Bay Children’s Center
Megan Golden, senior fellow at the Institute for Child Success
Lisa Grocott, director of Head Start for the Sonoma County Community Action
Partnership
Elizabeth Groginsky, assistant superintendent of early learning for the Office of the
State Superintendent of Education in the District of Columbia
Nancy Herota, director of the School Readiness Department in the Sacramento County
Office of Education (previously with the Elk Grove Unified School District)
Justine Jimenez, early learning program director for the City of West Sacramento
Erica Johnson, project manager of the Seattle Preschool Program
Laurel Kloomok, executive director of First 5 San Francisco
Jennifer Landrum, president and chief executive officer of DPP
Freddy Martinez, fiscal administrator for Pre-K 4 SA
Lauren Meyer, director of program assessment in the Division of Early Childhood
Education at the New York City Department of Education
Holly Miller, director of the Department of Education and Early Learning of the City of
Seattle
Sophia Pappas, chief executive officer in the Division of Early Childhood Education at
the New York City Department of Education
Carol Richardson, assistant city manager for the City of West Sacramento

American Institutes for Research Analysis of Options for Funding Universal Preschool in Sonoma County—B-–2
Jason Sachs, director of early childhood for BPS
Kelly Bass Seibel, vice president of public policy for the Santa Rosa Chamber of
Commerce
Jolene Smith, chief executive officer of First 5 Santa Clara
Jermaine Smith, development director for Educare New Orleans
Brenda Van Gorder, director of preschool services for Granite School District in Salt
Lake City
Jim Walters, facilities director for the Community Child Care Council of Sonoma
County
Candace Wong, director of California Child Development Programs for the Low Income
Investment Fund Child Care Facilities Fund

American Institutes for Research Analysis of Options for Funding Universal Preschool in Sonoma County—C-–1
Appendix C. Detailed Budgets for Preschool per Child Cost
Estimates
Table C1. Detailed Budget for Estimating Per-Child Cost of Preschool at Current Wages
Number of three- and four-year-olds served: 40
Number of classrooms: 2
Number of sessions per day: 1 Full day/full year
Class size: 20
Personnel FTEs or % Salary Total Source
Site Supervisor (also a Master Teacher)
1 $42,057.00 $42,057.00 Community Child Care Council of Sonoma County
Teacher 1 $34,028.00 $34,028.00
Associate Teacher 2 $29,910.00 $59,820.00
Assistants 1.8 $26,906.00 $48,430.80 Community Child Care Council of Sonoma County +5% (staff have received only one 2% COLA increase since 2009)
Cook 0.55 $28,959.00 $15,927.45
Case Manager (three sites) 0.33 $37,512.72 $12,379.20
Program Director (12 sites) 0.08 $67,594.80 $5,632.90
Facilities Director (12 sites) 0.08 $52,830.96 $4,226.48
Preschool Resource Specialist (12 sites)
0.08 $42,325.92 $3,386.07
Case Manager/Fiscal Supervisor (1.25 FTE for 12 sites)
0.10 $59,841.60 $6,233.50
Fiscal Specialist (12 sites) 0.08 $37,128.00 $2,970.24
Facilities/Maintenance Specialist (12 sites)
0.08 $40,906.32 $3,272.51
Substitutes $17,500.00 Community Child Care Council of Sonoma County
Subtotal—Salaries 7.1875 $255,864.14
Benefits
Payroll Taxes and Worker Compensation
16.50% $42,217.58
Medical Insurance 15.75% $40,298.60 Community Child Care Council of Sonoma County—Average %
Subtotal Benefits $82,516.19
Subtotal Personnel $338,380.33

American Institutes for Research Analysis of Options for Funding Universal Preschool in Sonoma County—C-–2
Personnel FTEs or % Salary Total Source
Nonpersonnel Costs 37% $125,200.72 We have assumed 37% here to make up for recent cuts and to cover additional staff training costs to assist programs in making quality improvements.
Total Cost $463,581.05
Total Cost per Child $11,589.53
Note. FTE = full-time employee.
Table C2. Detailed Budget for Estimating per Child Cost of Preschool at Living Wage
Number of three- and four-year-olds served: 40
Number of classrooms: 2
Number of sessions per day: 1 Full day/full year
Class size: 20
Staff FTEs or % Salary Total Living Wage
Increases Source
Site Supervisor (also a Master Teacher)
1 $42,057.00 $42,057.00 $48,676.77 Community Child Care Council of Sonoma County +15.74%
Teacher 1 $34,028.00 $34,028.00 $39,384.01
Associate Teacher 2 $29,910.00 $59,820.00 $69,235.67
Assistants 1.8 $26,906.00 $48,430.80 $56,053.81
Cook 0.55 $28,959.00 $15,927.45 $18,434.43
Case Manager (three sites)
0.33 $37,512.72 $12,379.20 $12,998.16 Community Child Care Council of Sonoma County +5% (staff have only gotten one 2% COLA increase since 2009) + 5% raise
Program Director (12 sites)
0.08 $67,594.80 $5,632.90 $5,914.55
Facilities Director (12 sites)
0.08 $52,830.96
$4,226.48 $4,437.80
Preschool Resource Specialist (12 sites)
0.08 $42,325.92
$3,386.07 $3,555.38
Case Manager/Fiscal Supervisor (1.25 FTE for 12 sites)
0.10 $59,841.60
$6,233.50 $6,545.18
Fiscal Specialist (12 sites) 0.08 37,128.00 $2,970.24 $3,118.75
Facilities/Maintenance Specialist (12 sites)
0.08 40,906.32 $3,272.51 $3,436.13

American Institutes for Research Analysis of Options for Funding Universal Preschool in Sonoma County—C-–3
Staff FTEs or % Salary Total Living Wage
Increases Source
Substitutes $17,500.00 $18,375.00
Subtotal—Salaries 7.1875 $255,864.14 $290,165.62
Benefits
Payroll Taxes and Worker Compensation
16.50% $42,217.58 $47,877.33
Medical Insurance 15.75% $40,298.60 $45,701.09 Community Child Care Council of Sonoma County average %
Subtotal Benefits $82,516.19 $93,578.41
Subtotal Personnel 338,380.33 $383,744.04
Nonpersonnel Costs 37% 125,200.72 $141,985.29
We have assumed 37% here to make up for recent cuts and to cover additional staff training costs to assist programs in making quality improvements.
Total Cost 463,581.05 $525,729.33
Total Cost per Child $11,589.53 $13,143.23
Note. FTE = full-time employee. To calculate living wage, we began with the lowest paid staff, teacher assistants, who earn $12.94 per hour in the current budget. To get to $15 per hour, the assumed minimum living wage, these staff would require a 15.74 percent increase. Staff already paid at professional levels were given a 5 percent increase.

American Institutes for Research Analysis of Options for Funding Universal Preschool in Sonoma County—D-–1
Appendix D. Highest Priority Schools and Associated ZIP
Codes and High-Risk Priority Areas per A Portrait of
Sonoma County and Associated Census Tracts
Table D1. First 5 Identified Highest Priority Schools and Associated ZIP Codes
Highest Priority Schools ZIP Codes
1 Abraham Lincoln Elementary 95401
2 James Monroe Elementary 95403
3 Luther Burbank Elementary 95401
4 McDowell Elementary 94954
5 Steele Lane Elementary 95403
6 Sheppard Elementary 95407
7 Roseland Elementary 95407
8 Kawana Elementary 95404
9 Helen M. Lehman Elementary 95401
10 Taylor Mountain Elementary 95407
11 Bellevue Elementary 95407
12 Meadow View Elementary 95407
13 Roseland Creek Elementary 95407
14 Brook Hill Elementary 95404
15 John Reed Primary 94928
16 Kid Street Learning Center Charter 95401
17 Robert L. Stevens Elementary 95407
18 Healdsburg Elementary 95448
19 Horicon Elementary 95412
20 El Verano Elementary 95433
21 Albert F. Biella Elementary 95401
22 Sassarini Elementary 95476
23 Cesar Chavez Language Academy 95403
24 Cinnabar Charter 94952
25 Wright Charter 95407
26 Miwok Valley Language Academy Charter 94954
27 Geyserville Elementary 95441
28 Dunbar Elementary 95442
29 Thomas Page Academy 94931
30 Monte Rio Elementary 95462
31 J.X. Wilson Elementary 95401
32 Jefferson Elementary 95425
33 Flowery Elementary 95476
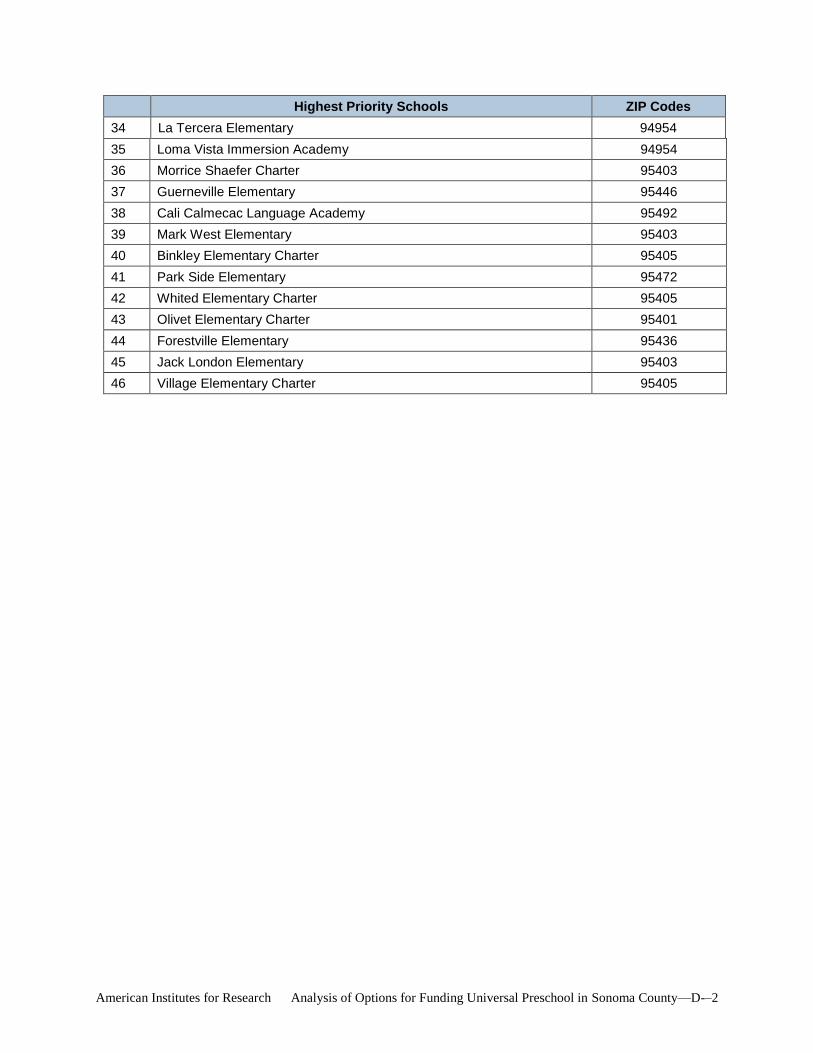
American Institutes for Research Analysis of Options for Funding Universal Preschool in Sonoma County—D-–2
Highest Priority Schools ZIP Codes
34 La Tercera Elementary 94954
35 Loma Vista Immersion Academy 94954
36 Morrice Shaefer Charter 95403
37 Guerneville Elementary 95446
38 Cali Calmecac Language Academy 95492
39 Mark West Elementary 95403
40 Binkley Elementary Charter 95405
41 Park Side Elementary 95472
42 Whited Elementary Charter 95405
43 Olivet Elementary Charter 95401
44 Forestville Elementary 95436
45 Jack London Elementary 95403
46 Village Elementary Charter 95405

American Institutes for Research Analysis of Options for Funding Universal Preschool in Sonoma County—D-–3
Table D2. High-Risk Priority Areas per A Portrait of Sonoma County and Associated
Census Tracts
Census Tract Area Name ZIP Codes
1 East Cloverdale
Census Tract 1542.01 East Cloverdale 95425
2 Fetters Springs/Agua Caliente West
Census Tract 1503.05 Fetters Springs/Agua Caliente West 95431, 95433
3 Northwest Santa Rosa
Census Tract 1530.03 Railroad Square 95401, 95403
Census Tract 1530.01 Coddingtown 95401, 95403
Census Tract 1519 Burbank Gardens 95401, 95403
Census Tract 1529.03 Comstock 95401, 95403
Census Tract 1520 Downtown Santa Rosa 95401, 95403
Census Tract 1528.02 Bicentennial Park 95401, 95403
Census Tract 1530.02 West End 95401, 95403
Census Tract 1521 West Junior College 95401, 95403
4 Southwest Santa Rosa
Census Tract 1531.02 Sheppard 95407
Census Tract 1531.04 Roseland 95407
Census Tract 1531.03 Roseland Creek 95407
5 Southeast Santa Rosa
Census Tract 1514.01 Kawana Springs 95404
Census Tract 1514.02 Taylor Mountain 95404

ABOUT AMERICAN INSTITUTES FOR RESEARCH
Established in 1946, with headquarters in Washington, D.C.,
American Institutes for Research (AIR) is an independent,
nonpartisan, not-for-profit organization that conducts behavioral
and social science research and delivers technical assistance
both domestically and internationally. As one of the largest
behavioral and social science research organizations in the world,
AIR is committed to empowering communities and institutions with
innovative solutions to the most critical challenges in education,
health, workforce, and international development.
LOCATIONS
Domestic
Washington, D.C.
Atlanta, GA
Austin, TX
Baltimore, MD
Cayce, SC
Chapel Hill, NC
Chicago, IL
Columbus, OH
Frederick, MD
Honolulu, HI
Indianapolis, IN
Metairie, LA
Naperville, IL
New York, NY
Rockville, MD
Sacramento, CA
San Mateo, CA
Waltham, MA
International
Egypt
Honduras
Ivory Coast
Kyrgyzstan
Liberia
Tajikistan
Zambia

5920_04/16
2800 Campus Drive, Suite 200
San Mateo, CA 94403
650-843-9100
www.air.org


