PNNL-15787 Analysis of Percent On-Cell Reformation of Methane in SOFC Stacks: Thermal, Electrical, and Stress Analysis K. P. Recknagle S. T. Yokuda D. T. Jarboe M. A. Khaleel April 2006 Prepared for the U.S. Department of Energy under Contract DE-AC05-76RL01830
Transcript
PNNL-15787
Analysis of Percent On-Cell Reformation of Methane in SOFC Stacks: Thermal, Electrical, and Stress Analysis K. P. Recknagle S. T. Yokuda D. T. Jarboe M. A. Khaleel April 2006 Prepared for the U.S. Department of Energy under Contract DE-AC05-76RL01830
PNNL-15787
Analysis of Percent On-Cell Reformation of Methane in SOFC Stacks: Thermal, Electrical, and Stress Analysis K. P. Recknagle S. T. Yokuda D. T. Jarboe M. A. Khaleel April 2006
Prepared for the U.S. Department of Energy under Contract DE-AC05-76RL01830
DISCLAIMER
This report was prepared as an account of work sponsored by an agency of the United States Government. Neither the United States Government nor any agency thereof, nor Battelle Memorial Institute, nor any of their employees, makes any warranty, express or implied, or assumes any legal liability or responsibility for the accuracy, completeness, or usefulness of any information, apparatus, product, or process disclosed, or represents that its use would not infringe privately owned rights. Reference herein to any specific commercial product, process, or service by trade name, trademark, manufacturer, or otherwise does not necessarily constitute or imply its endorsement, recommendation, or favoring by the United States Government or any agency thereof, or Battelle Memorial Institute. The views and opinions of authors expressed herein do not necessarily state or reflect those of the United States Government or any agency thereof.
PACIFIC NORTHWEST NATIONAL LABORATORY
operated by
BATTELLE
for the UNITED STATES DEPARTMENT OF ENERGY
under Contract DE-AC05-76RL01830
Printed in the United States of America Available to DOE and DOE contractors from the
Office of Scientific and Technical Information, P.O. Box 62, Oak Ridge, TN 37831-0062;
Analysis of Percent On-Cell Reformation of Methane in SOFC Stacks: Thermal, Electrical, and Mechanical Performance K. P. Recknagle S. T. Yokuda D. T. Jarboe M. A. Khaleel April 2006 Work Performed under SECA Core Technology Program and Contract DE-AC05-76RL01830 Report Submitted to: Don Collins, Lane Wilson, Travis Shultz and Wayne Surdoval National Energy Technology Laboratory, Pittsburgh, PA Pacific Northwest National Laboratory Richland, WA 99352
iii
Executive Summary This report summarizes a parametric analysis performed to determine the effect of varying the percent on-cell reformation (OCR) of methane on the thermal, electrical, and mechanical performance for a generic, planar solid oxide fuel cell (SOFC) stack design. OCR of methane can be beneficial to an SOFC stack because the reaction (steam-methane reformation) is endothermic and can remove excess heat generated by the electrochemical reactions directly from the cell. The heat removed is proportional to the amount of methane reformed on the cell. Rapid reaction kinetics provided by the high-temperature SOFC operation and excess steam over the nickel-based anode catalyst ensure complete methane conversion. Thus, the thermal load varies with methane concentration entering the stack. The endotherm due to the fast reformation reaction can cause a temperature depression on the anode near the fuel inlet, resulting in large thermal stresses. This effect depends on factors that include inflowing methane concentration, local temperature, and stack geometry. The analysis assumed the fuel would be partially to fully pre-reformed in an external reformer such that the desired fuel compositions would be delivered to the stack, where the remaining percentage of the reformation reaction would be completed on-cell. Simulations were performed using an SOFC stack modeling tool developed at PNNL and validated for the prediction of fuel use, on-cell methane reforming, and distribution of temperature. The study was performed using three-dimensional stack model geometries. Cross-flow, co-flow, and counter-flow configuration stacks of 10x10- and 20x20-cm cell sizes were examined. Thermal performance was evaluated based on the predicted maximum temperature difference on the anode. Electrical performance was based on the predicted power output. Mechanical performance was based on the maximum principal stress on the anode. Fuel utilization was established at 75%. The effect of cathode air cooling was included in the study by examination of 30% and 15% air utilizations. The analysis showed for the counter-flow and cross-flow stacks of 10x10-cm size the stress and temperature difference would be minimized when between 40 and 50% of the reformation reaction occurred on the anode. Gross electrical power density was virtually unaffected by %OCR. For all stack configurations and sizes the inflow temperature increased with %OCR as the subsequent heat load decreased. Cooling provided by the cathode airflow associated with 30% air utilization was not substantially improved upon by 15% air use for the smaller (10x10-cm) stack size. The increased airflow associated with 15% air utilization was needed for cooling the larger (20x20-cm) stacks. The co-flow stack exhibited the largest benefit from the additional cathode air cooling and had the lowest anode stresses of the 20x20-cm stacks. For the conditions and particular generic stacks of this study, the results suggest 40 to 50% OCR should be considered for cross-flow and counter-flow stacks, and higher percentages may be desirable in co-flow stacks. Results of this study also suggest that 30% air utilization may be sufficient for 10x10-cm cell stacks, and 15% air utilization should be considered for 20x20-cm cell stacks.
iv
v
Acknowledgments Pacific Northwest National Laboratory is operated by Battelle for the U.S. Department of Energy under Contract DE-AC05-76RL01830. The work summarized in this paper was funded as part of the Solid-State Energy Conversion Alliance (SECA) Core Technology Program by the U.S. Department of Energy’s National Energy Technology Laboratory (NETL). The authors would like to thank Dave King for providing materials testing and methane conversion data and Prabhakar Singh for helpful discussions regarding on-cell reformation.
vi
vii
Contents
Executive Summary ....................................................................................................................... iii
3.1 Model Geometry ..............................................................................................................3.1 3.2 Boundary Conditions .......................................................................................................3.1 3.3 Electrochemical Performance and Material Properties ...................................................3.2
4.0 Results for 10x10-cm Cell Size ..............................................................................................4.1
4.1 Cross Flow 10x10 cm ......................................................................................................4.1 4.2 Co-Flow 10x10 cm ..........................................................................................................4.3 4.3 Counter-Flow 10x10 cm ..................................................................................................4.4 4.4 Temperature Distributions and Stress: 10x10 cm............................................................4.4
5.1 Cross-Flow 20x20 cm......................................................................................................5.1 5.2 Co-Flow 20x20 cm ..........................................................................................................5.2 5.3 Counter-Flow 20x20 cm ..................................................................................................5.3 5.4 Power Density 20x20 cm.................................................................................................5.5 5.5 Cathode Air Utilization....................................................................................................5.5
Appendix - Molar Compositions of Partially Reformed Fuel Mixtures ..........................................1
viii
Figures
3.1 Exploded Assemblies for the Co-Flow, Cross-Flow, and Counter-Flow Configuration for the 10x10 and 20x20 Cases....................................................................3.1
3.2 Temperature Dependent Elastic Modulus (Pascals)............................................................3.1
3.3 Temperature Dependent Coefficient of Thermal Expansion (1/T) .....................................3.1
4.1 Cell Temperature Difference and Inflow Fuel/Air Temperature Versus Percent On-Cell Reforming for 10x10-cm Cross-Flow Cases............................................4.1
4.2 Cell Temperature Difference and Inflow Fuel/Air Temperature Versus Percent On-Cell Reforming for 10x10 cm Co-Flow Cases.................................................4.3
4.3 Cell Temperature Difference and Inflow Fuel/Air Temperature Versus Percent On-Cell Reforming for 10x10-cm Counter-Flow Cases ........................................4.4
4.4 Distributions of Anode Temperature and Maximum Principal Stress within a 10x10-cm Counter-Flow Stack .............................................................................4.4
5.1 Cell Temperature Difference and Inflow Fuel/Air Temperature Versus Percent On-Cell Reforming for 20x20-cm Cross-Flow Cases............................................5.1
5.2 Cell Temperature Difference and Inflow Fuel/Air Temperature Versus Percent On-Cell Reforming for 20x20-cm Co-Flow Cases ................................................5.3
5.3 Cell Temperature Difference and Inflow Fuel/Air Temperature Versus Percent On-Cell Reforming for 20x20-cm Counter-Flow Cases. .......................................5.4
5.4 Distributions of Anode Temperature and Maximum Principal Stress within a 10x10-cm Counter-Flow Stack .............................................................................4.4
Tables
2.1 Mass Compositions of Partially Reformed Fuel Mixtures Supplied from an
External Reformer to the Stack .......................................................................................... 2.2
3.1 Material Properties Used in the Simulations...................................................................... 3.2
4.1 Summary of Thermal Load Results for 10x10-cm Cell Size ............................................. 4.2
4.2 Thermal Stress Results for 10x10-cm Cell Size................................................................. 4.2
5.1 Summary of Thermal Load Results for 20x20-cm Cell Size ............................................. 5.2
5.2 Thermal Stress Results for 20x20-cm Cell Size................................................................. 5.2
1.1
1.0 Introduction The solid oxide fuel cell (SOFC) industry continues to develop larger, more powerful cell stacks for stationary power applications, and thermal management remains a critical issue for the reliable operation of these stacks. On-cell reformation (OCR) of methane is an effective means of removing excess heat generated within an SOFC stack. OCR refers to reforming the fuel directly on the anode. Of the various heat removal methods available for use in SOFC stacks, OCR has the potential to be the most beneficial to the overall system. The reformation reaction is endothermic and, when used on the anode, immediately removes excess heat generated by the electrochemical oxidation reactions. The demand on an external fuel reformer (and associated heat exchanger) decreases as the percentage of the reformation reaction that takes place on-cell increases. Thus, the size of the external reformer and related heat exchanger could be decreased while also decreasing the thermal load experienced by the stack. In the reformation reaction, methane combined with steam is converted at high temperature to hydrogen and carbon monoxide in the presence of a nickel catalyst such as the typical nickel-based (Ni-YSZ) SOFC anode (Eq. 1). The hydrogen and carbon dioxide gas products can be consumed electrochemically in the oxidation reactions (Eq. 2 and 3) and are also subject to the rapid water-gas shift reaction (Eq. 4). COHOHCH +⇒+ 224 3 (1) H2 + 1
2O2 → H2O+ 2e− (2) CO+ 1
2O2 →CO2 + 2e− (3) 222 HCOOHCO +↔+ (4) On-cell reformation is attractive because of the decreased thermal load it can provide as well as the cost benefits of decreased reformer size. However, the kinetics of the reformation reaction on a standard Ni-YSZ anode is rapid, and with increasing %OCR, the resultant endotherm can cause a significant local temperature depression near the fuel inlet on the anode. Cooling near the fuel inlet and subsequently increased heating downstream due to increased hydrogen concentration and electrical current density can set up a large difference between the minimum and maximum temperatures on the cell (ΔT). Along with the cell ΔT there can be and increase in the thermal stresses on the anode1 creating an unreliable condition for cell operation. The objective of this report is to analyze the effect of varying the percentage of the reformation reaction occurring on-cell on the stack performance. In particular, this work addresses the effect that variable %OCR has on the thermal, electrical, and mechanical performance of a generic stack design with co-flow, counter-flow, and cross-flow configurations
1.2
and 10x10- and 20x20-cm active cell sizes. The thermal performance is evaluated based on the predicted cell ΔT with analysis of the heat load and balances. The electrical performance is based on the predicted output power density. The mechanical performance is based on the maximum principal anode stress.
2.1
2.0 Methodology A computational modeling tool for simulating the multi-physics of SOFC operation was used in this study. The PNNL developed SOFC-MP code solves the equations for mass transport, energy, and electrochemistry required to predict the fluid flow, temperature, species, and current density distributions in a three-dimensional SOFC geometry.2,3,4 The electrochemistry model used was described by Chick et al.,5 calibrated6,7 for application to planar stack simulations, and updated to provide an improved anode concentration polarization model.8 The capabilities of these tools have also been expanded to incorporate steam-methane reformation for simulating on-cell reforming9 and have been updated with a rate expression derived experimentally at PNNL:10
0134.0244
)8188.2()//)(( −−=− COCH
RTE
catCH CCeEsgmmolract
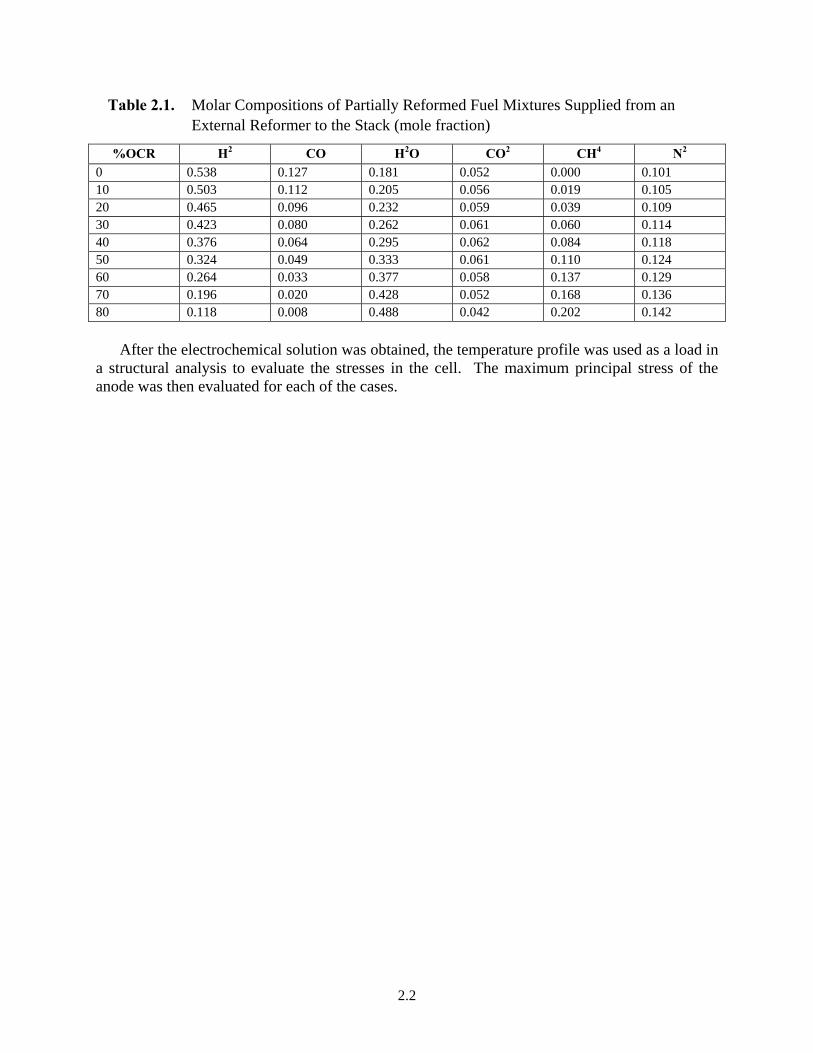
(5) The temperature, T, is in Kelvin, the universal gas constant, R is 8.314 J/mol-K, the activation energy, Eact, is 94,950 J/mol, and the concentrations, Ci, are in units of mol/cc. A steam-to-carbon ratio of at least 1.0 (S:C=1.0) was used in all of King’s tests. While the methane conversion rate showed no dependence on the steam concentration, a slight hindering effect was identified due to the concentration of CO2. This expression (Eq. 5) represents fast kinetics although it does include a self-leveling effect. As the temperature decreases locally due to the endotherm, the reaction slows as a consequence. The rate increases with increased methane concentration. Hence, larger endothermic effects are expected with increased OCR. In the study it was assumed the unreformed fuel mixture containing methane, steam, and nitrogen passed through a fuel stream pre-heater to an external reformer using excess steam (S:C = 2.0) ultimately to prevent coking of the anode. In Eq. (1) through (4), one mole of CH4 is converted to three moles of H2 and one mole of CO. In the shift reaction, one mole of CO (and H2O) is converted to one mole of H2 (and CO2); or the CO can be oxidized directly, as H2 is for generating electrical current. Thus the fuel content of gas mixtures that contain CO and CH4 (on a mol/s basis) is the sum of mol/s H2, mol/s CO and four times the mol/s CH4. This study examined fuels with compositions representing 0 to 80% OCR. Regardless of the fuel feed composition, the fuel content in all cases was 4.15E-06 mol/s/cm2. Table 2.1 sum-marizes the molar compositions of partially reformed fuel mixtures supplied from an external reformer to the stack for the simulations (see the appendix for mass compositions of the fuel mixtures). Methane made up 28% of the total unreformed fuel mixture. When the fuel was 20% pre-reformed (in preparation for 80% OCR) the resulting mixture, as shown in Table 2.1, contained 20.2% methane, 11.8% hydrogen, 48.8% steam, etc. As the OCR decreased to zero, the methane was fully converted and the hydrogen and steam concentrations were 53.8% and 18.1%, respectively.
2.2
Table 2.1. Molar Compositions of Partially Reformed Fuel Mixtures Supplied from an External Reformer to the Stack (mole fraction)
%OCR H2 CO H2O CO2 CH4 N2 0 0.538 0.127 0.181 0.052 0.000 0.101 10 0.503 0.112 0.205 0.056 0.019 0.105 20 0.465 0.096 0.232 0.059 0.039 0.109 30 0.423 0.080 0.262 0.061 0.060 0.114 40 0.376 0.064 0.295 0.062 0.084 0.118 50 0.324 0.049 0.333 0.061 0.110 0.124 60 0.264 0.033 0.377 0.058 0.137 0.129 70 0.196 0.020 0.428 0.052 0.168 0.136 80 0.118 0.008 0.488 0.042 0.202 0.142 After the electrochemical solution was obtained, the temperature profile was used as a load in a structural analysis to evaluate the stresses in the cell. The maximum principal stress of the anode was then evaluated for each of the cases.
3.1
3.0 Modeling Approach
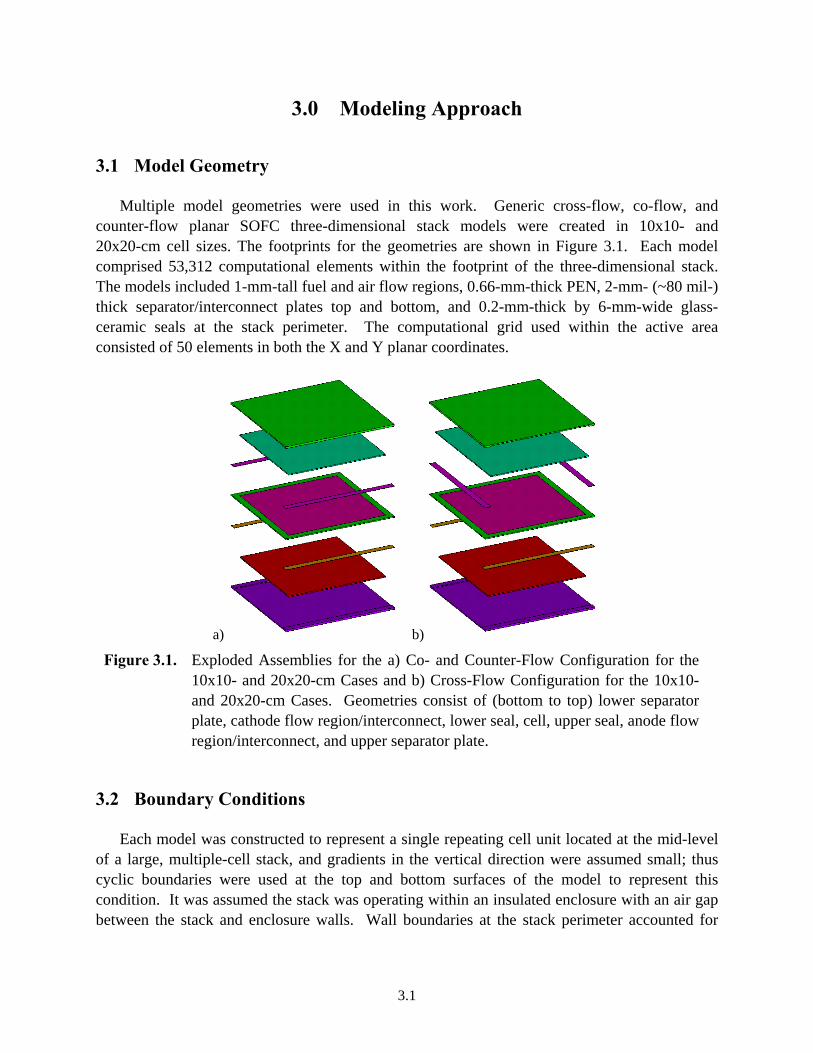
3.1 Model Geometry Multiple model geometries were used in this work. Generic cross-flow, co-flow, and counter-flow planar SOFC three-dimensional stack models were created in 10x10- and 20x20-cm cell sizes. The footprints for the geometries are shown in Figure 3.1. Each model comprised 53,312 computational elements within the footprint of the three-dimensional stack. The models included 1-mm-tall fuel and air flow regions, 0.66-mm-thick PEN, 2-mm- (~80 mil-) thick separator/interconnect plates top and bottom, and 0.2-mm-thick by 6-mm-wide glass-ceramic seals at the stack perimeter. The computational grid used within the active area consisted of 50 elements in both the X and Y planar coordinates.
a) b) Figure 3.1. Exploded Assemblies for the a) Co- and Counter-Flow Configuration for the
10x10- and 20x20-cm Cases and b) Cross-Flow Configuration for the 10x10- and 20x20-cm Cases. Geometries consist of (bottom to top) lower separator plate, cathode flow region/interconnect, lower seal, cell, upper seal, anode flow region/interconnect, and upper separator plate.
3.2 Boundary Conditions Each model was constructed to represent a single repeating cell unit located at the mid-level of a large, multiple-cell stack, and gradients in the vertical direction were assumed small; thus cyclic boundaries were used at the top and bottom surfaces of the model to represent this condition. It was assumed the stack was operating within an insulated enclosure with an air gap between the stack and enclosure walls. Wall boundaries at the stack perimeter accounted for
3.2
natural convection of air surrounding the stack and radiation across the gap to the container walls. Constant mass inflow boundaries were used for the air and fuel streams. The solutions were adjusted to achieve average cell temperature and current density to 750°C and 0.6 A/cm, respectively. In the simulations, the iterative solutions for all cases were well converged with respect to mass, momentum, energy, chemistry, and electrochemistry. Because all cases simulated stack operation at the same average temperature and current density except for variations in the output power, the differences in net heat load were attributable to the heat removed by OCR. Subsequently, the thermal performance of each stack could be compared directly. For the structural evaluation, minimal displacement support boundary conditions were used at the bottom of the cell. These simplified boundary conditions do not constrain the unit cell model as well as if it was within a full stack and thus enable more component deflection, which can contribute to the stress.
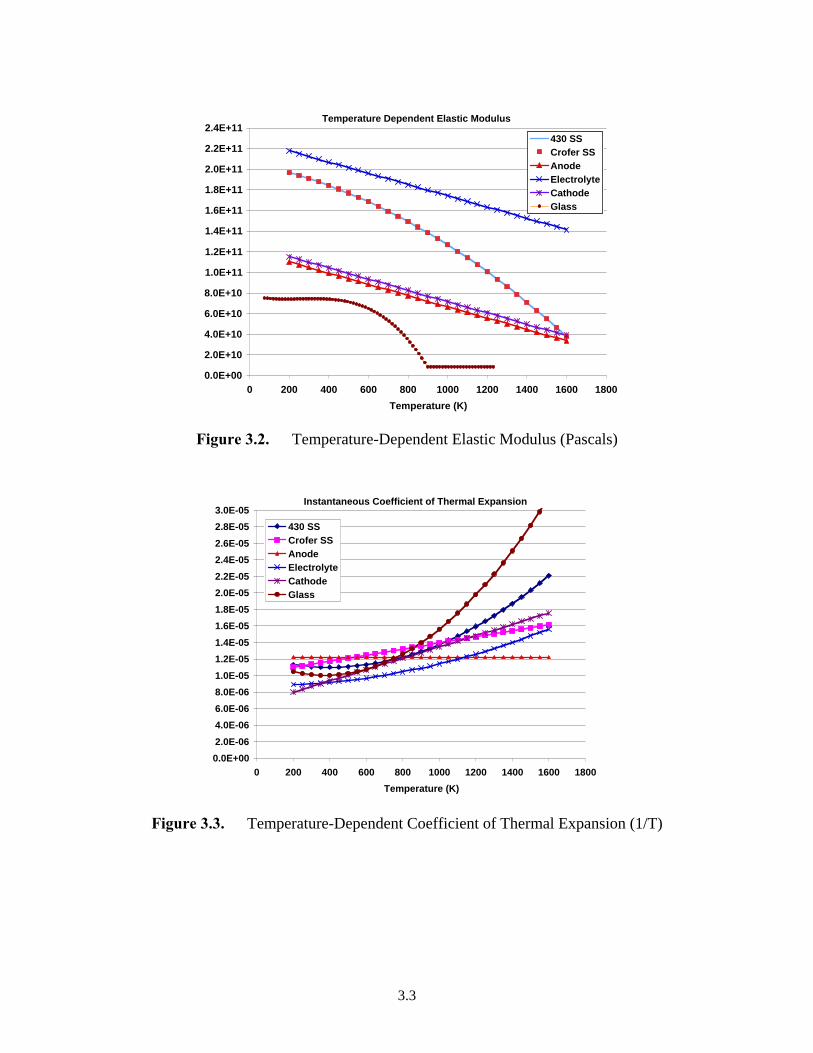
3.3 Electrochemical Performance and Material Properties For these analyses, the electrochemical performance of a cell operating on the fully pre-reformed fuel was taken to be 0.60 A/cm2 at 0.68 V and 75% fuel utilization, at an average cell temperature of 750°C. Two air flow rates were used to examine the cooling effect of air at 30% and 15% air utilization. In the electrochemistry model, the Butler-Volmer parameters were set as αBV = 0.6, kBV = 150,000 A/cm2 and Eact,BV = 118,000 J/mole. Anode, electrolyte, and cathode thicknesses were 600, 10, and 50 microns, respectively. The anode and cathode porosity was 30%, and the tortuosity was 2.5 for both electrodes. Thermal properties used in the model are summarized in Table 3.1. The temperature dependent elastic modulus (Pascals) and coefficients of thermal expansion (1/T) for the stack materials are shown in Figures 3.2 and 3.3, respectively.
Table 3.1. Thermal Properties Used in the Simulations
Material Density (kg/m3)
Thermal Conductivity (W/m-K)
Specific Heat (J/kg-K)
Gases (air, fuel) Ideal gas: ρ= ρ(T) Multicomponent mass weighted
Figure 3.3. Temperature-Dependent Coefficient of Thermal Expansion (1/T)
4.1
4.0 Results for 10x10-cm Cell Size To analyze the effect of %OCR in the 10x10-cm cell size, model geometries of cross-flow, co-flow, and counter-flow configurations were created as described in Section 3. For each flow configuration, cases simulating OCR ranging from 0 to 80% per compositions summarized in Table 3.1, and air flow rates associated with air utilizations of 30% and 15% were performed. Enough fuel mixtures were simulated to identify the thermal and power output behavior trends for each flow configuration, but not all of the fuel mixtures were simulated for all geometries.
4.1 Cross Flow 10x10 cm Figure 4.1 shows the cell ΔT (triangular icons), and the maximum principal stress (S1) in the anode (red square or green “x” icons) for each 10x10-cm cross-flow case versus %OCR. The scale for the cell ΔT is at left in the figure and that for the stress is at right. Cell ΔT for this generic 10x10 cross-flow stack and 30% air utilization varied between 74° and 82°C with a minimum at 50% OCR. The anode stress somewhat followed the trend of ΔT and exhibited a minimum value at intermediate %OCR for 30% air use. As shown in the figure, when more air was supplied to the stack (15% air use) the variation of stress was decreased, but the magnitude of the stress was not decreased substantially. For both air utilizations, the minimum anode stress was about 14-MPa. These results are summarized in Table 4.1.
Figure 4.1. Cell Temperature Difference (ΔΤ) and Maximum Principal Stress (S1)
Versus %OCR for 10x10-cm Cross-Flow Cases
4.2
Table 4.1. Summary of Results for 10x10-cm Cell Size (75/30% fuel/air utilization). Cases below the dashed line in each block of data are results for 15% air utilization.
Temperature, °C Anode Stress Power Heat In Heat Out, W
The inflow temperature increased linearly with increasing %OCR. Table 4.1 provides a summary of results from the 10x10 cross-flow, as well as co-, and counter-flow cases. In the table, for cases 1–5 as indicated in the left-most column, the total stack heat load column labeled “Heat In” shows a linear decrease with increasing %OCR. The linear inflow temperature increase was coincident with the linear decrease of heat load. As the heat load decreased, the inflow temperature was increased to maintain the average cell temperature.
4.3
The heat flow out of the stack (for cases 1–5 in Table 4.1) through the perimeter walls and the heat removed by the fuel stream decreased only slightly with increasing %OCR, while heat removed by the air stream decreased sharply. The direction of heat flow associated with the air became positive (net Heat In) for %OCR above 50%; hence, the air had shifted from providing cooling to the stack to providing net heat into the stack. This was also predicted for the 15% air use cases (cases 6-8). Independent of the air flow rates, temperature differences, and %OCR, the gross output power density for each case (including cross-, co-, and counter-flow stacks) was virtually constant at 0.40 W/cm2. Hence the electrical performance was stable for all 10x10-cm stack cases.
4.2 Co-Flow 10x10 cm Figure 4.2 plots the cell ΔT and maximum principal stress in the anode for the 10x10-cm co-flow stack cases. The figure shows little change to the magnitudes of ΔT and the anode stress over the range of %OCR. However, this 10x10-cm co-flow stack benefited from increased cathode air flow (15% air use) in the form of decreased ΔT and stress over the full range of %OCR. Stresses in the anode for this co-flow case were similar in magnitude to those predicted for the cross-flow stack.
Figure 4.2. Cell Temperature Difference (ΔΤ) and Maximum Principal Stress (S1)
Versus %OCR for 10x10-cm Co-Flow Cases
4.4
4.3 Counter-Flow 10x10 cm The 10x10-cm counter-flow cases plotted in Figure 4.3 show a definite thermal benefit for intermediate %OCR because the models predicted the anode stress to decrease from 25 MPa at 0%OCR to a minimum of 13.8 MPa at 40% OCR. The minimum stress was comparable to that predicted for cross-flow and co-flow stacks. Similarly, ΔT decreased from 85°C at 0% OCR to 45°–47°C at 40–50% OCR. The 45°–47°C temperature differences were substantially less than those exhibited by either the cross- or co-flow configuration stacks in the 10x10-cm cell size. However, the maximum cell temperature was not substantially lower than the other stacks. The counter-flow stack benefited from 15% air use because the stresses were less than those of the 30% air utilization cases. While the benefit of intermediate %OCR is apparent for the counter-flow stack, the results indicate the thermal performance is also more sensitive to the effect of OCR than the cross- and co-flow stacks.
Figure 4.3. Cell Temperature Difference (ΔΤ) and Maximum Principal Stress (S1)
Versus %OCR for 10x10-cm Counter-Flow Cases
4.4 Temperature Distributions and Stress: 10x10 cm The distribution of thermally induced stresses in a planar SOFC anode depends on the distribution of temperature. The temperature distribution is affected by the stack flow configura-tion (geometry), air utilization, and %OCR. Other variables affecting the temperature that were not addressed by this study include the thermal conductivity, thickness of stack components, fuel utilization, and stack wall boundary conditions, to name a few. Even without the effect of these other variables, the temperature distribution was unique for each simulation case. As was demonstrated above, the temperature and anode stress were particularly sensitive to %OCR in
4.5
the 10x10-cm counter-flow stack. This result, due to changes in the temperature distribution, is illustrated in Figure 4.4, which shows distributions of anode temperature and stress for cases 17, 19, and 23 from Table 4.1. In the orientation shown in the figure, air flowed across the cell from the left, and fuel flowed from the right. With 0% OCR, the distribution of temperature (a) indicated that the primary cooling came from the air (at left). Subsequently, the maximum temperature and maximum stress (b) occurred near the air outflow (at right). With 40% OCR, cooling was provided by the air and by the reformation of methane (at right). In this case the distributions of temperature (c) and stress (d) were more centrally located on the anode. With 80% OCR, less cooling was provided by the air, and a larger portion was provided by the reformation of methane. Hence maximums in temperature (e) and stress (f) occurred nearer the air inflow edge of the cell (at left). This suggests that the symmetric temperature profile with the maximum at the center is the most beneficial regarding anode stresses.
a)
c)
e)
b)
d)
f)
Figure 4.4. Distributions of Anode Temperature (top) and Maximum Principal Stress (bottom) within a 10x10-cm Counter-Flow Stack Operating with (a,b) 0% OCR, (c,d) 40% OCR, and (e,f) 80% OCR. Temperature color scale is 958K to 1054K (685°-781°C). Stress color scale is -1.75 to 25.8 MPa.
Air Fuel
5.1
5.0 Results: 20x20-cm Cell Size To analyze the effect of %OCR in the 20x20-cm cell size, model geometries of cross-flow, co-flow, and counter-flow were created. For each flow configuration, cases simulating OCR ranging from 0 to 80% and air flow rates associated with air utilizations of 30 and 15% were performed. A sufficient number of fuel mixtures were simulated to identify the behavior trends of each flow configuration; thus, not all of the fuel mixtures were simulated for all geometries.
5.1 Cross-Flow 20x20 cm Figure 5.1 plots cell ΔT and maximum principal stress in the anode for the 20x20-cm cross-flow cases. Legends and labeling are consistent with the figures in Section 4. Cell temperature differences for this generic cross-flow stack with 15% air utilization were very large, varying in magnitude from 236° to 310°C with a minimum ΔT in the 40 to 50% OCR range. The anode stress was also quite large with 30% air utilization (red squares in Figure 5.1) and featured a minimum value of 60.2-MPa at 50% OCR. The stresses decreased substantially and were less varied with 15% air use, indicating that increased air flow represents an improvement in the operating conditions for this 20x20-cm stack. Table 5.1 summarizes the simulation results from the 20x20-cm cross-flow, co-flow, and counter-flow cases. As with the smaller cell size, the inflow temperature increased linearly with increasing %OCR. As the heat load decreased, the inflow temperature increased to maintain the
Figure 5.1. Cell Temperature Difference (ΔΤ) and Maximum Principal Stress (S1)
Versus %OCR for 20x20-cm Cross-Flow Cases
5.2
Table 5.1. Summary of Results for 20x20-cm Cell Size (75/30% fuel/air utilization). Cases below the dashed line in each block of data are results for 15% air utilization.
Temperature, °C Anode Stress Power Heat In Heat Out, W
average cell temperature at 750°C. Also, the heat flow from the stack through the perimeter walls and the heat removed by the fuel stream were roughly constant, while heat removed by the air stream decreased sharply with increasing %OCR. As in the smaller cell size cases, the heat removed by the air became positive (net heat in) for OCR above 50%; hence, the air had shifted from cooling the stack to heating the stack.
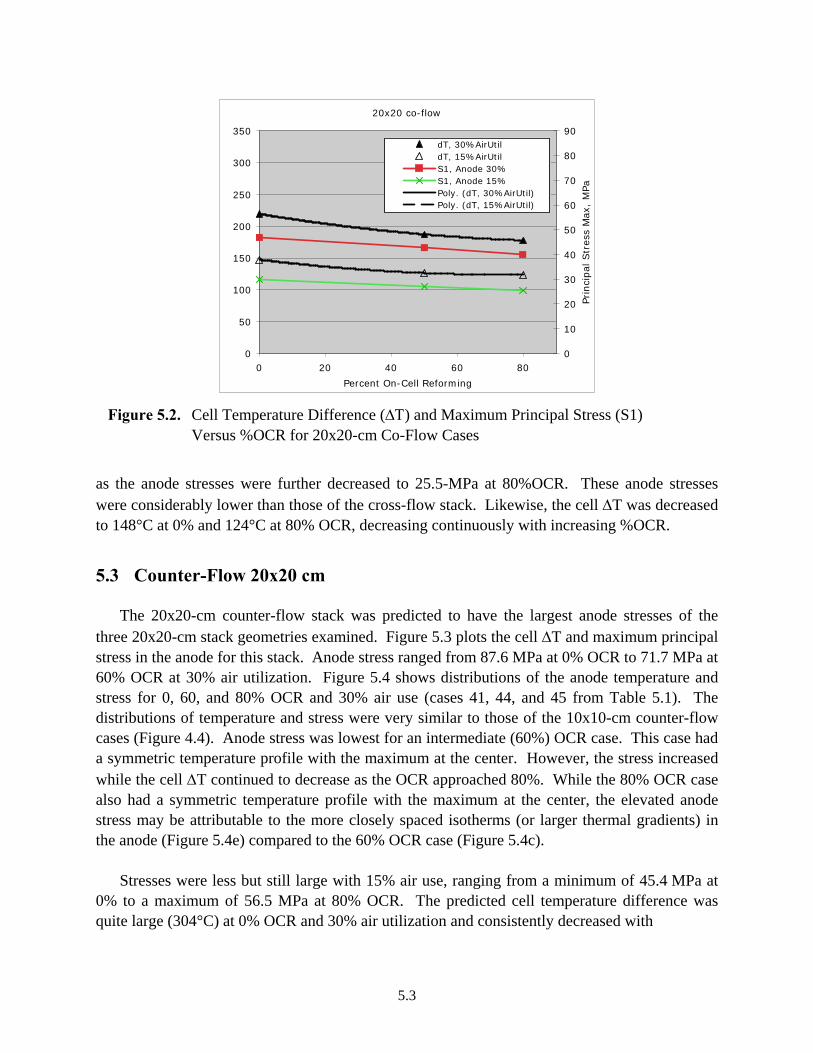
5.2 Co-Flow 20x20 cm Figure 5.2 plots cell ΔT and maximum principal stress in the anode for the 20x20-cm co-flow cases. Over the range of %OCR, the magnitude of the anode stress decreased without a minimum from 46.9 MPa at 0% to 40.0 MPa at 80% OCR for 30% air use. The results also show a performance benefit from operating the stack at 15% air utilization (cases 38–40 in Table 5.1)
Figure 5.2. Cell Temperature Difference (ΔΤ) and Maximum Principal Stress (S1)
Versus %OCR for 20x20-cm Co-Flow Cases
as the anode stresses were further decreased to 25.5-MPa at 80%OCR. These anode stresses were considerably lower than those of the cross-flow stack. Likewise, the cell ΔT was decreased to 148°C at 0% and 124°C at 80% OCR, decreasing continuously with increasing %OCR.
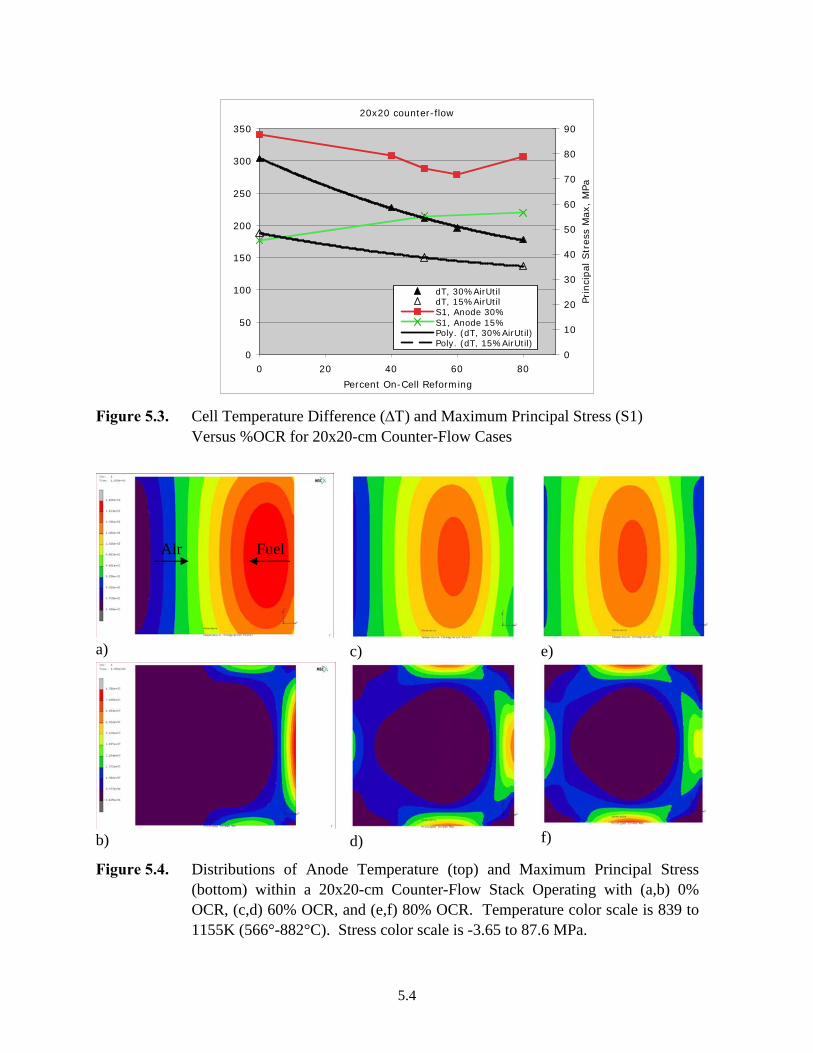
5.3 Counter-Flow 20x20 cm The 20x20-cm counter-flow stack was predicted to have the largest anode stresses of the three 20x20-cm stack geometries examined. Figure 5.3 plots the cell ΔT and maximum principal stress in the anode for this stack. Anode stress ranged from 87.6 MPa at 0% OCR to 71.7 MPa at 60% OCR at 30% air utilization. Figure 5.4 shows distributions of the anode temperature and stress for 0, 60, and 80% OCR and 30% air use (cases 41, 44, and 45 from Table 5.1). The distributions of temperature and stress were very similar to those of the 10x10-cm counter-flow cases (Figure 4.4). Anode stress was lowest for an intermediate (60%) OCR case. This case had a symmetric temperature profile with the maximum at the center. However, the stress increased while the cell ΔT continued to decrease as the OCR approached 80%. While the 80% OCR case also had a symmetric temperature profile with the maximum at the center, the elevated anode stress may be attributable to the more closely spaced isotherms (or larger thermal gradients) in the anode (Figure 5.4e) compared to the 60% OCR case (Figure 5.4c). Stresses were less but still large with 15% air use, ranging from a minimum of 45.4 MPa at 0% to a maximum of 56.5 MPa at 80% OCR. The predicted cell temperature difference was quite large (304°C) at 0% OCR and 30% air utilization and consistently decreased with
Figure 5.3. Cell Temperature Difference (ΔΤ) and Maximum Principal Stress (S1)
Versus %OCR for 20x20-cm Counter-Flow Cases
a)
c)
e)
b)
d)
f)
Figure 5.4. Distributions of Anode Temperature (top) and Maximum Principal Stress (bottom) within a 20x20-cm Counter-Flow Stack Operating with (a,b) 0% OCR, (c,d) 60% OCR, and (e,f) 80% OCR. Temperature color scale is 839 to 1155K (566°-882°C). Stress color scale is -3.65 to 87.6 MPa.
Air Fuel
5.5
increasing %OCR and increased air flow (15% air utilization). The counter-flow stack did not perform as well as the co-flow stack. In both the co-flow and counter-flow configurations, ΔT was predicted to decrease without minimum with increasing %OCR and 15% air utilization (double air flow). However, the magnitude of the cell ΔT was consistently and considerably smaller in the co-flow stack (see cases 35-40 in Table 5.1). More importantly, it was shown that the anode stresses resulting from the temperature distributions were substantially smaller in the co-flow stack.
5.4 Power Density 20x20 cm Power density was nearly invariant within the 10x10-cm cases independent of %OCR and flow configuration. However, within the 20x20-cm cases, cross-flow with 0% OCR and 30% air utilization (Case 27, Table 5.1) had conspicuously low power density (7% low relative to similar co- and counter-flow cases) and a very large temperature difference (310°C). Increased air flow and 15% air utilization (Case 31, Table 5.1) enabled a large increase in the inflow temperature, which helped to substantially decrease the cell ΔT and boost the Nernst potential. The average Nernst potential (and power listed in Table 5.1) increased to within 2% of the average of all 20x20-cm cases.
5.5 Cathode Air Utilization In this study, the nominal pressure drop for one of the 20x20-cm cells with 30% air utilization, with 1-mm-tall by 1-mm-wide channels, spaced by 1-mm-wide fins on the inter-connect, would be approximately 0.34 psi. Cases in which the cathode air flow rate was doubled (15% air utilization) would have increased cathode channel pressure drop proportional to 0.68 psi if the cathode channel height was left unaltered. Assuming a pumping efficiency of 0.5 for a 100-cell stack, this would increase the power required to pump air through the cathode by a factor of 4. Similarly low efficiencies are often suffered when relatively low flow rates and high head losses are required. Higher efficiencies could be possible if larger high-speed pumps were used to provide air for multiple stacks.11 The benefit that increased air flow can provide in the form of decreased thermal stress must be balanced with the increased cathode pressure drop and blower power requirement. However, the 20x20-cm cell stacks examined in this study required increased air flow (15% air utilization) to achieve reasonably low stresses and anode temperatures.
6.1
6.0 Conclusions The following observations were drawn from the results of this study:
• The analysis showed that the anode stress was a minimum along with the temperature difference on the cell when 40 to 50% of the reformation reaction took place on-cell in counter-flow and cross-flow stacks of 10x10-cm size.
• Gross electrical power density of 0.40 W/cm2 was virtually unaffected for each 10x10-cm case. Each of the 20x20-cm cases that exhibited reasonable thermal performance also had power densities that varied from the average of 0.40 W/cm2 by at most -1% to +2%.
• Inflow gas temperature increased linearly with linearly increasing %OCR to offset the decreasing heat load and maintain the average cell temperature at 750°C. Examination of the heat load data showed that the air had shifted roles from providing stack cooling to providing net stack heat for OCR above 50%. An exception to this was the 20x20-cm counter-flow stack in which the air continued to provide net cooling over the full range of OCR.
• The co-flow stack showed substantial thermal benefit due to increased air flow (and 15% air utilization) as the anode stress and cell temperature difference was decreased over the full range of OCR. Cross-flow and counter-flow stacks did not show the same consistent benefit.
• Within the 20x20-cm cases the co-flow configuration stack had the smallest anode stresses and cell temperature difference both of which had no minimum, but rather were continuously decreased with increasing OCR.
• For the conditions and particular generic stacks of this study, the results suggest 40 to 50% reformation on-cell should be considered for cross-flow and counter-flow stacks, and higher percentages may be desirable in co-flow stacks.
• Air utilization of 15% provided a consistent thermal benefit in the form of decreased anode stress, cell ΔT, and maximum temperature compared with 30% air utilization. Although doubling the air flow can result in a factor of 4 increase in the air blower power requirement, a maximum of 15% air utilization may be necessary in 20x20-cm cell stacks to achieve acceptably low stresses and anode temperatures.
7.1
7.0 References 1. Recknagle KP, DT Jarboe, DL King, MA Khaleel, and P Singh. 2005. Modeling of On-Cell
Reformation in SOFC Stacks: The Effect of Methane Conversion Activity Manipulations on Stack Performance. PNNL-15311, Pacific Northwest National Laboratory, Richland, Washington.
2. Khaleel MA. 2005. “Finite Element SOFC Analysis with SOFC-MP and MSC.Marc/Mentat-FC.” Proceedings of the Sixth Annual SECA Workshop. National Engineering Technology Laboratory, Morgantown, West Virginia. Available at http://www.netl.doe.gov/publications/proceedings/05/SECA_Workshop/SECAWorkshop05.html
3. Khaleel MA, Z Lin, P Singh, W Surdoval, and D Collins. 2004. “A Finite Element Analysis Modeling Tool for Solid Oxide Fuel Cell Development: Coupled Electrochemistry, Thermal, and Flow Analysis in Marc.” J. Power Sources, 130(1-2):136-148.
4. Recknagle KP, RE Williford, LA Chick, DR Rector, and MA Khaleel. 2003. “Three-dimensional thermo-fluid electrochemical modeling of planar SOFC stacks.” J. Power Sources, 113:109-114.
5. Chick LA, JW Stevenson, KD Meinhardt, SP Simner, JE Jaffe, and RE Williford. 2000. “Modeling and Performance of Anode-Supported SOFC.” 2000 Fuel Cell Seminar – Abstracts, pp. 619-622.
7. Keegan K, M Khaleel, L Chick, K Recknagle, S Simner, and J Deibler. 2002. “Analysis of a Planar Solid Oxide Fuel Cell-Based Automotive Auxiliary Power Unit.” Society of Automotive Engineers, Congress 2002 Proceedings, 2002-01-0413.
8. Williford RE, LA Chick, GD Maupin, SP Simner, and JW Stevenson. 2003. “Diffusion Limitations in the Porous Anodes of SOFCs.” J. Electrochemical Soc. 150(8):A1067-A1072.
9. Recknagle KP, P Singh, LA Chick, and MA Khaleel. 2004. “Modeling of SOFC Stacks with On-Cell Steam-Methane Reformation at PNNL.” PNNL-SA-43248, Proceedings of the Fuel Cell 2004 Seminar, San Antonio, Texas.
10. King DL, Y Wang, Y Chin, Y Lin, H Roh, and R Romiarek. 2005. “Controlling Activity and Stability of Ni-YSZ Catalysts for On-Anode Reforming.” Presented at SECA Core Technology Program Review Meeting, Tampa, Florida.
11. Clark T and M Arner. 2002. “Motor Blower Technologies for Fuel Cell Automotive Power Systems.” Hydrogen, Fuel Cells, and Infrastructure Technologies Program Annual Report 2002. U.S. Department of Energy, Washington, D.C., pp. 503-507. Available at http://www.eere.energy.gov/hydrogenandfuelcells/pdfs/33098_toc.pdf.
Appendix A
Molar Compositions of Partially Reformed Fuel Mixtures
A.1
Appendix A
Molar Compositions of Partially Reformed Fuel Mixtures Table A.1. Mass Compositions of Partially Reformed Fuel Mixtures Supplied from an
External Reformer to the Stack (mass fraction) OCR 0% 10% 20% 30% 40% 50% 60% 70% 80%