Analysis of phosphorus use efficiency traits in Coffea genotypes reveals Coffea arabica and Coffea canephora have contrasting phosphorus uptake and utilization efficiencies Article Published Version Creative Commons: Attribution 4.0 (CC-BY) Open access Neto, A. P., Favarin, J. L., Hammond, J. P., Tezotto, T. and Couto, H. T. Z. (2016) Analysis of phosphorus use efficiency traits in Coffea genotypes reveals Coffea arabica and Coffea canephora have contrasting phosphorus uptake and utilization efficiencies. Frontiers in Plant Science, 7. 408. ISSN 1664- 462X doi: https://doi.org/10.3389/fpls.2016.00408 Available at http://centaur.reading.ac.uk/61844/ It is advisable to refer to the publisher’s version if you intend to cite from the work. See Guidance on citing . To link to this article DOI: http://dx.doi.org/10.3389/fpls.2016.00408 Publisher: Frontiers All outputs in CentAUR are protected by Intellectual Property Rights law, including copyright law. Copyright and IPR is retained by the creators or other
Transcript
Analysis of phosphorus use efficiency traits in Coffea genotypes reveals Coffea arabica and Coffea canephora have contrasting phosphorus uptake and utilization efficiencies Article
Published Version
Creative Commons: Attribution 4.0 (CCBY)
Open access
Neto, A. P., Favarin, J. L., Hammond, J. P., Tezotto, T. and Couto, H. T. Z. (2016) Analysis of phosphorus use efficiency traits in Coffea genotypes reveals Coffea arabica and Coffea canephora have contrasting phosphorus uptake and utilization efficiencies. Frontiers in Plant Science, 7. 408. ISSN 1664462X doi: https://doi.org/10.3389/fpls.2016.00408 Available at http://centaur.reading.ac.uk/61844/
It is advisable to refer to the publisher’s version if you intend to cite from the work. See Guidance on citing .
To link to this article DOI: http://dx.doi.org/10.3389/fpls.2016.00408
Publisher: Frontiers
All outputs in CentAUR are protected by Intellectual Property Rights law, including copyright law. Copyright and IPR is retained by the creators or other
Analysis of Phosphorus UseEfficiency Traits in Coffea GenotypesReveals Coffea arabica and Coffeacanephora Have ContrastingPhosphorus Uptake and UtilizationEfficienciesAna P. Neto 1*, José L. Favarin 1, John P. Hammond 2, Tiago Tezotto 3 and Hilton T. Z. Couto 4
1Departamento de Produção Vegetal, Escola Superior de Agricultura Luiz de Queiroz, Universidade De São Paulo,
Piracicaba, Brazil, 2 School of Agriculture, Policy and Development and Centre for Food Security, Reading, UK, 3Centro
Universitário da Fundação Octavio Bastos, São João da Boa Vista, Brazil, 4Departamento de Recursos Florestais, Escola
Superior de Agricultura Luiz de Queiroz, Universidade De São Paulo, Piracicaba, Brazil
Background and Aims: Phosphate (Pi) is one of the most limiting nutrients for
agricultural production in Brazilian soils due to low soil Pi concentrations and rapid
fixation of fertilizer Pi by adsorption to oxidic minerals and/or precipitation by iron and
aluminum ions. The objectives of this study were to quantify phosphorus (P) uptake and
use efficiency in cultivars of the species Coffea arabica L. and Coffea canephora L., and
group them in terms of efficiency and response to Pi availability.
Methods: Plants of 21 cultivars of C. arabica and four cultivars of C. canephora
were grown under contrasting soil Pi availabilities. Biomass accumulation, tissue P
concentration and accumulation and efficiency indices for P use were measured.
Key Results: Coffee plant growth was significantly reduced under low Pi availability, and
P concentration was higher in cultivars of C. canephora. The young leaves accumulated
more P than any other tissue. The cultivars of C. canephora had a higher root/shoot ratio
and were significantly more efficient in P uptake, while the cultivars of C. arabica were
more efficient in P utilization. Agronomic P use efficiency varied among coffee cultivars
and E16 Shoa, E22 Sidamo, Iêmen and Acaiá cultivars were classified as the most
efficient and responsive to Pi supply. A positive correlation between P uptake efficiency
and root to shoot ratio was observed across all cultivars at low Pi supply. These data
identify Coffea genotypes better adapted to low soil Pi availabilities, and the traits that
contribute to improved P uptake and use efficiency. These data could be used to select
current genotypes with improved P uptake or utilization efficiencies for use on soils with
low Pi availability and also provide potential breeding material and targets for breeding
new cultivars better adapted to the low Pi status of Brazilian soils. This could ultimately
reduce the use of Pi fertilizers in tropical soils, and contribute to more sustainable coffee
Neto et al. Phosphorus Use Efficiency in Coffee Cultivars
INTRODUCTION
Brazilian coffee producing areas are concentrated in the tropicalregions, whose soils are highly weathered with low plant availablephosphate (Pi). Thus, Pi fertilizers are necessary to maintaincrop production. Fertilizer Pi can be adsorbed by clay mineralsor precipitated by iron (Fe2+) and aluminum (Al3+), whichreduces the availability of Pi in tropical soil with only 10–20% of the Pi applied being absorbed by the crop (Mclaughlinet al., 1991; Bolland and Gilkes, 1998; Sousa and Lobato, 2003).Consequently, soil Pi availability can be a significant limitingfactor in crop and coffee production (Vance et al., 2003; Lynch,2007).
There are major concerns about the future availability ofnon-renewable phosphate rock reserves that could impact on Pifertilizer availability and costs (Cordell et al., 2009; USGS, 2012).Thus, identification of economic and sustainable approaches thatimprove the efficiency of Pi fertilizer use are a high priorityin crop breeding programs (Parentoni and Junior, 2008; Maiaet al., 2011; Wiel et al., 2016). Since coffee breeding in the pasthas focused on breeding for high yields and pest and diseaseresistance under high soil fertility, there is scope and need todevelop coffee cultivars for the future that are better adapted tolow soil Pi availability.
Coffee has a high genetic variability and several studiesindicate variation between different genotypes in relation toabsorption and translocation of nutrients (Amaral et al., 2011),including zinc and P (Reis and Martinez, 2002), potassium,calcium, magnesium, and sulfur (Tomaz et al., 2003, 2008),boron, zinc, copper, and manganese (Tomaz et al., 2011), but fewhave explored P use efficiency. In research conducted by Martinset al. (2015), the authors indicated high genotypic variability forCoffea canephora genotypes cultivated in environments with lowPi availability in the soil and classified seven of the 13 cultivarsstudied as tolerant to low soil Pi availability.
Significant genetic variation has previously been observed inphosphorus use efficiency (PUE) related traits in plants (Wissuwaand Ae, 2001; Osborne and Rengel, 2002a,b; Ozturk et al., 2005;Gunes et al., 2006; Hammond et al., 2009). Genetic variation inPUE and related traits has previously been shown to be heritable(Fawole et al., 1982; Hammond et al., 2009) and once these traitshave been identified in a cultivar, it could be used in breedingprograms to improve crop PUE. Component traits that give riseto improved PUE are also identified through these studies andprovide more focused breeding targets to achieve improved cropPUE (Hammond et al., 2009).
There are numerous definitions for PUE (White et al., 2005;Hammond et al., 2009; Rose and Wissuwa, 2012). Phosphorus(P) uptake efficiency refers to the plants ability to obtainPi from the soil, and P utilization efficiency to the capacityfor biomass production using the P absorbed (Wang et al.,2010). Increasing PUE can be achieved either by increasinguptake capacity or by optimizing its utilization (Manske et al.,2001; Shenoy and Kalagudi, 2005; Parentoni and Junior, 2008).The relative importance of each measure depends on theenvironmental conditions under which the crop is growing. Inhigh input agri-ecosystems, the importance of P uptake efficiency
is diminished, given the greater availability of Pi from fertilizerinputs. Improvements, in P utilization efficiency and reductionsin the P removed at harvest would be of agronomic benefit underthese conditions. In contrast, under low input systems, where soilPi availability may be low, improvements in P acquisition andutilization are likely to be of benefit.
This study aims to quantify P uptake and use efficiency incultivars of the species Coffea arabica L. and Coffea canephoraL., group them in terms of efficiency and their response to Piavailability. This will identify genotypes and traits to supportfuture breeding of coffee cultivars for low soil Pi conditions,reducing inputs and improving the sustainability of production.
MATERIALS AND METHODS
Plant MaterialA total of 21 coffee cultivars of the species Coffea arabica L.and four cultivars of the species C. canephora (SupplementaryTable 1) were grown under glasshouse conditions, in Piracicaba(22◦42′27.98′′ S and 47◦37′58.21′′ W, altitude 547 m), São PauloState, Brazil, from July 2010 to August 2011. The materials wereselected from the germplasm bank of the Instituto Agronômicode Campinas (IAC). C. arabica genetic material introduced toBrazil before the 1970’s shows a narrow genetic base with highrelationship between cultivars. Therefore, we also included exoticintroductions from other countries, selections and botanicalforms representing the two main species cultivated.
Growth ConditionsAll seeds were germinated in washed sand and irrigated withdeionized water. Seedlings were transplanted into 9 dm3 pots(one seedling per pot) before the emergence of cotyledons.Pots were filled with soil, classified as Oxisol with mediumtexture, collected in Piracicaba, São Paulo State, at 20 cm belowthe surface to eliminate the effect of previous fertilizations(Supplementary Table 2). A low Pi treatment was used consistingof the original Pi concentration in the soil (8 mg Pi dm−3
- resin extraction). The resin Pi extraction procedure wasbased upon ion exchange using an ion exchange resin tomeasure plant available Pi (Van Raij et al., 1986). A high Pitreatment was obtained by the addition of 3.7 g of monobasicammonium phosphate (NH4H2PO4) and 1.56 g monobasicpotassium phosphate (KH2PO4) per pot, to give a soil resinextractable Pi concentration of 120mg Pi dm−3, considered highfor coffee production (Lani et al., 2007). In treatments withoutPi, N and K were added at each pot to ensure that all receivedthe same amount (1.28 g NH4NO3, 0.89 g K2SO4, and 0.095 gKCl). The limestone and fertilizers were mixed into the soil foreach pot and incubated for 20 days, with moisture maintainedat 60% of water retention capacity. Limestone was added tocorrect soil acidity. The remaining nutrients were provided inthe following concentrations (mg dm−3): N (NO−
3 and NH+4 ) -
50; K-50; S-50; B-1; Co-0.1; Cu-1; Cl-5; Mn-5; Mo-0.15; Ni-0.1and Zn-3. Soil chemical and physical properties were determinedprior to transplanting of seedlings (Supplementary Table 2). BasalN and K applications were supplemented with four applicationsin solution each month after plant emergence (mg dm−3): N-50,
Frontiers in Plant Science | www.frontiersin.org 2 March 2016 | Volume 7 | Article 408
Neto et al. Phosphorus Use Efficiency in Coffee Cultivars
K-50, and S-20. Pots were irrigated daily by means drip irrigationand the volume of water was calculated so that there was norunoff of water.
The experimental design consisted of randomized blocks, ina factorial design: 25 (cultivars) × 2 (Pi concentrations: low andhigh Pi), with five repetitions. Glasshouse average temperaturewas 23± 3.35◦C (mean± SD) and relative humidity 70%± 12.04(mean± SD).
Plant AnalysisPlant height, stem diameter, and number of branches weremeasured every month. The height was obtained from the baseto the apex of the orthotropic branch, and the stem diameter at2 cm from the stem base. The orthotropic branch is the branchthat grows vertically and supports the side branches. At harvest,9 months after germination, the number of young and matureleaves, leaf area, and the dry mass of young leaves, mature leaves,branches, stem and roots were determined. Mature leaves wereconsidered those fully expanded, with intense green color, andyoung leaves were considered as still expanding, with a pale greencolor. Leaf area was determined with a LiCor 3100 leaf area meter(LiCor, Nebraska, USA).
Plant material was rinsed in deionized water. Plagiotropicbranches stem, and roots were dried in an oven with aircirculation at 65◦C for 72 h. Plagiotropic branches are thereproductive side branches where the beans are produced. Afterdrying, dry mass (DM) was obtained for each tissue, and thematerials were finely milled in a Wiley mill.
Phosphorus Use EfficiencyThe relative efficiency of phosphorus use (REP, %) of cultivarswas calculated as the ratio between the plant DM under low Piand DM under high Pi, as described by Ozturk et al. (2005):
REP =
(
DMlow Pi
DMhigh Pi
)
x100
The agronomic P use efficiency (APE, g DM g−1 Pi) was obtainedby expression adapted from Oliveira et al. (1987):
APE =
(
DMhigh Pi − DMlow Pi
)
difference in the total available Pi betweenhigh Pi and low Pi treatments
The APE and DM at low Pi were used to separate the cultivarsinto different categories, as described previously (Gerloff, 1977):(i) efficient and non-responsive cultivars (ENR); (ii) efficientand responsive cultivars (ER); (iii) non-efficient and responsivecultivars (NER); and (iv) non-efficient and non-responsivecultivars (NENR).
P use efficiency was separated into P uptake efficiency (PUpE,mg P g−1 Pi) and P utilization efficiency (PUtE, g DM g−1 P).The PUpE was obtained by the ratio of P uptake in plant andthe amount of Pi applied and PUtP represents the production ofplant biomass per unit P accumulated in the plant:
PUpEhigh Pi =
(
[P]high PixDMhigh Pi
)
Piappliedor
PUpElow Pi =([P]low PixDMlow Pi)
Piapplied
PUtEhigh Pi =DMhigh Pi
(
[P]high PixDMhigh Pi
)or
PUtElow Pi =DMlow Pi
([P]lowPixDMlow Pi)
The physiological P use efficiency (PPUE, (g2 DM g−1 P))corresponds to DM produced for a given plant P concentration(Hammond et al., 2009).
PPUEhigh Pi =DMhigh Pi
[P]high Pi
or PPUElow Pi =DMlow Pi
[P]low Pi
Statistical AnalysesData were analyzed by analysis of variance using SAS (SASInstitute INC., Cary, NC, USA) and means were compared byTukey test at P < 0.05. The relationship between dry massand relative efficiency of P were analyzed by regression analysis.Correlations between the measured data were performed usingthe Pearson correlation coefficient in GenStat (64-bit Release16.1, VSN International Ltd., Hemel Hempstead, UK). Significantcorrelations were identified at a significance level of P < 0.05.
RESULTS
Low Pi Availability Reduces Coffee Growthand DevelopmentCoffee plants grown at low Pi showed symptoms of nutrientdeficiency. As the Pi deficiency progressed, mature leaves becamechlorotic with necrotic lesions on the leaf apex, as observed byOzturk et al. (2005). Total plant dry mass (DM) was reduced byapproximately 50% under low Pi conditions compared to highPi conditions and the greatest DM reduction was observed inthe branches that accumulated only 43% of the DM at high Pi(Table 1). Cultivars of C. canephora produced more DM in theroots, regardless of the Pi treatment, compared to cultivars ofC. arabica. Consequently, cultivars of C. canephora had higherroot/shoot ratios (Table 1). Growth rates of plants at high Pi werehigher than those at low Pi until the 5th month for C. arabicaand the 6th month for C. canephora (Supplementary Table 3).After this period, growth rates were similar regardless of the Pi
Frontiers in Plant Science | www.frontiersin.org 3 March 2016 | Volume 7 | Article 408
Neto et al. Phosphorus Use Efficiency in Coffee Cultivars
TABLE 1 | Means of dry mass of shoot and roots and ratio root/shoot of 21
cultivars of C. arabica and 4 cultivars of C. canephora.
P Treatment Species Root (g)a Shoot (g)a,b Total (g)a Ratio
Root/Shoota
Low Pi C. arabica 6.2 Bb 23.0 Ba 29.3 Bb 0.27 Ab
C. canephora 7.3 Ba 18.0 Bb 25.4 Bb 0.40 Aa
High Pi C. arabica 10.9 Ab 37.9 Aa 49.2 Aa 0.29 Ab
C. canephora 13.4 Aa 32.8 Aa 46.3 Aa 0.43 Aa
F-test: 54.9* 60.4* 62.7* 22.0*
Species (S) 31.3* 15.1* 2.56ns 145.8*
Level of P (P) 230.0* 208.0* 222.5* 0.0ns
S x P interaction: 6.5* 0.7ns 0.2ns 1.0ns
aValues followed by the same capital letters vertically do not differ significantly (P > 0.05)
between treatments (low and high Pi) and values followed by the same lowercase letters
do not differ significantly (P > 0.05) between species (C. arabica and C. canephora).bShoot = stem + branches + mature leaves + young leaves.
* significant effect; ns, not significant.
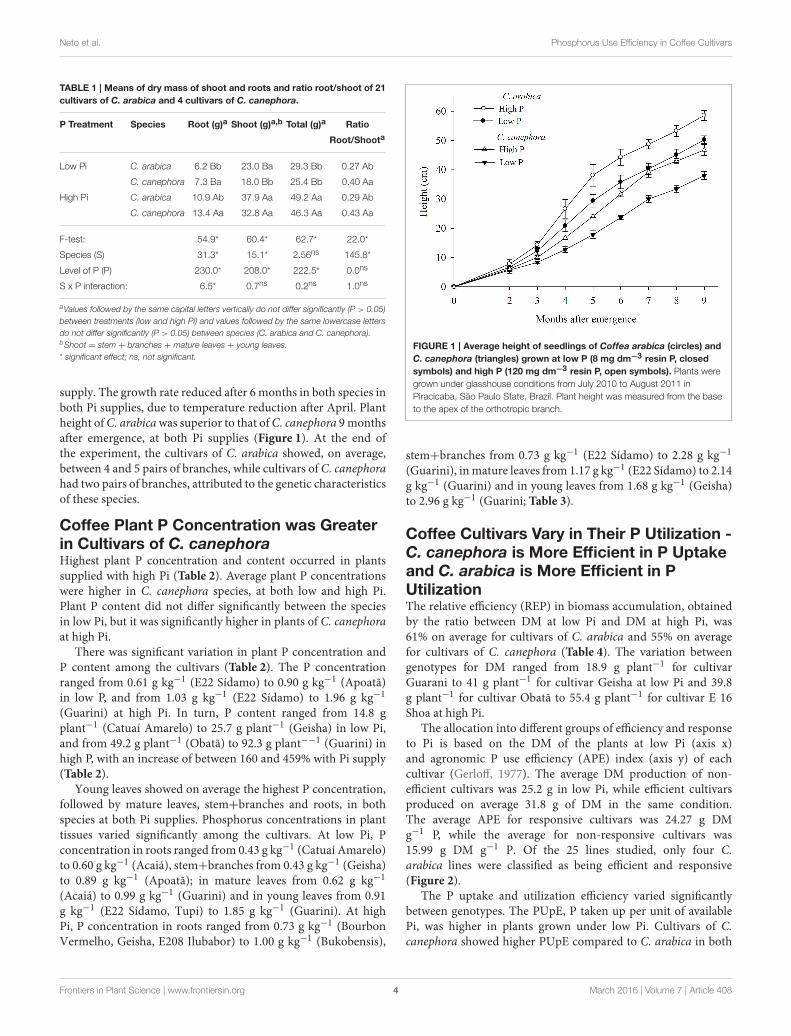
supply. The growth rate reduced after 6 months in both species inboth Pi supplies, due to temperature reduction after April. Plantheight ofC. arabicawas superior to that ofC. canephora 9monthsafter emergence, at both Pi supplies (Figure 1). At the end ofthe experiment, the cultivars of C. arabica showed, on average,between 4 and 5 pairs of branches, while cultivars of C. canephorahad two pairs of branches, attributed to the genetic characteristicsof these species.
Coffee Plant P Concentration was Greaterin Cultivars of C. canephoraHighest plant P concentration and content occurred in plantssupplied with high Pi (Table 2). Average plant P concentrationswere higher in C. canephora species, at both low and high Pi.Plant P content did not differ significantly between the speciesin low Pi, but it was significantly higher in plants of C. canephoraat high Pi.
There was significant variation in plant P concentration andP content among the cultivars (Table 2). The P concentrationranged from 0.61 g kg−1 (E22 Sídamo) to 0.90 g kg−1 (Apoatã)in low P, and from 1.03 g kg−1 (E22 Sídamo) to 1.96 g kg−1
(Guarini) at high Pi. In turn, P content ranged from 14.8 gplant−1 (Catuaí Amarelo) to 25.7 g plant−1 (Geisha) in low Pi,and from 49.2 g plant−1 (Obatã) to 92.3 g plant−−1 (Guarini) inhigh P, with an increase of between 160 and 459% with Pi supply(Table 2).
Young leaves showed on average the highest P concentration,followed by mature leaves, stem+branches and roots, in bothspecies at both Pi supplies. Phosphorus concentrations in planttissues varied significantly among the cultivars. At low Pi, Pconcentration in roots ranged from 0.43 g kg−1 (Catuaí Amarelo)to 0.60 g kg−1 (Acaiá), stem+branches from 0.43 g kg−1 (Geisha)to 0.89 g kg−1 (Apoatã); in mature leaves from 0.62 g kg−1
(Acaiá) to 0.99 g kg−1 (Guarini) and in young leaves from 0.91g kg−1 (E22 Sídamo, Tupi) to 1.85 g kg−1 (Guarini). At highPi, P concentration in roots ranged from 0.73 g kg−1 (BourbonVermelho, Geisha, E208 Ilubabor) to 1.00 g kg−1 (Bukobensis),
FIGURE 1 | Average height of seedlings of Coffea arabica (circles) and
C. canephora (triangles) grown at low P (8 mg dm−3 resin P, closed
symbols) and high P (120 mg dm−3 resin P, open symbols). Plants were
grown under glasshouse conditions from July 2010 to August 2011 in
Piracicaba, São Paulo State, Brazil. Plant height was measured from the base
to the apex of the orthotropic branch.
stem+branches from 0.73 g kg−1 (E22 Sídamo) to 2.28 g kg−1
(Guarini), inmature leaves from 1.17 g kg−1 (E22 Sídamo) to 2.14g kg−1 (Guarini) and in young leaves from 1.68 g kg−1 (Geisha)to 2.96 g kg−1 (Guarini; Table 3).
Coffee Cultivars Vary in Their P Utilization -C. canephora is More Efficient in P Uptakeand C. arabica is More Efficient in PUtilizationThe relative efficiency (REP) in biomass accumulation, obtainedby the ratio between DM at low Pi and DM at high Pi, was61% on average for cultivars of C. arabica and 55% on averagefor cultivars of C. canephora (Table 4). The variation betweengenotypes for DM ranged from 18.9 g plant−1 for cultivarGuarani to 41 g plant−1 for cultivar Geisha at low Pi and 39.8g plant−1 for cultivar Obatã to 55.4 g plant−1 for cultivar E 16Shoa at high Pi.
The allocation into different groups of efficiency and responseto Pi is based on the DM of the plants at low Pi (axis x)and agronomic P use efficiency (APE) index (axis y) of eachcultivar (Gerloff, 1977). The average DM production of non-efficient cultivars was 25.2 g in low Pi, while efficient cultivarsproduced on average 31.8 g of DM in the same condition.The average APE for responsive cultivars was 24.27 g DMg−1 P, while the average for non-responsive cultivars was15.99 g DM g−1 P. Of the 25 lines studied, only four C.arabica lines were classified as being efficient and responsive(Figure 2).
The P uptake and utilization efficiency varied significantlybetween genotypes. The PUpE, P taken up per unit of availablePi, was higher in plants grown under low Pi. Cultivars of C.canephora showed higher PUpE compared to C. arabica in both
Frontiers in Plant Science | www.frontiersin.org 4 March 2016 | Volume 7 | Article 408
Neto et al. Phosphorus Use Efficiency in Coffee Cultivars
TABLE 2 | Plant P concentration and P content in coffee cultivars grown at
low and high Pi.
Cultivars P concentration P content
(g P kg−1 DM) (mg plant−1)
Low Pi High Pi Low Pi High Pi
Coffea arabica
Typica 0.62 1.28 15.3 68.0
Bourbon Vermelho 0.65 1.07 15.9 55.9
Bourbon Amarelo 0.66 1.12 21.5 55.8
Mundo Novo 0.64 1.29 17.7 70.3
Acaiá 0.63 1.18 19.3 61.4
Caturra Vermelho 0.74 1.42 22.0 67.9
Caturra Amarelo 0.70 1.46 21.5 64.6
Catuaí Vermelho 0.69 1.35 20.1 60.6
Catuaí Amarelo 0.66 1.40 14.8 64.8
Icatu Precoce 0.63 1.20 21.5 61.7
Ouro Verde 0.82 1.39 21.6 62.1
Obatã 0.69 1.24 18.4 49.2
Tupi 0.65 1.34 19.3 65.3
E 534 Kaffa 0.66 1.18 16.9 62.7
E 208 Illubabor 0.68 1.05 19.1 50.6
E 22 Sidamo 0.61 1.03 18.1 54.8
E 16 Shoa 0.64 1.17 19.4 64.8
E 12 Harar 0.65 1.14 22.7 60.5
Jimma Tane 0.69 1.22 15.9 53.0
Geisha 0.63 1.06 25.7 51.9
Iemen 0.64 1.19 20.0 63.5
Averagea 0.67Bb 1.23Ab 19.4Ba 60.4Ab
Coffea canephora
Apoatã 0.90 1.92 23.0 86.4
Robusta 0.77 1.60 22.0 77.0
Bukobensis 0.83 1.45 22.8 63.5
Guarini 0.88 1.96 16.5 92.3
Averagea 0.85Ba 1.74Aa 21.1Ba 79.8Aa
F-test: 19,89 29.58* 16.18*
Cultivars (C): 12.32* 1.78*
Level of P (P) 1172.40* 746.92*
Interaction C × P 3.83* 1.72*
Least significant difference: 0.14 0.45 10.3 40.6
aValues followed by the same capital letters do not differ significantly (P > 0.05) between
treatments and values followed by the same lowercase letters do not differ significantly
(P > 0.05) between species.
Pi treatments (Table 5). The PUpE ranged from 206 mg P g−1 Pi(cv. Catuaí Yellow ) to 319 mg P g−1 Pi (Apoatã) at low Pi andbetween 46 mg P g−1 Pi (Obatã) and 85 mg P g−1 Pi (Guarini) athigh Pi (Table 5). The PUtE was higher in plants of C. arabica inboth Pi treatments. At low Pi PUtE ranged from 1.12 g DMmg−1
P (Apoatã) to 1.66 g DM mg−1 P (E22 Sidamo), and at high Pi,from 0.52 g DM mg−1 P (Guarini) to 0.97 g DM mg−1 P (E22Sidamo; Table 5).
FIGURE 2 | Relationship between shoot dry matter (DM) at low P and
responsiveness to P, measured as agronomic phosphorus (P) use
efficiency for different coffee cultivars. Coffea arabica (closed symbols)
and C. canephora (open symbols). Solid lines represent the mean value for the
axis. NER, non-efficient and responsive; ER, efficient and responsive; ENR,
efficient and non-responsive; NENR, non-efficient and non-responsive.
PPUE was higher in plants grown under Pi deficiency dueto the reduced availability and uptake of Pi. Further, PPUEwas higher in plants of the species C. arabica under both Pitreatments. PPUE varied among genotypes, ranging from 21.3(Guarini) to 64.9 g2 DM mg−1 P (Geisha) at low Pi, and from24.4 (Guarini) to 51.6 g2 DM mg−1 P (E22 Sidamo) under highPi (Table 5).
Significant correlations between biomass, P uptakeand measures of PUE were observed within treatments(Supplementary Table 4). At low Pi, significant positivecorrelations between PPUE and the P content of shoots, matureleaves and stems was observed, but no significant correlationswere observed between PPUE and the P content of young leavesor roots. At low Pi, the root to shoot ratio was significantly (P =
0.0012) positively correlated with PUpE, but significantly (P =
<0.001) negatively correlated with PUtE. Root to shoot ratio wasalso significantly positively correlated with aboveground tissueP concentrations under both low and high Pi supplies. Root toshoot ratio was significantly (P = <0.001) negatively correlatedwith both PUtE and PPUE under high Pi supply (SupplementaryTable 4B).
DISCUSSION
In the current study, we assessed 21 cultivars of C. arabica andfour cultivars of C. canephora and observed a wide variation ofdifferent components of PUE and growth traits in response tosoil Pi availability. Interestingly, at the species level, cultivars ofC.canephora showed higher PUpE compared to C. arabica in bothPi treatments and cultivars of C. arabica showed higher PUtEcompared to C. canephora in both Pi treatments (Table 5). Rootto shoot ratios of coffee cultivars were also positively correlatedwith PUpE at low soil Pi availability, but negatively correlatedwith PUtE (Supplementary Table 4).
Frontiers in Plant Science | www.frontiersin.org 5 March 2016 | Volume 7 | Article 408
aValues followed by the same capital letters do not differ significantly (P > 0.05) between treatments and values followed by the same lowercase letters do not differ significantly (P >
0.05) between species.
The coffee varieties differed in growth and DM production inlow Pi and in response to Pi supply (Table 4). The REP amongthe cultivars ranged from 39 (cv Guarini) to 83% (cv Geisha),i.e., the DM production in low Pi in cultivar Guarini was greatlyreduced , while in Geisha, there was a slight reduction in DMbetween high and low Pi treatments (Table 4). Previous breedingefforts have focused on increasing grain or DM production.
Since these are used in all indexes to calculate P utilizationefficiencies, increased grain or DM biomass with or withoutchanges in P concentrations in tissues can result in unintentionalimprovements in PUE (Hammond et al., 2009). The genotypeswith greater REP indexes produced more biomass under low Pi,which indicates that DM under low Pi is a good parameter forstudies on P efficiency, which was also observed by Ozturk et al.
Frontiers in Plant Science | www.frontiersin.org 6 March 2016 | Volume 7 | Article 408
(NER) and non-efficient non-responsive (NENR) defined in Figure 2.
Cultivars Dry mass (g plant−1) REP (%) APE
Low Pi High Pi (g DM g−1 Pi)
ER
E 16 Shoa 30.25 55.39 55 24.94
E 22 Sidamo 30.12 53.45 56 23.15
Iemen 31.62 53.37 59 21.58
Acaiá 31.02 51.84 60 20.66
ENR
Tupi 29.49 49.30 60 19.65
Robusta 28.90 46.64 62 17.6
Caturra Vermelho 29.62 47.33 63 17.57
E 12 Harar 35.09 52.56 67 17.33
Bourbon Amarelo 32.65 49.22 66 16.43
Icatu Precoce 34.34 50.55 68 16.08
Catuaí Vermelho 29.20 44.38 66 15.05
Caturra Amarelo 30.81 44.23 70 13.31
Geisha 40.97 49.39 83 8.36
NER
Guarini 18.88 48.00 39 28.89
E 534 Kaffa 25.79 52.93 49 26.93
Bourbon Vermelho 24.58 51.62 48 26.83
Mundo Novo 27.56 54.48 51 26.71
Typica 25.22 51.73 49 26.29
Catuaí Amarelo 22.20 45.80 48 23.41
Jimma Tane 22.88 44.53 51 21.48
Apoatã 26.17 46.76 56 20.42
NENR
E 208 Illubabor 28.05 48.09 58 19.88
Ouro Verde 26.42 43.97 60 17.41
Bukobensis 27.56 43.84 63 16.14
Obatã 26.53 39.81 67 13.17
Average—Reference
values of Figure 2
28.64 19.28
REP was calculated as ([DMLow Pi/DMHigh Pi ] × 100). APE was calculated how
([DMHigh Pi – DMLow Pi ]/difference in total Pi availability between high Pi and low Pi
treatments). The data are average from five repetitions, for low Pi (8mg Pi dm-3 ) and
high Pi (120mg Pi dm-3 ).
(2005) in wheat genotypes. However, DM or grain production isnot sufficient for the understanding of processes that determinethe PUEs of plants or of the capacity of the plant to growproductively under low Pi availability.
Using the biomass response of plants to Pi availability,plants can be grouped into "efficient" and "inefficient" basedon the ability of cultivars to convert nutrients into dry matter(Vose, 1987). Furthermore, they may be grouped as “responsive”and “non-responsive” based on the plants biomass response tothe addition of the nutrient (Fageria and Baligar, 1993), withplants having above average APE values grouped as “responsive”and plants having below average APE values grouped as
“non-responsive” (Figure 2). Gerloff (1977) conducted the firststudy classifying plants into four groups in terms of efficiencyand response to nutrient supply: (i) efficient and responsive -plants that produce above average biomass at lower nutrientconcentrations and respond to nutrient addition; (ii) inefficientand responsive—plants that produce less than average biomassat lower nutrient concentrations but still respond to nutrientaddition; (iii) efficient and non-responsive—plants that produceabove average biomass at lower nutrient concentrations, but donot respond to the addition of nutrients; (iv) inefficient and non-responsive—plants that produce less than average biomass atlower nutrient concentrations, which do not respond to nutrientaddition. This is the first study to use these criteria to characterizecoffee cultivars for their efficient use of available Pi and responseto the addition of Pi. It clearly identifies four cultivars that areefficient and responsive to Pi supply, all of which are C. arabica.These varieties are most likely to perform well under low Piconditions and would provide useful genetic material in thebreeding of new varieties with improved PUE.
Among the DM parameters, the root DM showed a significantdifference between species. Plants of C. canephora have a longerroot system, in both conditions of P supply (Table 1), which mayexplain the increased P uptake efficiency in the genotypes of thisspecies (Table 5). This species has a more robust and vigorousroot system, the reason why it is often used as a graft for plantsof C. arabica. The evolution of C. canephora exposed to sunlightand in a region with an average temperature of 23◦C led togreater development of the root system to provide more waterfor transpiration to regulate leaf temperature. Another aspectthat reinforces this statement is the presence of twice as manystomata per square millimeter of leaf area in relation to cultivarsof C. arabica (Voltan et al., 1992). Phosphate movement throughthe soil to the root surface is governed by diffusion, rather thanmass flow. In low Pi soils, cultivars that have a larger root systemare more likely to intercept and acquire P, as occurred with thecultivars of C. canephora. This is also reflected in the significantpositive correlation between root to shoot ratio and abovegroundtissue P concentrations (Supplementary Table 4).
Low soil Pi availability resulted in a significant reductionof P concentration and content of the tissues studied. The Pconcentration in the roots, stem+branches, mature leaves andyoung leaves under low Pi were 40–60% lower when comparedto high Pi supply. The P content was 20–40% lower under low Piwhen compared to high Pi supply.
Cultivars of C. canephora showed higher P concentration intissues, in both Pi treatments (Table 2), which can be explainedby the greater efficiency of Pi uptake by C. canephora cultivarsunder both high and low Pi (Table 5). Of the total P accumulatedby cultivars of C. arabica under low Pi supply, 36% was in matureleaves, 26% in young leaves, 21% in stem+branches and 17% inthe roots. The total P accumulated in C. canephora under low Psupply was 43% in mature leaves, 20% in young leaves, 19% instem+branches and 18% in roots. While the young and growingtissues are the main sinks for P, mature leaves still contain asignificant proportion of P accumulated by coffee, with about40% of accumulated P, even under conditions of P deficiency.Bragança et al. (2008) observed P contents of 33% in stem+
Frontiers in Plant Science | www.frontiersin.org 7 March 2016 | Volume 7 | Article 408
Neto et al. Phosphorus Use Efficiency in Coffee Cultivars
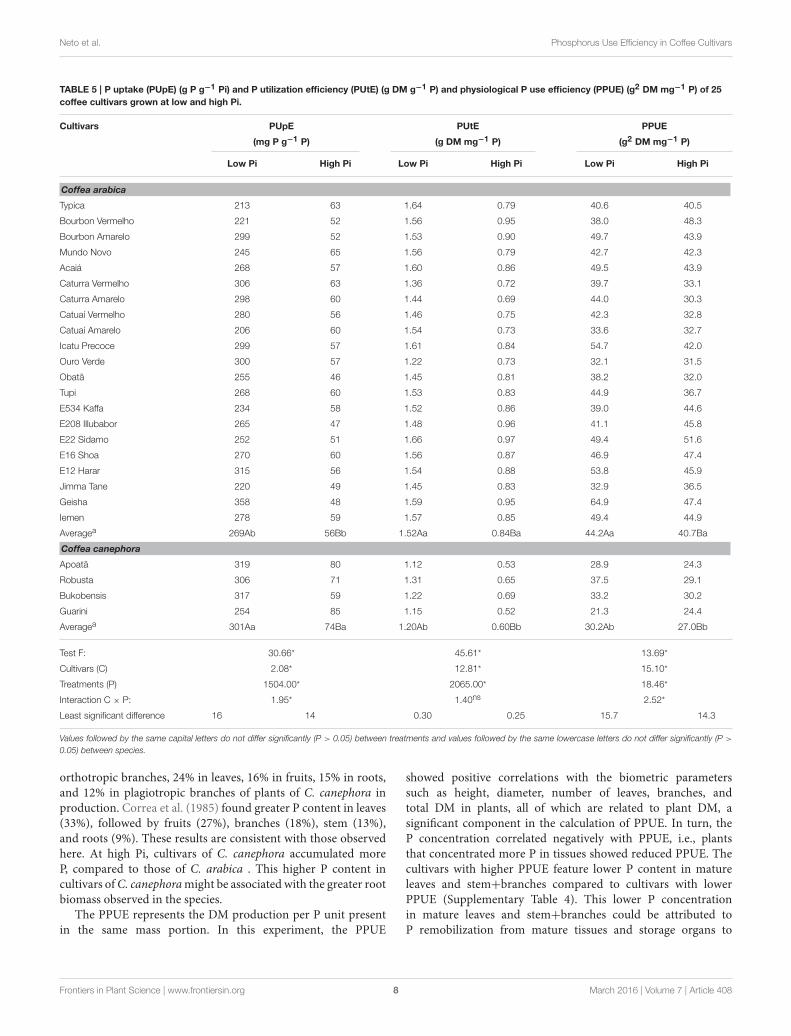
TABLE 5 | P uptake (PUpE) (g P g−1 Pi) and P utilization efficiency (PUtE) (g DM g−1 P) and physiological P use efficiency (PPUE) (g2 DM mg−1 P) of 25
coffee cultivars grown at low and high Pi.
Cultivars PUpE PUtE PPUE
(mg P g−1 P) (g DM mg−1 P) (g2 DM mg−1 P)
Low Pi High Pi Low Pi High Pi Low Pi High Pi
Coffea arabica
Typica 213 63 1.64 0.79 40.6 40.5
Bourbon Vermelho 221 52 1.56 0.95 38.0 48.3
Bourbon Amarelo 299 52 1.53 0.90 49.7 43.9
Mundo Novo 245 65 1.56 0.79 42.7 42.3
Acaiá 268 57 1.60 0.86 49.5 43.9
Caturra Vermelho 306 63 1.36 0.72 39.7 33.1
Caturra Amarelo 298 60 1.44 0.69 44.0 30.3
Catuaí Vermelho 280 56 1.46 0.75 42.3 32.8
Catuaí Amarelo 206 60 1.54 0.73 33.6 32.7
Icatu Precoce 299 57 1.61 0.84 54.7 42.0
Ouro Verde 300 57 1.22 0.73 32.1 31.5
Obatã 255 46 1.45 0.81 38.2 32.0
Tupi 268 60 1.53 0.83 44.9 36.7
E534 Kaffa 234 58 1.52 0.86 39.0 44.6
E208 Illubabor 265 47 1.48 0.96 41.1 45.8
E22 Sidamo 252 51 1.66 0.97 49.4 51.6
E16 Shoa 270 60 1.56 0.87 46.9 47.4
E12 Harar 315 56 1.54 0.88 53.8 45.9
Jimma Tane 220 49 1.45 0.83 32.9 36.5
Geisha 358 48 1.59 0.95 64.9 47.4
Iemen 278 59 1.57 0.85 49.4 44.9
Averagea 269Ab 56Bb 1.52Aa 0.84Ba 44.2Aa 40.7Ba
Coffea canephora
Apoatã 319 80 1.12 0.53 28.9 24.3
Robusta 306 71 1.31 0.65 37.5 29.1
Bukobensis 317 59 1.22 0.69 33.2 30.2
Guarini 254 85 1.15 0.52 21.3 24.4
Averagea 301Aa 74Ba 1.20Ab 0.60Bb 30.2Ab 27.0Bb
Test F: 30.66* 45.61* 13.69*
Cultivars (C) 2.08* 12.81* 15.10*
Treatments (P) 1504.00* 2065.00* 18.46*
Interaction C × P: 1.95* 1.40ns 2.52*
Least significant difference 16 14 0.30 0.25 15.7 14.3
Values followed by the same capital letters do not differ significantly (P > 0.05) between treatments and values followed by the same lowercase letters do not differ significantly (P >
0.05) between species.
orthotropic branches, 24% in leaves, 16% in fruits, 15% in roots,and 12% in plagiotropic branches of plants of C. canephora inproduction. Correa et al. (1985) found greater P content in leaves(33%), followed by fruits (27%), branches (18%), stem (13%),and roots (9%). These results are consistent with those observedhere. At high Pi, cultivars of C. canephora accumulated moreP, compared to those of C. arabica . This higher P content incultivars ofC. canephoramight be associated with the greater rootbiomass observed in the species.
The PPUE represents the DM production per P unit presentin the same mass portion. In this experiment, the PPUE
showed positive correlations with the biometric parameterssuch as height, diameter, number of leaves, branches, andtotal DM in plants, all of which are related to plant DM, asignificant component in the calculation of PPUE. In turn, theP concentration correlated negatively with PPUE, i.e., plantsthat concentrated more P in tissues showed reduced PPUE. Thecultivars with higher PPUE feature lower P content in matureleaves and stem+branches compared to cultivars with lowerPPUE (Supplementary Table 4). This lower P concentrationin mature leaves and stem+branches could be attributed toP remobilization from mature tissues and storage organs to
Frontiers in Plant Science | www.frontiersin.org 8 March 2016 | Volume 7 | Article 408
Neto et al. Phosphorus Use Efficiency in Coffee Cultivars
growing tissues, such as young leaves and roots or a consequenceof initial distribution during uptake. This requires furtherinvestigation and may provide an interesting trait for breedingnew cultivars with improved PPUE.
At low Pi supply, the cultivars Geisha, Icatu Precoce, and E12Harar had the highest PPUE and Guarani, Apoatã, Bukobensis,and Ouro Verde had the lowest PPUE. This classification isconsistent with the classification of Figure 2, which separates allthe cultivars by their efficient use of P and responsiveness toavailable Pi. In this case, the cultivars with higher PPUE werealso classified as efficient and had lower P concentrations instems + branches and mature leaves compared to cultivars withlower PPUE. The cultivars Obatã, Ouro Verde, and Bukobensis,classified as inefficient and unresponsive, had lower PUtE andPPUE. Cultivar Obatã still showed low PUpE in high Pi supply,which explains the low responsiveness to added Pi.
In summary, significant variation in PUE and its componenttraits was observed across a wide genepool of coffee cultivars.Significantly, at the species level, cultivars of C. canephorashowed higher PUpE compared to C. arabica and cultivars of C.arabica showed higher PUtE compared to C. canephora. Positivecorrelations between PUpE and root to shoot ratio were alsoobserved across all cultivars at low Pi supply, suggesting this orroot related traits are valuable targets for improving the PUpE ofcoffee in Pi limited soils. These data provide information aboutindividual cultivars and their suitability for growing under lowPi availabilities and identifies cultivars with contrasting PUE thatmay be suitable for use in breeding programs to improve thesetraits in new cultivars. The correlation between roots and PUpEsuggests an important role for roots in the acquisition of Pi
by coffee and requires further research to identify specific traitscontrolling this.
AUTHOR CONTRIBUTIONS
AN, JF and TT conceived and designed the experiments. ANand TT conducted experiments. AN, JH, TT, and JF contributedto the analysis and interpretation of the data. HC contributedto the statistical analysis of the data. AN, JF, JH, and TT wrotethe manuscript; all authors contributed to the discussion andapproved the final manuscript.
FUNDING
We acknowledge funding from São Paulo Research Foundation(FAPESP) Resource for Project Execution Grant number2010/11744-2 and Scholarship Grant number 2010/11745-9.
ACKNOWLEDGMENTS
The authors thank Dr. Oliveiro Guerreiro Filho, from InstitutoAgronômico de Campinas - IAC for the provision of geneticmaterials. São Paulo Research Foundation - FAPESP for grantingof scholarship and funding for the accomplishment of the project.
SUPPLEMENTARY MATERIAL
The Supplementary Material for this article can be foundonline at: http://journal.frontiersin.org/article/10.3389/fpls.2016.00408
REFERENCES
Amaral, J. F. T., Martinez, H. E. P., Laviola, B. G., Filho, E. I. F., and Cruz, C. D.
(2011). Nutrients use efficiency by coffee cultivars. Ciênc. Rural 41, 621–629.
doi: 10.1590/S0103-84782011005000027
Bolland, M. D. A., and Gilkes, R. J. (1998). “The chemistry and agronomic
effectiveness of phosphate fertilizers,” in Nutrient Use in Crop Production, ed
Z. Rengel (New York, NY: The Haworth Press), 139–163.
Bragança, S. M., Martinez, H. E. P., Leite, H. G., Santos, L. P., Sediyama, C. S.,
Victor, H. A. V., et al. (2008). Accumulation of Macronutrients for the Conilon
Coffee Tree. J. Plant Nutr. 31, 103–120. doi: 10.1080/01904160701741990
Cordell, D., Drangert, J. O., and White, S. (2009). The story of phosphorus: global
food security and food for thought. Global Environ. Chang. 19, 292–305. doi:
10.1016/j.gloenvcha.2008.10.009
Correa, J. B., Garcia, A. W. R., and Costa, P. C. (1985). “Extração de nutrientes
pelo cafeeiro Mundo Novo e Catuaí,” in Proceedings XII Congresso Brasileiro De
Pesquisas Cafeeiras (Caxambú), 35–41.
Fageria, N. K., and Baligar, V. C. (1993). “Screening crop genotypes for mineral
stresses,” in Proceedings Workshop on Adaptation of Plants to Soil Stresses